
Abstract
Crop diversity is crucial for producing more food and nutrition in the crowded planet and achieving agricultural sustainable development, and thus it is a hot topic in shaping policies aimed at ensuring food security. Many studies have revealed that enhanced crop diversity can benefit crop productivity. However, research on how to maintain a relatively high crop diversity at regional and national scales remains limited. This study attempts to examine the underlying mechanisms of crop diversity changes in China and eventually answer why China can maintain a high crop diversity from the spatial-temporal perspective. To achieve this end, the county level crop area dataset for the period of 1980–2014 was compiled and used to quantify the spatiotemporal dynamics of crop diversity in China. The result reveals that the China’s crop diversity trended upward over past 35 years, evidenced by more than 7 major crops at national level and 4 major crops at county level having undergone massive planting process to maintain a high crop diversity. Spatially, the crop diversity increased in more than two-thirds of the counties, and its hotspots moved gradually to the south-west mountainous area. The natural factor of slope and the social factor of population density contributed to shape the crop diversity pattern in global effects. In contrast, the irrigation degree, elevation of cropland, mean annual temperature and precipitation affected the spatially non-stationary distribution of crop diversity at the local level. On the whole, the maintenance of a higher crop diversity in China not only was limited by natural conditions, but also subject to adopt the multi-cropping systems strategic choice for the country to agricultural conditions. We argued that crop diversity can be an indicator to draw agricultural zoning, and increasing crop diversity should be recognized as a policy tool to implement agricultural sustainable development strategy.
I Introduction
How to produce more food and nutrition in a crowded planet utilizing the limited cropland has become a great challenge to humans (Pretty and Bharucha, 2014). More and more worldwide strategies have concentrated on increasing crop diversity to counter food supply security and eradicate poverty in recent years (Isbell et al., 2021; Renard and Tilman, 2019) because crop diversification maintains food supplies to combat hunger, malnutrition and overnutrition (Massawe et al., 2016). Increasing crop diversity in agricultural production systems is also essential to balance nutrition, increase resilience to climate extremes and reduce environmental degradation (Jarvis et al., 2008; Matsushita et al., 2016). As the key component of biodiversity (Donfouet et al., 2017), crop diversity is critical for promoting sustainable food production and intensive cropland use (Tilman et al., 2011; Song et al., 2021), which is an excellent indicator to illuminate the agroecosystem sustainable development (Tamburini et al., 2020). Maintaining high crop diversity in agroecosystems has become a very promising strategy for more sustainable land management and more effective effects to enhance yields, biodiversity and ecosystem services (Beillouin et al., 2021). It is thus important to comprehensively understand the mechanism of spatial and temporal dynamics in crop diversity because they are key to agricultural policy-making as well as achieving the agricultural sustainable development.
Many studies have focused on evaluating the crop diversity changes at landscape, regional and national levels (Deng et al., 2017; Khoury et al., 2014; Renard and Tilman, 2019). Field experiments indicate that the enhanced crop diversity can increase crop productivity and stability on the landscape level (Davis et al., 2012; Li et al., 2009; Parker et al., 2016) while reduce risks associated with increased climatic variability (Gaudin et al., 2015). At the national level, the higher crop diversity will enhance the functioning of agroecosystems and the services they provide (Hajjar et al., 2008), which contributes to stable food supplies (Renard and Tilman, 2019). The changes in crop diversity in the U.S. illustrated that it decreased during past 40 years at national scale and the clustering and loss of crop diversity has been exacerbated in county (Aguilar et al., 2015). Crop diversity usually conflicts with crop specialization in space and over time. Sustained crop specialization inevitably decreases crop diversity (Song et al., 2021). Many countries narrow the crop diversity to harvest more staple food (Khoury et al., 2014; Sundström et al., 2014; Kleemann et al., 2017). The global crop diversity decreased by 75% over the past century owing to the increasing tendency to concentrate on only a few crops and the commercialization of agriculture (FAO, 2010). Diets in developing countries are becoming increasingly similar to those in developed countries, characterized by a shift away from local staple foods to such energy-intensive foods as animal products, vegetable oils and sugars (Kearney, 2010; Khoury et al., 2014). These shifts change cropland use and this in turn impacts the spatial distribution of crop diversity (Massawe et al., 2016). So far, although some studies have concerned the changes of crop diversity, few have examined the drivers and mechanisms of such changes (Aguilar et al., 2015; Liu et al., 2018). Given the advancement in agricultural specialization can contribute to the decrease in crop diversity globally (Prabhu, 2012), it becomes crucial for investigating the spatial heterogeneity of crop diversity in different geographical areas. China’s agricultural food system feeds 22% of the world’s population, and consists of a wide variety of crops, however, the mechanisms responsible for the spatial distribution of changes in crop diversity have not yet been explored.
Different crop species grown in a geographical area are important for detecting the cropping system forms and land use changes, and quantifying the agricultural policy effects that orients farmer decision-making, further contextualized by social, political, economic and environmental factors (Newbold et al., 2015; Palmua et al., 2014). Previous studies focused on the benefits of crop diversity such as stable food production, the resilience of the cropping systems to climate change and the enhanced key ecosystem services from agroecosystems (Deng et al., 2017; Khoury et al., 2014; Matsushita et al., 2016; McDaniel et al., 2014; Sirami et al., 2019). However, few studies have attempted to identify the drivers and the mechanisms of spatiotemporal patterns of crop diversity. Many factors may affect crop diversity, including a combination of agricultural resources, technology, investments by stakeholders and prices (Hijmans et al., 2016; Smith et al., 2019). Among these factors, agricultural policies and marketing forces are the two major driver forces leading to changes in crop diversity (Song et al., 2021). However, research on this specific issue remain unclear. For example, how crop diversity change is controlled by policies, market or the combined effects of natural conditions at different scales still not well revealed. Research on the maintained mechanism of crop diversity contributes to our understanding of cropping systems, and such understanding allows us to better devise cropping systems to adapt to a hotter and drier climate and more frequent extreme weather events in the future. The influence of the drivers of variation in crops and the mechanisms through which these drivers change cropping systems and crop diversity are manifested by the differences in spatial distribution of cropping patterns. Ignoring these drivers is likely to result in poor choices of crops and the area to be allotted to different crops by famers and policymakers (Yu et al., 2017).
Multi-cropping systems are widely adopted in China. Farmers have created various types of cropping systems over a long period of natural and artificial selection, and the complex and diverse cropping patterns and cropping systems have ensured that agriculture continues to be sustainable (Zuo et al., 2018). For example, 1-year wheat–maize or wheat–rice rotations in the North China plains and double-rice in southern China became increasingly popular (Liu et al., 2018). Unlike other countries, China has always been paying attention to the diversification of crops. However, is China’s crop diversity pattern consistent with global or other countries’ trends? Why China can maintain a spatial pattern of high crop diversity has not yet been answered (Wu et al., 2011). This study seeks to reveal the spatiotemporal changes of crop diversity in China, and explain the anthropogenic and natural driving forces on the spatial heterogeneity of crop diversity.
II Data and methods
1 Data sources
The crop planting area at the county level for the period of 1980–2014 were obtained from the Ministry of Agriculture and Rural Affairs of China, and used to quantify the crop diversity. Due to changes in administrative boundaries, we organized the country into 2341 counties based on the vector maps of basic geographical information (The National Catalogue Service for Geographic Information, http://www.webmap.cn/). Then, we arranged 38 crop species into 11 crops or groups of crops: rice, wheat, maize (corn), beans, potatoes, oil-yielding crops, fibre crops, sugar, cotton, vegetables and fruits (see supplementary material for the complete list of the 38 species).
The following datasets were used to obtain the driving factors of crop diversity distribution and boundary in this study. The 1 km pixel resolution of DEM maps were downloaded from The National Earth System Science Data Centre (http://www.geodata.cn/). The elevation and slope of each county were extracted from the DEM and masked by cropland distribution data, which themselves were extracted from the LULC map of 2015 with 30m resolution from The National Earth System Science Data Centre. Road density data in kilometre per square kilometres were ascertained and extracted from the national transportation map from the OpenStreetMap (www.openstreetmap.org). The population density is derived from the sixth population census from the National Bureau of Statistics (http://www.stats.gov.cn/ztjc/zdtjgz/zgrkpc/dlcrkpc/). The irrigation data were calculated as the proportion of irrigated area to the total harvested area for each county, which was obtained from the National data in National Bureau of Statistics (https://data.stats.gov.cn). The climate data, including temperature and precipitation, were obtained from the National Meteorological Information Centre (http://data.cma.cn/). We calculated the average annual precipitation and temperature in each county during 1980–2014. The cropping region data were obtained from agricultural regional map published in 1983. The slope and elevation of cropland as well as mean annual precipitation temperature were used to reflect the impact of natural condition on crop diversity. The population density represented the labour aspect of socio-economic condition and the irrigated proportion reflected the water utilization of cropland in socio-economic policy. The road density is used to calculate the impact of accessibility aspect of socio-economic condition on crop diversity.
2 Crop diversity index
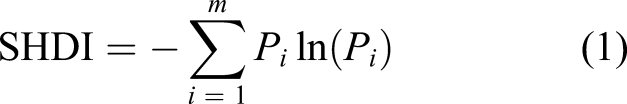
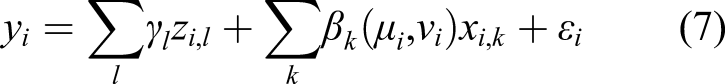
The crop diversity index is designed to capture the richness of crops. Richness refers to the number of different crops in a given area: the greater the number is, the higher the diversity is (Aguilar et al., 2015; Duflot et al., 2015; Zhou et al., 2014). In ecology, the Shannon’s index is used for showing the variance in the distribution of species abundance. This study adopted it to show variance in the proportion of area covered by each crop. The Shannon diversity index (SHDI) is expressed as

3 Spatial and statistical analysis
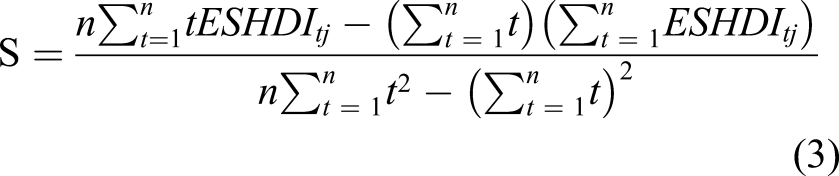
The least square regression was used to quantify the trends in crop diversity. A negative slope coefficient (S) indicated a decrease in crop diversity and a positive coefficient indicated an increase (at p < 0.05). The slope was calculated as follows
To analyse whether crop diversity agglomerates in space or not, the hot-spot statistical analysis is used to identify areas with statistically significant clustering. In this study, the Getis–Ord local statistic was employed to detect the hot/cold spots of crop diversity and their distribution, the formula is as follows
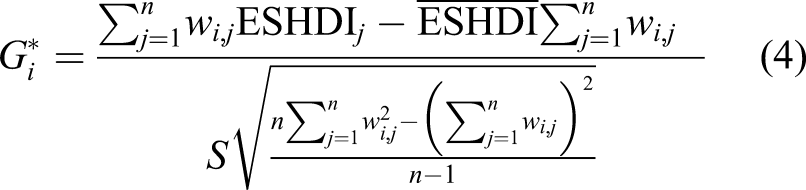

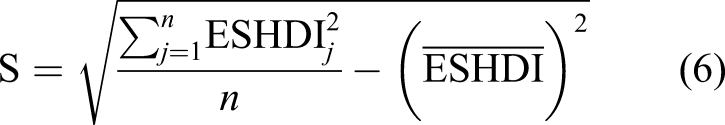
The
4 Semiparametric geographically weight regression analysis
The Semiparametric geographically weight regression (SGWR) is an improvement of geographically weight regression and can generate local parameters to reflect spatial heterogeneity of derived statistics, including local R
2
, local model residuals and local coefficients (Gao and Li, 2011). Because the adjusted R2, coefficient and residuals for each county from SGWR express the fitting effect at different locations, the complex spatial heterogeneity of crop diversity can be identified, mapped and simulated as follows
III Results
1 Trends in crop diversity
China’s farming maintains a high crop diversity during the past 35 years. The crop diversity index averages 7.39 with SD of 0.97, indicating that at least 7 major crops have undergone massive planting process. The highest crop diversity (8.64) occurred in 2002 and the lowest (4.79) in 1986. When averaged for the whole country, crop diversity showed an overall increasing trend by a rate of 0.07/yr during 1980–2014 (defined as the period P0). However, the overall trend consists of downward and upward trends at the shorter-temporal scale. In specific, the crop diversity decreased by a rate of 0.36/yr before 1986 (defined as the period P1) and then it increased by a rate of 0.087/yr till 2003 (defined as the period P2), after which it decreased by a rate of 0.065/yr (defined as the period P3) (Figure 1(a)). Moreover, only the North-east and North Plateau region have a significant negative trend in crop diversity, and the Huang-Huai-Hai region has a nonsignificant negative trend. Meanwhile, the rest of other cropping regions experienced significant positive trends during past 35 years (Figure 1(b)–(k)). The variation and trend of crop diversity during 1980–2014.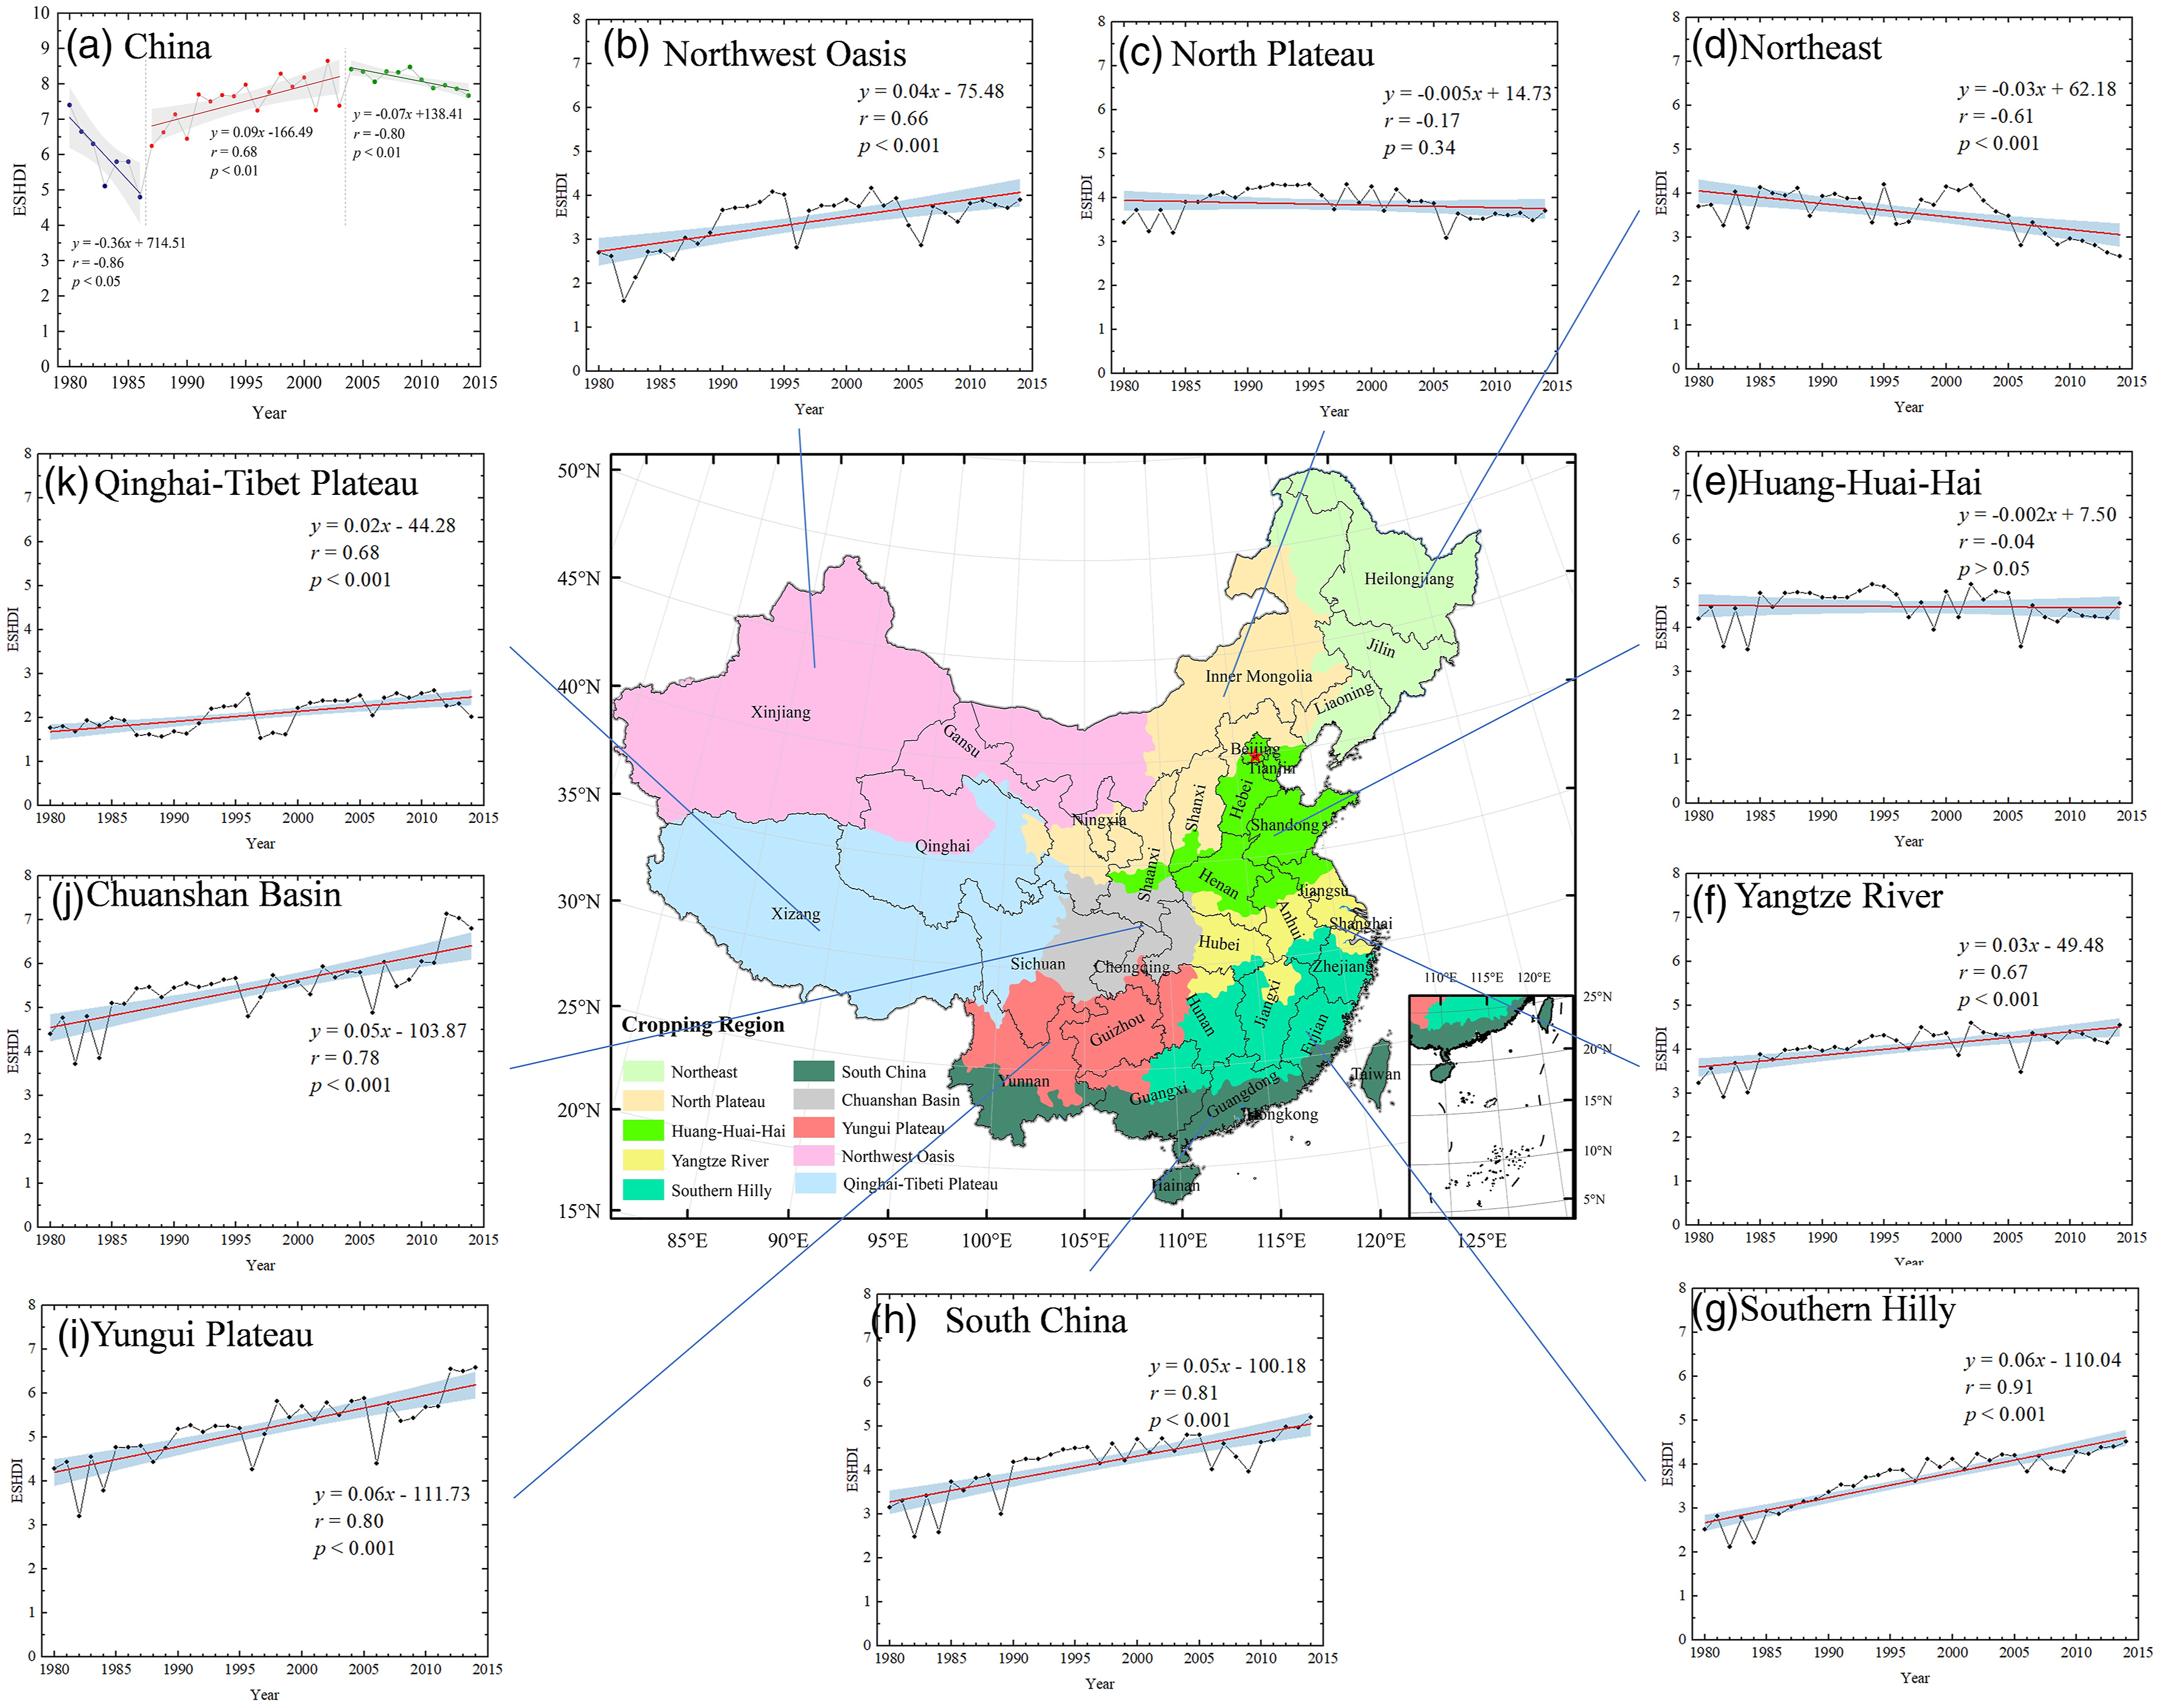
To compare the variation of crop diversity trend, the spatial distribution of crop diversity changing slope that differs among the periods in each county is shown in Figure 2. Generally speaking, crop diversity increased in more than two-thirds of the counties during 1980–2014. Spatially, the crop diversity increased significantly in the south but decreased significantly in the north of China (Figure 2). The counties showed increase in crop diversity accounted for 69.24%, of which 51.13% have a significant (p < 0.05) trend and are distributed mainly in southern China; The counties with significant negative trend accounted for 30.76%, 16.7% of which has a significant decreasing trend (p < 0.05), and are mainly distributed in north-eastern China and in the North China Plain where maize and wheat are dominated. Specifically, the variation in crop diversity trend varied over space and time. In the period from 1980 to 1986, 23.96% of positive counties had significant (p < 0.05) trend and they are mainly distributed in southern China. In contrast, only 9.69% of negative counties have significant trends and they are mainly scattered in Henan and Shaanxi province. During 1987–2003, 34.47% of counties showed a significant (p < 0.05) increasing trend and these counties are mainly distributed in Yunnan and Guangxi provinces located in Southern China as well as the Gansu and Xinjiang province in North-western China. In contrast, 12.77% of counties showed a significant (p < 0.05) decreasing trend and these counties are mainly located in the northern China. During 2004–2014, the counties with significant positive trends accounted for 31.27% and those with significant negative trends accounted for 24.78% of the total numbers of counties in China (Figure 2). The spatial pattern of crop diversity trends during each period.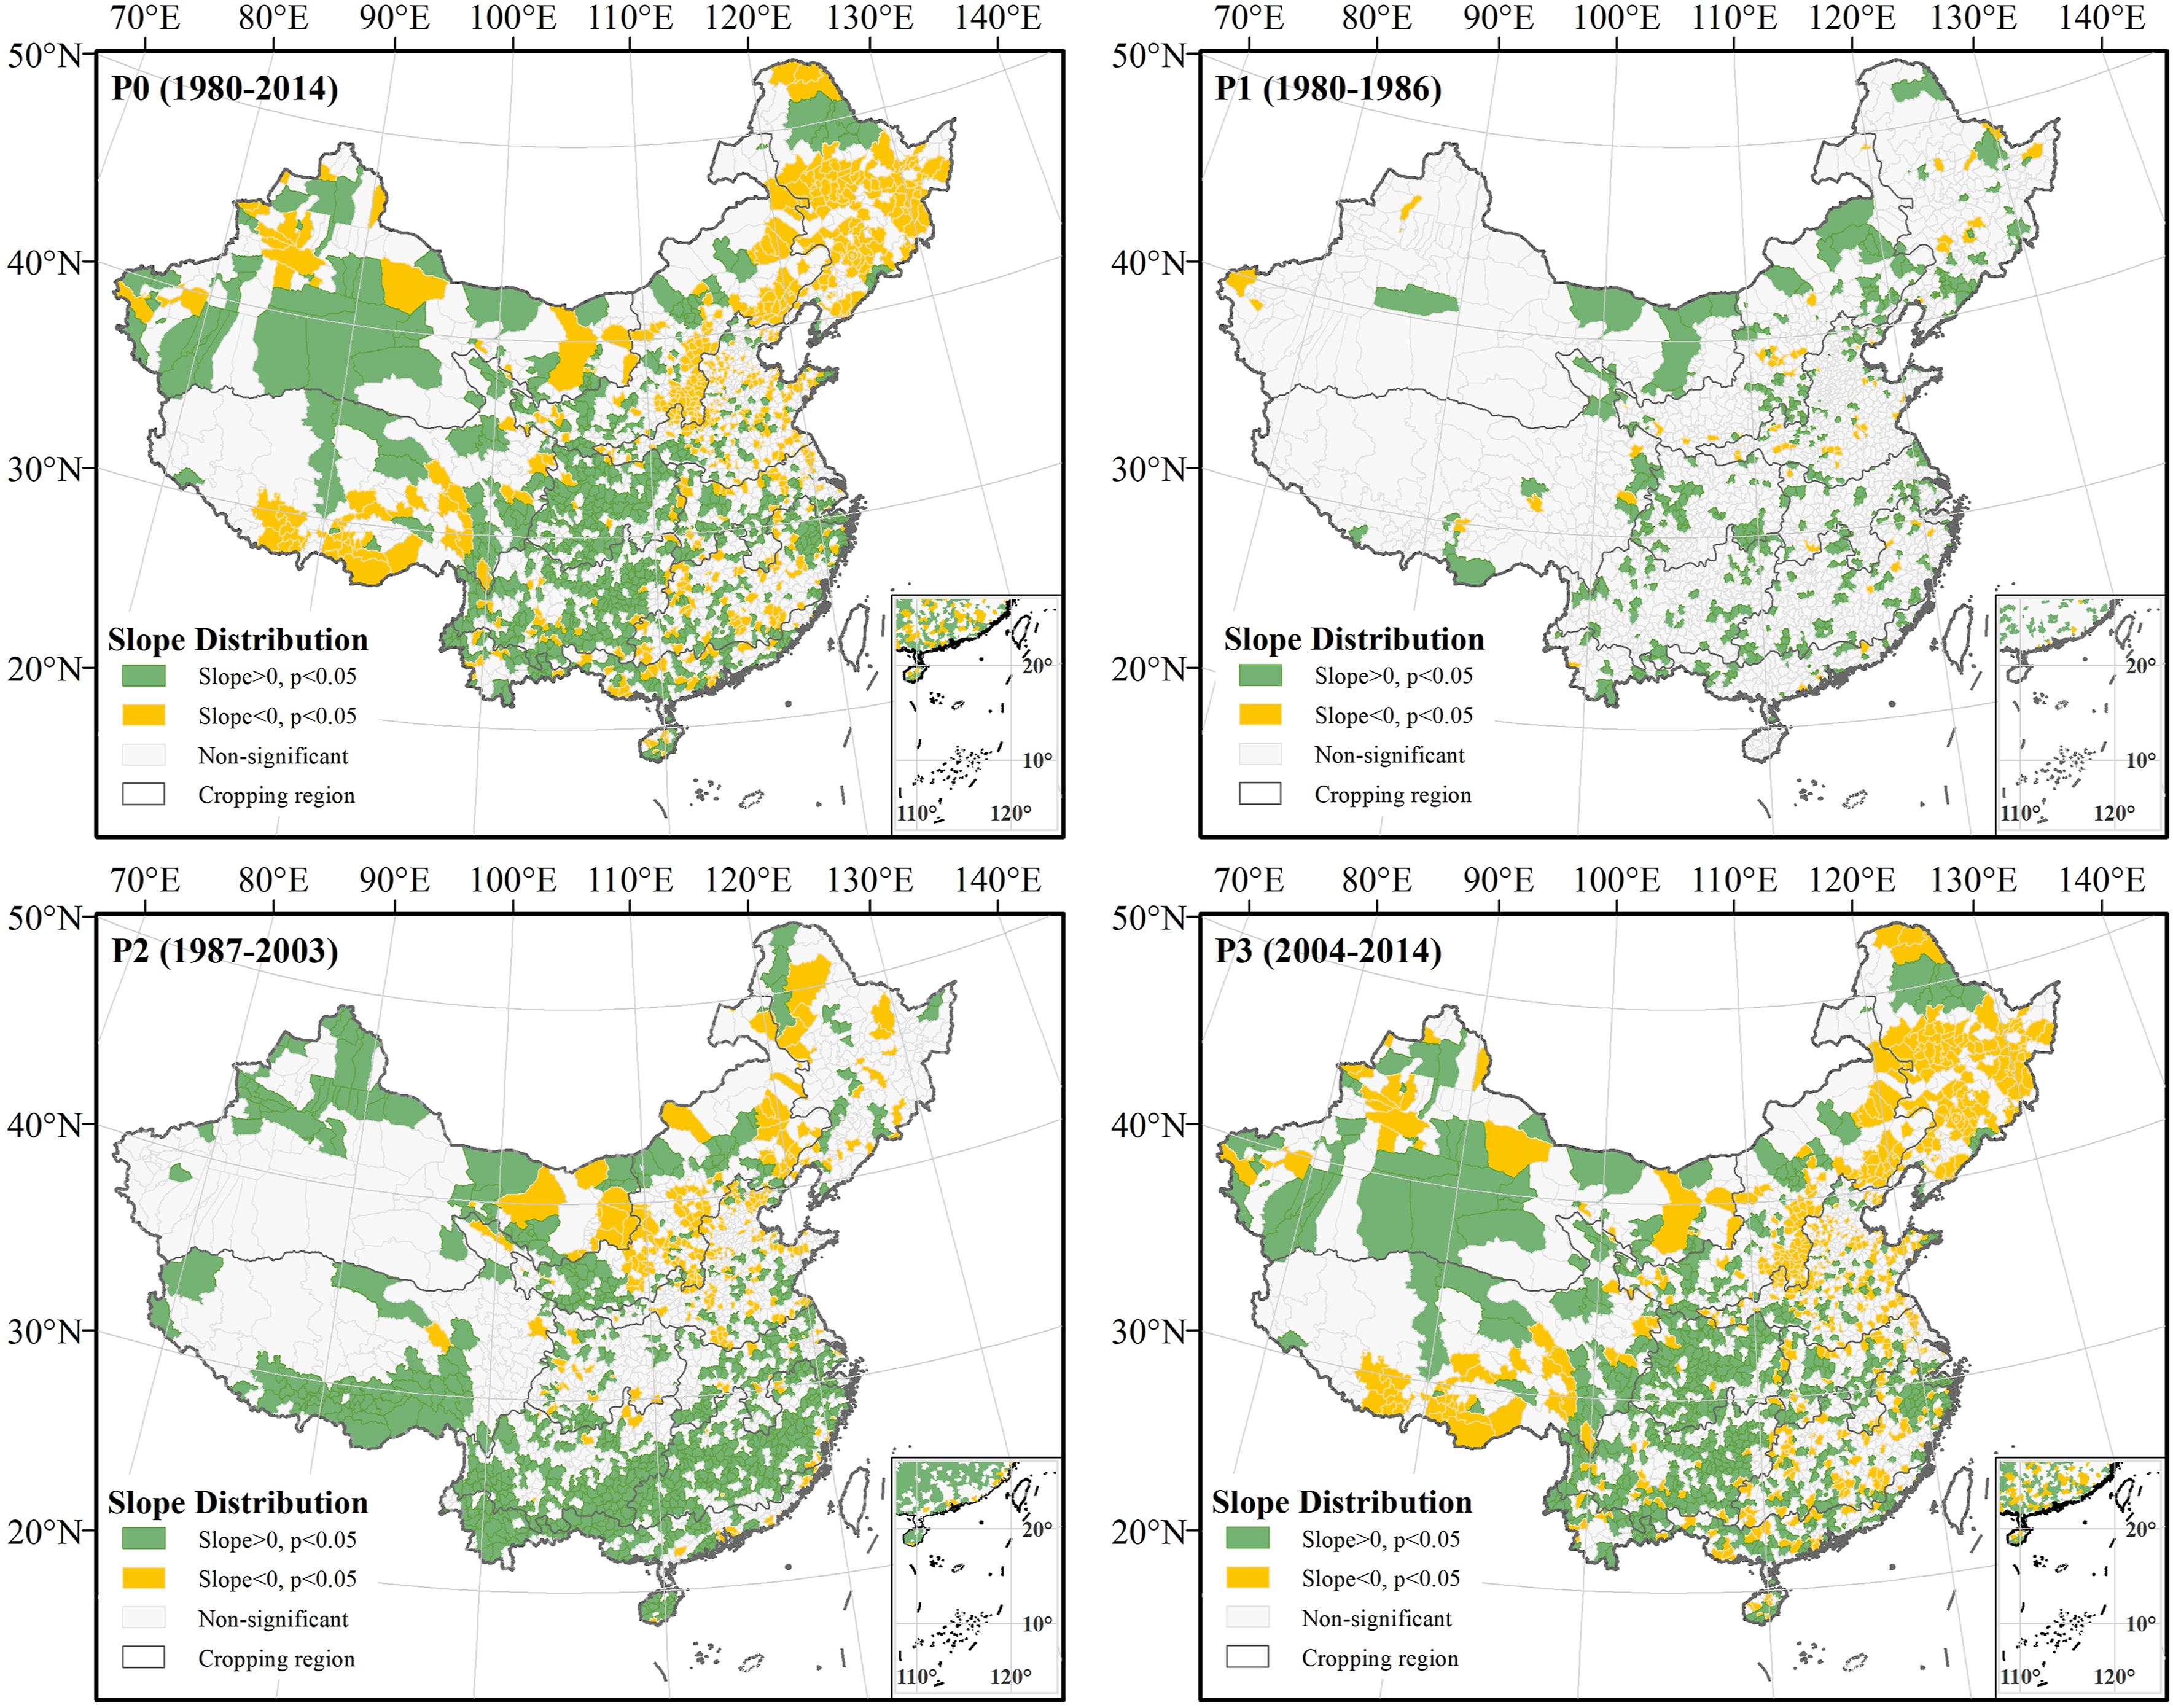
2 Spatial pattern of crop diversity
To illustrate the spatial dynamics of crop diversity during the past 35 years, a visually image of annual crop diversity was created (See the Figure S1). And each period of average crop diversity was also mapped (Figure 3). Generally, crop diversity in China exhibited distinct spatial variation at the county scale. It is higher in hilly and mountainous areas and lower in the plains and the Tibet-Qinghai Plateau. The mean crop diversity at the county level were 4.10 ± 1.08 in the period of P0, 3.47 ± 1.16 in the period of P1, 4.22 ± 1.14 in the period of P2 and 4.26 ± 1.32 in the period of P3, respectively. The average crop diversity at the county level is lower than the corresponding value at the national level. It also reveals that most of counties in China has a complex cropping system to maintain a high crop diversity. Spatially, the crop diversity is found to be relatively high in a zone extending from north-east to south-west in China, and this zone covers 14 provinces during the period of 1980–2014 (Figure 3(a)). The spatial distribution of crop diversity partly is attributable to the crop specialization, mostly of rice, maize, wheat, or soybean in northern China and partly because the southern China has a reflection of flexible cropping patterns, where farmers have a wider choice of crops through crop rotations and multiple cropping on smaller holdings. The Spatial pattern of average crop diversity during each period.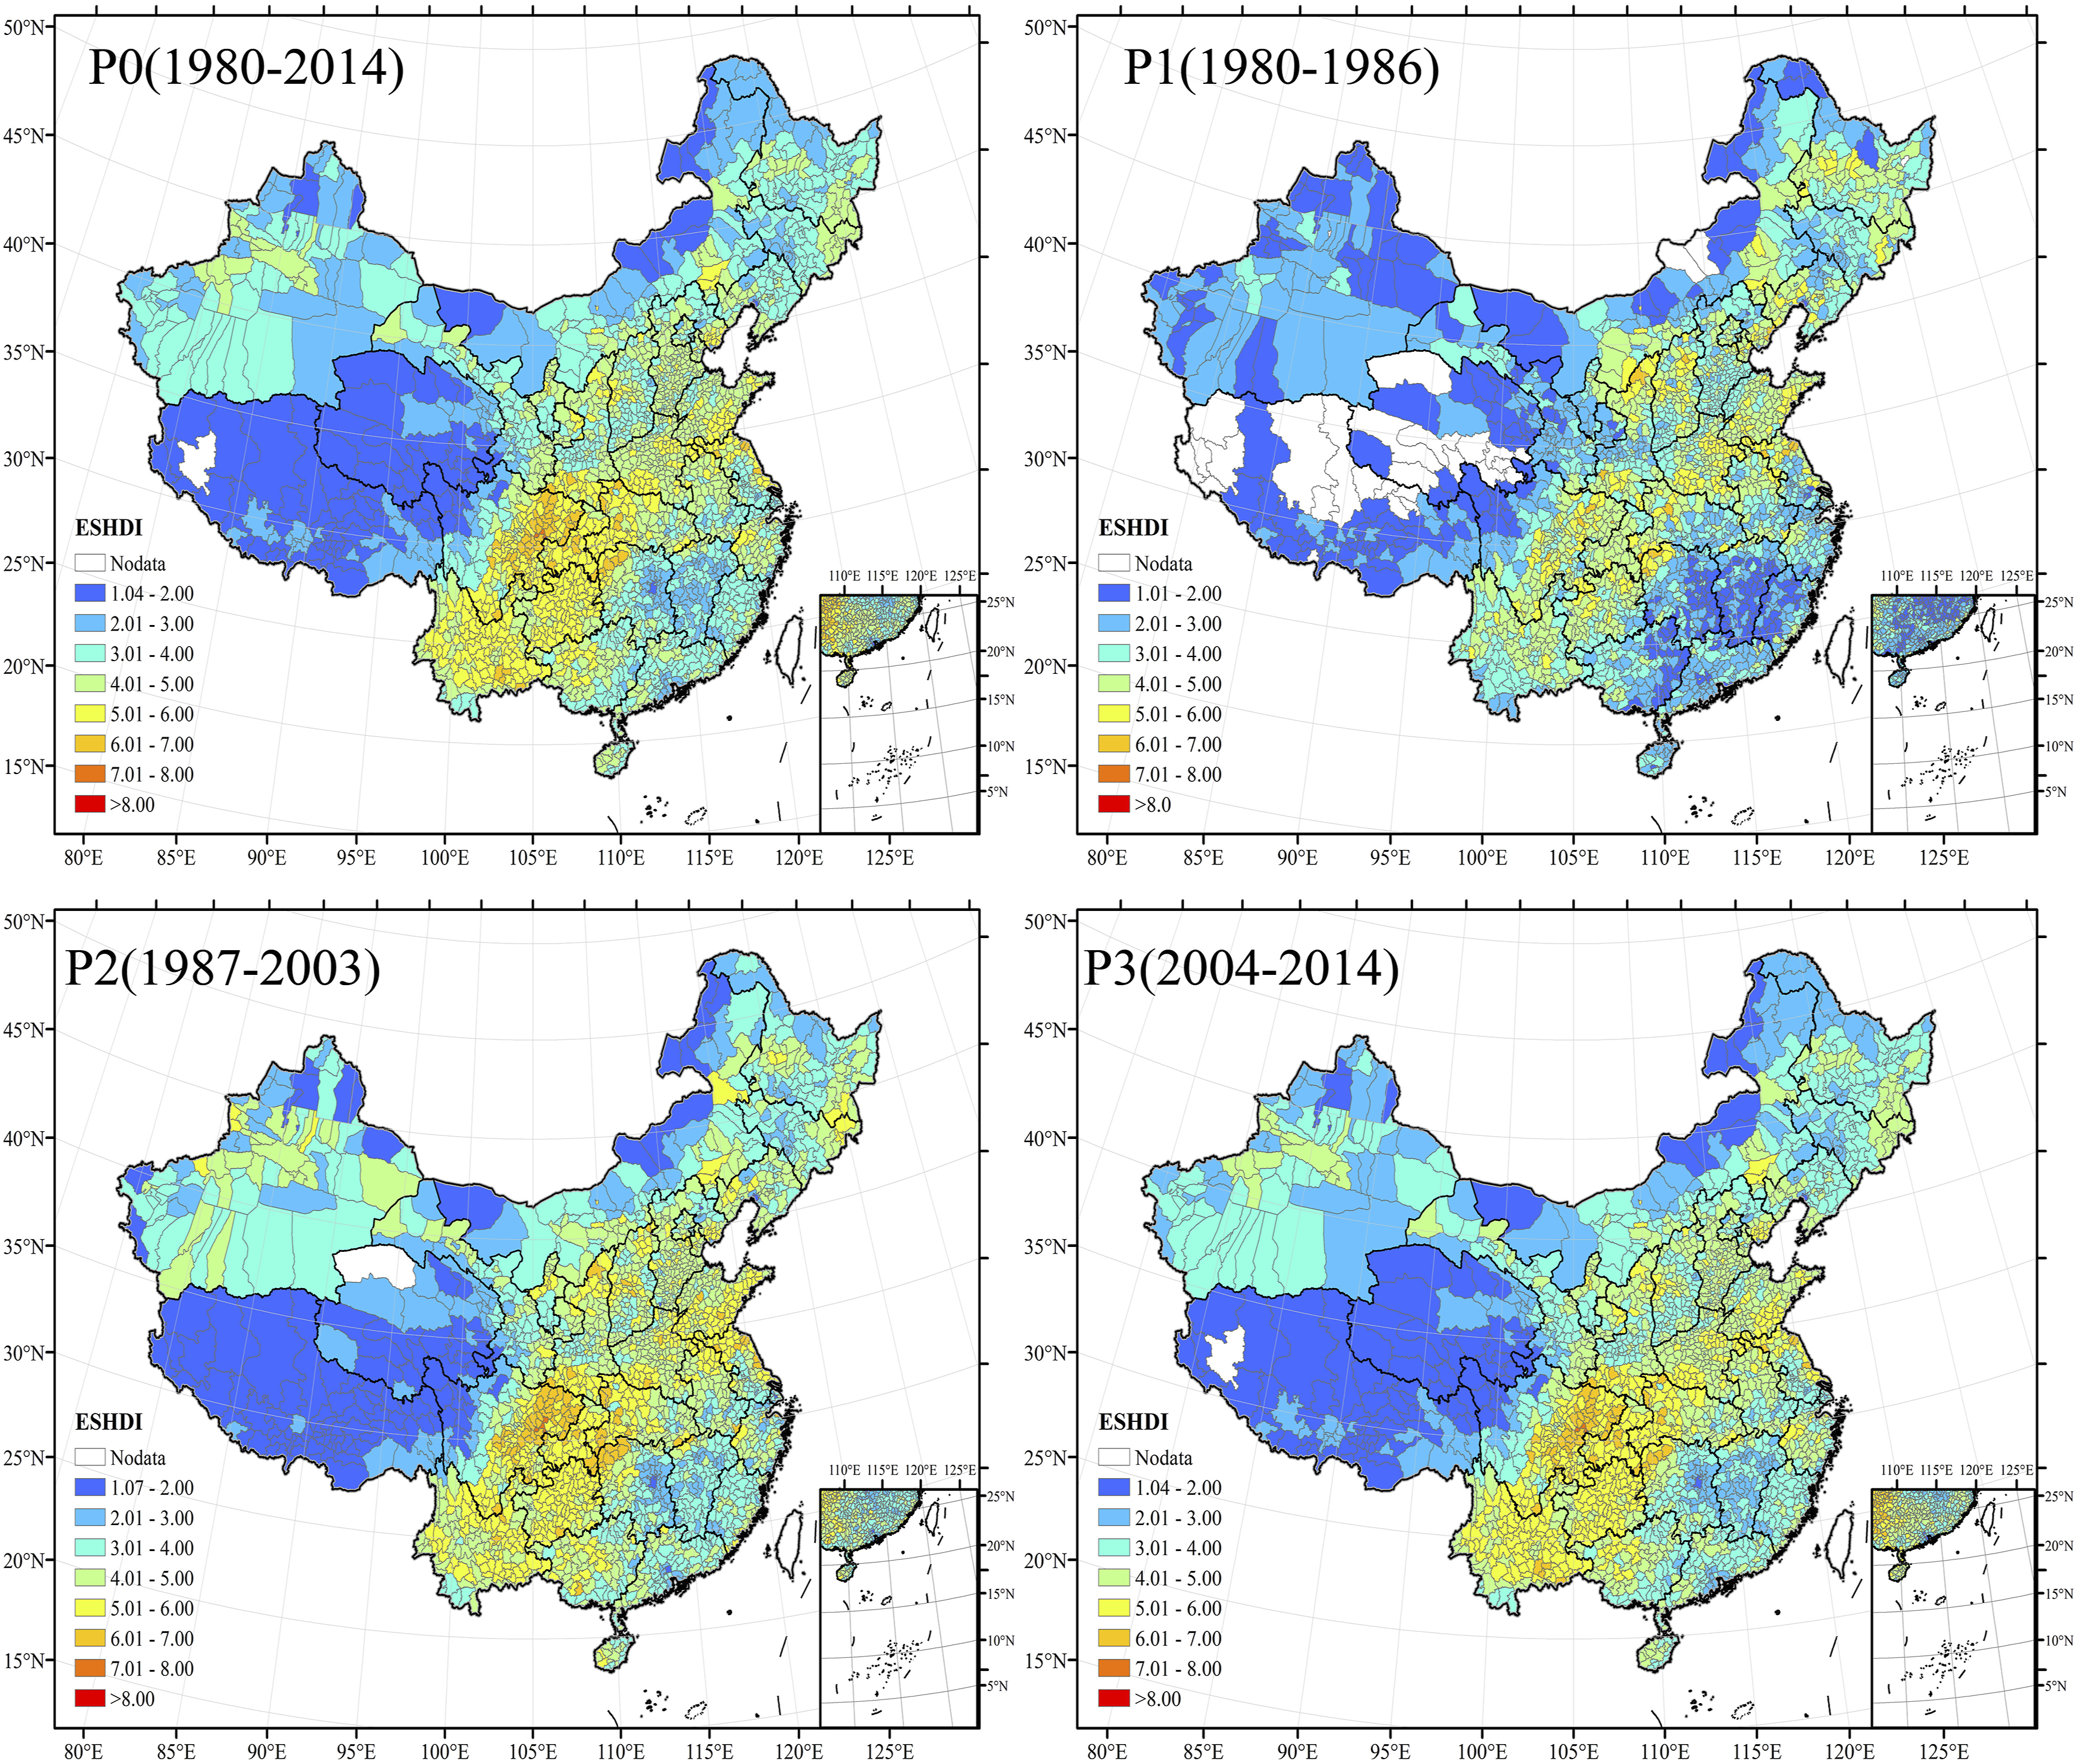
In more details, over half of counties in China has a high crop diversity value greater than 4 during past 35 years, indicating that Chinese farming system maintains a relative complex diversity to harvest more food. The crop diversity index higher than 4 occurred in 837 counites and these counties are mainly distributed in a zone extending from North-east to South-west, covering Heilongjiang, Liaoning, Shandong, Shanxi, Shaanxi, Henan, Hubei, Sichuan, Chongqing, Guizhou and Yunnan province of China in the period of P1. The maximum crop diversity occurred in the Loess plateau region and in mountain region of South-west China (Figure 3). In the period of P2, the mean crop diversity index is significantly higher than that in the period P1. The crop diversity index beyond 4 has 1434 counites and these counties are mainly distributed from the Mountain areas of Hebei and Shandong to Yunnan (Figure 3). In the period of P3, the mean crop diversity index is slightly lower than that in the period of P2. However, the crop diversity index higher than 4 has 1328 counites. The decreased diversity counties are mainly distributed in the three provinces of North-east China, the Loess plateau region of Shaanxi and Shanxi and some urban agglomerate region such as the Yangtze River Delta and the Pearl River Delta (Figure 3).
To show the spatial cluster dynamics of crop diversity during the past 35 years, a visually image of annual hot and cold-spot regions of crop diversity was mapped (See the Figure S2). The identification of the hot and cold spots of crop diversity in China during different periods were also mapped. The results show that the hotspots of crop diversity gradually moved to the south-west mountainous area (Figure 4). Spatially, the whole China can be divided into three parts, consisting of one hot-spot and two cold-spot regions. The hot-spot region extends from the north-east to the south-west and comprises 16 provinces. The two cold-spot regions with low crop diversity consist of four north-western provinces and six south-eastern provinces (Figure 4). The hot spots are mainly distributed in a zone extending from the north-east to the south-west of China during the P1 period (Figure 4). Then, the zone with high hot-spot value retreated gradually toward the southwestern China during the P3 period, in which the dominant crops are rice (Figure 4). Overall, the number of hot-spot counties showed a significant downward trend, and decreased from 52.54% during the P1 period to 31.70%during the P3 period. In contrast, the number of cold-spot counties showed an upward trend, and increased from 34.22% to 40.75% (Figure 4). Hot and cold spots of annual crop diversity in China during each period.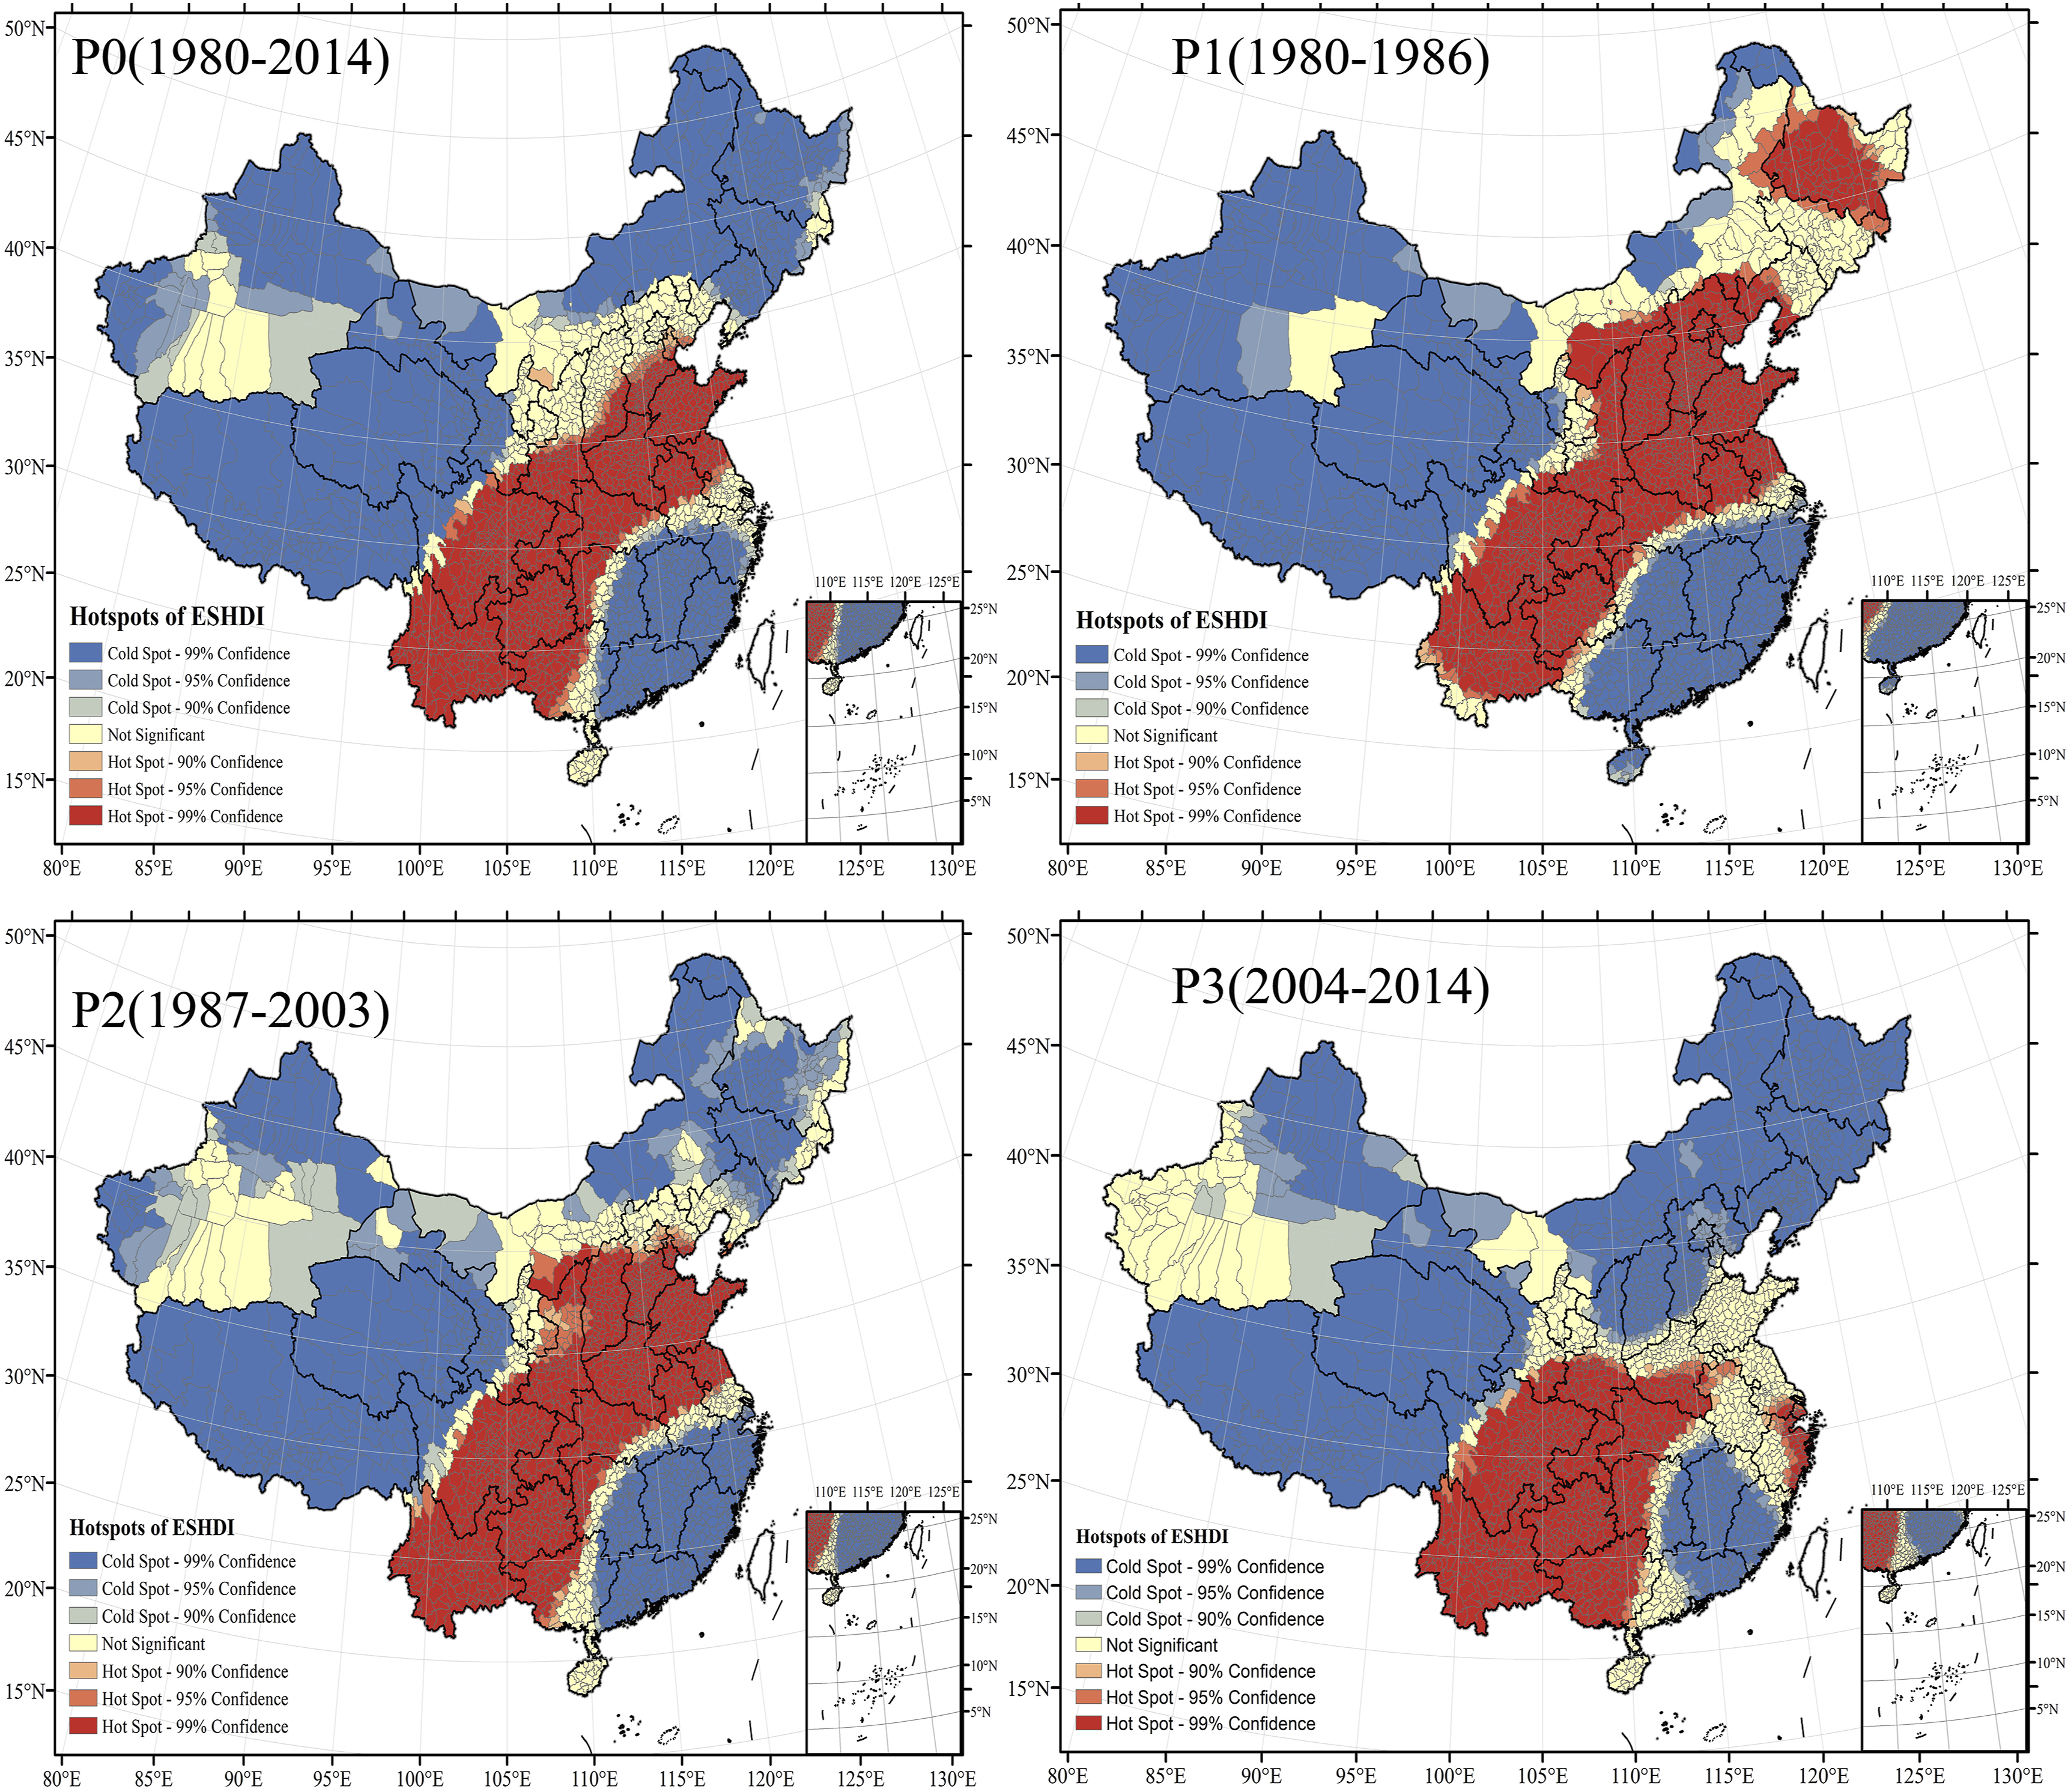
3 Driving forces for crop diversity
Estimated global and local coefficients by the semiparametric geographically weight regression.
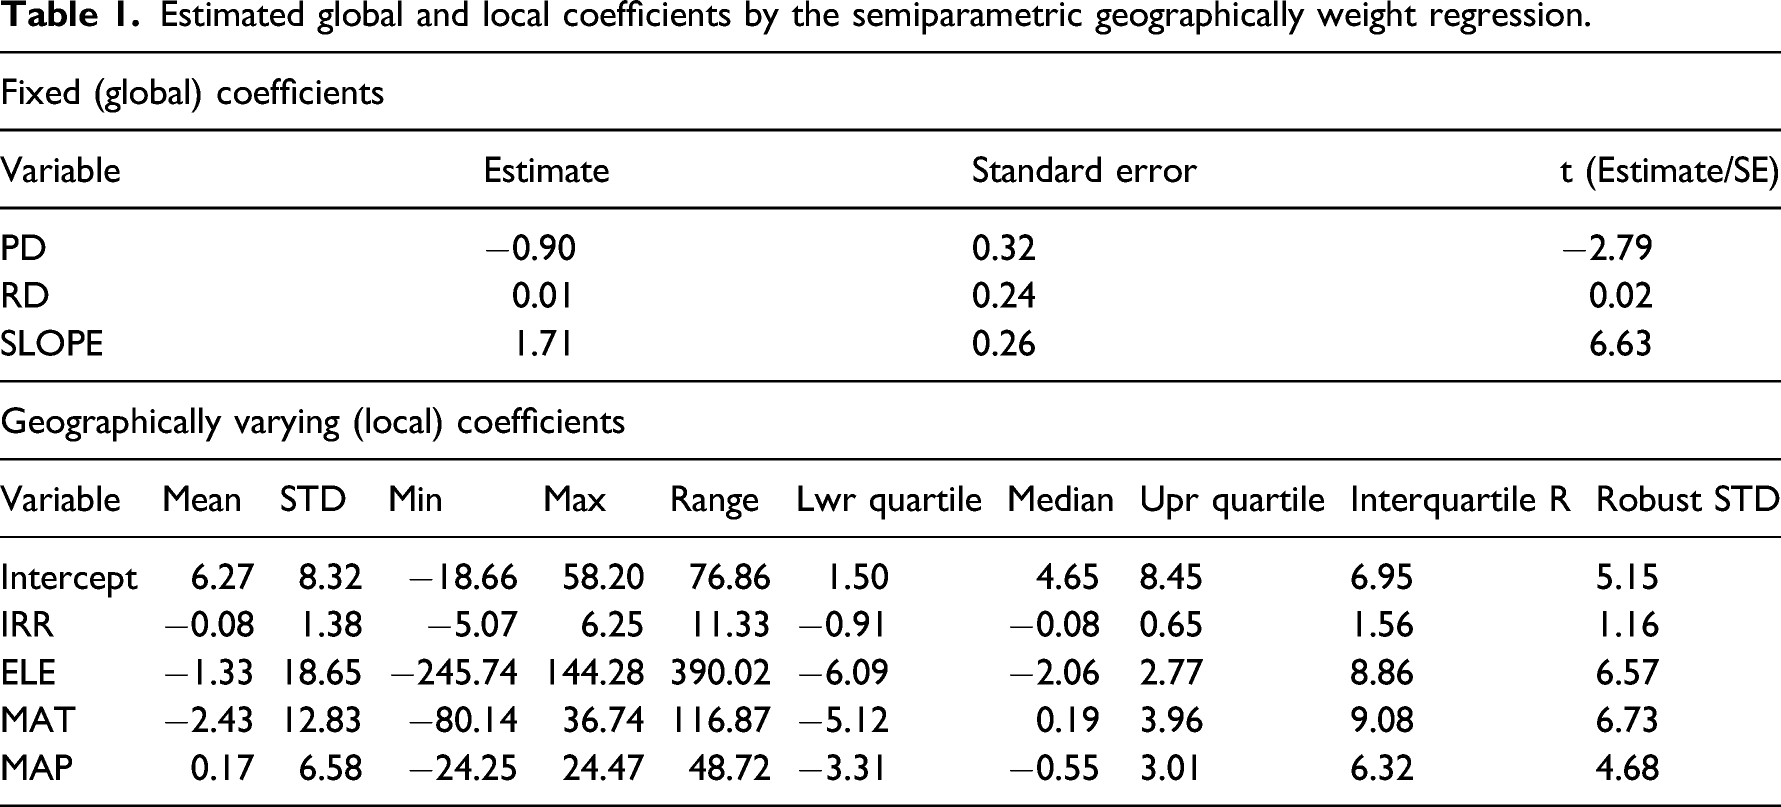
Specifically, PD, RD and SLOPE have global effects on crop diversity in China. Particularly, slope is a significant (p < 0.05) positive factor and plays the greatest impact on the crop diversity in China. For example, the counties with higher slope have high crop diversity. Population density has a significant (p < 0.05) negative impact on the crop diversity in China, which means that the high population density counties have lower diversity. Road density has a slight positive impact on the diversity.
In contrast, IRR, ELE, MAT and MAP have local effects on crop diversity distribution during the past 35 years. When the spatial non-stationary was considered in the SGWR model, the spatial distribution of local R
2
has a higher value in mountainous counties and a lower value in the plains (Figure 5(e)). When it comes to each driving factors of local effects, the MAT, ELE and IRR have the mean value of −0.08, −1.33 and −2.43, respectively. In contrast, the MAP has a mean value of 0.17(Table 1). From the spatial perspective, MAT has a negative effect in Xinjiang, Inner Mongolia, Jiangxi, Hunan, and Guangdong, largely because MAT determines the area under farming and limits the range of crops that can be profitably grown through heat (Figure 5(a)). IRR has the slight negative impact on crop diversity because irrigation contributes to large area cropland that can be specialization, which, in turn, reduces crop diversity (Figure 5(c)). ELE has a negative effect on diversity in the plain and plateau, indicating that the large cropland can only plant one or two crops (Figure 5(d)). MAP is also important for crop growth. In areas with low rainfall, farmers tend to grow a variety of crops to obtain greater yields, which diversifies agricultural production (Figure 5(b)). The spatial distribution of coefficients estimated by the semiparametric geographically weight regression model.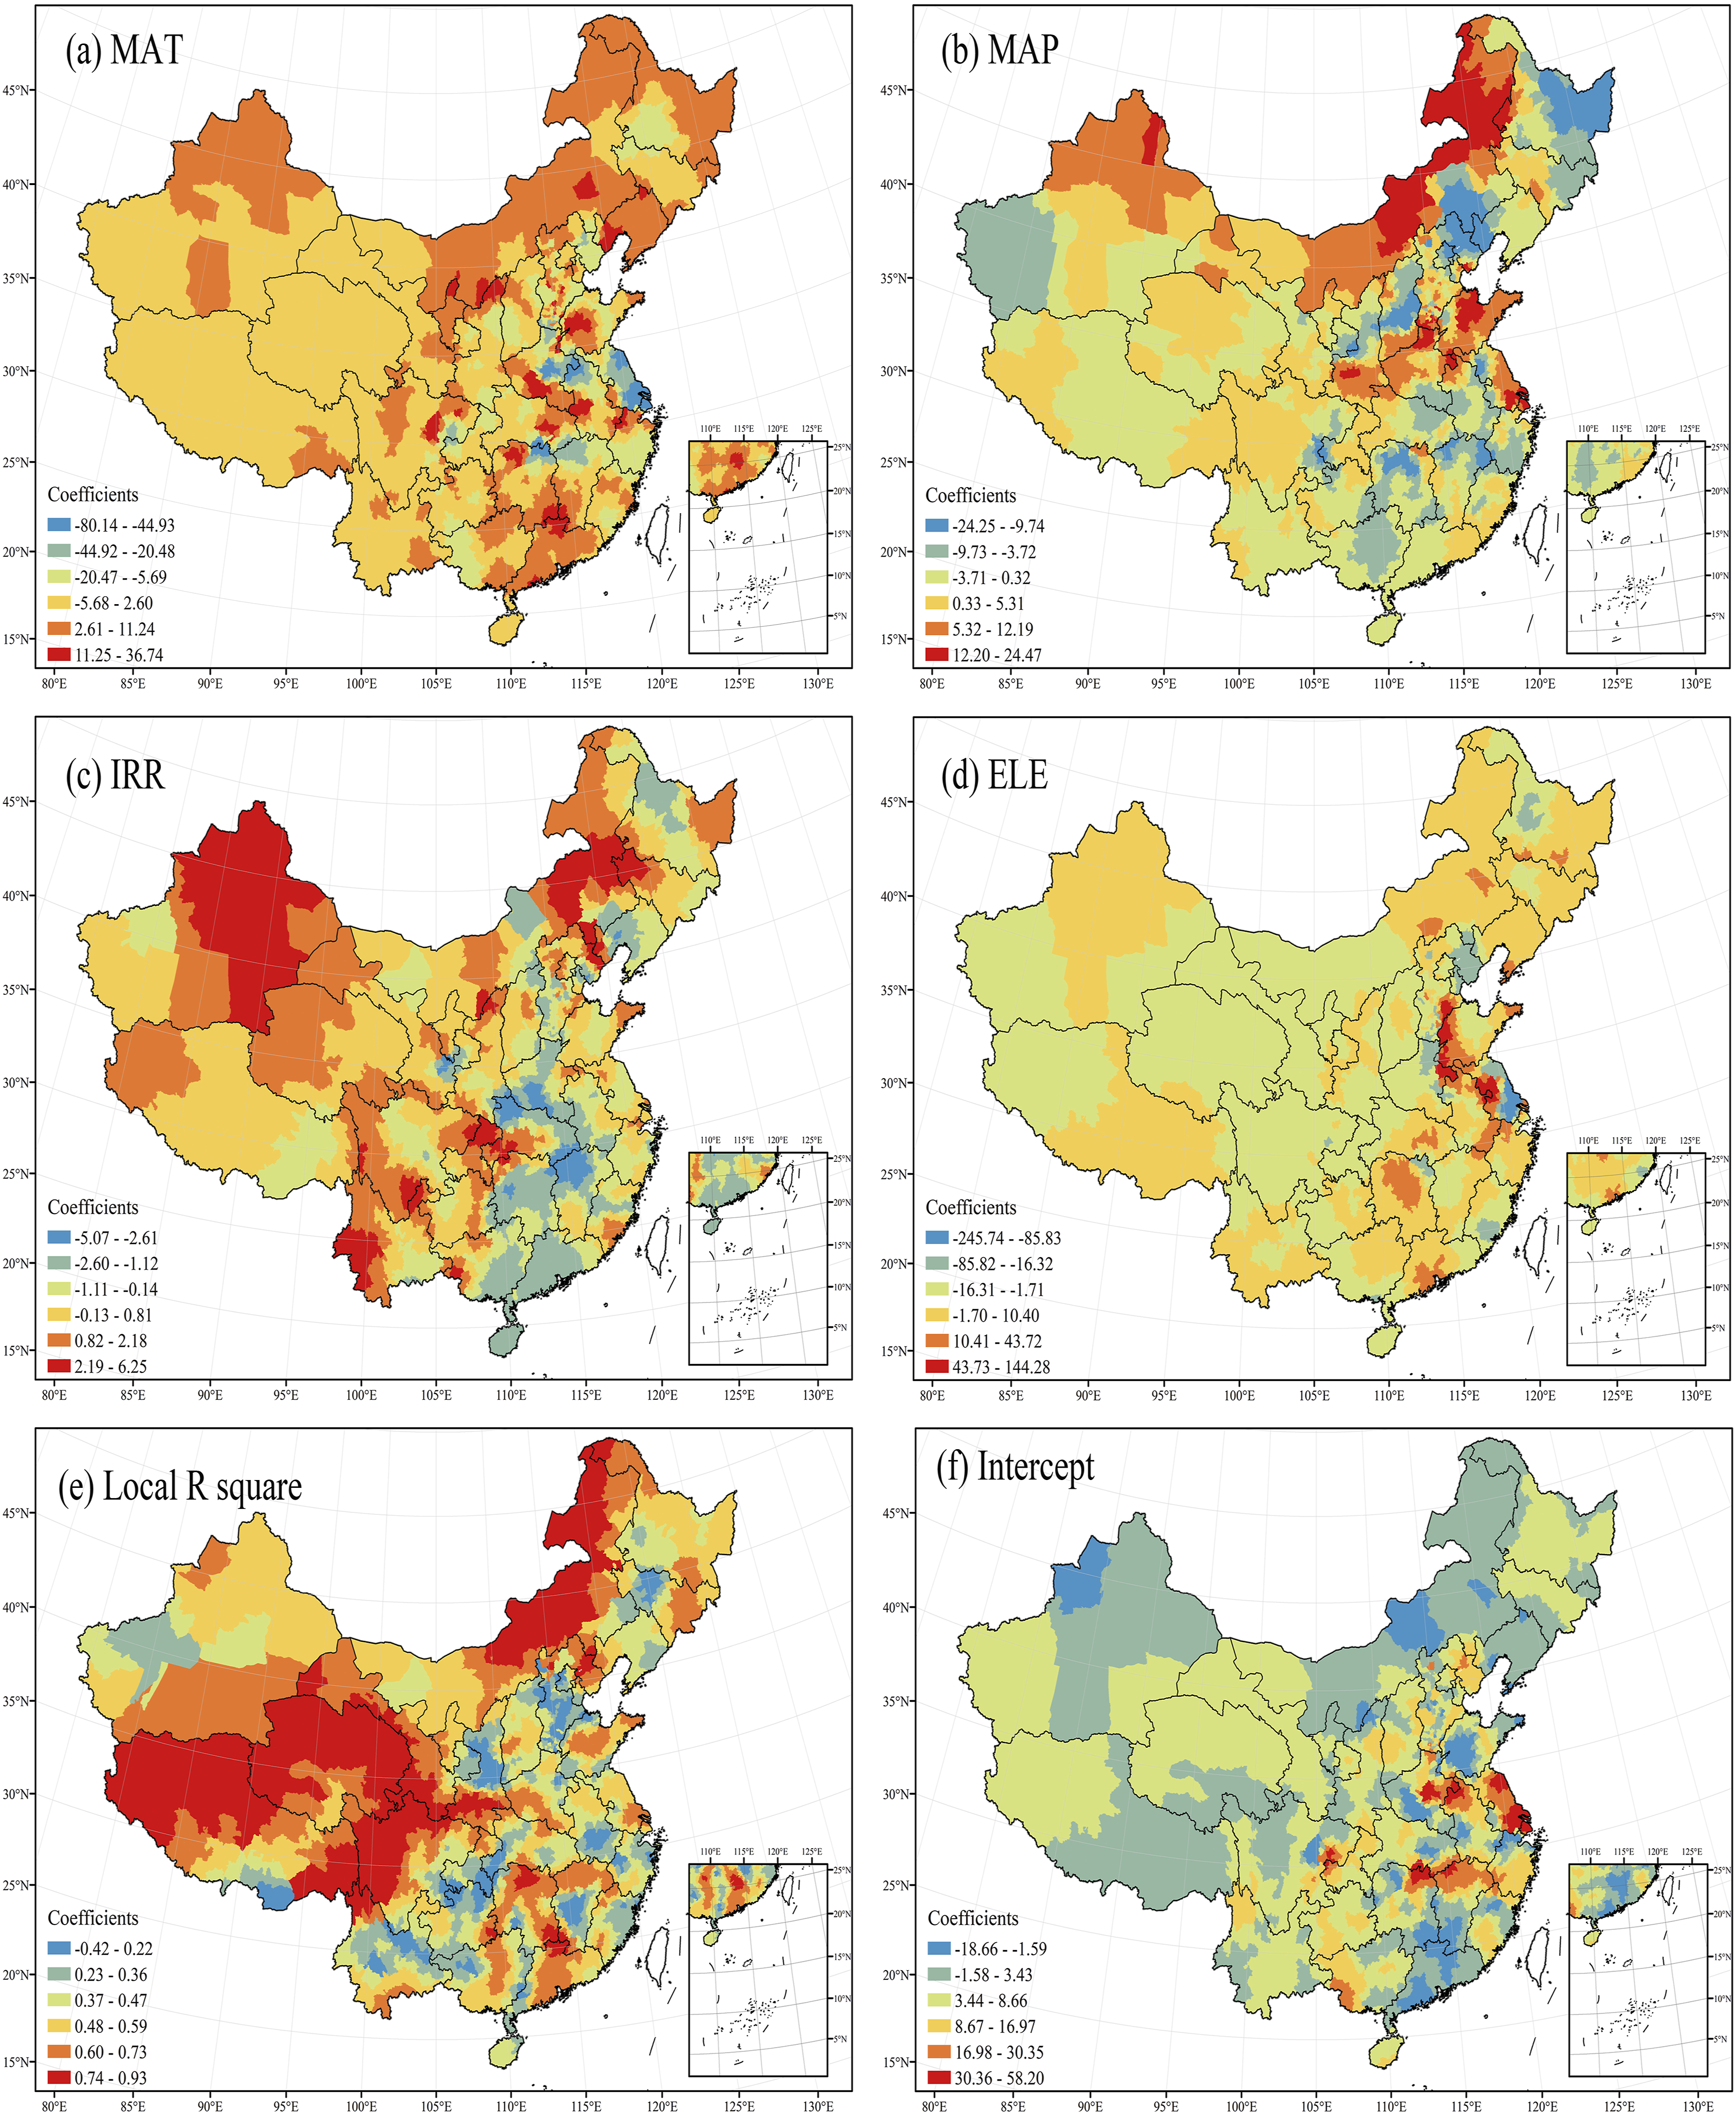
IV Discussion
1 The evolution of crop diversity in China
In this study, the results indicate that the crop diversity process has undergone an increase in most of the counties in China. The majority have a crop diversity value over 4, which means there are at least four types of crops in most counties. The crop diversity of the United States and India, which have similar cropland size to China, has experienced a reduction in crop diversity (Aguilar et al., 2015; Smith et al., 2019). Compared to the U.S., China maintains a higher crop diversity at county level than most of U.S. counties. American crop diversity fluctuated around 4 from 1978 to 2012 at national level, which is half of Chinese crop diversity (Aguilar et al., 2015). In contrast, crop diversity at district level also was stable at approximate 6 during 1947–2014. It is similar to Chinese counties crop diversity, but higher at national levels (Smith et al., 2019). In the future, it is necessary to conduct comparative studies of the driving mechanism among regions or countries of similar size such as Europe, America and India .
The crop diversity change was due to aggregation, specialization and the accompanying homogenization of cropping systems. Our results indicate that the crop diversity increased in southern China and decreased in northern China, thereby leaving the impression that the crop diversity in China did not change significantly at the national level. Crop diversity can be aggregated based on data of varying spatial-temporal resolution (Lin, 2011), which can be characterized by crop mixtures comprising different varieties (Hossain et al., 2001), or may be represented by areas practising multiple production systems (Deng et al., 2017; Lin, 2011). Moreover, there are two turning years in crop diversity change at national level. They corresponded, respectively, well to the timing of two important agricultural policies, that is, the household responsibility system (HRS) and the agricultural tax abolition (ATA) launched by Chinese government in 1980 and 2003, respectively. However, the impacts of these policies on the crop diversity over time still need further study (Boody et al., 2009; Renard and Tilman, 2019).
Many factors influence crop diversity in China, and a comprehensive examination of all of them is difficult. Some studies indicate that cultivated land area, labour force, irrigation, increased consumption of non-food products and decline in the consumption of staple foods are key factors influencing crop diversity (Kearney, 2010; Rahman, 2016); other studies show that crop diversity is influenced by the choice made by farmers and natural conditions (Duflot et al., 2015). The spatial distribution of crop diversity in China may be controlled by natural conditions, whereas crop diversity at local scale may be controlled by the farmer’s choice and socio-economic conditions (Lin, 2011). By entrusting the choice of crops and cropping systems to individual households, the increasing prices of selected agricultural commodities, and relaxing restrictions on the trade of agricultural products, China’s food supply received a substantial boost in recent decades (Huang and Rezelle, 2015). When conditions favour crop specialization, crop diversity decreases (Matsushita et al., 2016; McDaniel et al., 2014). The relationship between crop diversity changes and crop specialization still needs further study in the future.
2 Crop diversity sustainable strategy
Changes in crop diversity are very sensitive to spatial distribution of crops (Liu et al., 2018). Crop aggregation demonstrates a decreasing trend in crop diversity and an increasing trend in the homogenization of cropping systems, which may have far-reaching implications for food production, and ecosystem services associated with agricultural systems in China (Yu et al., 2018; Zuo et al., 2018). From a policy-making perspective, the resilience conferred by crop diversity deserves greater attention in the development of agriculture throughout the country and in promoting both crop specialization and crop diversity. Given the importance of crop diversification, it is important to promote homogenization of agriculture at the county level but do not overlook crop diversity at the national level (Hijmans et al., 2016). How to use the agricultural zoning policy, which link spatial differentiation with cropping sustainability management, to maintain the high regional crop diversity still need the attention of policymakers (Peng et al., 2020).
Crop diversification is critical to food production and helps to relieve hunger, malnutrition and even excess consumption (Massawe et al., 2016). Increasing crop heterogeneity is an effective way to enhance multi-trophic diversity (Sirami et al., 2019). However, using information on spatial and temporal heterogeneity of crop diversity to shape national policies for food stability has not attracted the attention of policymakers and farmers (Smith et al., 2019). One possible reason is that the crop diversity did not historically directly affect food supply. Another reason is the ignorance of policymakers on regional differences in crop diversity. Because crop diversity continues to be high when examined on the national scale, it is no longer seen as a major problem. We also need to develop better models of cropping systems, especially models of diversified cropping systems, to justify that crop diversity can not only enhance food security but also is profitable to farmers (Boody et al., 2009; Wu et al., 2018). Such models of agricultural land systems are particularly useful to decision-makers in planning long-term policies for land use.
3 Uncertainties and limitations
This study evaluated the spatial and temporal dynamics of crop diversity to understand why the Chinese agriculture maintain a high diversity of crop variety to sustainably feed more people during past 30 years. Most of previous researches have studied the crop diversity at global scale, but these studies considered a country or region as one sample, which is difficult to discuss the spatial heterogeneity impact of crop diversity (Jarvis et al., 2008; Khoury et al., 2014; Renard and Tilman, 2019). The cropping system in China is highly heterogeneous and spans a huge geographic space. Therefore, although this study is beneficial for revealing the spatial driving mechanism, it also incurs uncertainties in revealing the temporal driving dynamics. Moreover, because the Chinese crop diversity has a fluctuating upward trend, it is likely that the conclusions of this study are different from other studies in other countries (Aguilar et al., 2015; Smith et al., 2019). Specifically, the trend of crop diversity has an obvious difference in cropping regions. Thus, we can infer that crop diversity in different countries also shows difference in space and over time. However, this study successfully presents a relative long-term period case in China, and the findings can contribute to a comprehensive understanding of crop diversity changes and its drivers in cross physical geographical zone of worldwide.
In addition, this study focused on crop diversity at the county level rather than at the farm level. The underlying mechanism of crop diversity may differ. Because the crop diversity at farm level is a relative microscale research, it pays more attention to the behaviour of farmers and the regulation of the market-induces (Labeyrie et al., 2021; Song et al., 2021), while the macroscale study can observe the influence of natural conditions, cropping conditions, accessibility and policies. This study showed that the spatial pattern of crop diversity at the county scale is not static and governed by both anthropogenic and natural forces. China has a large population concentrated in rural areas, providing a foundation of planting options for crop diversity. Farmers will choose crops to plant according to their preferences and knowledge of crops. This is why population density determines crop diversity. Similarly, China’s arable land is widely distributed, both in the plains and in the mountains. For mountain farming, slope is an important factor affecting the crop diversity of cultivated land. For example, in southern and southwestern China, farmers plant rice in terraced fields, and cultivate corn and other economic crops in mountainous areas with steep slopes. In this study, the physical and socio-economic environment are the targets of macroscale analysis. As a consequence, it is necessary to conduct more studies on the behaviours of farmers or agricultural policies of counties from field census.
Finally, owing to limitations of data, this study focused on only the period of 1980–2014. And in terms of research driving forces, the selection of variables is limited by data acquisition, where many variables are not considered in the model. We only focus on the spatial drivers and use the average pixel data at county level, which has limitation. However, the period considered in this study was almost 35 years between 1980 and 2014. Many spatial variables such as elevation and slope changed relatively small, thus, the limitation does not have a significant impact.
V Conclusion
Maintaining reasonable crop diversity is an important national policy for food security and agricultural sustainability. Based on time serial data of county’s annual crop area during the period of 1980–2014, we analyse the spatiotemporal pattern of crop diversity in China and explored the underlying driving forces. The results indicate that Chinese farming systems maintain a high crop diversity with a value over 7 at national scale and a stable value over 4 at county level. The spatial pattern shows that crop diversity increased in more than two-thirds of the counties, while the hotspots of crop diversity gradually moved to the south-west mountainous area during 1980–2014. This pattern is mainly affected by slope and population density. In contrast, irrigation degree, elevation of cropland, mean annual temperature and mean annual precipitation are local factors affecting the spatial non-stationary distribution of crop diversity. The present research can help to understand the role of agricultural land systems in national strategies to respond to food security as well as to shape the zoning of agricultural production. Increasing crop diversity should be recognized as a policy tool to promote agricultural sustainable development.
Supplemental Material
sj-pdf-1-ppg-10.1177_03091333211055850 – Supplemental Material for Why can China maintain a high crop diversity? A spatial-temporal dynamic analysis
Supplemental Material, sj-pdf-1-ppg-10.1177_03091333211055850 for Why can China maintain a high crop diversity? A spatial-temporal dynamic analysis by Zhenhuan Liu, Guoping Tang, Yi Zhou, Jin Sun, Wenbin Wu and Peng Yang in Progress in Physical Geography: Earth and Environment
Supplemental Material
sj-pdf-2-ppg-10.1177_03091333211055850 – Supplemental Material for Why can China maintain a high crop diversity? A spatial-temporal dynamic analysis
Supplemental Material, sj-pdf-2-ppg-10.1177_03091333211055850 for Why can China maintain a high crop diversity? A spatial-temporal dynamic analysis by Zhenhuan Liu, Guoping Tang, Yi Zhou, Jin Sun, Wenbin Wu and Peng Yang in Progress in Physical Geography: Earth and Environment
Footnotes
Declaration of conflicting interests
The author(s) declared no potential conflicts of interest with respect to the research, authorship, and/or publication of this article.
Funding
The author(s) disclosed receipt of the following financial support for the research, authorship, and/or publication of this article: This work was supported by the National Natural Science Foundation of China (Grant Nos. U1901601, 41871358 and 41571172).
Supplemental material
Supplemental material for this article is available online.
References
Supplementary Material
Please find the following supplemental material available below.
For Open Access articles published under a Creative Commons License, all supplemental material carries the same license as the article it is associated with.
For non-Open Access articles published, all supplemental material carries a non-exclusive license, and permission requests for re-use of supplemental material or any part of supplemental material shall be sent directly to the copyright owner as specified in the copyright notice associated with the article.