



Abstract
Cold biome ecosystems, extensively distributed on our planet, are highly sensitive to global changes. Fluctuations caused by climate change would inevitably affect the ecosystems’ structure and functions. However, the linkage between cold biome ecosystems and global changes demonstrates high spatial heterogeneity, especially between high-latitude ecosystems (HL) and high-altitude alpine ecosystems (HA). A comparative analysis of their response patterns would provide deeper insight into the underlying mechanisms at play. We used meta-analysis to synthesize ecosystems’ response to warming and altered precipitation performed in HL and HA. Warming and enhanced precipitation increases ecosystem biomass and carbon fluxes in HL and HA. Warming significantly stimulates aboveground biomass (AGB), root biomass (RB), total biomass (TB), aboveground net primary productivity, gross ecosystem productivity (GEP), soil respiration (SR), and net ecosystem productivity (NEP) in HL and HA. Similarly, AGB, GEP, and NEP increase significantly with enhanced precipitation. Respondent of ecosystem carbon storage and fluxes in HL and HA showed diverse results to warming treatment. Warming increases AGB and RB in HA while RB remains unaltered in HL. GEP and ER exhibit a positive response to warming in HL but an insignificant response in HA. In general, HL is sensitive to warming, and HA is sensitive to precipitation. The differential responses of HL and HA to climate change imply specific ecosystem traits and particular environmental constraining factors. Future cold biome ecosystem studies should further consider specific conditions like microtopography, soil moisture, and local climate unique to high-latitude and high-altitude ecosystems.
I. Introduction
Cold biome ecosystems are globally distributed from polar to tropical latitudes (Körner, 2021; Nagy and Grabherr, 2009), where varied rockiness, shallow and nutrient-poor soil, low precipitation, and drying wind (Liljedahl et al., 2017) highly constrain plant growth (Sarneel et al., 2020). As a result, these ecosystems are dominated by dwarf shrubs, cushions, mosses, lichens, tussock, sedges, and perennial forbs. High-latitude ecosystems (HA) and high-altitude alpine ecosystems (HA) are characterized by low summer temperatures (Körner and Paulsen, 2004; Körner, 2007) and short growing seasons (Oberbauer et al., 1998). Within these ecosystems, the plant species differ with local microclimate and substrate characteristics (Bhattarai et al., 2020) and the specific biotic-climate interactions that shape the regional diversity (Cavieres et al., 2014).
Similarly, low temperature and low turnover rates in the HL and HA have preserved a massive amount of soil organic carbon in permafrost soil, nearly twice the amount in the atmosphere (Hugelius et al., 2014). The global permafrost soil carbon is approximately 1700 Pg, accounting for ca. 50% of the global belowground organic carbon (Hugelius et al., 2014; Tarnocai et al., 2009). Thawing permafrost due to global climate change leads to old carbon being released into the atmosphere, causing positive permafrost-carbon feedback (Van Huissteden, 2020; Dörfer et al., 2013).
The habitat type of HL and HA remains similar (Fazlioglu and Wan, 2021; Quinn, 2008), but they are distributed in distinct environmental conditions that feature different combinations of sunshine, precipitation, atmospheric pressure, ultraviolet (UV) radiation, magnitude of diurnal temperature fluctuation, soil moisture availability, and wind force (Mooney and Billings, 1961; Virtanen et al., 2016). Mean annual temperature (MAT) in HA is higher than in HL but mean annual precipitation (MAP) and wetness index (WI) are higher in HL than in HA (Figure S1) and this contrasting pattern in climate has profound ecological consequences.
The temperature in the HL and HA has increased fast. The rate of temperature rise in HL is twice the global average (Notz and Stroeve, 2016; Richter-Menge and Druckenmiller, 2020) while that in HA is 0.1 °C higher than the global average in the past several decades (IPCC, 2018). Precipitation in HL has increased by 50–60% over the 21st century (Bintanja, 2018), whereas that in HA remains unchanged (Rogora et al., 2004; Hu et al., 2016). The disparate magnitude of temperature and precipitation changes between HL and HA set the stage for their different ecosystem dynamics (Oberbauer et al., 2007; Welker et al., 2000).
The climate-vegetation interactions in the alpine ecosystems have already been thoroughly investigated at local, landscape, and regional scales (Bhattarai et al., 2021). Drastic changes in the structure and composition of plant communities in the coming decade are predicted (Elmendorf et al., 2012b). The experimental manipulation studies (Loik et al., 2004; Oberbauer et al., 2007; Natali et al., 2014; Zhou et al., 2019; Ravn et al., 2020) illustrate temperature and precipitation as the key driving forces on ecosystem dynamics in cold biomes (IPCC, 2014; Gu and Grogan, 2020; Walker et al., 2006).
Warming adjusts soil moisture content and increases biomass (Hollister and Flaherty, 2010) and productivity (Natali et al., 2012) in HL. However, warming also enhances evapotranspiration and decreases water availability in soil, offsetting its positive effects (Sherry et al., 2008; Liu et al., 2009) in HA. It is still unclear whether warming has a positive or negative impact on net ecosystem production (Welker et al., 2000) and soil carbon budget (Rustad et al., 2001) due to the potential of enhanced soil respiration. Soil water deficiency also limits ecosystem photosynthesis (Chastain et al., 2014) and respiration (Natali et al., 2014; Zhou et al., 2019). Increasing precipitation can counter off the negative effects of warming-induced soil drying (Wu et al., 2011b) and increase species richness (Adler and Levine, 2007), plant biomass, and ecosystem productivity (Song et al., 2019).
There is a heightened necessity to predict HL and HA responses to climate change because they are more responsive to global change than most of the other non-alpine ecosystems (IPCC, 2014; Myers-Smith et al., 2011; Elmendorf et al., 2012a). There are some attempts to assess tundra and alpine ecosystems' responses to experimental warming (Walker et al., 2006; Wang et al., 2014; Wu et al., 2011a; Song et al., 2019), including ecosystem carbon storage and fluxes (Chen et al., 2020), but very few studies have simultaneously included HL and HA response and their comparison, as they are mostly being treated as uniform responses. This neglect leaves much space for a clearer understanding of HA and HL responses to global changes.
This study aims to explore the relationship between HA and HL by evaluating these ecosystems’ distinct response patterns to global changes. We synthesized results from warming and precipitation manipulation experiments carried out in the HL and HA using a rigorous meta-analysis technique to answer: (a) Do warming and precipitation stimulate ecosystems’ carbon storage and carbon fluxes in HL and HA? (b) How does the cold biome ecosystem’s response to warming and precipitation differ between HL and HA?
II. Materials and methods
2.1. Data collection
The HL in this study stretches above ca. 60° N to ca. 79°N in the high-latitude of the Northern Hemisphere above the treeline. HA stretches from a high-elevation mountain summit down to the altitudinal treeline (Testolin et al., 2020) in the mid-latitude of the Northern Hemisphere. We used the global map of alpine regions produced by Testolin et al. (2020) as the reference literature to mark alpine ecosystems. We collected peer-reviewed journal articles (hereinafter literature) published before 30 July 2020, which investigate the impact of climate change on HL and HA carbon storage and carbon flux variables (Table S1) by temperature and precipitation manipulation experiments. We searched ISI Web of Science and Google Scholar databases using the keywords warming experiment, tundra, arctic, sub-arctic and alpine ecosystems, climate change, temperature, and precipitation manipulation experiments to identify relevant studies. The following inclusion criteria were applied to finalize the literature: (a) experiment must have either warming or increased precipitation; (b) experiment must be conducted on grasslands of HL or HA; (c) experimental warming duration must exceed at least one growing season; and (d) experiment has included at least one of the nine variables (Table S2).
Studies meeting the above criteria were selected (Figure 2) and the relevant data was extracted. We chose aboveground biomass (AGB), total biomass (TB), root biomass (Rb), soil organic carbon (SOC), aboveground net primary productivity (ANPP), gross ecosystem productivity (GEP), soil respiration (SR), ecosystem respiration (ER), and net ecosystem productivity (NEP) as the response variables. Results under different warming magnitudes and different locations from the same study were treated as independent cases (Chen et al., 2020). Mean, standard deviation, standard error, and sample size of the response variables extracted from the selected literature were used to calculate response ratio and their corresponding variances.
2.2. Data analysis
2.2.1. Meta-analysis
The meta-analysis approach was used to determine the treatment effects on response variables (terrestrial ecosystems’ carbon storage and carbon fluxes). The effect sizes and the variances from numerous outcomes were combined to compute the effect size of each response variable (Hungate et al., 2009). We calculated the response ratio (RR) for each response variable using equation (1).


Considering the unbalanced sample sizes of each study site, we adopted a random effect model in the analysis. The weights assigned under random effect models are more balanced, which can avoid the dominance of large sample size sites (Borenstein et al., 2021; Quintana, 2015). The weighted effect size and corresponding 95% bootstrap confidence intervals were calculated using rma function in metafor package of R (Viechtbauer, 2010). The treatment effects were considered statistically significant if the 95% bootstrap confidence intervals do not overlap zero. The rank correlations (Kendall’s tau rank and Spearman’s rank) between the response ratio and their corresponding variances (Table S3) were used to evaluate the publication bias in the study (Dieleman and Janssens, 2011; Chen et al., 2020).
2.2.2. Meta-regression
We conducted meta-regression analysis to explore the relationship between the mean effect size of each treatment and their corresponding environmental variables (mean annual temperature (MAT), mean annual precipitation (MAP), and wetness index (WI)). MAT and MAP were extracted from each study and used in our analysis. For those sites without MAT and MAP provided, we obtained them from Climate Model Intercomparison Project phase 5 (CLIMP5: https://esgf-node.llnl.gov/projects/cmip5). The WI was calculated using equation (3) to obtain the relative surface wetness of each study site.

All the statistical analyses were performed in R (version 3.6.1) (RCoreTeam, 2019).
III Results
3.1. Overview of manipulation experiments in HL and HA
The criteria set for this study led us to collect a total of 63 articles, 34 about HA and 29 about HL. Studies from HL are more evenly distributed throughout the arctic regions, whereas those from HA are mostly confined to the Tibetan Plateau (Figure 1). Most of these manipulation experiments are about increased temperature (warmed; 50) followed by increased precipitation (13). The experimental warming was primarily performed by open-top chambers (OTC; 38), while the rest were warmed by infrared heaters (8) and greenhouses (4) (Figure 2). The details of the manipulation experiments along with the data used to generate figures are given in appendix 1. Location of the study sites included in this meta-analysis. HL: High-latitude ecosystem, HA: High-altitude alpine ecosystems, W: Warmed, IP: increased precipitation. An overview of the literatures used in this synthesis. As shown, they represent (a) Ecosystem types (HA: high-altitude alpine ecosystem, HL: high-latitude ecosystem), (b) manipulative experimental treatment (W: warmed, IP: increased precipitation), and (c) method (OTC: open-top chamber, IH: infrared heaters, GH: green house).

3.2. Carbon storage and the climate change drivers in HL and HA
Aboveground biomass increased linearly with MAT, MAP and WI (Table S4). A significant increase in ABG was observed with warming and increased precipitation (Figure 3(a)). Similarly, warming significantly increased RB (Figure 3(b)) and TB (Figure 3(c)), which showed non-significant change with increased precipitation. Soil organic carbon did not change significantly with warming (Figure 3(d)). The response of carbon storage and carbon fluxes in high-latitude ecosystem and high-altitude alpine ecosystem. AGB, aboveground biomass; RB, root biomass; TB, total biomass; SOC, soil organic carbon; ANPP, aboveground net primary productivity; GEP, gross ecosystem productivity; ER, ecosystem respiration; SR, Soil respiration; NEP, net ecosystem productivity, W, warmed; IP, increased precipitation. Error bars represent 95% confidence interval (CI). The vertical dash lines represent weighted effect size = 0. Effect of warming in the ecosystems is statistically significant if the 95% CIs do not overlap with zero. The sample size of each variable is given in parentheses.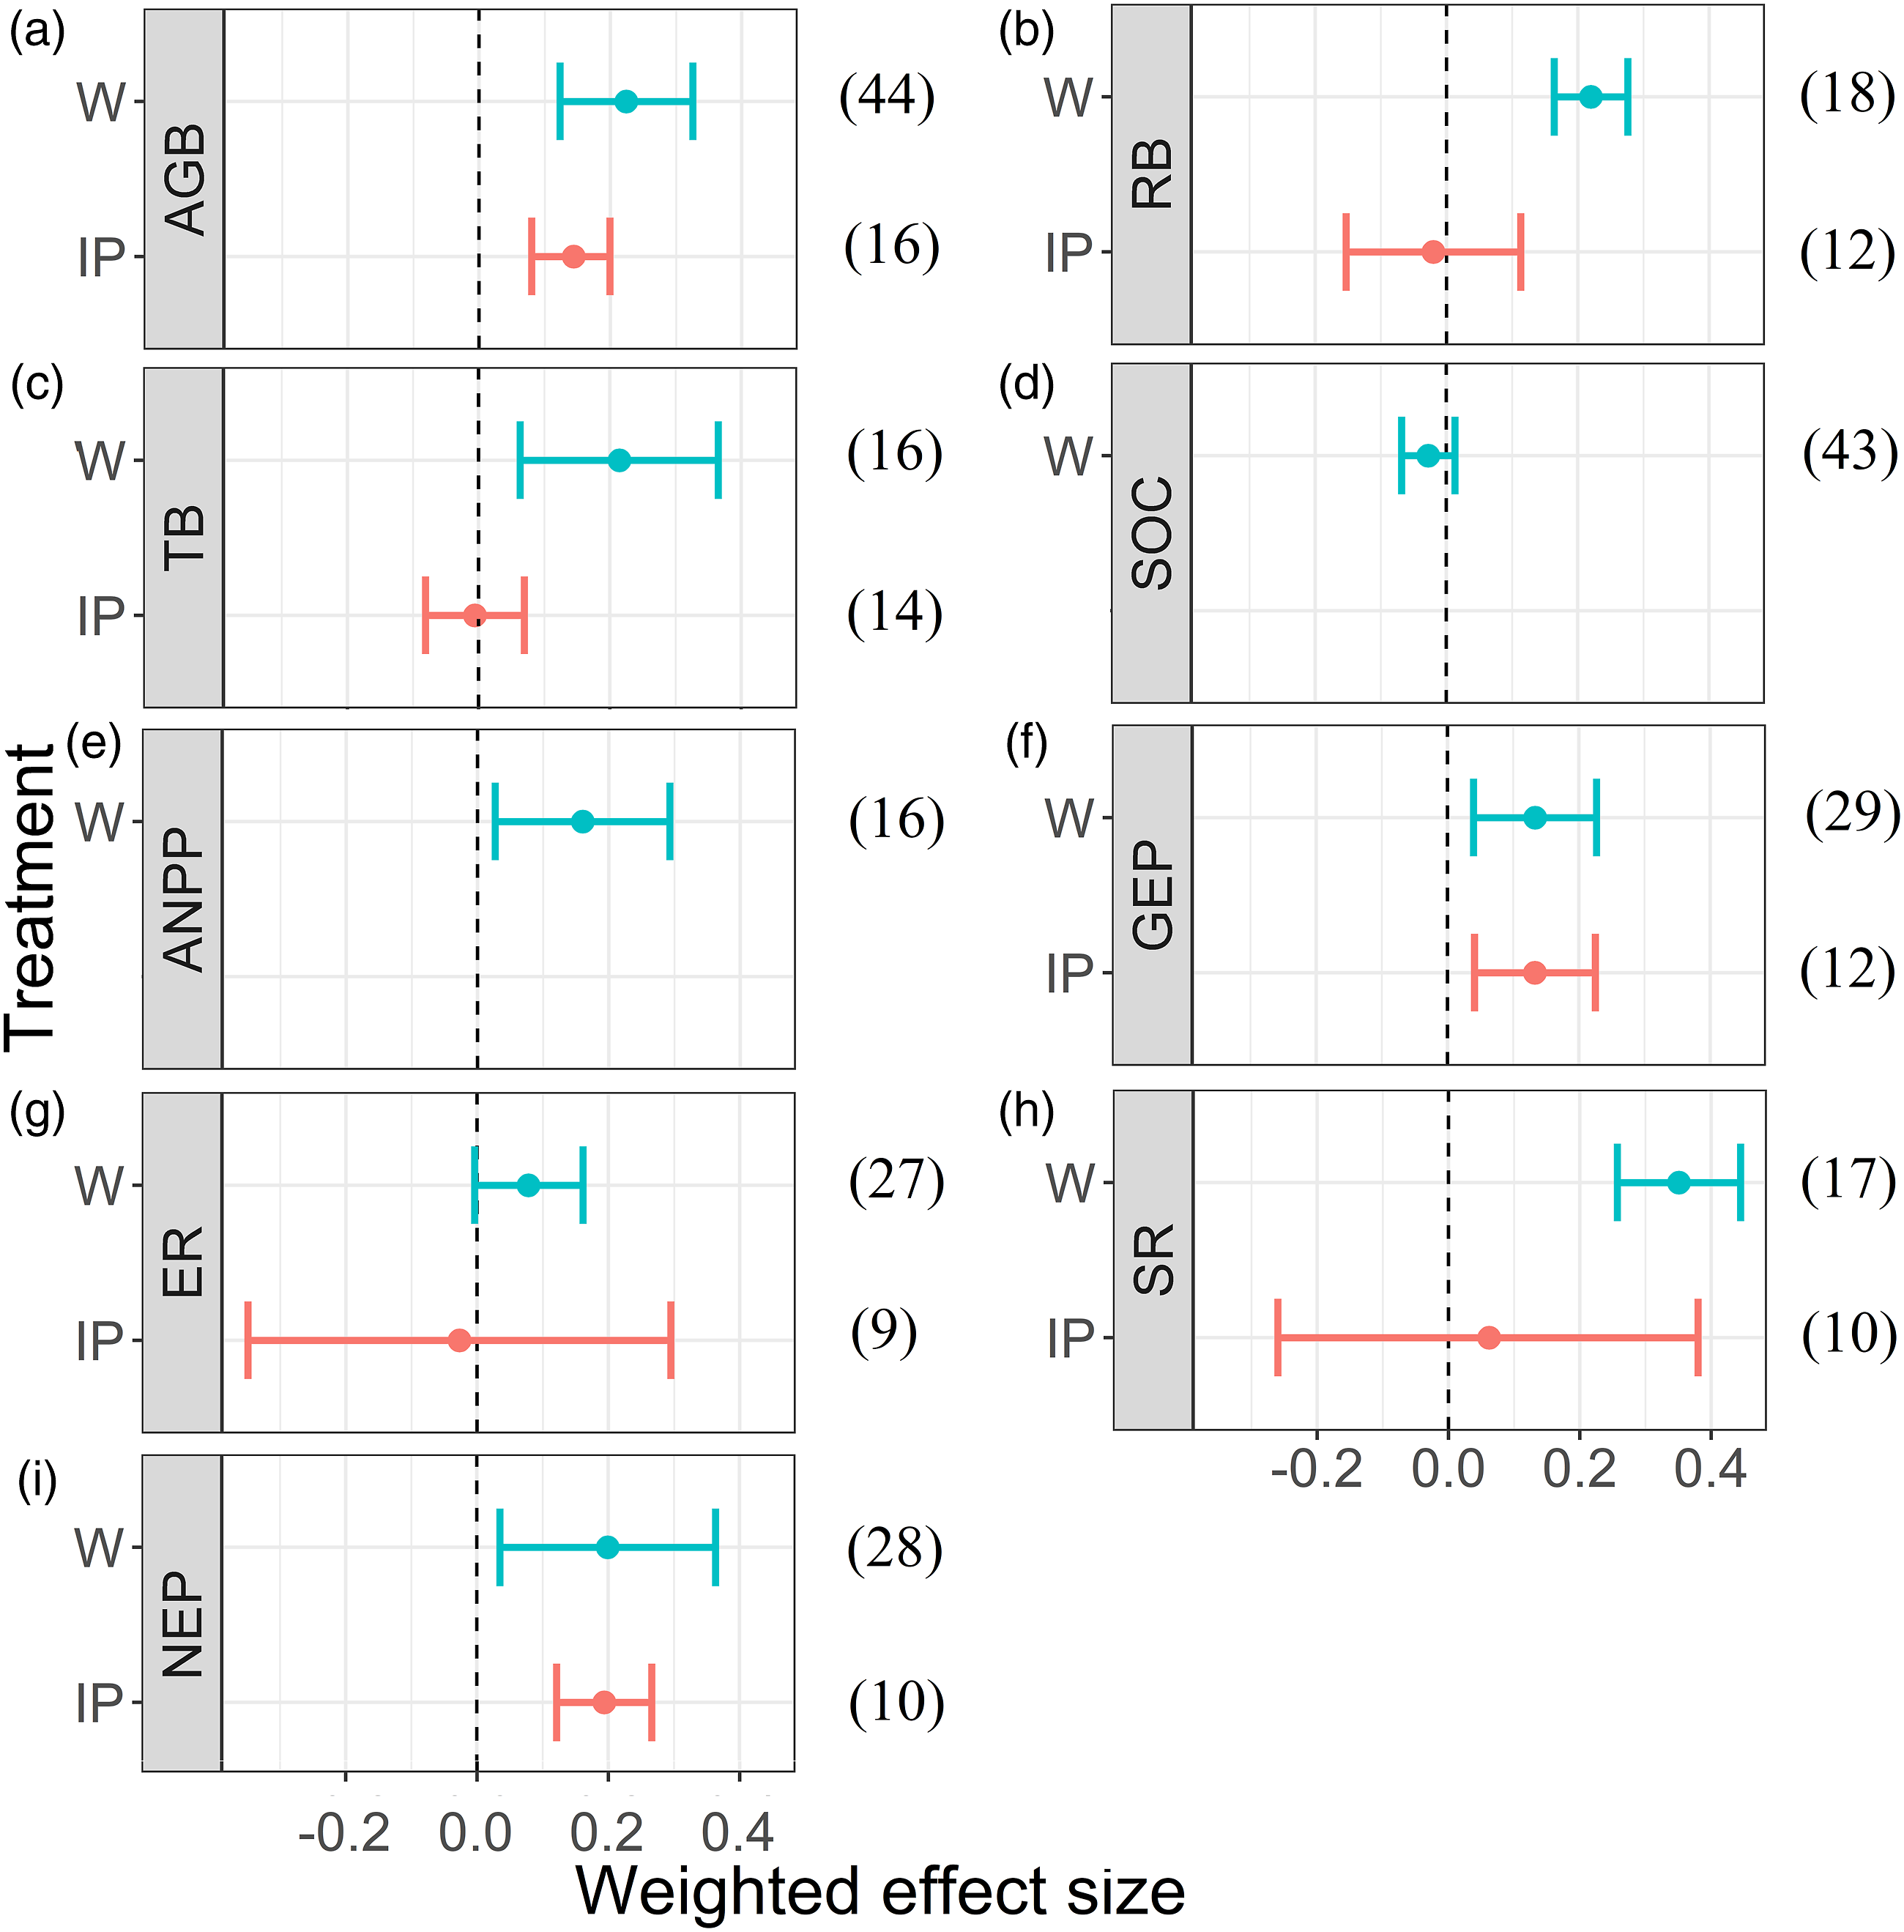
3.3. Carbon fluxes and the climate change drivers in HL and HA
Aboveground net primary productivity was significantly higher in the warmed plots than the control plots (Figure 3(e)).
Response of GEP to warming increased linearly with MAT, MAP, and WI (Table S4). GEP (Figure 3(f)) was higher in the warmed and increased precipitation plots. In contrast, the response of ER to warming and increased precipitation declined linearly with MAT and MAP, respectively (Table S4), and hence, ER remained static with warming and increased precipitation treatment (Figure 3(g)). SR (Figure 3(h)) and NEP (Figure 3(i)) were significantly higher in the warmed plots than the control ones. Similarly, NEP was higher in the increased precipitation plots. However, SR did not change significantly with increased precipitation.
3.4. Distinct carbon storage responses to warming between HL and HA
The response of ecosystems’ carbon storage in HL and HA showed diverse results to warming treatment, where AGB increased significantly by 14.06% (111.99 gm/m2 ± 19.08) in HL and by 21.03% (133.67 gm/m2 ± 23.74 gm/m2) in HA (Figure 4(a)). In contrast, TB exhibited non-significant trends in HL (Figure 4(b)) but increased significantly by 35.91% (3625 gm/m2 ± 1409 gm/m2) in HA because TB increased linearly with MAT in HA (R2 = 0.4, p < .05; Table S4). The response of RB to warming increased linearly with MAP in HA (R2 = 1, p < .05; Table S4). Therefore, increasing temperature significantly increased RB by 25.31% (981.635 gm/m2 ± 322.44 gm/m2) in HA; however, RB exhibited non-significant change with warming in HL (Figure 4(c)). Similarly, the response of SOC to warming decreased linearly with MAT (R2 = 1, p < .05; Table S4) but increased linearly with MAP (R2 = 1, p < .05; Table S4) and WI (R2 = 1, p < .05; Table S4), explaining the significant decrease of SOC by 14.15% (2.76 gm/kg ± 0.016 gm/kg) with warming treatment in HL (Figure 4(d)). However, SOC did not change significantly with warming in HA. The response of ecosystems carbon storage and carbon fluxes to warming between ecosystems (HL, high-latitude ecosystem; HA, high-altitude alpine ecosystem). AGB, aboveground biomass; TB, total biomass; RB, root biomass; SOC, soil organic carbon; ANPP, aboveground net primary productivity; GEP, gross ecosystem productivity; ER, ecosystem respiration; SR, Soil respiration; NEP, net ecosystem productivity. Error bars represent 95% confidence interval (CI). The vertical dash lines represent weighted effect size = 0. Effect of warming in the ecosystems is statistically significant if the 95% CIs do not overlap with zero. The sample size of each variable is given in parentheses.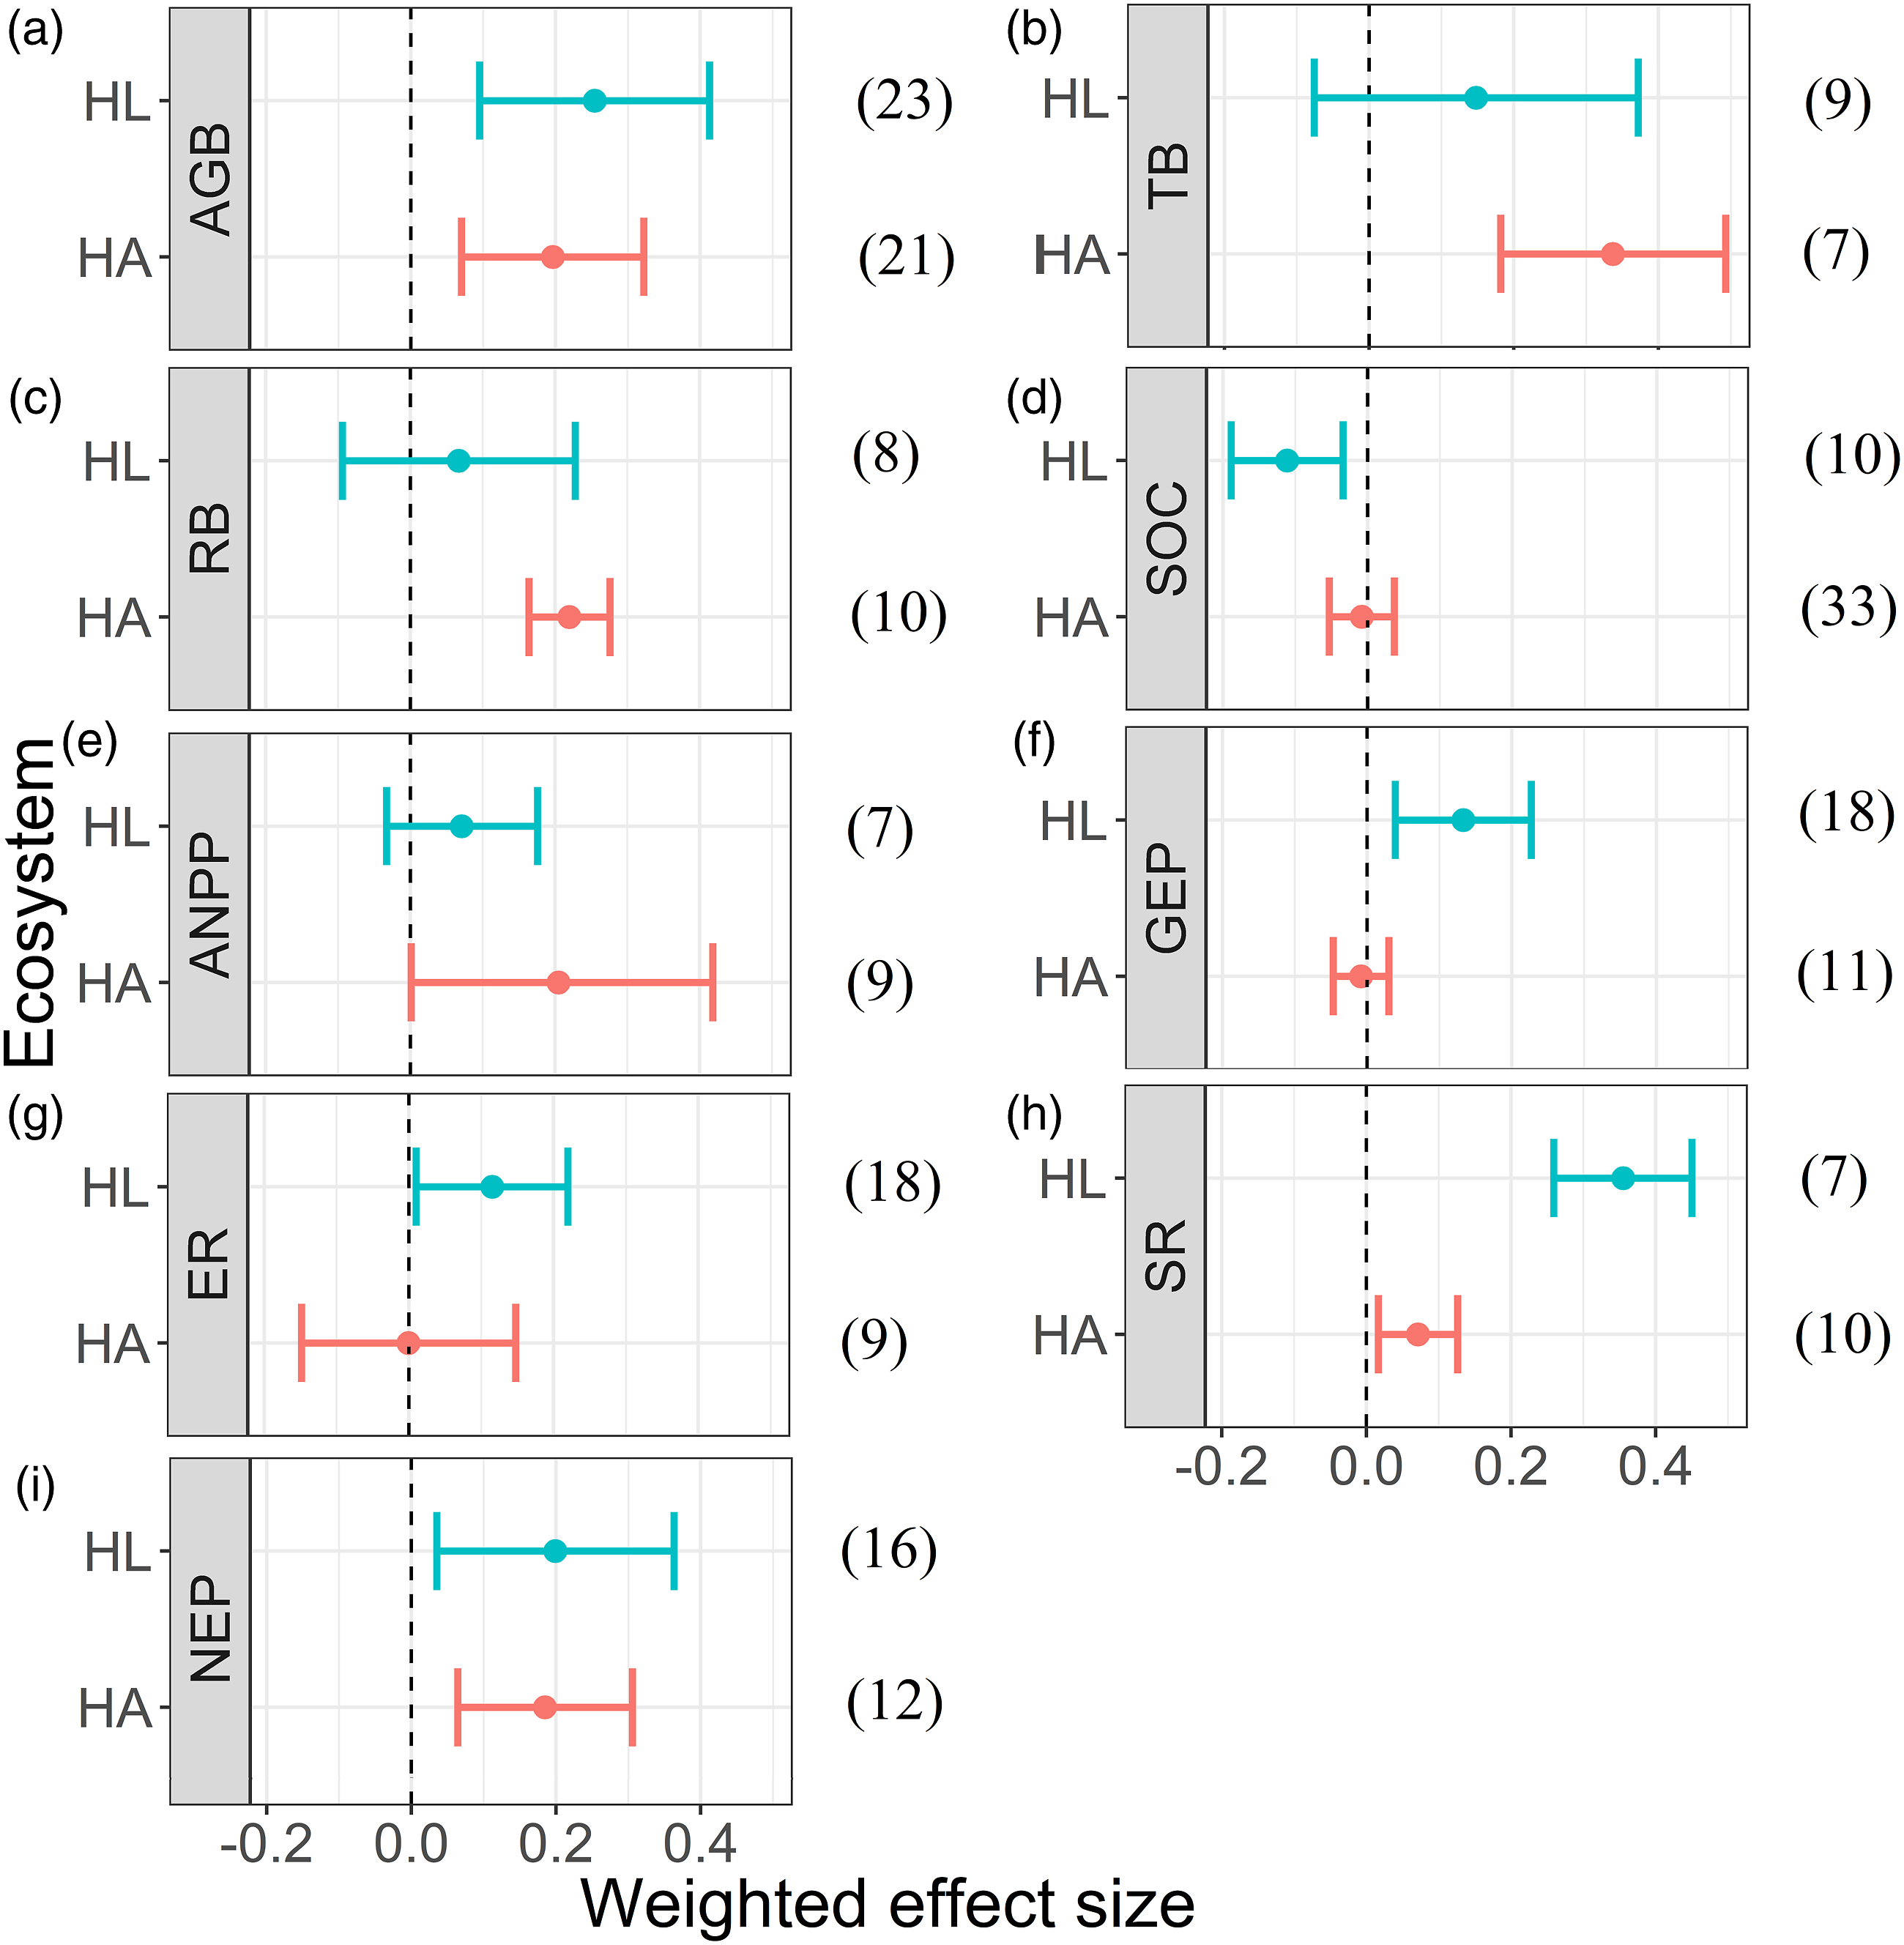
3.5. Distinct carbon fluxes response to warming between HL and HA
Warming increased GEP (Figure 4(f)) and ER (Figure 4(g)) significantly in HL by 12.3% (0.45 μmol/m2/s ± 0.08 μmol/m2/s) and by 10.69% (0.29 μmol/m2/s ± 0.06 μmol/m2/s), respectively, but did not have significant impact in HA. Our result also depicted higher SR in warmed plots in the two ecosystems (Figure 4(h)), with the magnitude higher in HL. Warming increased SR in HL by 18.41% (0.28 μmol/m2/s ± 0.07 μmol/m2/s) and HA by 10.62% (0.19 μmol/m2/s ± 0.04). NEP also followed a similar response trend to warming as that of SR. It increased significantly in both ecosystems (HL: 16.66%; 0.22 μmol/m2/s ± 0.05 μmol/m2/s; and HA: 15.57%; 0.21 μmol/m2/s ± 0.03 μmol/m2/s) with warming (Figure 4(i)).
IV. Discussion
4.1. Impacts of warming on ecosystems carbon storage and carbon fluxes
Results of our synthesis showed that AGB, TB, RB, ANPP, GEP, SR, and NEP increased significantly with experimental warming (Wang et al., 2017; Chen et al., 2020), whereas ER remained static in HL and HA. These ecosystems are constrained by temperature, soil moisture, and nutrients. Therefore, increasing temperature is particularly impactful for plant biomass and productivity (Rustad et al., 2001; Zheng et al., 2020b), resulting in increased AGB allocation. The effecting pathways can be through prolonged growing seasons (Oberbauer et al., 1998) or enhanced photosynthesis (Wan et al., 2005) in the cold biome ecosystems. However, the positive effects of warming on AGB and ANPP in HL and HA are neutralized by SR, which might be the reason for the static NPP under warming in the cold biome environments (Natali et al., 2014; Ganjurjav et al., 2016).
Our synthesis showed that the response magnitude of AGB to warming increased with MAT, MAP, and WI in HL and HA (Table S4), suggesting that both temperature and precipitation drive AGB in cold biome ecosystems. Soil organic carbon was found to be unaffected by experimental warming because these variables are co-regulated by the responses of RB and SR. In the relatively dry ecosystems (HA) RB increased significantly, while in the relatively humid ecosystems (HL) RB remains unchanged with warming. Warming-induced drought stimulates a higher proportion of biomass allocation to the underground parts to maintain root osmotic potential and prioritize root functioning to absorb adequate nutrients and water from deep soil in the dry environments (Hommel et al., 2016; Wang et al., 2017), which results in a significant increase in root biomass and, together with enhanced microbial activity, accelerates soil respiration (Xu et al., 2015; Yang et al., 2020).
Aboveground biomass responded positively to MAT in HL (Table S4). Hence, AGB, GEP, ER, and NEP increased significantly with warming treatment. Similarly, AGB, TB, SR and NEP increased significantly with warming treatment in HA. These results imply that HL and HA below the threshold temperature could become carbon sinks (Zhou et al., 2019; Marcolla et al., 2011; Monson et al., 2002). Moreover, RB increased linearly with WI in HA (Table S4), which emphasizes the importance of available soil water in dry ecosystems.
The stronger water stress for HA can therein be related to higher radiation and temperature-caused evaporation enhancements (Gedan and Bertness, 2009). We found GEP and ER had a positive significant relationship with warming in the HL (Biasi et al., 2008; Natali et al., 2014), whereas no significant relationship was observed in HA (La Puma et al., 2007). The increasing rates of temperature and precipitation in HL are higher than those of HA (Box et al., 2019; Hu et al., 2016), which increased GEP and ER significantly in HL. The overall decreased NEP with increasing MAT in HA (Table S4) suggests that it may potentially be changed from a region of carbon sink to a source with ongoing unprecedented rates of rising temperature due to climate change.
4.2. Impacts of precipitation on ecosystems’ carbon storage and carbon fluxes
Increased precipitation causes positive effects on plant biomass and carbon fluxes. Aboveground biomass increases significantly with rising MAP and WI (Table S4), indicating the importance of precipitation and soil water availability in HL and HA (Xu et al., 2021; Zheng et al., 2020a; Zhang et al., 2019). The increased GEP leads to an overall enhanced net carbon uptake (Wu et al., 2011a). The higher sensitivity of GEP to soil moisture (Chen et al., 2009) favors carbon uptake and increased NEP significantly with enriched precipitation (Wu et al., 2011a; Zhu et al., 2017).
Soil moisture is a critical factor regulating GEP and ER (Hoeppner and Dukes, 2012; Zhang et al., 2015). Gross ecosystem productivity and ER increased with increasing MAP and soil water availability (with WI) (Table S4) because increasing soil water accelerates the physiological activity in plants (Zhou et al., 2019; Zhang et al., 2018). On the other hand, warming-induced water stress can cause physiological limitations on water transport (Lloyd and Fastie, 2002; Barber et al., 2004) and ER significantly decreased with MAT (Table S4). Reduced photosynthetic potential and growth rate represent one side of the mechanism related to water stress. The reduced photosynthetic potential may be caused by the impairment in metabolism, decreased cell water content, and carbon assimilation (Imadi et al., 2016). Together with declining plant biomass and suppressing physiological processes, water stress can also cause mortality (Choat et al., 2018) and consequently decrease the terrestrial ecosystem productivity. Moreover, the micro-topographical variations cause varied soil water availability (Bhattarai et al., 2020), setting the stage for their spatially heterogeneous responses to warming.
We found that AGB significantly increased, while RB did not change significantly with increased precipitation. AGB accounts for a small fraction of the total community biomass of the cold biome ecosystems. Under enhanced precipitation, a greater proportion of biomass is allocated to the aboveground part (Litton et al., 2007; Jiang et al., 2015). However, increased precipitation might cause insignificant effects on plant biomass in HL (Dormann and Woodin, 2002), which hints that HL is more sensitive to warming than to precipitation variations.
We were aware that a large sample size might cause a high explanatory statistical power (Hurvich and Tsai, 1989); however, small sample size can also produce realistic hypotheses and testable models (Bissonette, 1999). Our best effort in this research was to pick geographically representative, published literature that spanned across both the high-latitude and high-altitude grasslands. Moreover, the number of samples may not cause noticeable bias in meta-analysis and the small sample size concept may not be regarded as an absolute concept (Lin, 2018). We also checked the biases in the meta-analysis (Table S3), which states that there is no bias in the data, telling us our sample is enough to conduct a meta-analysis.
V. Conclusions
Findings from the meta-analysis of cold biome ecosystems at both high-latitude and high-altitude highlight the importance of understanding the commonalities and differences between these ecosystems and help us to unfold the underlying mechanism and predict their future status. For the entire cold biome ecosystem, warming significantly increases plant biomass (AGB, RB, and TB), and GEP, SR, and NEP, while no significant increase was observed in ER. Increased precipitation significantly increased AGB, GEP, and NEP, indicating that the cold biome ecosystem is sensitive to warming. However, increased precipitation normalizes the water stress caused by elevated temperature and increases plant biomass and fluxes in relatively dry ecosystems. For the two respective ecosystems, their warming response patterns of the ecosystem carbon storage and fluxes differ. Warming increases plant biomass, SR and NEP in HA while increases AGB in HL but not TB and RB. Moreover, warming significantly increases GEP, ER, SR, and NEP in the HL, suggesting both HL and HA are sensitive to temperature variation. MAT, MAP, and WI all exert significant effects on ecosystem carbon storage and fluxes in cold biome ecosystems, with distinct response magnitudes between high-altitude and high-latitude. HA is drier than the HL, and increased WI and MAP significantly enhanced ecosystems’ carbon storage and carbon fluxes in HA, suggesting HA is sensitive to precipitation variation as well. These results can further improve our understanding of how cold biome terrestrial ecosystem carbon storage and carbon fluxes respond to warming and precipitation changes. There is an urgent need for multifactored experiments in the cold biome ecosystems to improve our understanding of the impact of climate change and different ecological processes on the terrestrial ecosystem carbon budgets.
Supplemental Material
Supplemental Material - Distinct response of high-latitude ecosystem and high-altitude alpine ecosystem to temperature and precipitation dynamics: A meta-analysis of experimental manipulation studies
Supplemental Material for Distinct response of high-latitude ecosystem and high-altitude alpine ecosystem to temperature and precipitation dynamics: A meta-analysis of experimental manipulation studies by Prakash Bhattarai, Bishnu Timilsina, Rabindra Parajuli, Yao Chen, Jie Gao and Yangjian Zhang in Progress in Physical Geography: Earth and Environment
Supplemental Material
Supplemental Material - Distinct response of high-latitude ecosystem and high-altitude alpine ecosystem to temperature and precipitation dynamics: A meta-analysis of experimental manipulation studies
Supplemental Material for Distinct response of high-latitude ecosystem and high-altitude alpine ecosystem to temperature and precipitation dynamics: A meta-analysis of experimental manipulation studies by Prakash Bhattarai, Bishnu Timilsina, Rabindra Parajuli, Yao Chen, Jie Gao and Yangjian Zhang in Progress in Physical Geography: Earth and Environment
Footnotes
Declaration of conflicting interests
The author(s) declared no potential conflicts of interest with respect to the research, authorship, and/or publication of this article.
Funding
The author(s) disclosed receipt of the following financial support for the research, authorship, and/or publication of this article: This work was supported by the Outstanding Youth Scientist Program of NSFC (41725003), the Strategic Priority Research Program of the Chinese Academy of Sciences (XDA19070303), and the National Natural Science Foundation of China (32061143037). We are grateful to Jon Appel (USA) for English language correction and the anonymous reviewers for their comments on the earlier version of the manuscript.

Supplemental Material
Supplemental material for this article is available online.
References
Supplementary Material
Please find the following supplemental material available below.
For Open Access articles published under a Creative Commons License, all supplemental material carries the same license as the article it is associated with.
For non-Open Access articles published, all supplemental material carries a non-exclusive license, and permission requests for re-use of supplemental material or any part of supplemental material shall be sent directly to the copyright owner as specified in the copyright notice associated with the article.
