
Abstract
It has been well over a decade since lidar-based research began in earnest in the Maya Lowlands of southern Mexico, Guatemala, Belize, and Honduras. Most investigations have an archaeological focus, with a few integrating studies of the ancient Maya with analyses of local ecology and land-use. A review of frequently cited publications reveals a lack of consistency in assessing the accuracy of archaeological feature classifications in lidar data with variables such as sensor type, class definitions, and ground-truthing methods differentially affecting assessment results across the Lowlands. In general, area-based ground-truthing approaches to classifications of full waveform lidar data present the most comprehensive accuracy assessments. New assessment data from the Buenavista Valley of north-central Guatemala are presented to compare against existing studies and to demonstrate how a geographic approach (a comprehensive, landscape-scale study of features over space and time) to classification error assessment can enhance understanding of classification accuracy. Results show that meaningful comparisons of archaeological features across lidar datasets cannot be considered reliable without more uniform and detailed presentations of accuracy assessment methods, analyses, and results. The article concludes with recommendations for how such collaborations might proceed.
I Introduction
Since the turn of the millennium, lidar technology has been increasingly utilized as a remote sensing tool for geophysical and biophysical research in forested areas. Early applications showed lidar to be effective for understanding the structure of a forest canopy as an expression of its history of disturbance (Weishampel et al., 1996). Beginning in the late 1990s, scholars turned to lidar for research in Central American tropical forests, especially in Costa Rica (McKee and Sever, 1994; Sheets et al., 1991). Early studies modeled canopy heights and vertical structure (Hofton et al., 2002), and assessed the overall structural complexity of vegetation in rainforests (Weishampel et al., 2000).
The earliest attempt to use lidar to detect archaeological features occurred on Precolumbian anthropogenic features in Costa Rica. In 1983, NASA collected vertical slices of the forest using a laser profiler in collaboration with archaeological research in the Arenal region. At the time, this early lidar sensor was deemed ineffective at distinguishing between cultural and natural features—especially in comparison with the mission’s other optical and digital sensors that provided two-dimensional areal data (McKee and Sever, 1994: 140–141). In 2000, the University of Texas at Austin acquired the first aerial lidar data over a Maya archaeological site when an aid mission documenting the damage from Hurricane Mitch flew an Optech ALTM 1225 lidar over the Copan acropolis in Honduras (Gutierrez et al., 2001: 188). This geohazard-driven project demonstrated how last return data could reveal Classic-period (250–900 CE) Maya structures beneath canopy cover. It was not until 2009 that an interdisciplinary team, spearheaded by archaeologists Arlen and Diane Chase, deliberately employed lidar as a tool for studying ancient Maya settlements (Chase et al., 2010; Weishampel et al., 2010). Using an Optech Gemini lidar sensor, the National Center for Airborne Laser Mapping (NCALM) acquired 200 km2 of data over Caracol, Belize. The project revealed a complex anthropogenic landscape made up of thousands of structural remains, hillsides transformed by ancient terraces, and an extensive network of ancient roads tying outlying settlements back to the site core (Chase et al., 2011). This pioneering study revolutionized geographic research in the Maya area, and now thousands of square kilometers of lidar data have been acquired over the Lowlands, ushering in a decade of research using a geographic approach that considers the spatiotemporal dimensions of both cultural and natural features at a landscape scale.
The rapid influx of detailed, landscape-scale data has been a welcome turn of events to a field accustomed to extracting information over multiple years through long, uncomfortable field seasons. However, any period of rapid knowledge expansion has associated growing pains. After reviewing lidar-based research in the Maya Lowlands, this article identifies some of the major challenges emerging in geographical and archaeological investigations of Maya landscapes. These issues require future debate and input from diverse perspectives. The goal here is simply to identify emerging trends and bring focus to some challenges that must be met to ensure the responsible use of remote sensing data when interpreting the past. We explore the topic of feature classification assessment in greater depth as a way to draw attention to the limits of lidar data—a reality that needs to be discussed and quantified as a prerequisite for meaningful comparative research. We use ground-truthing data from the Buenavista Valley in Guatemala as a case study for potential ways to assess lidar archaeological feature detection accuracy and its implications. We conclude with predictions for how technology will continue to drive innovation in exploring past cultural landscapes.
II Lidar and remote sensing in the Maya Lowlands
The use of lidar to study tropical forests and the past settlements found within them can be traced back to the early 1980s. Research accelerated in the late 1990s and early 2000s with the development of new sensors that were more effective at penetrating thick, jungle vegetation. In the Maya Lowlands, lidar is the latest in a long succession of remote sensing technologies that have been employed with the goal of extrapolating the results of locally restricted field investigations to broader areas. The most commonly used data include aerial photography, aerial and spaceborne radar, and multispectral satellite imagery (for a recent review, see Garrison, 2020). A decade before the Caracol lidar flights, the combination of commercially available multispectral satellite data, the removal of Selective Availability on the Global Positioning System (GPS), and the emergence of Geographical Information Systems (GIS) software that could integrate raster and vector data drew a new generation of interdisciplinary archaeologists and geographers to remote sensing applications in the Maya area (Garrison, 2020: 257).
The initial excitement over high-resolution data and the ability to precisely locate oneself on the ground was tempered by detection accuracy assessments that called into question its broad applicability (e.g., Garrison, 2010; Garrison et al., 2008; Hixson, 2013). Lidar, with its canopy-penetrating capability, far exceeds the efficacy of any previously employed sensor. However, it is still a remote sensing technology, which means that it requires the same critical, quantitative assessments that have been given to prior datasets. The time is ripe to examine lidar’s present and future, and focus scholarly attention on the most urgent issues that need to be addressed in order to present rigorous interpretations, comparisons, and replicability of lidar-based research across the Maya Lowlands.
2.1 Lidar studies of ecology and land-use in the Maya area
Lidar has been successfully used within tropical ecosystems to answer questions concerning the natural and physical environment (see Doyle et al., this issue for a detailed review). Its ability to create high-quality digital elevation models (DEM), as well as produce high-resolution representations of the forest canopies from the non-ground returns makes it useful for multiscalar geomorphology and ecology studies. Lidar-derived metrics can inform models of the underlying tectonics of a region, as well as fluvial and hillslope morphology and mechanisms, including landform erosivity and soil transport (Roering et al., 2013). Ecological studies have been able to map and explore canopy height, canopy openness, internal and external canopy heterogeneity, and approximate vegetation area (Roussel et al., 2022; Zhang et al., 2017). These metrics have implications for ecosystem function and services, including carbon sequestration (Drake et al., 2002; LaRue et al., 2020), and wildlife habitat modeling (Davies and Asner, 2014; Vierling et al., 2008). Such geomorphic and ecological studies can be utilized to inform long-term human impacts and ancient urbanization patterns across a landscape; this type of geographic approach has been particularly imperative when mapping and reconstructing relic Maya agricultural landscapes and settlement zones. These humanized landscapes continue to influence the geomorphology, soils, and modern ecology of landscapes today (Dunning et al., 2019; Golden et al., 2016; Krause et al., 2021; Schroder et al., 2020).
Archaeologically focused studies make up the bulk of the research that integrates ecology and geomorphology in the Maya Lowlands (Figure 1) with the notable exception of studies of wetland field systems (Beach et al., 2019; Doyle et al., this issue). They largely aim to identify archaeological remains but also highlight vegetation’s effect on the clarity of anthropogenic features in lidar visualizations (Hutson, 2015; Inomata et al., 2017; Prufer et al., 2015), or investigate the interaction of anthropogenic features with geomorphology and ecology (Chase and Weishampel, 2016; Hightower et al., 2014). In western Belize, Swanson and Weishampel (2019) demonstrated the influence of resolution on lidar-derived vegetation metrics and their correlation with topographic relief. In the same study area, Weishampel and colleagues (2012) investigated the encroachment of illegal logging with both lidar- and Landsat-derived datasets, while Hightower and colleagues (2014) correlated ancient Maya terracing to differences in forest variables using lidar. Findings from these studies established the value of coupled human-environmental research, and demonstrate the wide variety of techniques that are essential to understanding the diverse vegetation and landscapes throughout the Maya world. Remote sensing, especially when coupled with field data, can help discern broad-scale variation in these biotic and geomorphic landscapes, and how that relates to past and present human populations. Map of the Maya area showing the location of lidar assessment studies discussed in the article (map by A. Thompson). Base map images are the intellectual property of Esri and are used herein under license. Copyright 2014 Esri and its licensors. All rights reserved.
Lidar can help detect ancient settlement patterns and quantify past human impacts at different spatiotemporal scales, though patterns of modern land-use and land cover change affect sensors’ capabilities within tropical ecological and archaeological studies. Analysis must be customized with each study based on vegetation, geology, and hydrology of the landscape. Previous work has summarized the challenges of disentangling anthropogenic features mapped with lidar (Fernandez-Diaz et al., 2014; Hutson, 2015; Prufer et al., 2015). These studies explore issues of separating modern features from historic or older archaeological features, as well as ancient anthropogenic features from natural surface expressions, especially within locations with little pedestrian survey or in areas of dense scrub vegetation, karstic geomorphology, or patterned soil and bedrock. Such variables require consideration as complicating factors during human visual or automated feature classification of lidar data.
2.2 Lidar studies in Maya archaeology
Archaeological prospection is a common use of remotely sensed data in fieldwork, as effective and efficient aerial survey can save both time and money (Yaeger et al., 2016). Since the initial Caracol study in 2009, lidar-based research has increased at an exponential pace in Maya archaeology. As such, this brief review is not intended to be exhaustive, but rather to highlight common trends in lidar publications over the last decade as exemplified by key studies. For lidar data to be useful to archaeology, they must first go through multiple rounds of classification. First, point classification—which in its simplest form distinguishes ground returns from the rest of the data—is typically performed by the lidar vendor, often using specialized software (e.g., TerraSolid, LP360, LASTools, PDAL). Archaeologists can further refine the point cloud classification based on local knowledge. Elevation and intensity rasters are generated from the classified points.
The second round of classification involves archaeological feature identification. GIS and remote sensing software packages are used to create derivative products from the point cloud-derived rasters that aid in accentuating topographic archaeological features for classification. Initially, many scholars relied heavily on unidirectional hillshades due to ease of use and interpretation (Chase et al., 2017). Advancements in open-source toolkits (e.g., Relief Visualization Toolbox [RVT], Kokalj et al., 2011, 2019; Zakšek et al., 2011) produce different relief visualizations that may be used as standalone or in blended layers, providing multiple renderings that highlight different features depending on specific geographic (bajos vs uplands) and environmental (urban, agricultural, forest) contexts. Ultimately, previous research proves that no single relief visualization is best, but current best practices show that using a variety of techniques will result in different features being visible. Throughout this article, further discussion of classification will be in reference to archaeological features, rather than the semantic labeling of the point cloud data itself.
In general, large ceremonial precincts are commonly visible with lidar data regardless of the geographic or environmental contexts (e.g., Aguada Fénix, Inomata et al., 2020), while identifying smaller, residential plazuelas (patio groups) can be challenging based on the size and shape of the archaeological features and the local geophysical environment (Thompson 2020). Dense vegetation and sensor variability result in fewer ground returns and modern anthropogenic landscape modifications (shifting agriculture, orchards, towns, and chain-pulled fields) can skew visibility of archaeological features, especially of small hinterland households (Ebert et al., 2016; Hutson, 2015; Inomata et al., 2017; Prufer et al., 2015). Even in regions with large stretches of protected high-canopy forest, such as Guatemala’s Maya Biosphere Reserve, other geophysical factors can differentially affect the ability to distinguish between cultural and natural features in lidar (see case study below).
Moving beyond archaeological prospection, lidar-derived visualizations and point clouds aid in our understanding of the built environment, including landscape modifications and timing of community development. In conjunction with excavation data, point clouds and profiles elucidate the corvee labor needed to construct monumental architecture (Inomata et al., 2020; Stanton et al., 2020; Prufer and Thompson, 2016). In regions with known architectural variations over centuries, remotely identified platforms can be assigned temporal periods, thus informing broad trends in urban development with minimal excavation programs. For example, Inomata and colleagues (2018) evaluated the expansion of minor centers in the Pasión River region using E-group architecture, while Garrison and colleagues (2019) assessed settlement expansion in the Peten’s Buenavista Valley based on mound morphology.
Large (> 1000 km2) lidar acquisitions like the West-Central Belize LiDAR Survey (Chase et al., 2014) and the Pacunam Lidar Initiative (PLI) (Canuto et al., 2018) revealed continuous settlement of varying densities between major centers. In addition to mounded architecture, landscape-scale defensive fortifications, intersite causeways, and extensive agricultural systems show variable spatial trends across the Southern Lowlands (Canuto et al., 2018), lending direct support to the theory that the Maya area was composed of a variety of adaptive regions (Dunning et al., 1998). In the densest areas of settlement, boundaries between kingdoms dissolve into continuous conurbations, challenging pre-lidar urban/rural dichotomies (Garrison et al., 2019). There are now dozens of lidar-based projects in the Maya Lowlands, with more being added each year.
III Assessing lidar data
Newly acquired remote sensing datasets require quality assurance and quality control assessments, as well as feature classification assessments for use in geographical and archaeological applications. Ideally, ground-truthing would be multidisciplinary and include the verification of both archaeological and non-cultural features, such as landforms and vegetation types. Systematic ground verification allows projects to identify gaps within the dataset, quantify false positives and false negatives of feature identifications, and determine the fidelity of the lidar-derived data to the on-the-ground observations.
Thus far, lidar validation and assessment techniques have widely differed between projects in the Maya Lowlands. Some of this variability is related to the specific application and research goals of a given project. For example, Inomata and colleagues (2021) used broad-area (>80,000 km2), low-resolution lidar across the Gulf Lowlands to identify nearly 500 monumental Formative-period Olmec and Maya ceremonial complexes and analyze them based on similarities and differences between their architectural layouts. While the team did visit 62 of these settlements, they also noted that when studying platform features of such a large scale, ground observations can be inferior to lidar analysis (Inomata et al., 2021: 1489–1490). However, many lidar-based research programs in the Maya Lowlands use their data to address research goals based on quantification of ancient structures, platforms, or both. The lack of comparable assessment data across projects, both in terms of sensor performance (e.g., Gemini vs Titan) or design types (discrete vs full waveform), and differing geophysical and vegetative contexts calls into question comparative studies employing inter-project lidar datasets as the main source of their interpretations. Such concerns for comparisons are further amplified by variations in lidar coverage, exemplified in the differences between continuous datasets—the focus of this paper—versus Goddard’s Lidar, Hyperspectral, and Thermal Image (G-LiHT), which covers long, noncontiguous transects across Mexico (Golden et al., 2016; Schroder et al., 2020), and more localized unoccupied aerial vehicle (UAV) lidar captures (Schroder et al., 2021). Setting minimum standards for classification assessment metrics in the Maya area is a vital first step to comparative collaborations across projects. This will be critical for reproducibility and also replicability of remote sensing findings as technologies change and datasets grow larger and more complex in the future. Solving this challenge will allow us to tackle even more complicated issues within the field, such as ethical considerations and data sharing (see Chase et al., 2020; Cohen et al., 2020; Fernandez-Diaz and Cohen, 2020). At the very least, assessment methods need to be made explicit to ensure that lidar-derived interpretations of Maya settlement, be they from single data acquisitions or across multiple regions and sensor types, may be appropriately evaluated rather than cloaked in a misleading reliance on the assumed accuracy of feature classification.
3.1 Challenges and critiques of early lidar assessments in the Maya Lowlands
Summary data for lidar assessments in the Maya area compared in this study. The studies are grouped by the type of lidar sensor used to collect data.
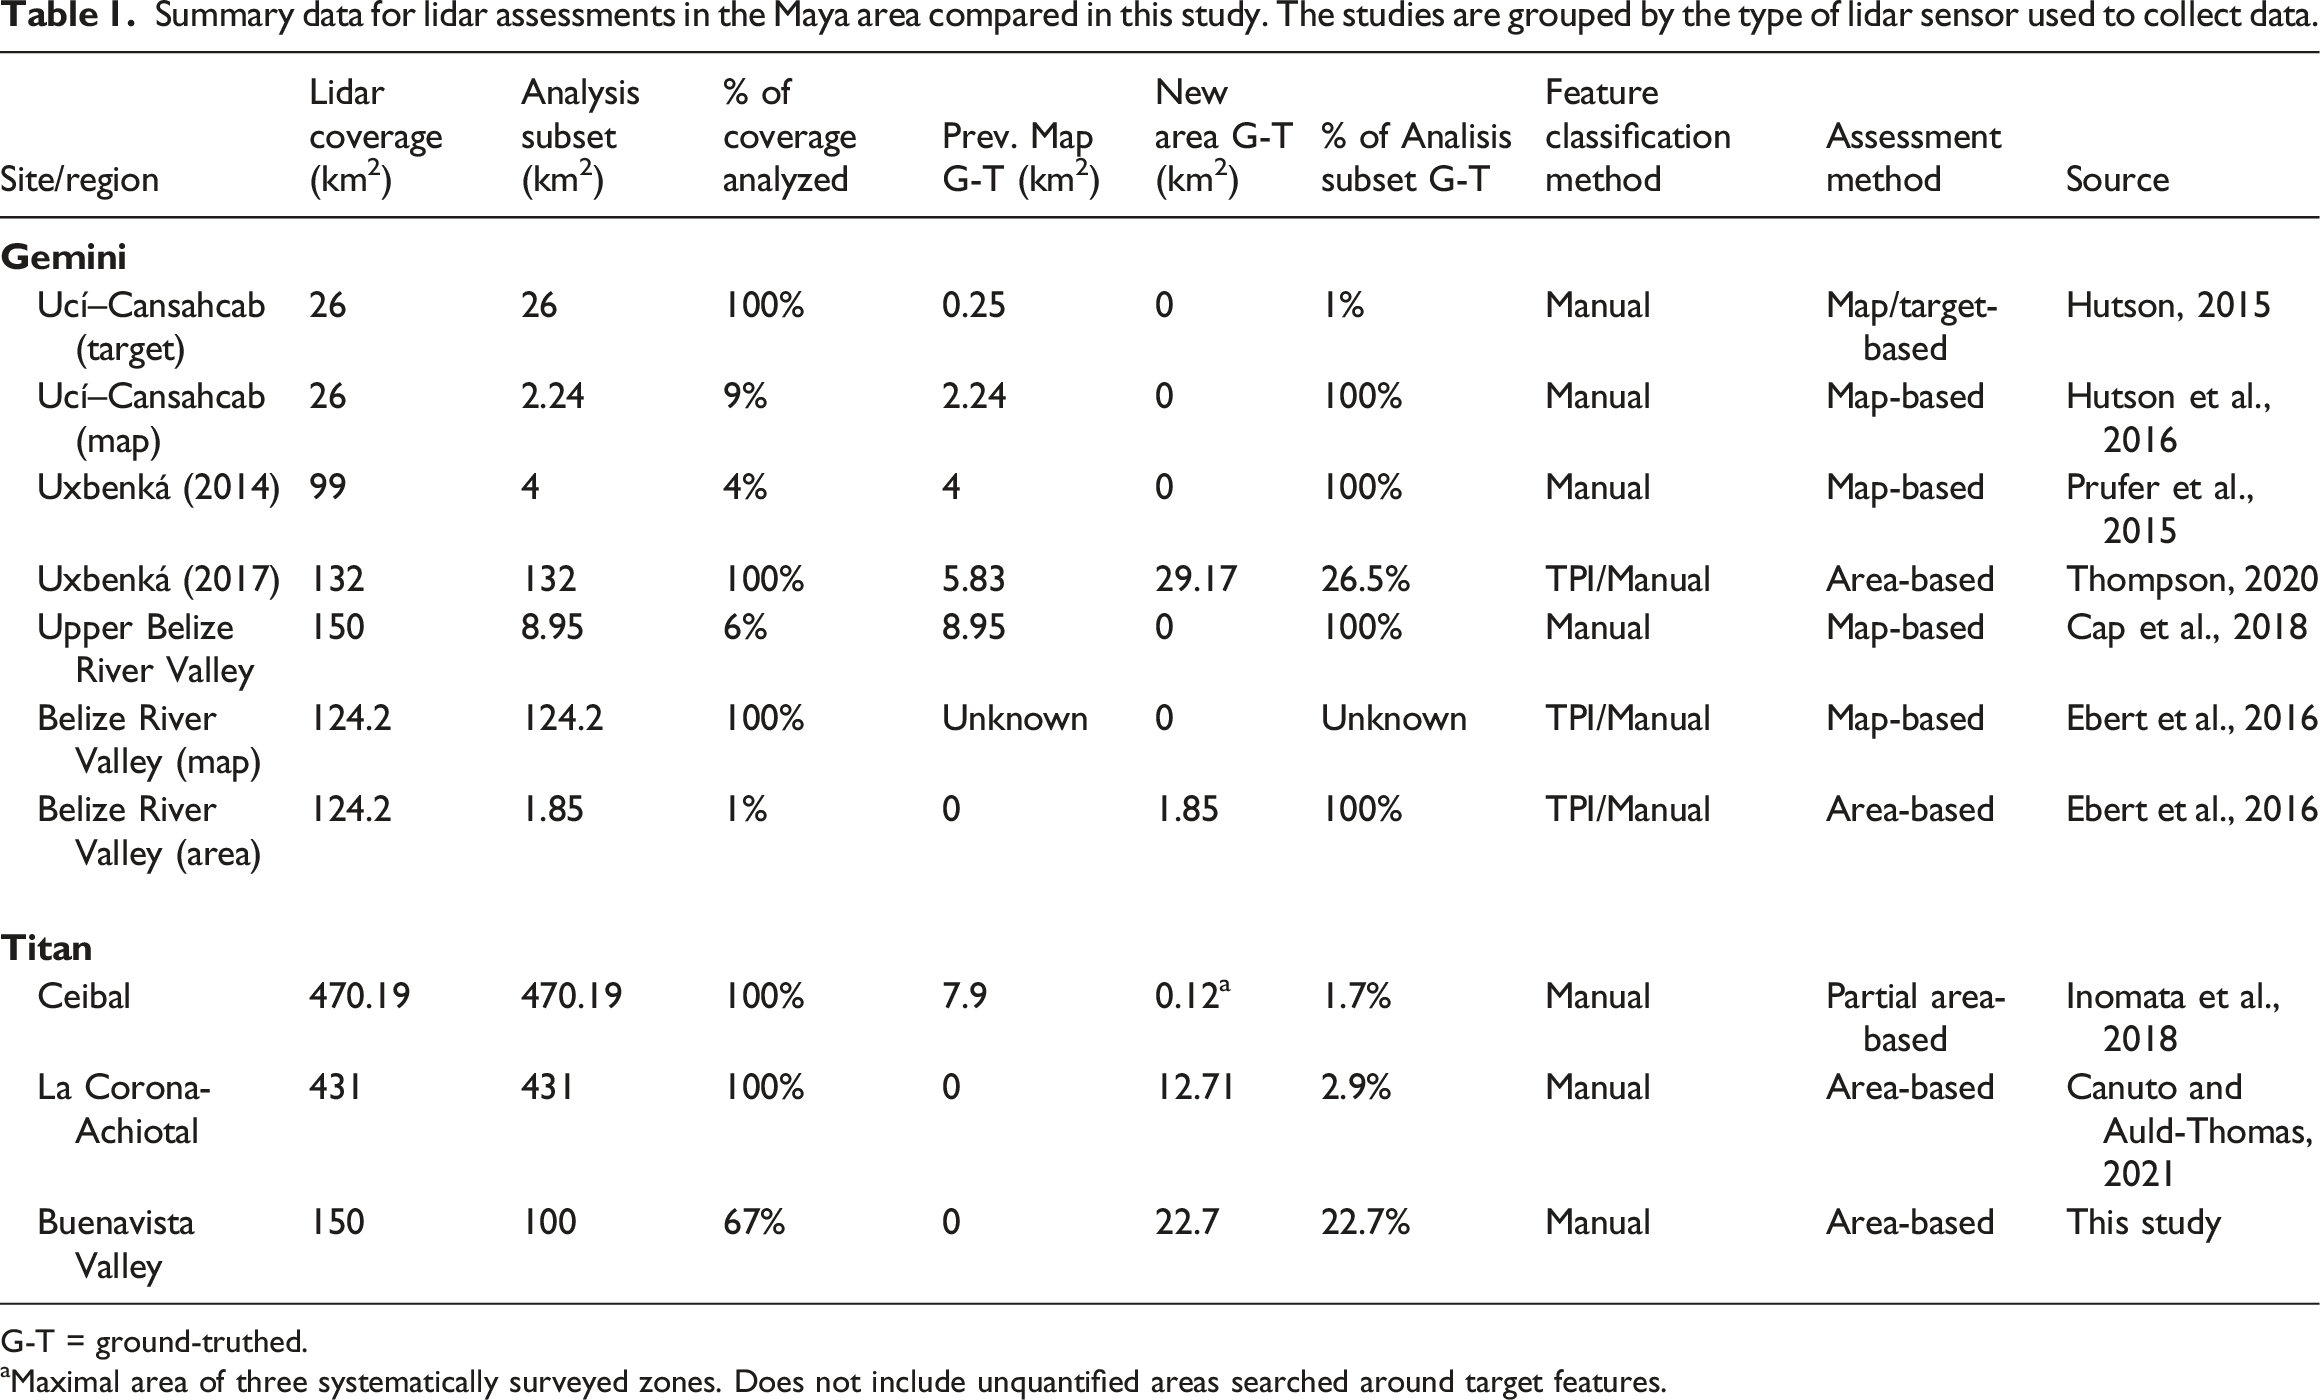
G-T = ground-truthed.
aMaximal area of three systematically surveyed zones. Does not include unquantified areas searched around target features.
In addition to the sensor model, studies vary based on the classification and assessment methods employed. Mayanists have used three types of assessment methods. Target-based methods classify features in the lidar and then verify a selection of those features in the field. There is no search for new features in the areas around the verification targets. Map-based assessments use the knowledge from previously mapped areas to gauge the reliability of lidar data for detecting archaeological features. Area-based assessments systematically verify classified features in the field while also searching for features in the landscape that were not detected during classification. Three of the study regions in Table 1 (Ucí-Cansahcab, Uxbenká, and the Belize River Valley) have been assessed using multiple methods, which helps in evaluating the merits of different types of assessments.
Assessment data for structure and platform classifications in Maya lidar studies.

Class. = classified; Ver. = verified; FN = false negative; FP = false positive; Rev. = revised.
aStructure groups cited in this study can actually be multiplatform complexes.
bIncludes “possible” structures and platforms.
The table shows the assessment breakdown for published studies based on structure and platform classifications, and combined structures and platform data where applicable. In general, platforms are broad, level constructions that were built to support masonry or perishable structures. Each project uses slightly different terminology and definitions, which needs to be considered when trying to make cross-project comparisons. Table 2 presents each study’s subset of classified features selected for ground-truthing (as both an integer and a percentage of the total classification), followed by a breakdown of how many instances were verified, false negatives (added to classification), or false positives (deleted from classification). Finally, a revised sample total is given based on the results of the assessment. For many of the early studies, the numbers for structures and platforms classified and ground-truthed have been extracted from these publications and presented as if lidar classification had been performed prior to comparison with existing mapping data. For example, in Hutson’s (2015: 258, Table 1) map and target-based assessment of Ucí-Cansahcab, he notes that there were 51 platforms previously mapped in the Ucanha square of his lidar coverage, but only 48 were visible in lidar. He then classified 438 new platforms in areas without prior mapping coverage. If these data were presented as counts from a lidar feature classification, the total platforms classified would be 486—the sum of the visible previously mapped platforms and the new classification. Similarly, the ground-truthing sample includes the 48 visible platforms plus the 21 new platforms visited by Hutson (2015: 260) for a total of 69.
Percentage-based comparison of assessment results.
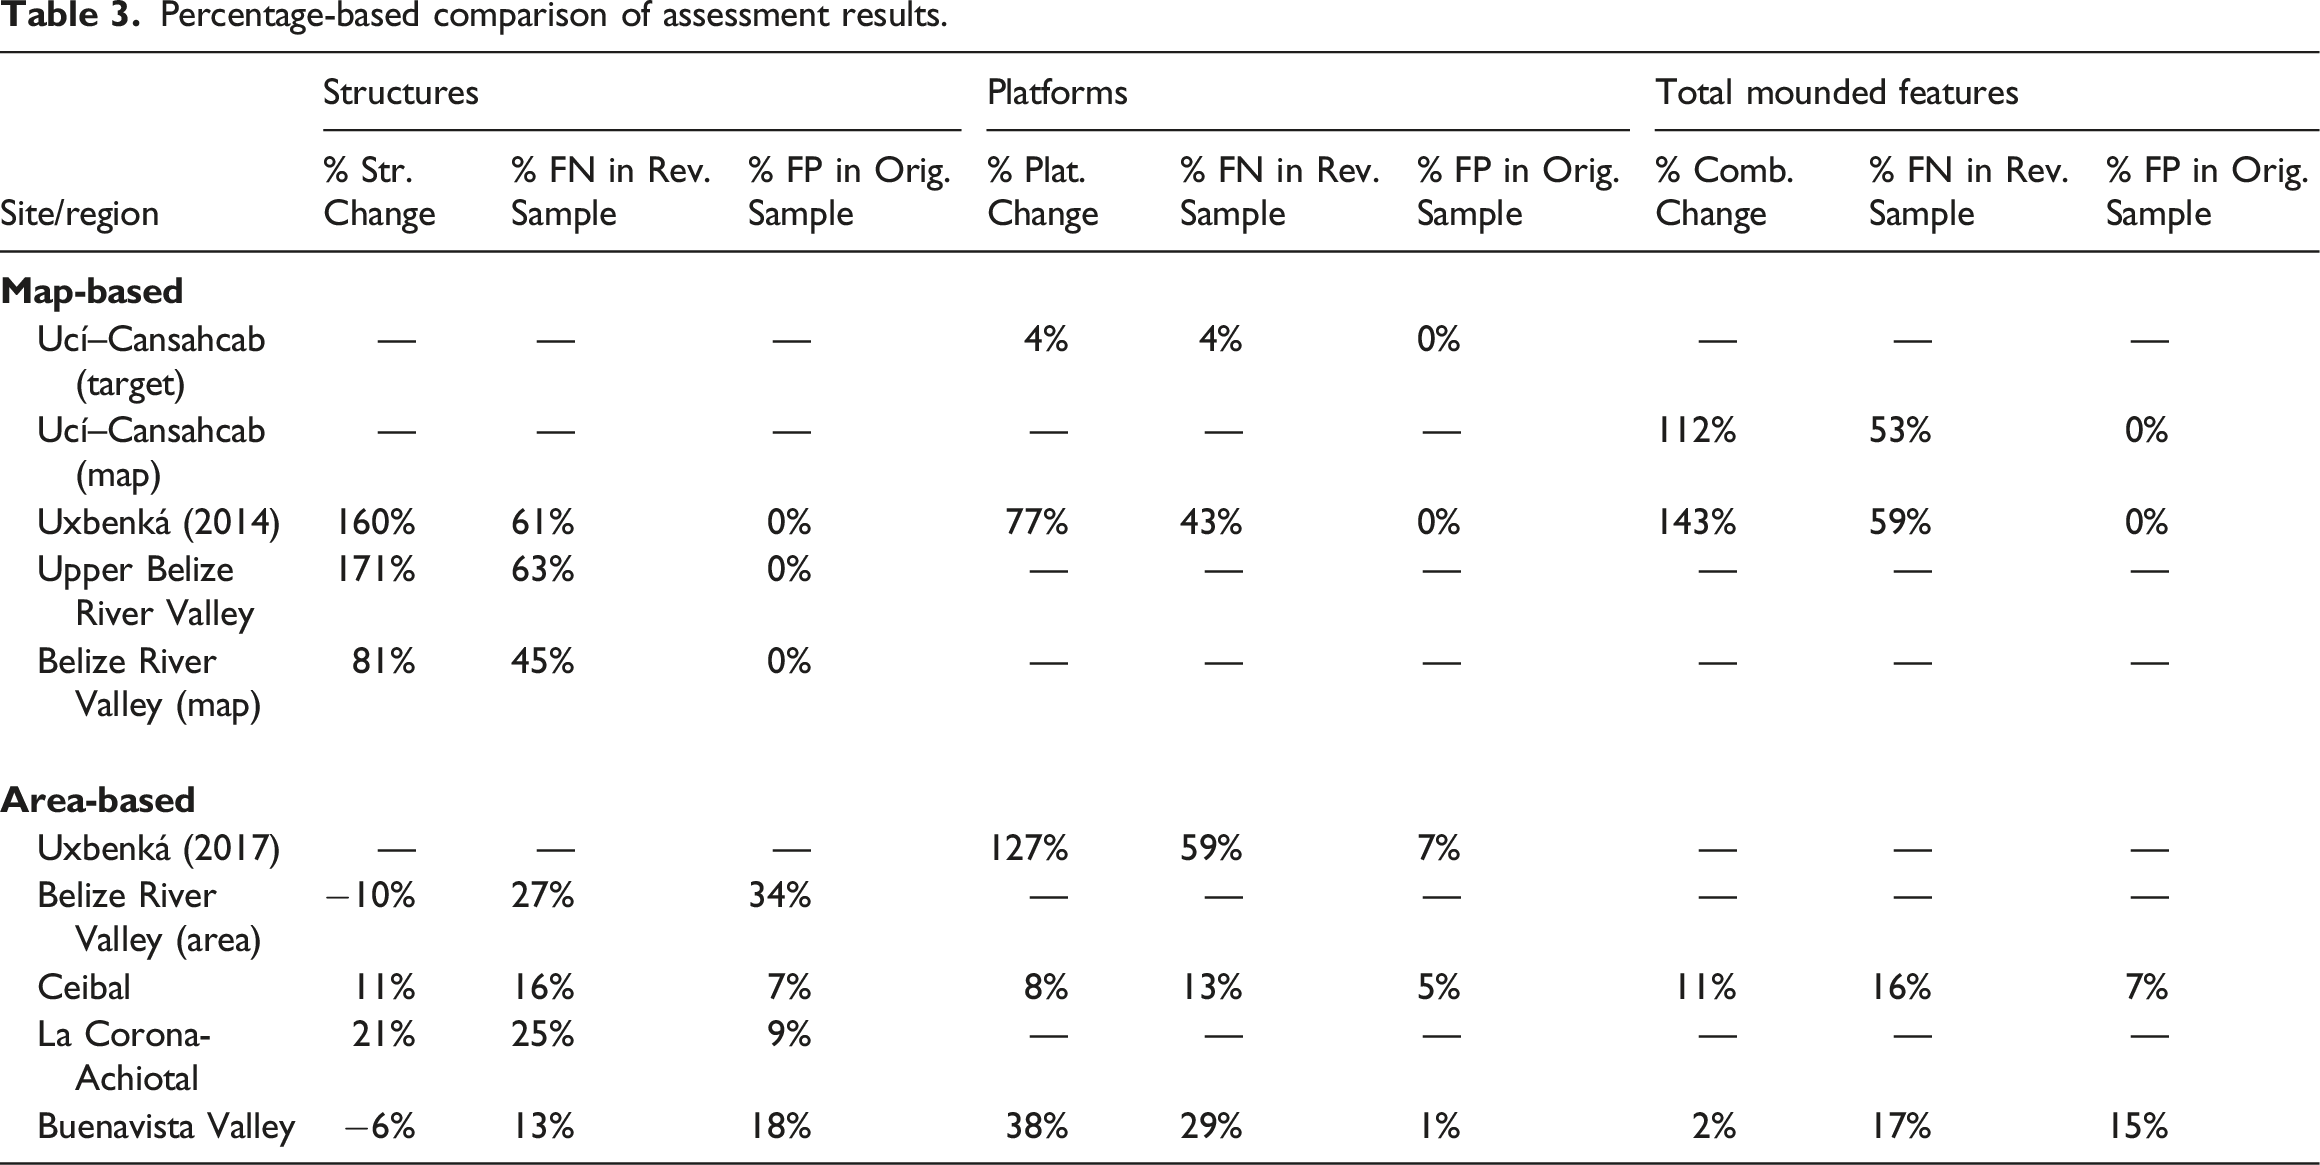
Most of the studies highlighted thus far focus on human visual classification of archaeological features. Hutson (2015) and Thompson (2020) highlight the utility of different visualization techniques to aid in detecting a range of archaeological features. Even so, manual classification remains a subjective enterprise where individual experience with both lidar and field survey affect how data are interpreted (Hutson, 2015: 260). It is important to note that any assessment of manually classified features is essentially limited to evaluating the individual researcher or research team’s capacity to interpret lidar data, further complicating broader comparisons. This is why automated classification will be important moving forward, as it has the potential to reduce subjectivity. Ebert and colleagues (2016) used Topographic Position Index (TPI) in combination with manual adjustments for data in the Belize River Valley as an early example of automated classification of structures. Thompson (2020) used TPI in combination with manual classification of simple low-relief models (SLRM) in a hybrid approach to classifying platforms in an update to the earlier map-based assessment at Uxbenká (Prufer et al., 2015). Table 3 shows that in a map-based approach, the Belize River TPI outperformed the Uxbenká hybrid approach with a lower percentage increase between the original and revised classifications (81 vs 127 percent), and a lower percentage of false negatives (45 vs 59 percent) contributing to the revised totals.
Thompson (2020) generated her classification without reference to existing surveys and then used mapped areas as an independent check against the data, allowing her to detect both false positives and false negatives in a partially area-based method. When a small subset of the Belize River classification was also subjected to an area-based assessment (Ebert et al., 2016), the comparison showed different strengths to the two models. The Belize River still had a much lower false negative rate (27 vs 59 percent) but exhibited almost five times the false positive rate (34 vs 7 percent) than that seen for Uxbenká. Again, variations in methods complicate a satisfactory explanation. In other areas with extensive ground-truthing, platform identification is generally more reliable than for smaller structures (Inomata et al., 2018), which could explain the greater false positive rate for structures in the Belize Valley. The high false negative rate at Uxbenká likely relates to the thick vegetation cover in fallow milpas that obscures even large platforms. Given the limited precision and recall of TPI-based models, the next step likely for automated feature classification in lidar will be the implementation of deep learning (DL) models. Two small-scale (<200 km2) studies have already been published for Uaxactun (Bundzel et al., 2020) and Chactún (Somrak et al., 2020), but neither report provides a quantitative assessment of the field verification for the training datasets used in their neural network models. Only verified training data should be used in machine and deep learning models to maximize their effectiveness, especially given that archaeological datasets fall well short of the millions of examples that would ideally be provided for training (Somrak et al., 2020: 8). New DL-models are being published rapidly, including point cloud-based classifications (e.g., Richards-Rissetto et al., 2021), and hold the greatest promise for interpreting large datasets and making broader comparisons, by eliminating inter-analyst bias while simultaneously being able to rapidly classifying thousands of square kilometers of data.
As the use of lidar in the Maya region has progressed, so have sensor technology and assessment methods. The most thoroughly reported lidar assessments published for the Maya Lowlands are those undertaken by Inomata and colleagues (2017, 2018) around Ceibal, Guatemala. Unlike the previously discussed studies, the Ceibal data were the first collected using the newer Titan sensor. The Ceibal feature classification accuracy assessments were performed for both vegetation variability (Inomata et al., 2017: Table 5; Inomata et al., 2018: Table 7) and cultural and geological zones (Inomata et al., 2018: Table 5). They also present standard classification accuracy assessment metrics like omission and commission error percentage (inverses of these percentages are referred to as producer accuracy and user accuracy respectively). In addition to using existing mapping data for assessment, the Ceibal team systematically surveyed three small areas and performed searches for features in the immediate (unquantified) areas of ground-truthing targets. This partial area-based approach revealed a number of false negatives (175 structures, 13 platforms), and Inomata and colleagues (2018: 29) recognized the need for more rigorous analysis of omission errors.
Another recent assessment of Titan data that employs an area-based ground-truthing approach comes from the region around La Corona, Guatemala (Canuto and Auld-Thomas, 2021). Both La Corona and the Buenavista Valley are part of PLI and, therefore, use similar ground-truthing methods—area-based reconnaissance of 500 × 500 m blocks to confirm features and identify both omission and commission errors. The PLI projects highlight the utility of using the same methods and approaches for lidar classification and ground-truthing, resulting in comparable survey results. The La Corona study only presents total results for the ground-truthing of structures, although it is clear that they are also verifying platforms in the field (Canuto and Auld-Thomas 2021: 7, Table 1). Canuto and Auld-Thomas (2021: 7) advocate for an iterative approach to classification and ground-truthing in which false negatives are reassessed against lidar, following field verification. The data used here in Table 2 comes from their original classification to make it more comparable to other studies.
3.2 Feature classification assessment in the Buenavista Valley, Guatemala
In 2017, the Proyecto Arqueológico El Zotz (PAEZ) received 150 km2 of Titan lidar data over the Buenavista Valley of northern Guatemala—a subset of the 2144 km2 of data acquired by NCALM for PLI (Figure 2). The Buenavista Valley links the ancient Maya kingdoms of Tikal and El Zotz, but is also the setting for a number of other important sites, such as El Palmar, Bejucal, and La Cuernavilla. The data were gridded into 500 × 500 m blocks with structures and platforms classified by Garrison and other features classified by Garrison, Baldwin, and Omar Alcover Firpi. Beginning in 2018, Baldwin and Cambranes began area-based ground-truthing of classified features. They led their teams over the same area for the first four days to reduce interobserver bias (Reese-Taylor et al., 2016: 335), then Baldwin’s team worked for five days alone, and Cambranes’ team worked for 13 days alone for a total of 22 “team days” of reconnaissance in 2018. The following field season, the two teams worked for 30 team days. Each team could cover just over two survey blocks per day and in two seasons covered just over 29 km2. The lidar data and the feature classification points were loaded onto Trimble Juno 5B GPS units and points were taken to verify features, and record errors (Figure 3). Buenavista Valley, Guatemala, showing archaeological sites and PAEZ lidar coverage outlined in red (map by T. Garrison/Pacunam). Rafael Cambranes (foreground) leading a ground-truthing team in the Buenavista Valley (photo by J. D. Baldwin/PAEZ).

To assess the feature classification against the lidar, a 100 km2 subset (66.6 percent of total area) of the data were selected (Figure 4), corresponding to the original polygon requested from NCALM and removing edge data with no lateral overlap that do not necessarily meet the survey design standards. The analyzed subset included 22.7 km2 of ground-truthed area (77.7 percent of total area ground-truthed). In addition to the structures and platforms recorded in Table 2, ground-truthing also assessed 22 percent (n = 13) of classified aguadas and 15 percent (n = 163) of classified quarries. Aguadas are natural depressions where water accumulates in the Lowlands and were frequently modified by the Maya to enhance their storage capacity. These contrast with reservoirs that are created by deliberate architectural construction of a collection basin or dam to collect water, often in monumental site cores. Quarries are locations where geological resources were mined, and here refer exclusively to limestone quarrying for construction material. Buenavista Valley lidar coverage, analysis subset, and ground-truthing area showing the original structure and platforms feature classification (map by T. Garrison/Pacunam).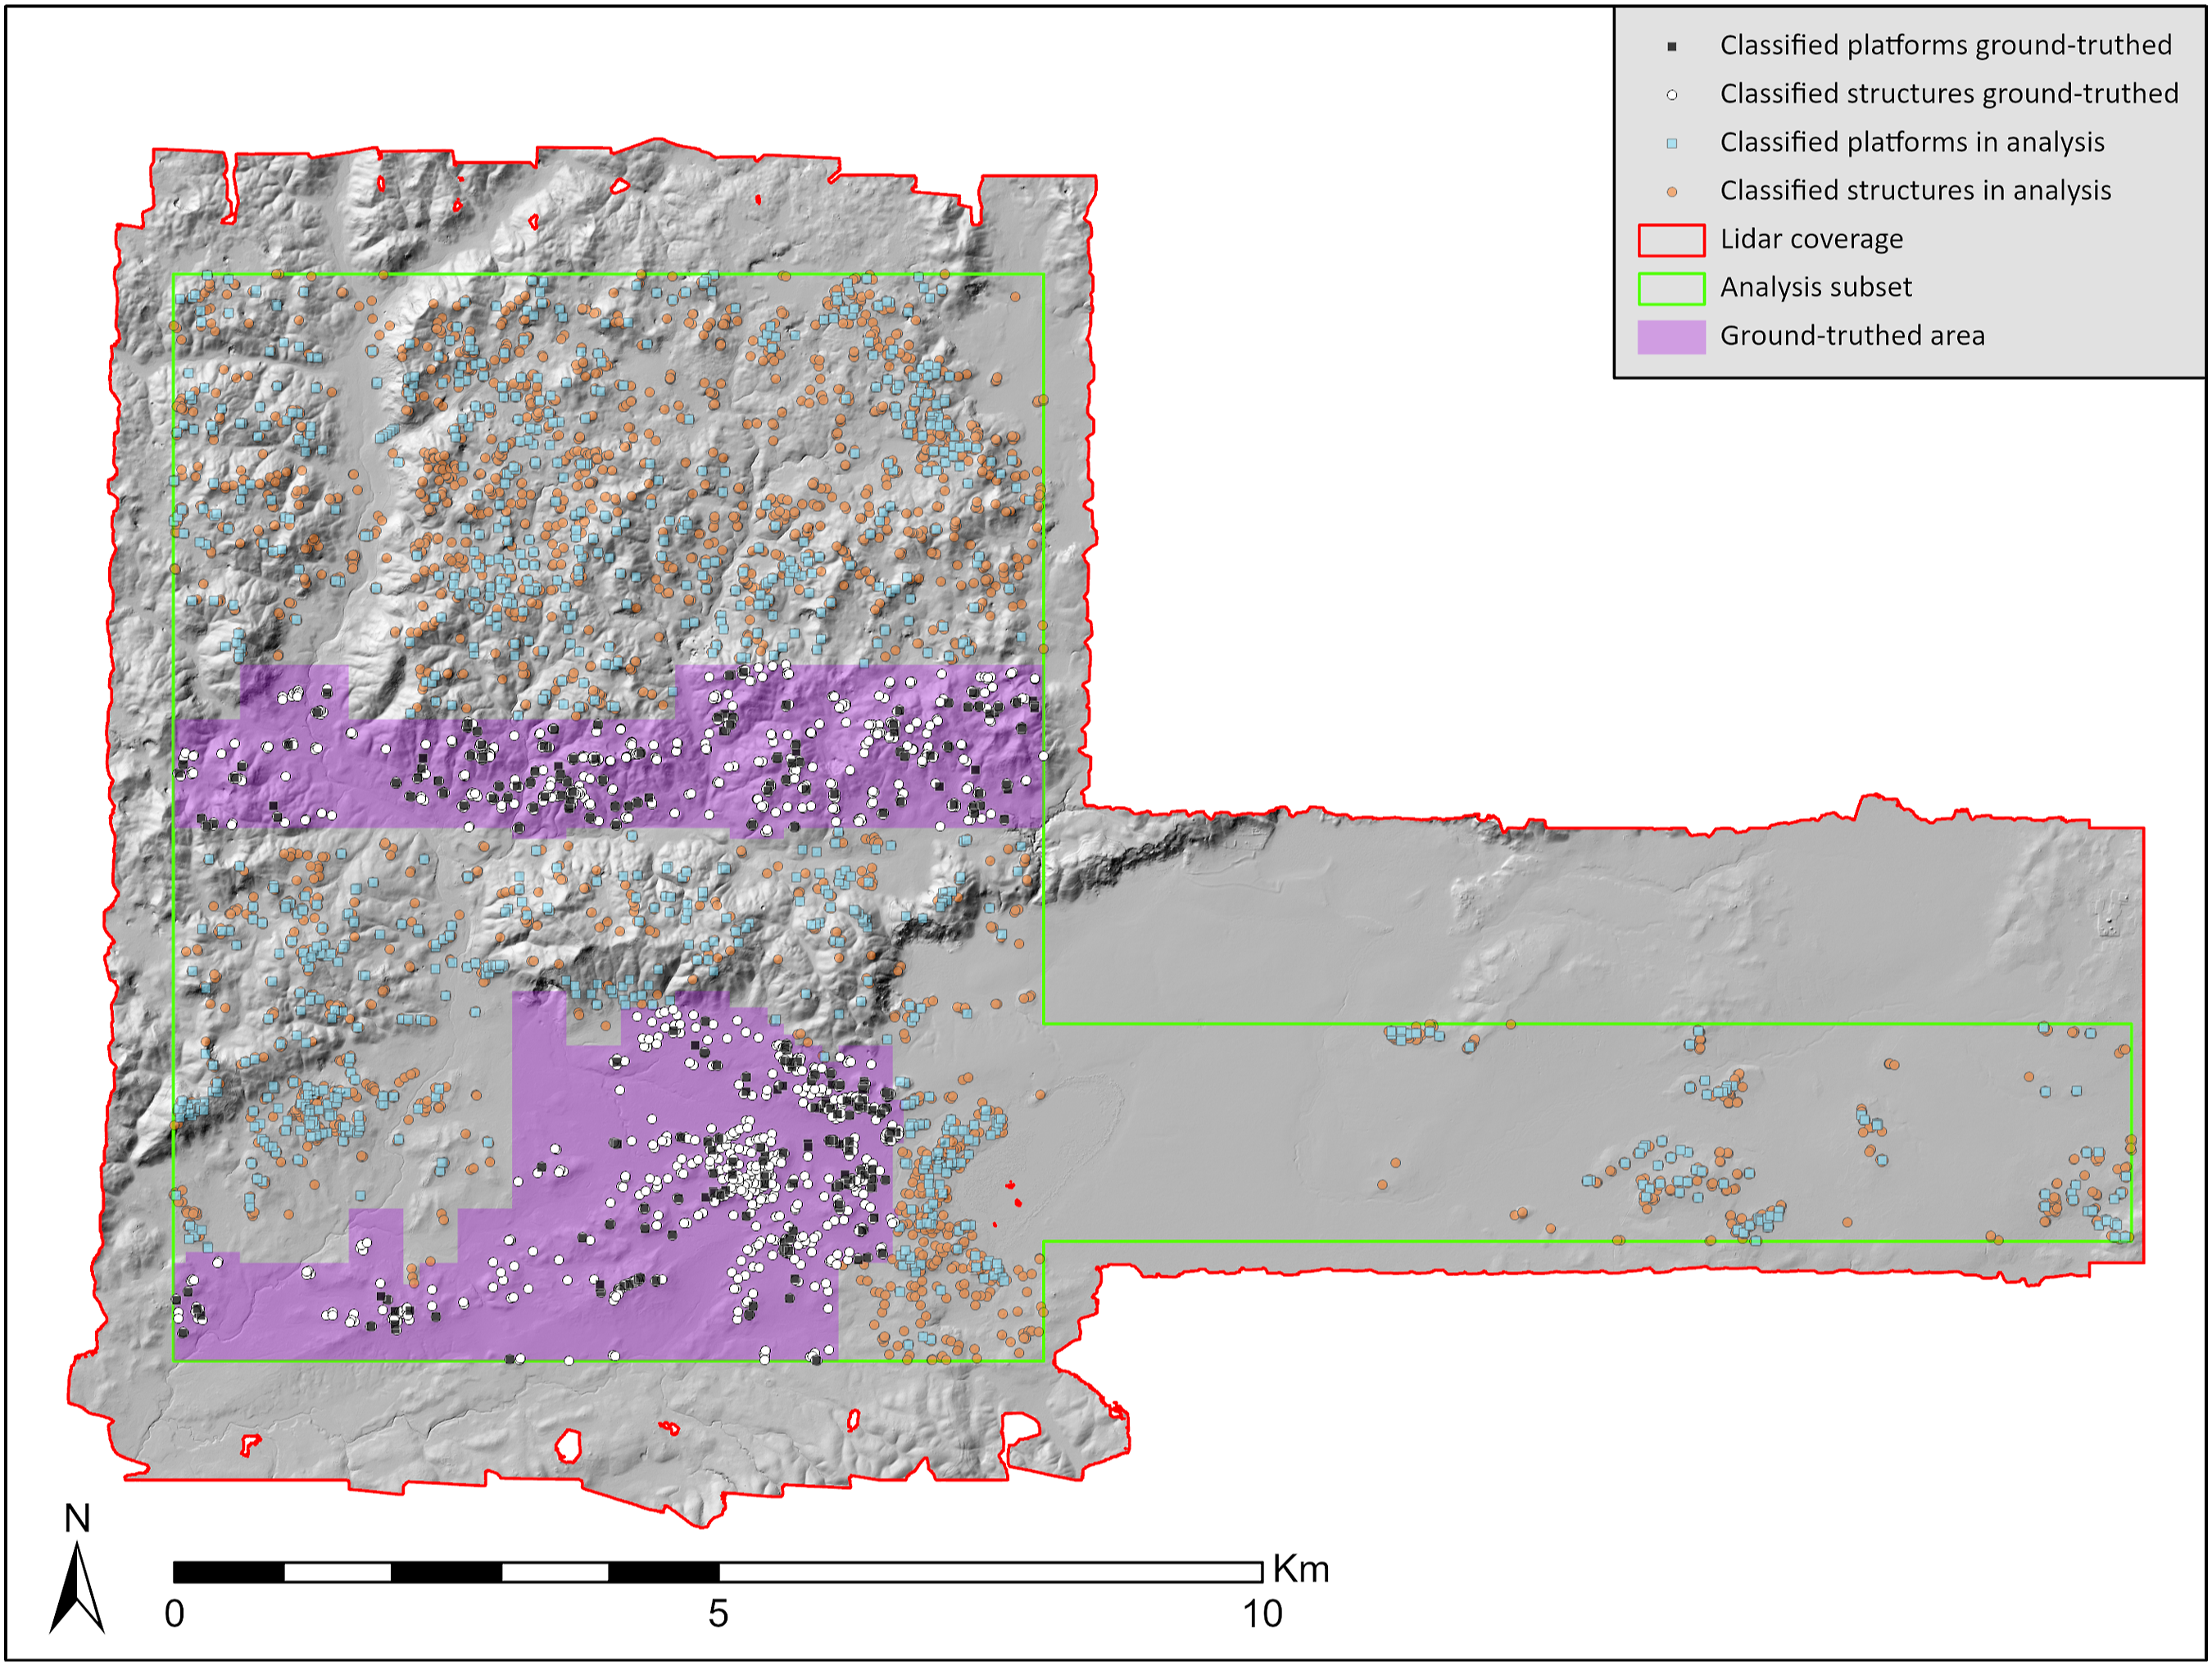
Assessment and accuracy data for the Buenavista Valley lidar.

The relatively low producer accuracy for platforms (71 percent) is mostly accounted for by misclassification of some platforms as structures. According to PAEZ definitions, a mound raised on four sides is only a platform if there is clear evidence of superstructural remains. If no superstructure is present, it is classified as a structure. It can be difficult to discern small superstructures in lidar and so ground-truthing often led to discovery of these and the need to reclassify the originally classified structure as a platform. When platform and structure classes are combined as “Total Mounded” features the producer and user accuracies balance to 86 and 88 percent, respectively. However, when the distribution of classification errors is plotted on the lidar, it is clear that different types of error occurred depending on whether the ground-truthing was in the rolling karst uplands north of the Buenavista Valley or in the valley bottom itself (Figure 5). Distribution of classification errors following ground-truthing of upland and lowland areas of the Buenavista Valley lidar (map by T. Garrison/Pacunam).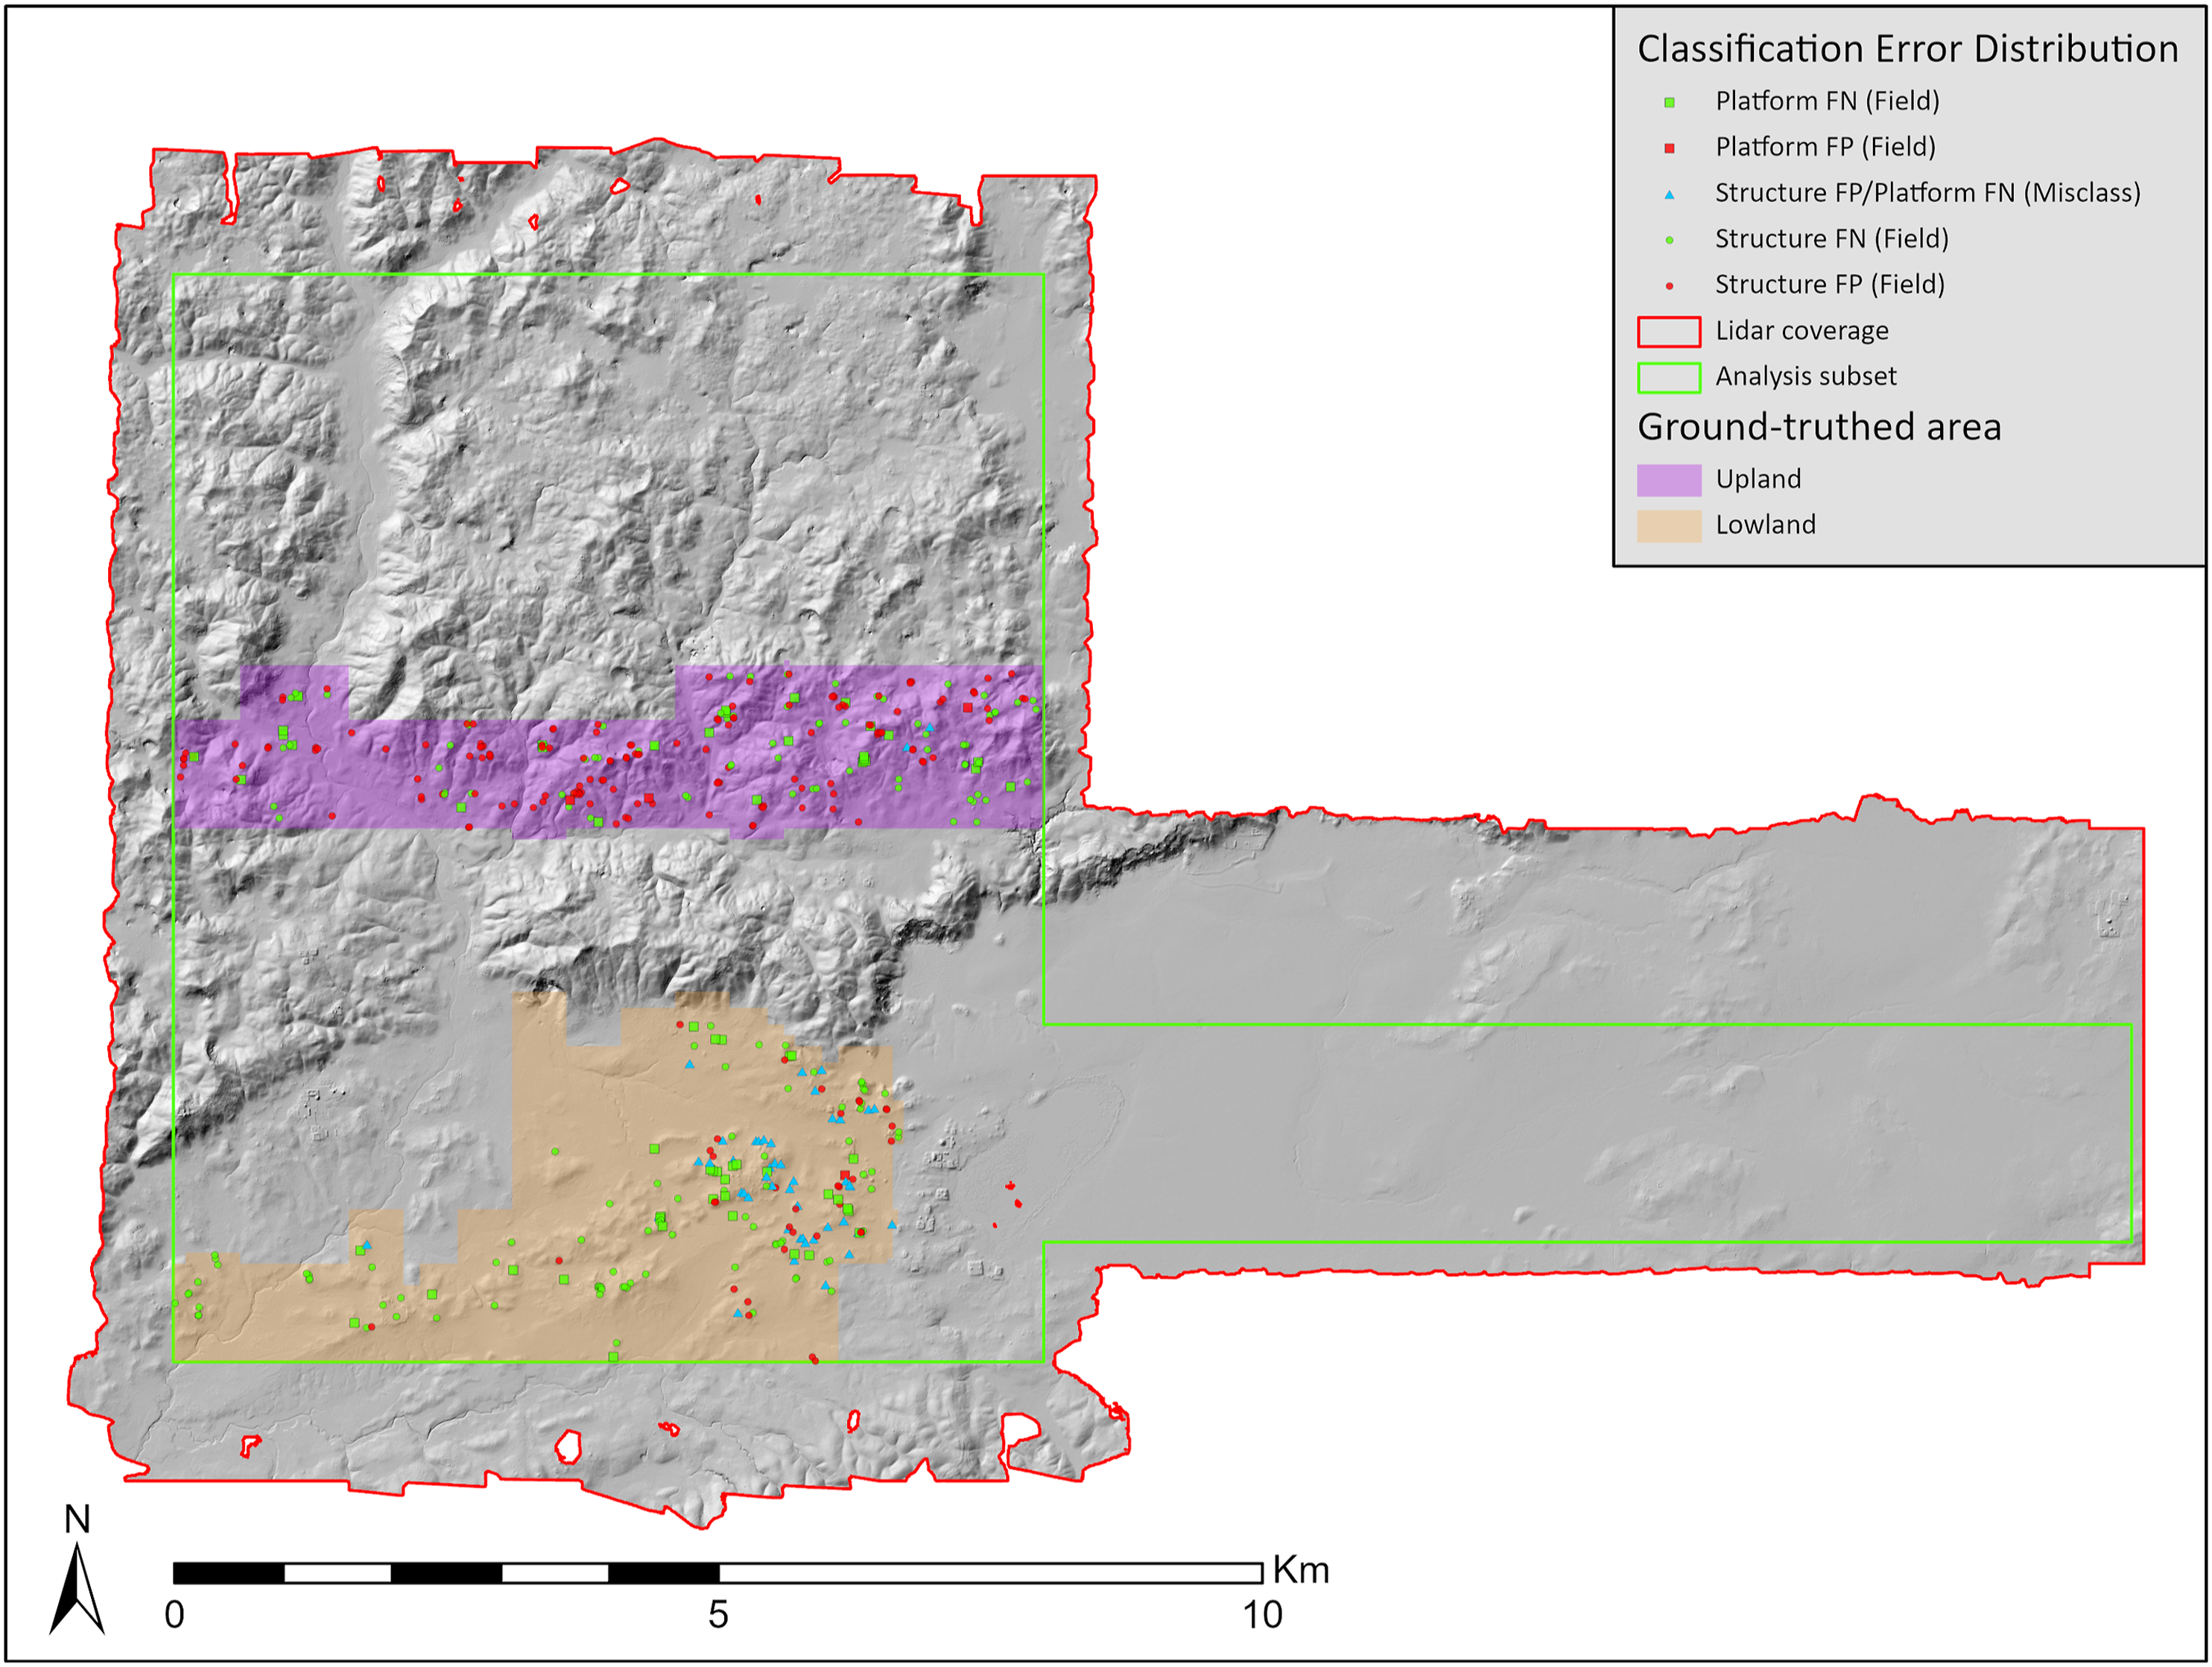
Buenavista Valley lidar assessment by terrain with producer and user accuracy assessments.
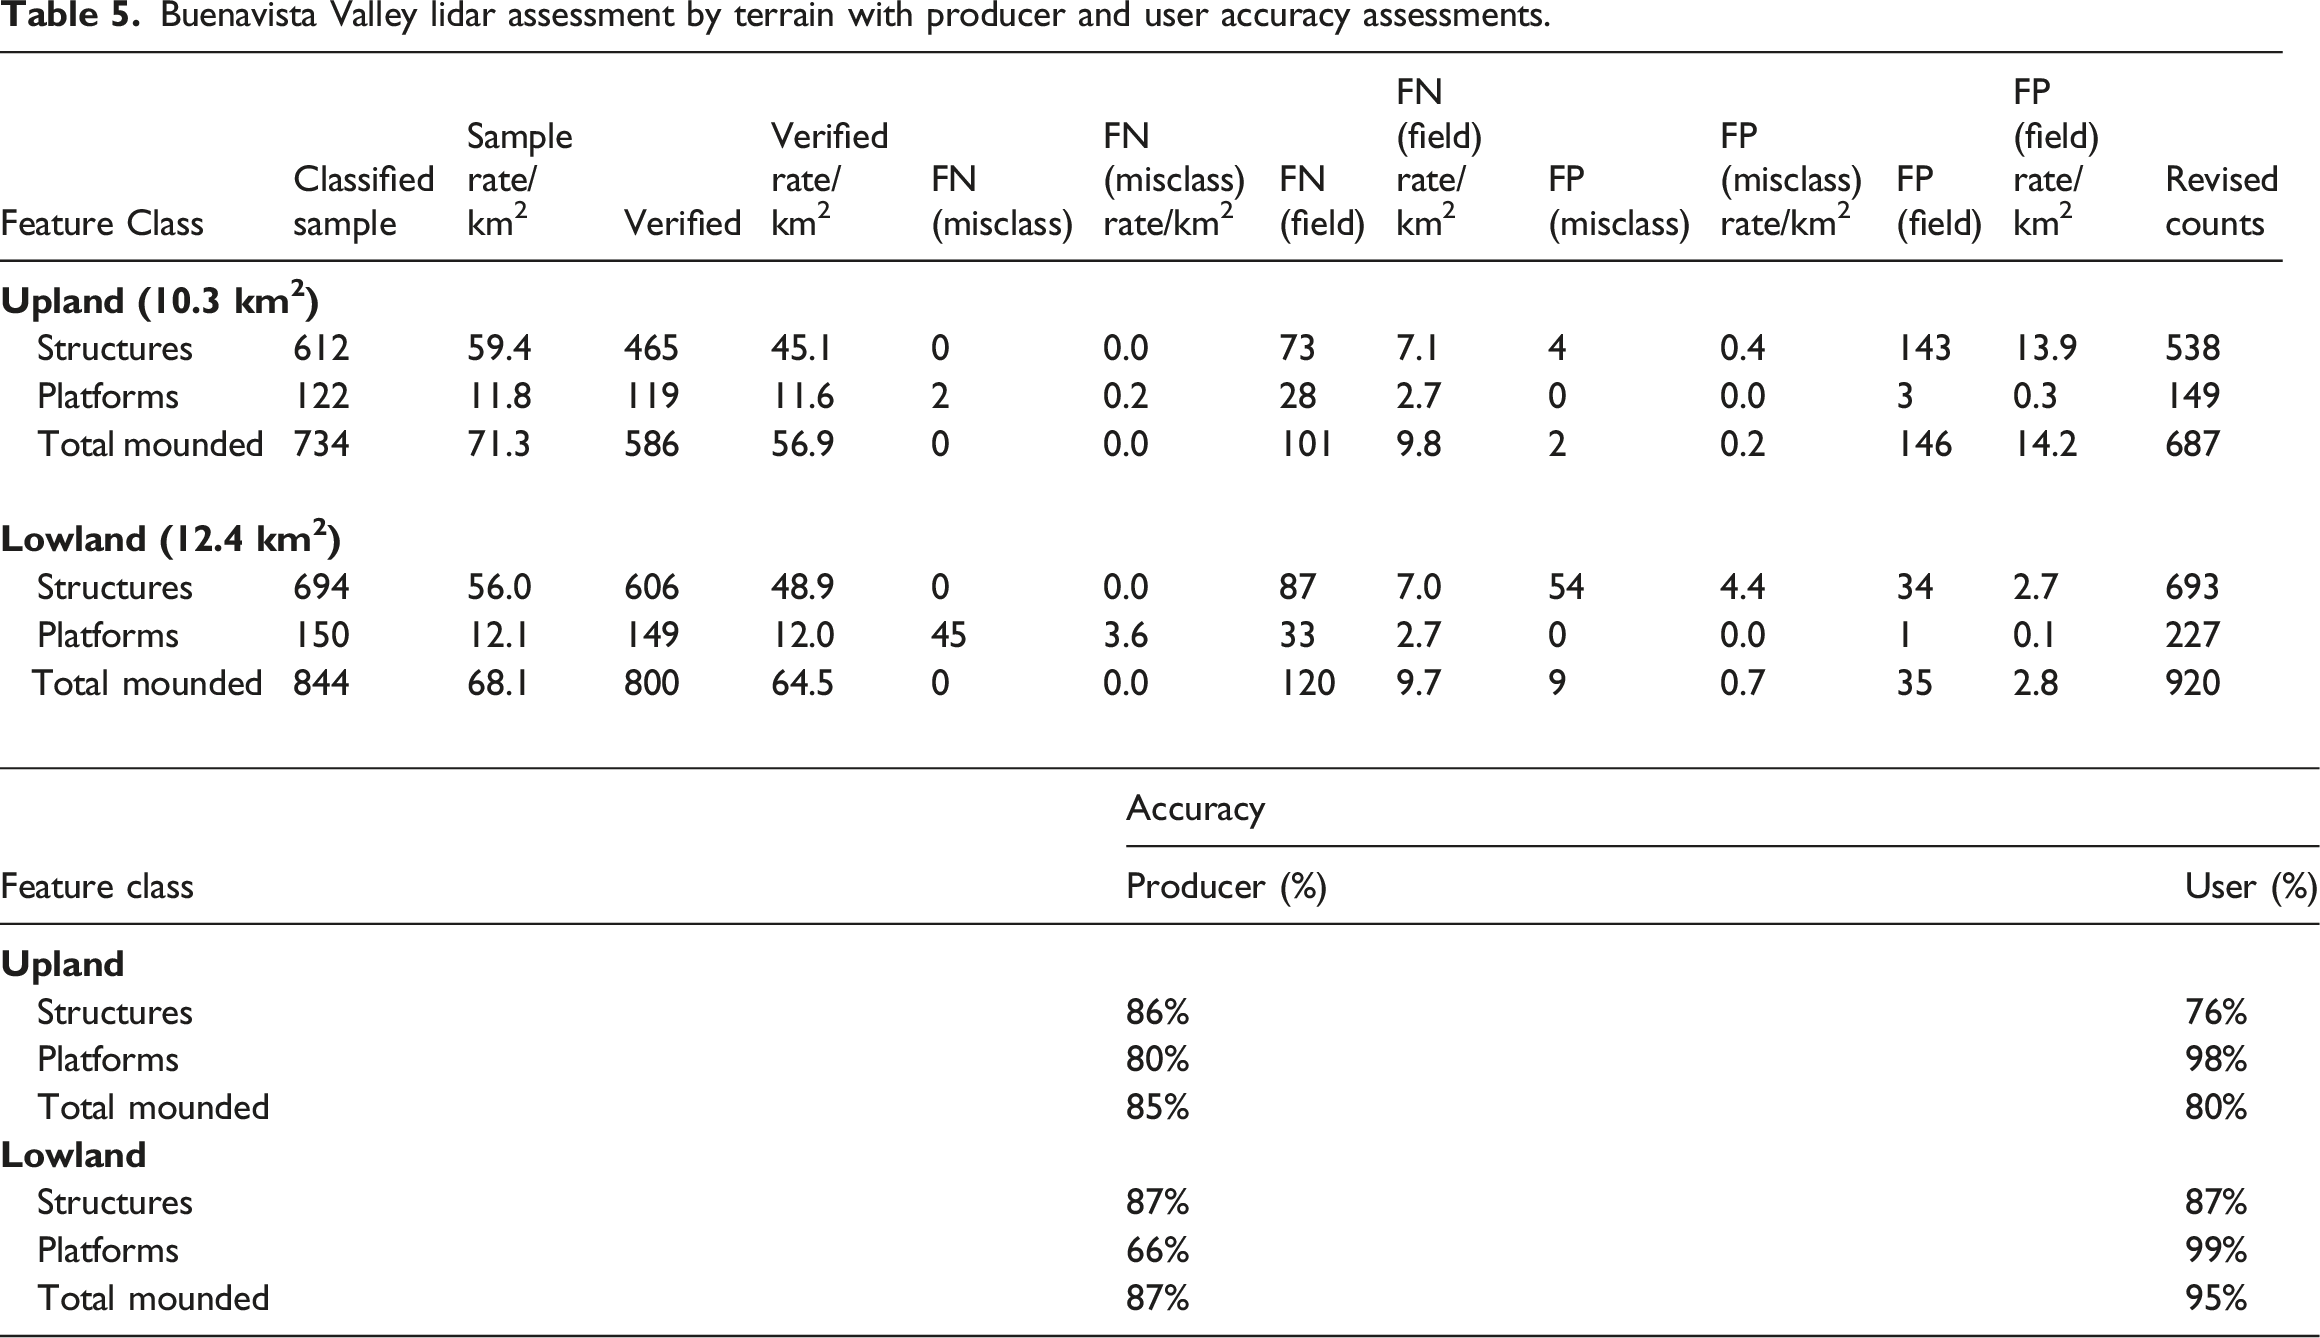
The two error patterns detected in the Buenavista Valley data require different solutions. For false positives of upland structures, the ground-truthing data might be used to justify a modification to the estimated structure count in similar terrain across the analysis subset. It would be better to do this by comparing the errors against something like the Terrain Ruggedness Index (TRI) (Riley et al., 1999) so that extrapolation of the area where these false positives are most likely to occur can be performed systematically. For the lowland structure misclassification error, combining platforms and structures into “Total Mounded” features provides satisfactory producer (87 percent) and user (95 percent) accuracies, but the utility of using such a combined category to answer broader questions regarding settlement and demography may be limited. The error is almost exclusively present in Preclassic settlement. The morphological differences between Preclassic and Classic mounds has been noted in lidar for both the Buenavista Valley (Garrison et al., 2019) and the Upper Belize River Valley (Yaeger et al., 2016). One could perform separate accuracy assessments based on features from the two different periods or consider changing the criteria for defining structures and platforms for Preclassic settlements, perhaps using basal area or volumetric data. There is great value in studying the geographical and methodological impacts on classification error distribution. Such analyses should be made explicit and brought to bear on how statistics like structure or platform densities are reported for an individual dataset before data are contributed to comparative studies across multiple sites or regions.
3.3 Comparing accuracy assessments of feature classifications in the Maya Lowlands
Comparison of accuracy of lidar classifications grouped by ground-truthing strategy and feature class.

Among the area-based platform studies, Thompson’s (2020) Uxbenká work is comparable to the others in terms of user accuracy, but the low producer accuracy, likely relating to unique vegetation challenges and possibly Gemini sensor capabilities, make those data difficult to use in comparison with the Ceibal or Buenavista Valley results. The Buenavista Valley data had a substantially lower producer accuracy for platforms than Ceibal (71 vs 87 percent). This was partly due to misclassification errors at El Palmar where Preclassic mound morphology disproportionately affects the accuracy of platform classification in the lowland valley. However, the upland producer accuracy in the Buenavista Valley is still only 80 percent as ground-truthing confirmed more subtle platforms in the rugged terrain than could be distinguished from natural karstic surface irregularities in the lidar. This pattern, combined with Ceibal’s slightly different ground-truthing methodology, must be taken into consideration before comparing platform counts from the two regions. In the end, the type of comparisons that can be made across datasets will depend on the research questions posed. When structure and platform data are combined, Ceibal has very high producer and user accuracies. When the Buenavista Valley data are combined and adjusted for misclasses, especially in the lowlands, they approximate the accuracy of the Ceibal results (±5 percent). Comparison of such combined results may be useful in studies of architectural volumetrics in the two regions, especially in connection to resource availability. The important thing is that archaeological feature classifications are rigorously assessed in area-based approaches that record both false positive and false negative errors, and that the errors themselves are explored both quantitatively and spatially to explain variations across regions and datasets.
IV Conclusions and future directions
This article focuses on assessing archaeological feature classifications in lidar data and how the methods that are chosen can greatly impact accuracy results. There is a push right now to begin broader comparative studies of the Maya using lidar data acquired by different sensors and analyzed using different methods. These are by no means the only hurdles being faced in lidar research in the Maya Lowlands, with data access perhaps being paramount from an academic perspective. This is a complex issue rife with disagreements between the various governmental, institutional, and individual stakeholders of each dataset. While we advocate greater scholarly access to lidar data in our position as academics working in a scholarly context that celebrates open access data, there is a broader discussion to be had around this issue that exceeds the scope of this article. We feel that by addressing some of the inconsistencies in how archaeological features are classified and assessed, the field can move toward more comparative research while debates about data accessibility continue.
The lidar-based research programs briefly reviewed and compared here focus on the classification of archaeological features, and more narrowly on ancient mounded features, distinguished as structures and supporting platforms. There are multiple geographic investigations that can be completed with these same datasets to better understand the environments in which archaeological features are found and enhance multidisciplinary research. In the Buenavista Valley, terrain ruggedness is clearly impacting classification. Further studies on terrain can provide insight on water availability, soil depth, geomorphological features, and present vegetation cover. Topographic metrics, including elevation, slope, topographic heterogeneity, terrain curvature, geomorphic transience, aspect, and categorical landform characterization (Amatulli et al., 2018) complement archaeological studies through contextualization of the physical landscape in a given area, which can be used to inform analyses of ancient urban planning, visibility, subsistence strategies, and access to resources. Similarly, vegetation metrics are useful toward understanding the past and present biotic landscapes. The available vegetation assessment categories from lidar data include canopy height, canopy openness, internal heterogeneity, external heterogeneity, and vegetation area (Roussel et al., 2022; Zhang et al., 2017). Some recent, rapid advancements in remote sensing include terrestrial lidar (e.g., Garrison et al., 2016; Weber and Powis, 2014) and UAV-based reconnaissance (e.g., Schroder et al., 2021). There has been a surge of research using terrestrial lidar and drones to solve localized geographic problems, such as hyperspectral imaging of vegetation (Tang and Shao, 2015), laser bathymetry of water depth, and precise mapping of small watersheds (Resop et al., 2019). All of these techniques can occur at smaller survey scales and at a fraction of the operational cost of traditional crewed aircrafts. The multidisciplinary integration of lidar-based archaeological research with geographic methods for quantifying and describing the landscapes recorded in remote sensing data will help provide better context for feature classification assessments, error analysis, and eventually complex DL model building.
The studies compared in this article build a foundation for future lidar-based Maya research and simultaneously shed light on the key challenges of using such data in the tropics, providing insights into how we can improve assessments and discussions of lidar for archaeology, geography, and beyond. Moving forward, Mayanists should strive towards some common goals in data classification and assessment in order to open up broader opportunities for accurate comparative research. First, we need clear definitions of what is being assessed and why, including detailed descriptions of the feature classification methods and ground-truthing methods. The comparison of assessment studies presented in this article show how widely results may vary depending on the methods chosen. Second, the study area and number of features classified and ground-truthed should be published in accessible literature as a minimum standard for reporting assessment data. We must amplify the need for detailed accuracy assessments and reporting appropriate to the scale of analysis, including the presence of both false negatives and false positives (Horn and Ford 2019), and rigorously analyzing errors quantitatively and spatially to refine classifications. Finally, the classification and verification data would ideally be compared against a DEM confidence map (Štular et al., 2021). While not performed yet in a Maya lidar classification assessment, this step would provide a metric of how archaeological feature classification relates to the original point classification; and recognition that lidar data quality can vary widely even within a small collection. Such comparisons may help explain some of the patterns in classification errors. This methodological uniformity will not occur without dedicated collaboration and interchange of ideas across disciplinary and international boundaries. Once achieved, however, new avenues into a comparative regional understanding of the ancient Maya will finally be attainable.
Footnotes
Declaration of conflicting interests
The author(s) declared no potential conflicts of interest with respect to the research, authorship, and/or publication of this article.
Funding
The author(s) received no financial support for the research, authorship, and/or publication of this article.