
Abstract
Formulating ecological restoration strategies requires accurately quantifying how climate and anthropogenic factors influence net primary production (NPP). A Carnegie-Ames-Stanford approach (CASA) model was applied to estimate China’s terrestrial NPP from 2001 to 2020. We adopted a random forest (RF) method to identify the main driving forces for NPP change in China. Total NPP in China increased noticeably with a 24.91 Tg C/yr rate, as shown in our results. The significantly increased NPP was mainly attributed to human activities (64.29 ± 0.17%), chiefly due to human management and ecological projects (afforestation or other) fostered vegetation growth. The primary drivers of NPP variation varied in different geographic regions. Climate dominated the NPP dynamic in north China (52.38 ± 0.91%), where the main factor that restricted the increase of NPP was precipitation. Human activities strongly impacted the NPP variation in the remaining regions. Human management measures increased NPP in northwest and southwest China. In the northeast, east, and south-central China, the NPP change resulted from land use change, primarily grassland, cropland, and forest change. Collectively, our study expands the understanding of the driving forces of NPP change, informing different strategies for achieving ecological restoration and carbon neutrality.
Introduction
Vegetation is the primary component of terrestrial ecosystems. Its photosynthesis and evapotranspiration are crucial in climate change mitigation and global carbon balance regulation (Wang et al., 2020b; Zhang et al., 2022b). Net primary productivity (NPP) refers to the production of organic matter accumulated through vegetation photosynthesis at a given time (Potter et al., 1999a; Zhao and Running, 2010) and reflects vegetation’s net carbon uptake. NPP can represent the capacity of vegetation carbon sequestration and play an indicative role in identifying ecosystem carbon sources/sinks and regulating carbon balance (Nemani et al., 2003; Zhao and Running, 2010). Thus, the study of NPP dynamics would be of great significance for figuring out the carbon sequestration potential of vegetation and the carbon cycle mechanism.
Vegetation is susceptible to the surrounding environment. Natural and anthropogenic factors can profoundly impact the pattern of NPP in magnitude and variation. Such factors may include climatic conditions, topographic features, soil properties, and human activities, which numerous studies supported (Baartman et al., 2018; Li et al., 2018, 2021b; Peng et al., 2020; Wieder et al., 2015). Especially in the compounded stress of human disturbance and climate change, the stability of terrestrial ecosystems decreased, and vegetation NPP varied more dramatically (Chen et al., 2020b; Frank et al., 2015). The variation patterns and driving mechanisms of NPP differed significantly across various regions (Liu et al., 2021b; Nanzad et al., 2021). There remain substantial uncertainties in identifying variation patterns of vegetation NPP and their driving mechanisms on regional scales (de Jong et al., 2012). Consequently, a comprehensive analysis of spatiotemporal NPP dynamics in regional scales and the response to natural and human factors is imperative. This is an essential foundation for understanding the carbon cycle mechanism and addressing global changes, and it also provides scientific support for policymaking regarding regional ecosystem management.
China boasts an expansive landmass characterizing a diverse range of landforms and climates, affording the living of all global vegetation types except the polar tundra. The terrestrial ecosystems of China are abundant and distinct, with an enormous carbon sink potential. Since the mid-20th century, China has been a rapid growth in both population and economy. Unfortunately, development-oriented activities have adversely impacted the natural environment. Besides, the magnitude of carbon emissions from China has reached unprecedented levels, which enhanced climate change (Chao et al., 2023; Fang et al., 2018; Friedlingstein et al., 2020). China has taken steps since the 1980s to tackle environmental problems and climate change, for example, eco-restoration projects, eco-civilization construction, and dual carbon target (Liu et al., 2008; Lu et al., 2018; Mallapaty, 2020). According to some studies, these measurements improved the environment and promoted ecosystem carbon sequestration (Lu et al., 2018; Ouyang et al., 2016; Piao et al., 2009; Wang et al., 2020a). In conclusion, the NPP dynamics in China were complex and reflected the combined influence of many factors. There remain uncertainties in characterizing the variation patterns of China’s NPP and their driving mechanisms. Therefore, assessing the NPP dynamics and its driving mechanisms in China is essential. This would help understand the global/regional carbon cycle mechanisms and then provide scientific support for policy formulation in terrestrial ecosystem management and climate change adaptation.
Numerous studies have explored NPP variation and its drivers in China from different scales. However, most studies concentrated on significant vegetation types (Bai et al., 2014; Chen et al., 2020b; Zhou et al., 2017a) or vulnerable areas (Feng et al., 2013; Liu et al., 2021c; Niu et al., 2019; Shao et al., 2022; Tong et al., 2018), with limited regional comparisons and nationwide studies. A series of NPP estimation models have been developed since NPP cannot be directly observed. These models can fall into four categories: climate models, light use efficiency models, ecological process models, and coupled ecological remote sensing models (Field et al., 1998; Gitelson et al., 2006; Potter et al., 1993; Potter, 1999b; Running et al., 2004). The CASA (Carnegie-Ames-Stanford approach) model, a light use efficiency model, has been popularly used by scholars to monitor the Chinese NPP dynamics due to its fewer parameter needs and fewer errors (Running et al., 2000; Wang et al., 2010; Wu et al., 2010; Yu, 2020; Yuan et al., 2014). Additionally, there are three most widely used methods for evaluating the impact of climate or human factors on NPP variation. First, the statistical model-based method. This approach analyses the relative contribution depending on the linear correlation between NPP and its influencers (Du et al., 2022; Yang et al., 2017). It is a simple method but cannot portray the complex nonlinear relationship between NPP and its influencers well (Liu et al., 2020; Turner and Carpenter, 2017). Second, the residual trend-based method. This approach estimates the impact of human activities on NPP by the residual between NPP changes simulated without human disturbances and actual NPP changes (Ge et al., 2021; Jiang et al., 2020). There is considerable uncertainty in NPP changes without human disturbances simulated by constructing a climate regression model. Third, the ecological model-based model. This approach uses an ecological model to estimate the potential NPP driven solely by climate change and then compare it with actual NPP to obtain the impact of human activities on NPP (Chen et al., 2020a; Teng et al., 2020). The potential NPP is still uncertain (Jiang et al., 2019; Liu et al., 2021d), and this approach cannot provide a singular contribution of climate (precipitation, temperature and others) or human (land use/cover change) factors on NPP variation. As a final point, these research/research methods mainly explore the impacts of climate change and/or human activities on vegetation NPP. Other factors, such as topographic features and soil properties, are less frequently assessed. Currently, machine learning methods have become popular in portraying the factors influencing vegetation change (Leroux et al., 2017; Shi et al., 2020; Wang et al., 2022b). Machine-learning methods are advantageous in solving nonlinear problems and handling large amounts of data. They could act effectively to discuss the numerous factors influencing the variability of NPP.
As discussed above, this study aims to answer two questions: (i) How has China’s NPP changed over the last 20 years? (ii) What were the main drivers of this NPP variation? Therefore, our first step was to simulate China’s NPP from 2001 to 2020 by applying the CASA model. Then, we analyzed the spatiotemporal patterns of NPP. Finally, we applied a random forest (RF) approach to identify the relative contributions of the three driver categories (climate, human activities, and land surface properties) on NPP variation at national and geographical scales. This study provides new perspectives on driver analyses. We identified the main driving factors of NPP variation in different regions of China and discussed the ecosystem types (forest, grass, or crop) that should be of most significant concern or most suitable for construction in different regions. In the context of dual carbon target, this could serve as a scientific reference for formulating policies regarding terrestrial ecosystem management and climate change adaptation.
Materials and methods
Study area
China lies along the east of Asia, and the east is surrounded by the Pacific Ocean. A high west and a low east characterize this vast country with complex topography. China has complicated and diversified climate types, and the continental monsoon climatic characteristics of the country are apparent. Due to the variety of topography and climate, China’s natural vegetation is abundant and intricately distributed, ranging from forests in humid southeast regions to deserts and grasslands in northwest arid regions and mountainous vegetation on the Tibetan plateau (Pei et al., 2018). Research needs and previous ecological restoration studies in China (Lu et al., 2018) led us to divide the study area into six geographical regions (Figure 1) for further studies. Study area.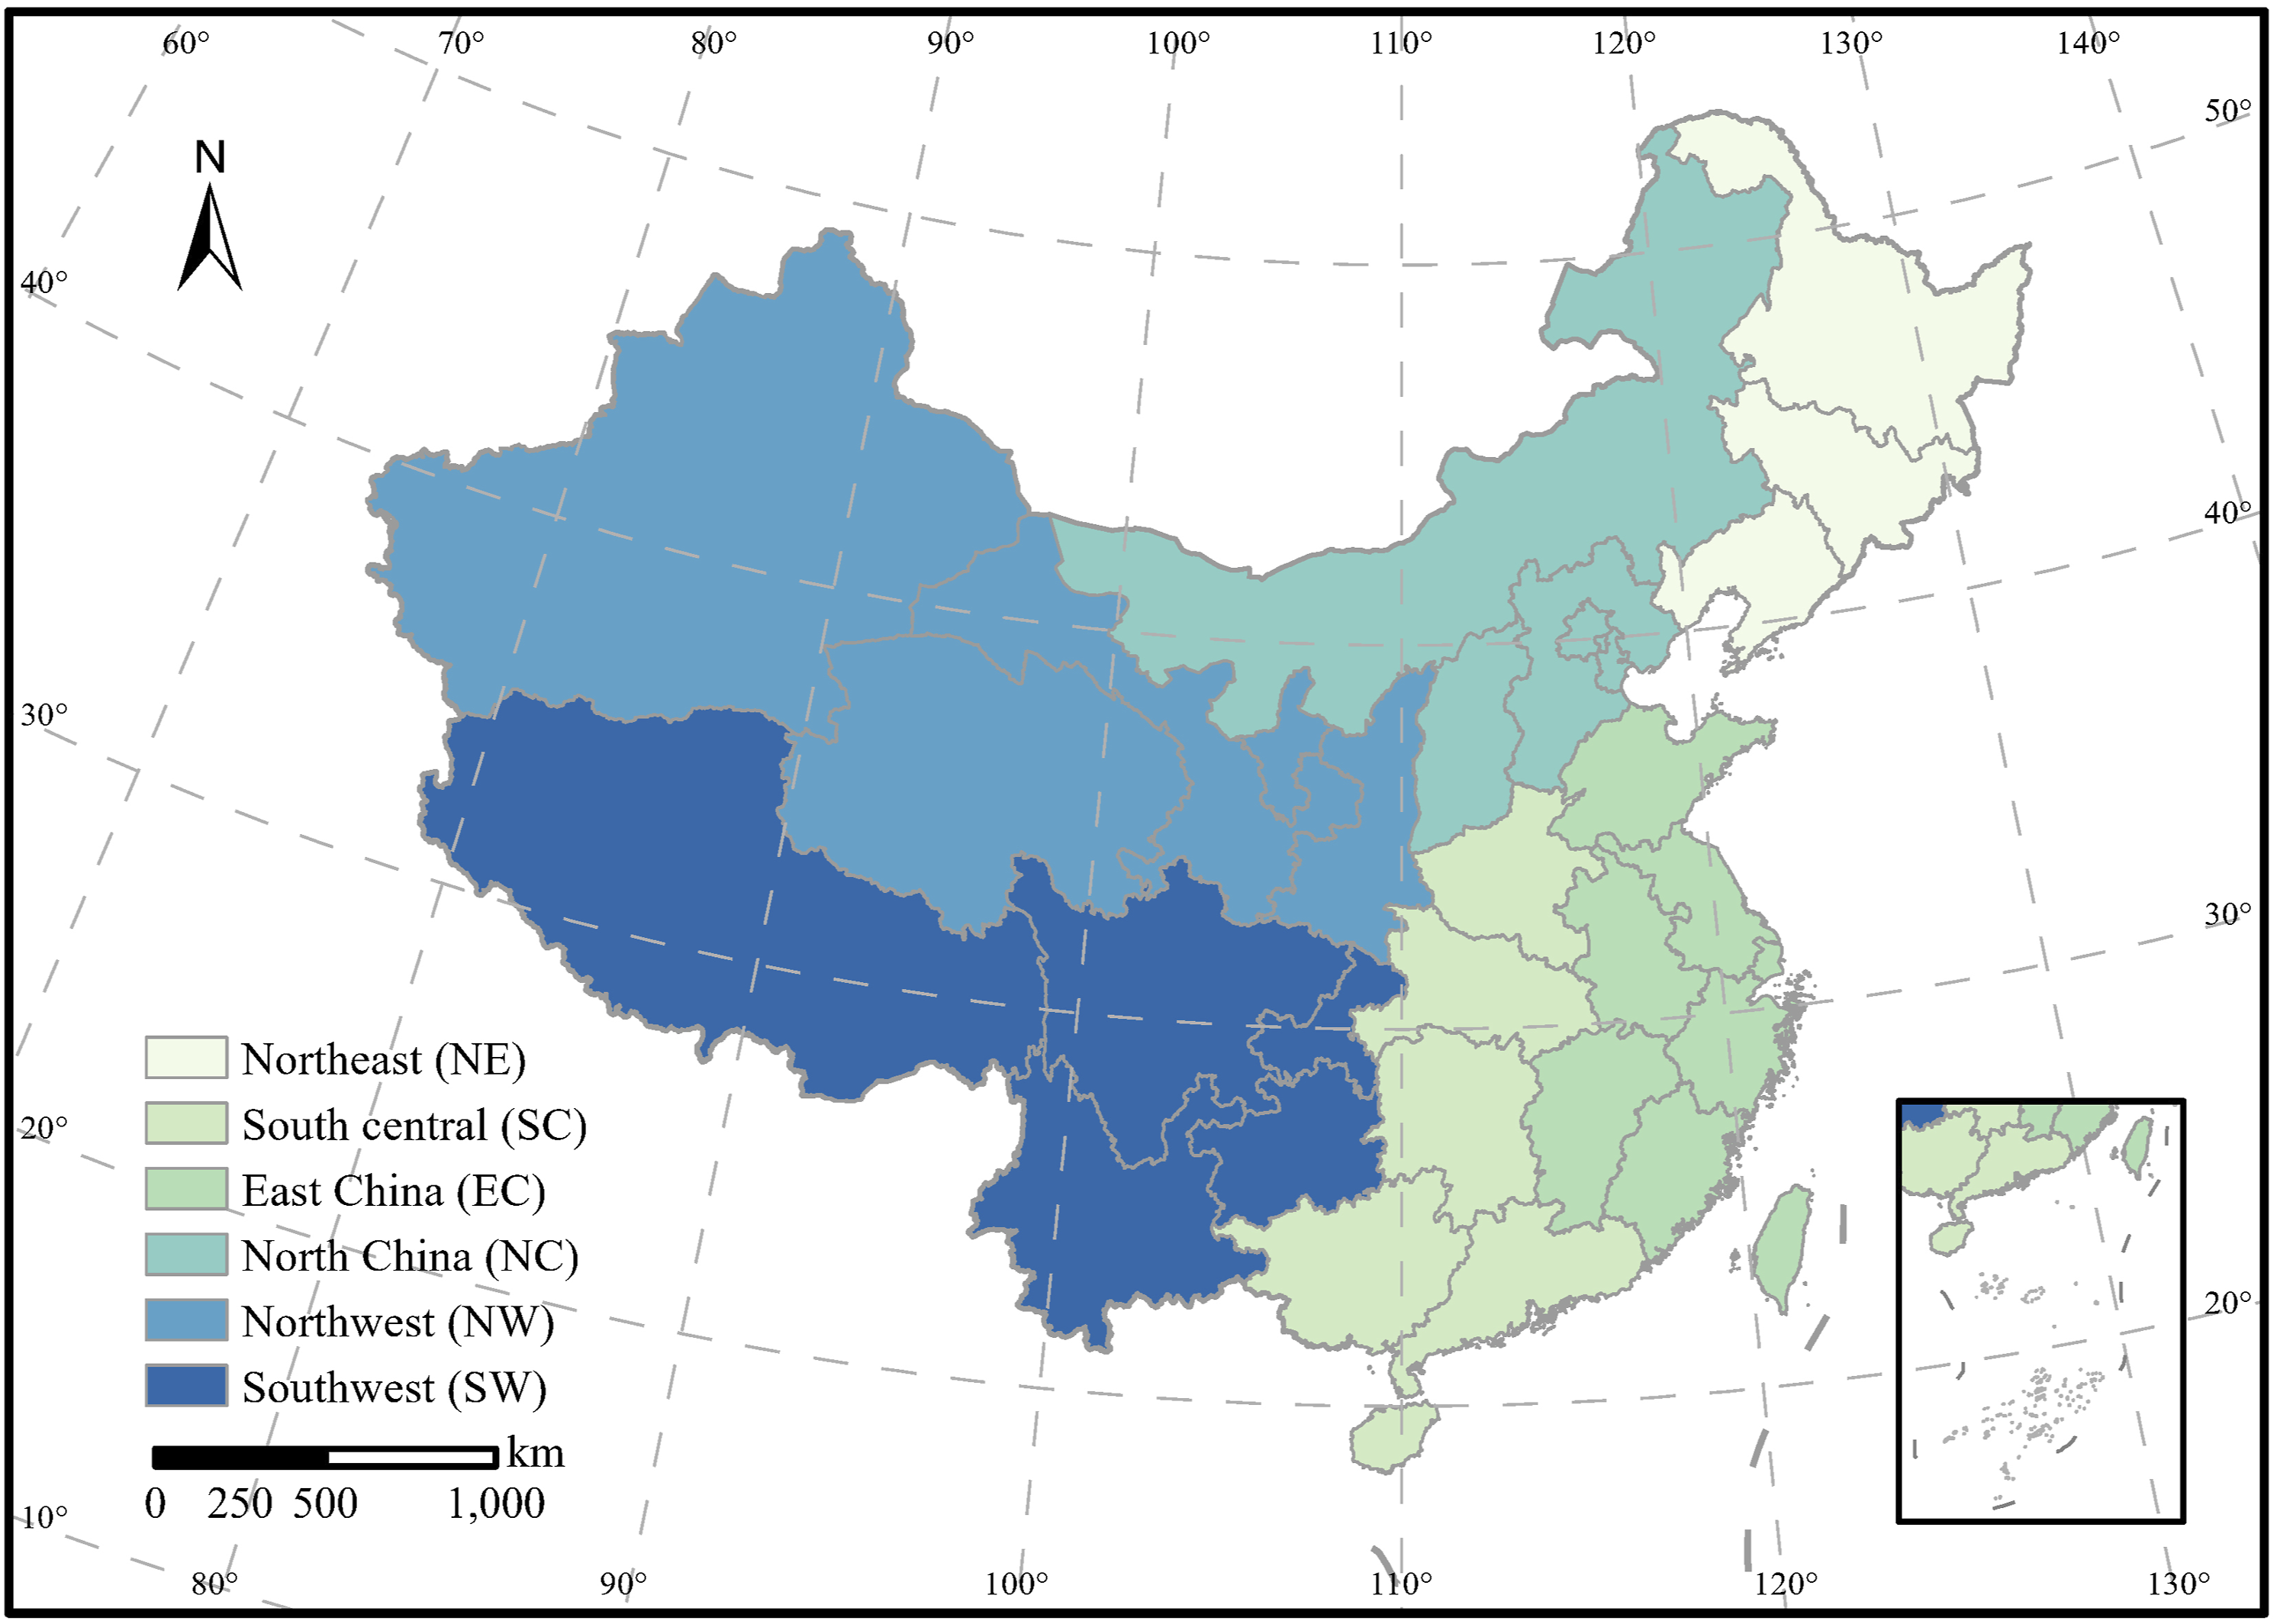
Datasets
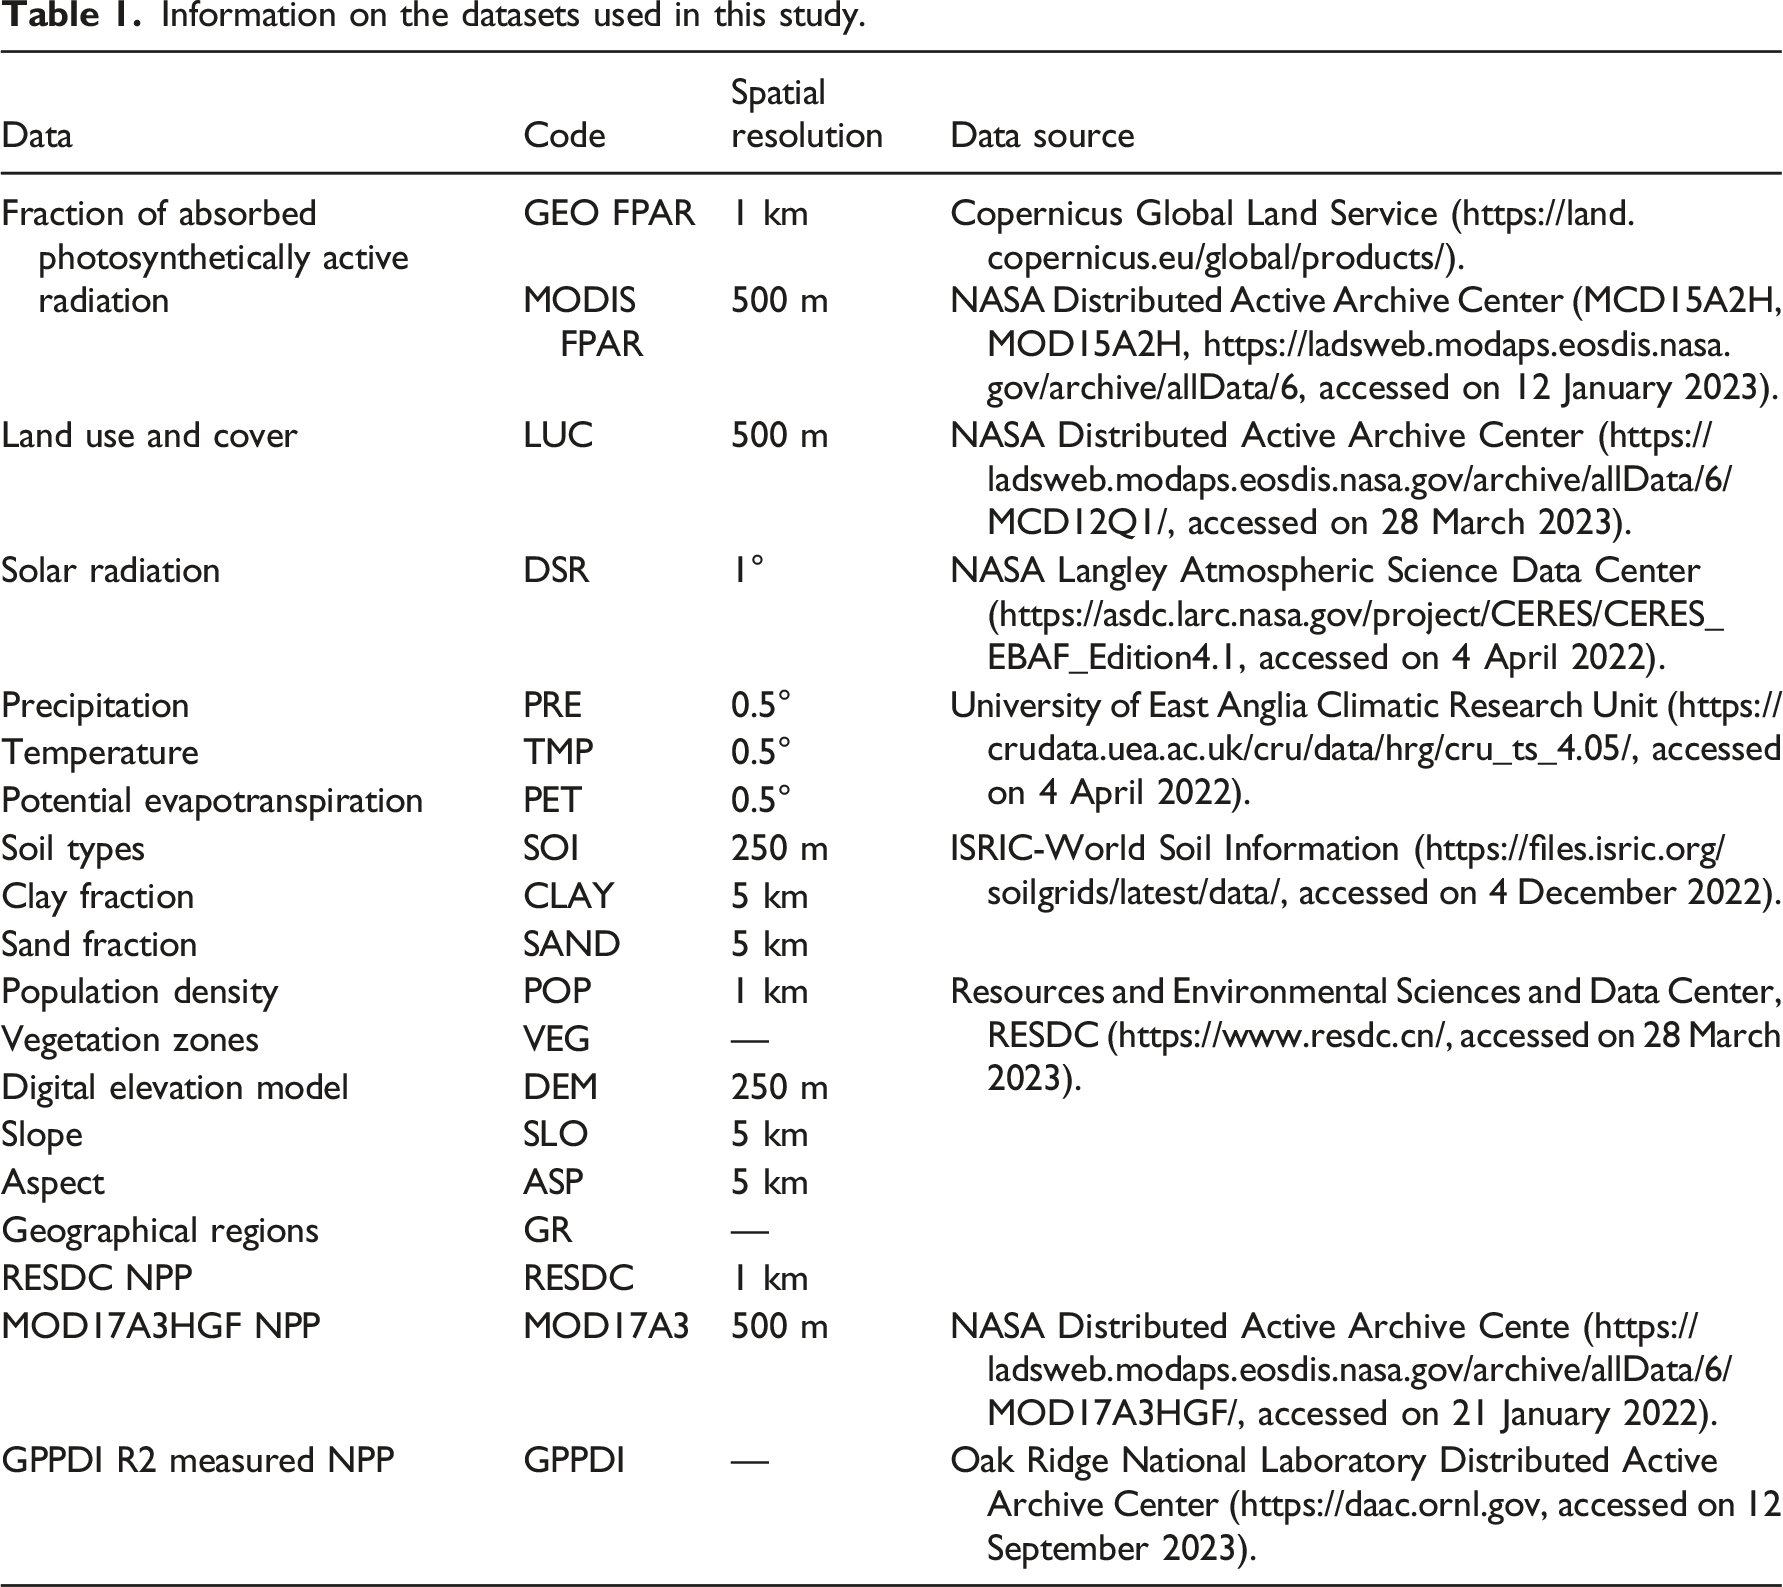
Information on the datasets used in this study.
Methods
Simulation of NPP
In this study, we chose FPAR, land use/cover, climate, and soil data as input parameters to estimate terrestrial NPP with the CASA model. Potter et al. (1993) developed this model on the basis of light use efficiency (LUE). It was widespread in NPP estimating and dynamic monitoring on regional and even global levels (Potter et al., 2012; Wan et al., 2022). Vegetation attributes and natural environment are comprehensively considered in the remote-sensing CASA model. In the context of climate change and human activities, as a result, this model can demonstrate how vegetation growth is affected (Potter et al., 1999a). The NPP is calculated


The
Assessment of trend and correlation
The long-term trends of desired variables were characterized by least-squares linear regression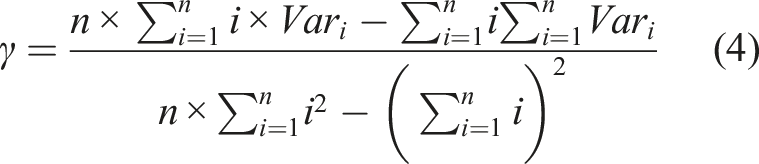
To investigate the significance of trends further, we implemented a Mann–Kendall (MK) test (Guo et al., 2020; Zhang et al., 2006). It is a broadly accepted non-parametric statistic method by the World Meteorological Organization (IRWIN, 1934; Mann, 1945). Its statistic 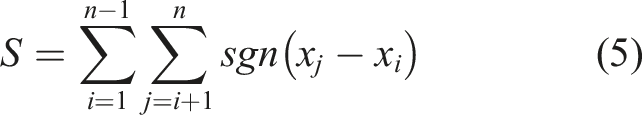
When 
Finally, the MK test statistic 
Pearson’s coefficient was engaged in evaluating a correlation between variables x and y (Rebekić et al., 2015), which is calculated by
We used Spearman’s rank correlation test if one side of the data is ordinal rather than numeric (i.e., VEG and SOI)
Selection of driving factors
The two most critical drivers affecting variation in NPP are climate and anthropogenic activities (Barnosky et al., 2012; Danneyrolles et al., 2019). Landforms (e.g., elevation and slope) and soil properties, on the other hand, determine the vegetation composition and function and then affect terrestrial ecosystems (Berhe et al., 2008; Jalilian et al., 2020; Lira-Martins et al., 2022). To lessen the occurrence of multicollinearity, we eliminated one variable from each pair that had a pairwise Pearson’s correlation coefficient greater than 0.80 (p < .05) (Bezeng et al., 2017; Scherrer et al., 2017; Shimizu-Kimura et al., 2017; Wan et al., 2017). That was done while retaining variables that are recognized as essential factors in determining plant growth. Eventually, we selected 10 drivers affecting NPP changes, categorized into climatic conditions, land surface properties, and human activities. It can be expressed mathematically as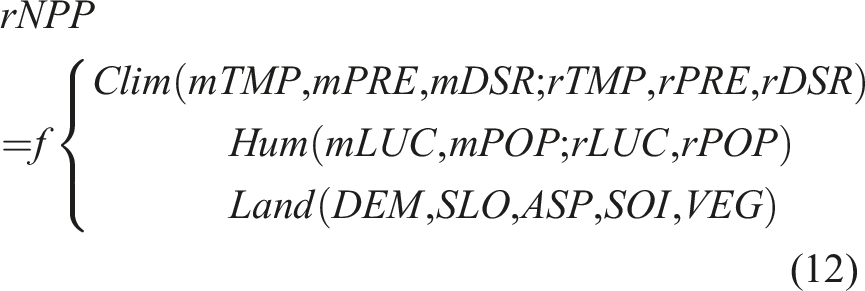
Identification the relative contribution of drivers on NPP variation
The RF model based on decision trees is an ensemble machine-learning model (Breiman, 2001a). The RF model builds multiple decision trees and uses voting mechanisms to improve the training machine’s stability and prediction accuracy (Liu et al., 2012). In RF regression, each decision tree is constructed using a random sampling subset from predictor factors to avoid overfitting and multicollinearity while getting excellent robustness (Breiman, 2001b). RF can handle numerous continuous and categorical variables, and the algorithm would naturally include the interaction of variables (Cutler et al., 2007; Fratello and Tagliaferri, 2019). Therefore, we analysed the nonlinear relationship in equation (12) using the RF model to investigate the critical driving factors of NPP variation. Our study assigned 80% training random samples and 20% validation random samples. In addition, we determined the contribution of driving factors by the variable importance quantified from the mean decrease accuracy (MDA). We repeated the training 10 times for reliability and reported their average accuracy. The RF regression model was estimated using the Python package “scikit-learn.”
Result
Validation of the estimated CASA NPP
We obtained the terrestrial NPP in China based on the CASA model (an average of the simulated NPP using MODIS FPAR and GEO FPAR data). To validate, we first compared the spatial patterns of the estimated CASA NPP with that from the MOD17A3 dataset for 2001–2020 and the GLO-PEM dataset for 2001–2010 (Figure 2). It was apparent that the spatial patterns of the CASA NPP results were similar to those from the MOD17A3 NPP (R2 = 0.81 and RMSE = 136.4 g C/m2) and GLO-PEM NPP (R2 = 0.71 and RMSE = 244.7 g C/m2). The fluctuation characteristics of the estimated CASA NPP were similar to the two data, as seen in Figure 3(a). Then, we calculated the correlation between the total annual NPP of the estimated NPP results and that from the MOD17A3 and GLO-PEM datasets, where the Pearson’s coefficient was 0.90 (p < .0001) with MOD17A3 NPP and 0.73 (p < .0001) with GLO-PEM NPP and the RMSE were 54.47 Tg C/yr with MOD17A3 NPP and 85.00 Tg C/yr with GLO-PEM NPP. It was evident that our modelled NPP performed well. Furthermore, the estimated CASA NPP in China for 2001–2020 averaged 3205 ± 167 Tg C/yr, close to 3182 ± 125 Tg C/yr from MOD17A3 NPP. Previous studies of NPP simulation in China also supported our simulated NPP results (Table S3), with a range of 2944–3500 Tg C/yr in 2001–2020. Overall, the above analysis suggested that the result of NPP simulated by the CASA model in this study performed well. Comparison in the spatial pattern of the simulated CASA NPP results and that from (a) the MOD17A3 data during 2001–2020 and (b) the GLO-PEM data during 2001–2010. The gray line is a slope of 1.0, and the green line is the regression line. Comparison in (a) the temporal variation of the simulated CASA NPP results and that from the MOD17A3H and GLO-PEM data, the average NPP of the GPPDI site measured data and that from (b) the CASA NPP results during 2001–2020, (c) the MOD17A3 data during 2001–2020 and (d) the GLO-PEM data during 2001–2010. The gray line is a slope of 1.0, and the yellow line is the regression line.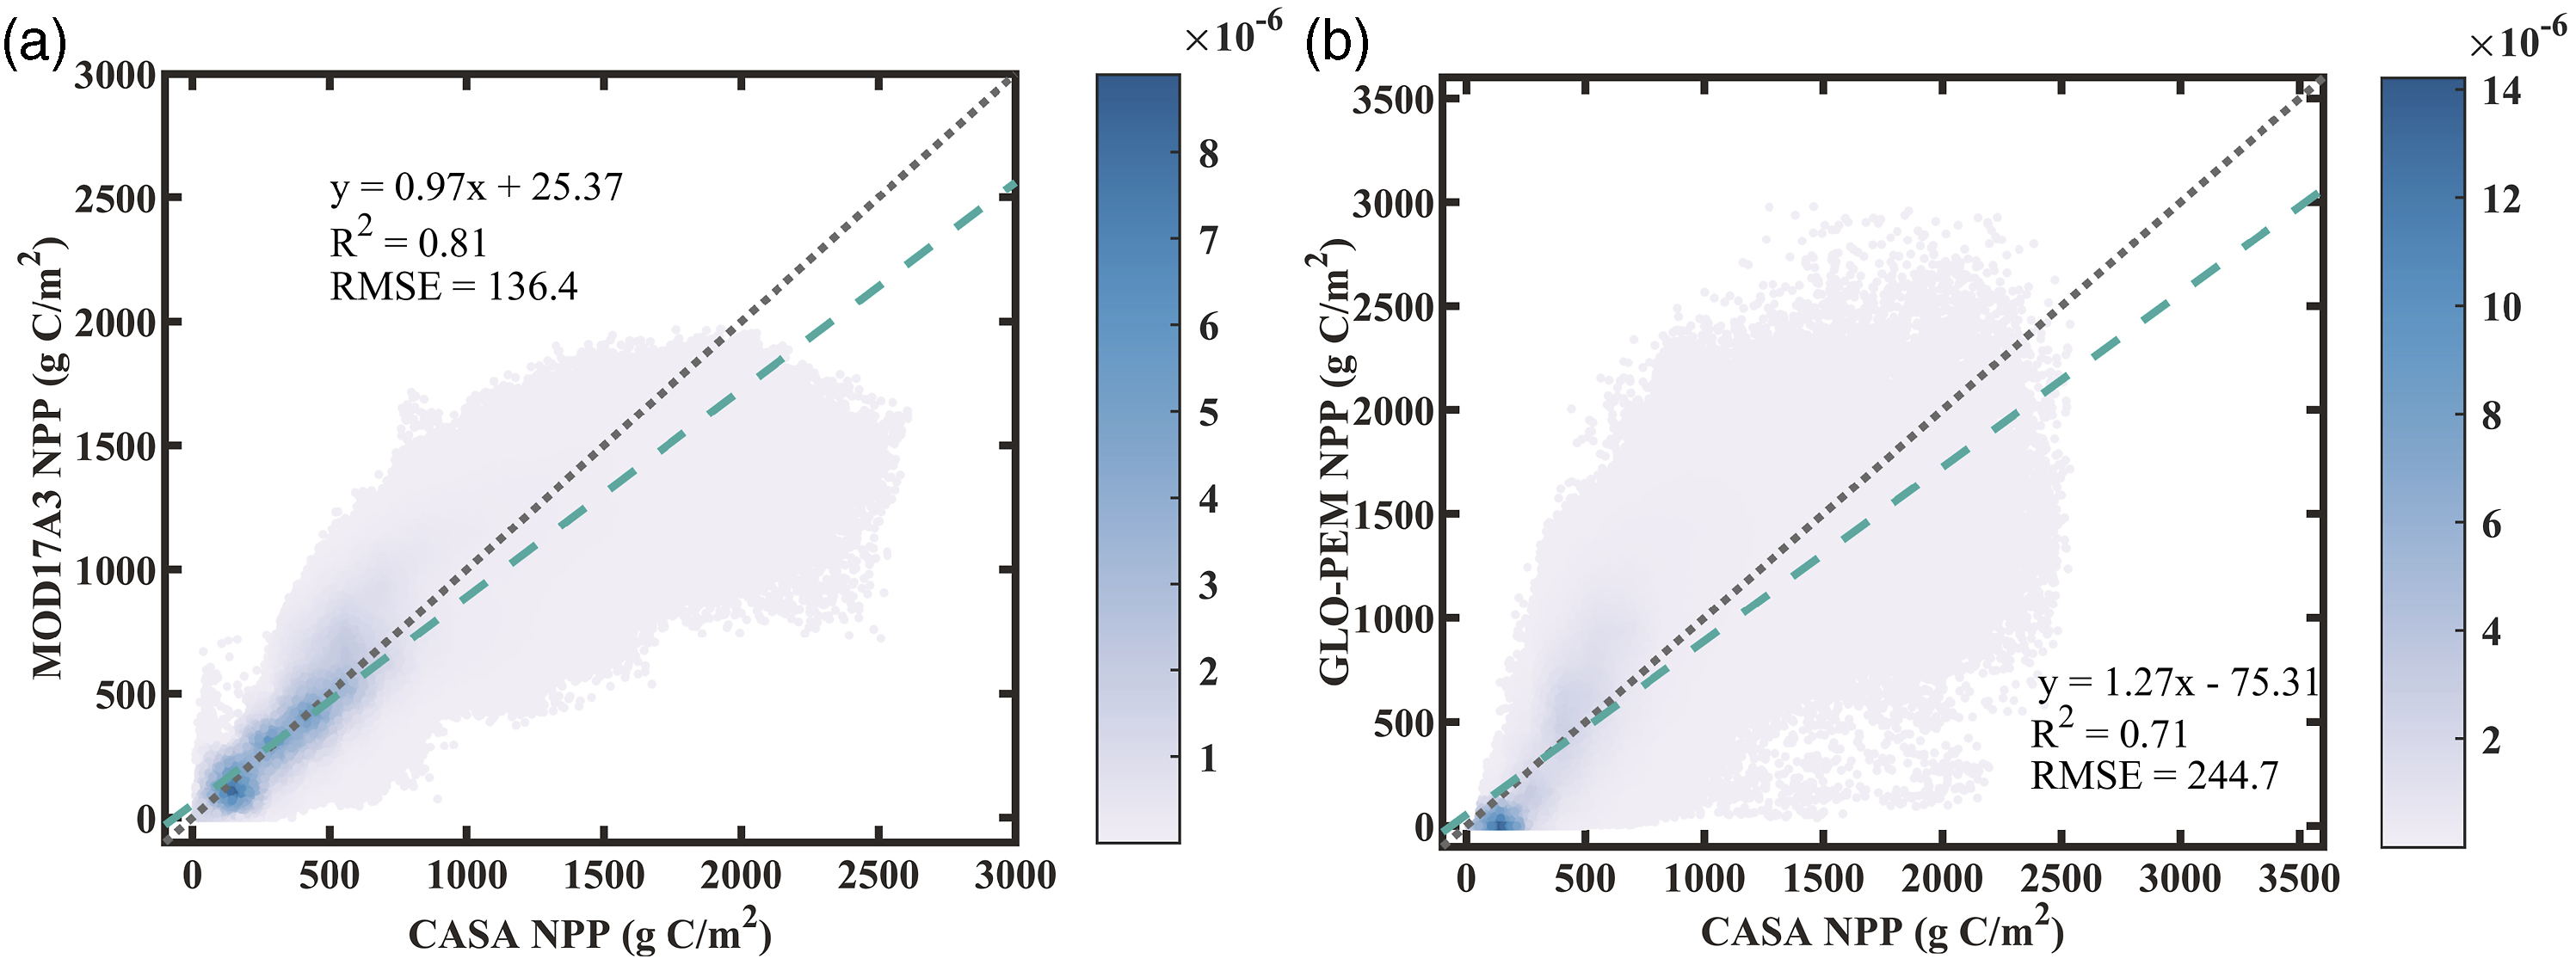
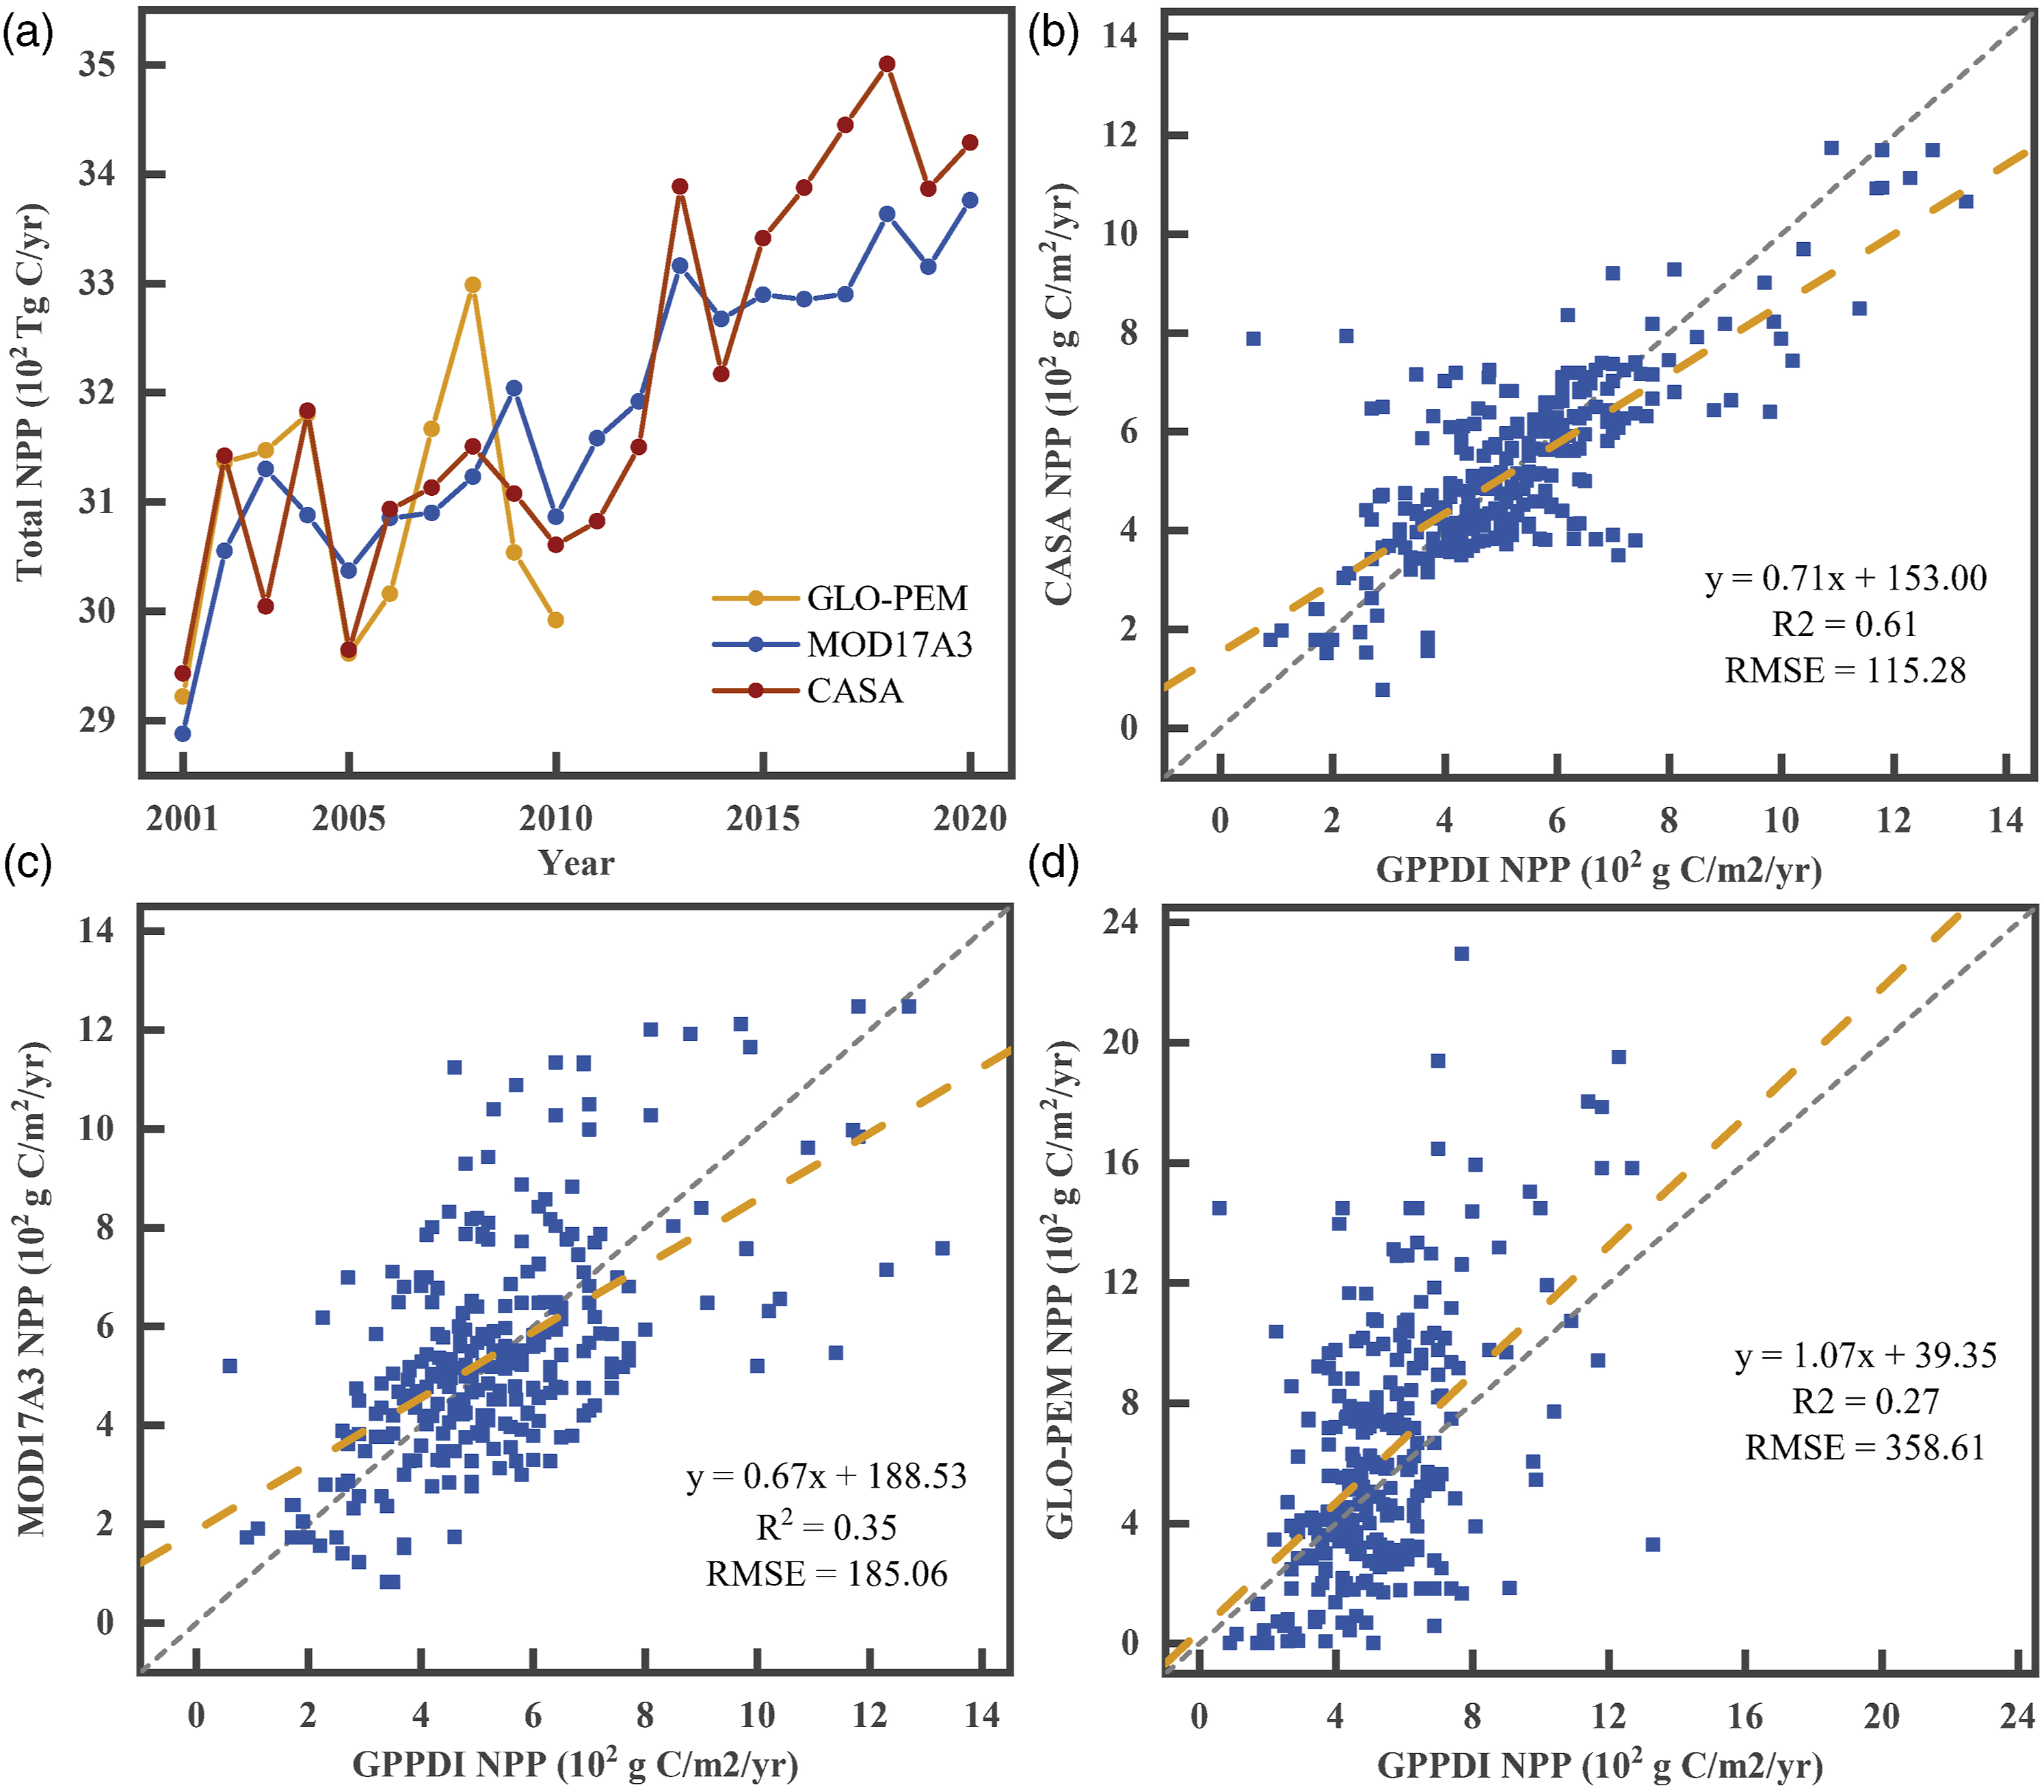
We also used the ground-measured NPP data from the GPPDI dataset to evaluate the CASA NPP results. The CASA model performed reasonably well in estimating China’s NPP, showing an R2 of 0.61 and an RMSE of 115.28 g C/m2/yr (Figure 3). The time and scale mismatches of the datasets would be a significant reason for the inconsistencies between estimates and measurements. However, the relatively high R2 and lower RMSE indicate good potential for the CASA model to analyze NPP patterns in China.
Spatiotemporal patterns of NPP
China’s NPP was mostly higher in the warm and humid southeast and decreased in order to the northwest (Figure 4(a)). Less than 4% of the pixels in China had NPP values greater than 1000 g C/m2, mainly in China’s eastern and southern regions, including Yunnan, Fujian, Guangdong, southeast Tibet, and Guangxi Zhuang Autonomous Region. Pixels with NPP values in the 400–1000 g C/m2 were primarily focused in central China, accounting for 43.69% of the total. Among the total pixels, 50.73% had NPP values below 400 g C/m2, primarily found in northwest, southwest, and north China, regarding Inner Mongolia, Qinghai, Tibet, and Xinjiang. Annual NPP in most of China had an increasing trend (over 89%) during the study period (Figure 4(c) and (d)). There was a significant NPP increase trend (p < .05) in 58.02% of the total. The very significant NPP growing trend was mainly in the northeast Plain—Loess Plateau—Qinling Mountains belt, with 39.55% of the total (p < .01). In contrast, the decreasing trend in NPP was encountered mainly in eastern and west-central China, such as Tibet, Xinjiang, Hunan, Guizhou, and the Yangtze River Delta. Significant decreasing trends (p < .05) only sporadically distributed in the above-mentioned regions, accounting for approximately 1.05% of the total. The total annual NPP raised with an average growth speed of 24.91 Tg C/yr. We additionally identified 2013 as a significant turning point in NPP change (p < .05, ΔAIC = −76.61) through the Mann–Kendall mutation test (Mwangi et al., 2016; Sneyers, 1990) and Akaike’s Information Criteria (Burnham and Anderson, 2002; Cavanaugh and Neath, 2019). The carbon sequestration rate of vegetation in China accelerated after 2013, with the growth speed changing from 16.46 Tg C/yr to 29.93 Tg C/yr (Figure 4(b)). The pattern of (a) average annual NPP, (b) annual total NPP, (c) trend of NPP and (d) significant trend of NPP in China from 2001 to 2020. (Dec, decreased trend; Inc, increased trend; *, significant (p < .05); **, very significant (p < .01)).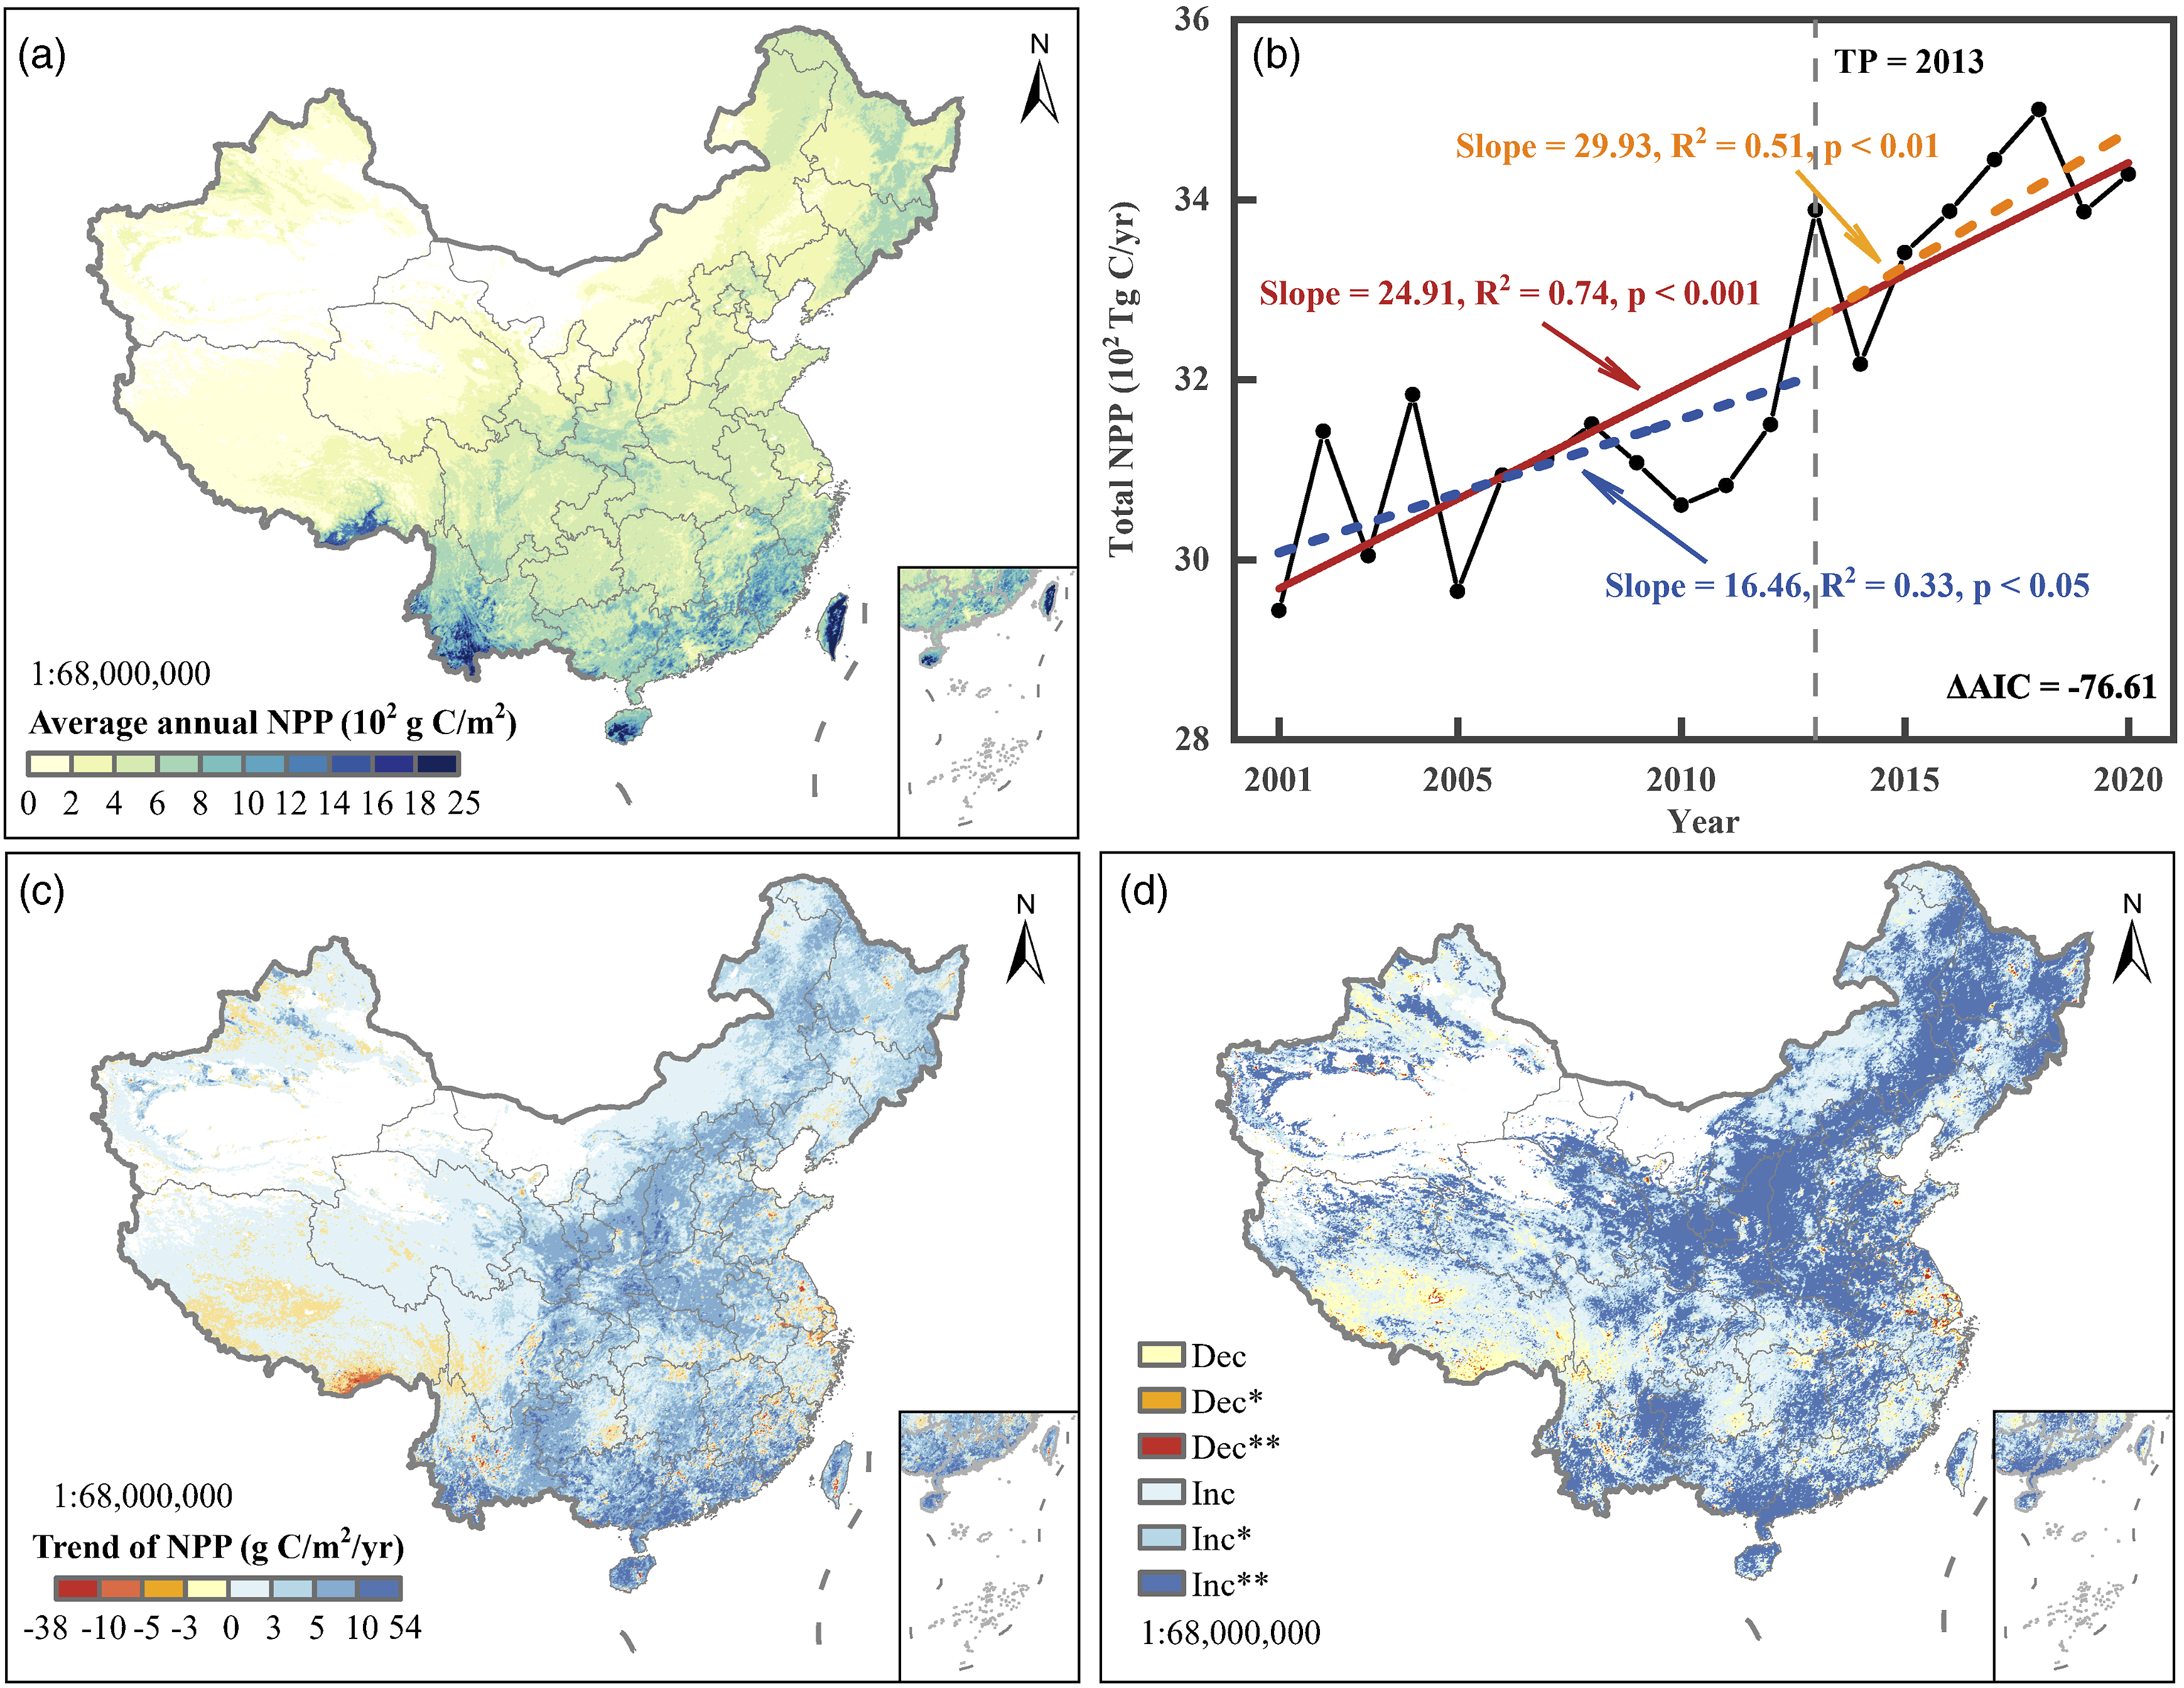
The relative contribution of drivers to NPP variation
According to equation (12), we executed the RF model to predict NPP variation. Based on the model validation results, the predicted and the estimated values exhibited an excellent correlation with 0.884 ± 0.002 R2 (p < .001, Figure S1). Furthermore, predicted and estimated values for all validation datasets were distributed near the 1:1 line. Kernel density estimation showed a concentration of hot frequencies in the range where predicted and estimated values were almost equal, with a slight prediction error (RMSE = 1.146 ± 0.006 g C/m2/yr). The RF models performed on six geographic regions also yielded excellent findings, with R2 greater than 0.8 and RMSE less than 1.50 g C/m2/yr (Figure S2). In summary, RF could be a good explanation of the relationship between NPP changes and the drivers. With 10 iterations calculated to avoid sampling error, we analyzed the relative contribution of each driver based on the mean in this study.
In China, NPP variability correlated highly with human activities (Hum, 59.31 ± 0.06%), next to climatic factors (Clim, 33.93 ± 0.07%) and comparatively less with land surface properties (Land, 6.76 ± 0.04%) (Figure 5 and Table S4). In particular, land use/cover (LUC, 33.97 ± 0.09%) and climatic factors (Clim, 33.93 ± 0.07%) were the main drivers of NPP variation. Moreover, the influence of population density should be addressed (POP, 25.34 ± 0.07%). We divided the contribution percentage into four grades: high (>10%), medium (10%–5%), low (5%–2%), and very low (<2%). The high-impact variables for NPP change consisted of mean annual population density (mPOP), forest variation (rFOR), and average annual temperature (mTMP), scored at 24.33 ± 0.06%, 17.4 ± 0.12%, and 10.18 ± 0.12%, respectively (Table S5). The moderate-impact variables were average annual solar radiation (mDSR), grassland variability (rGRA), precipitation variability (rPRE), and average annual precipitation (mPRE), with scores ranging from 5.19% to 6.28%. Influencers at low levels are solar radiation variation (rDSR, 4.19 ± 0.07%), elevation (DEM, 3.7 ± 0.03%), cropland variation (rCRO, 3.48 ± 0.09%), urban variation (rURB, 2.44 ± 0.04%), and temperature variation (rTMP, 2.36 ± 0.06%). Extremely low-level impact variables included the average annual area proportion in each land use/cover, population density change, slope, aspect, soil, and vegetation type. The relative contribution of different factors estimated by the RF in China.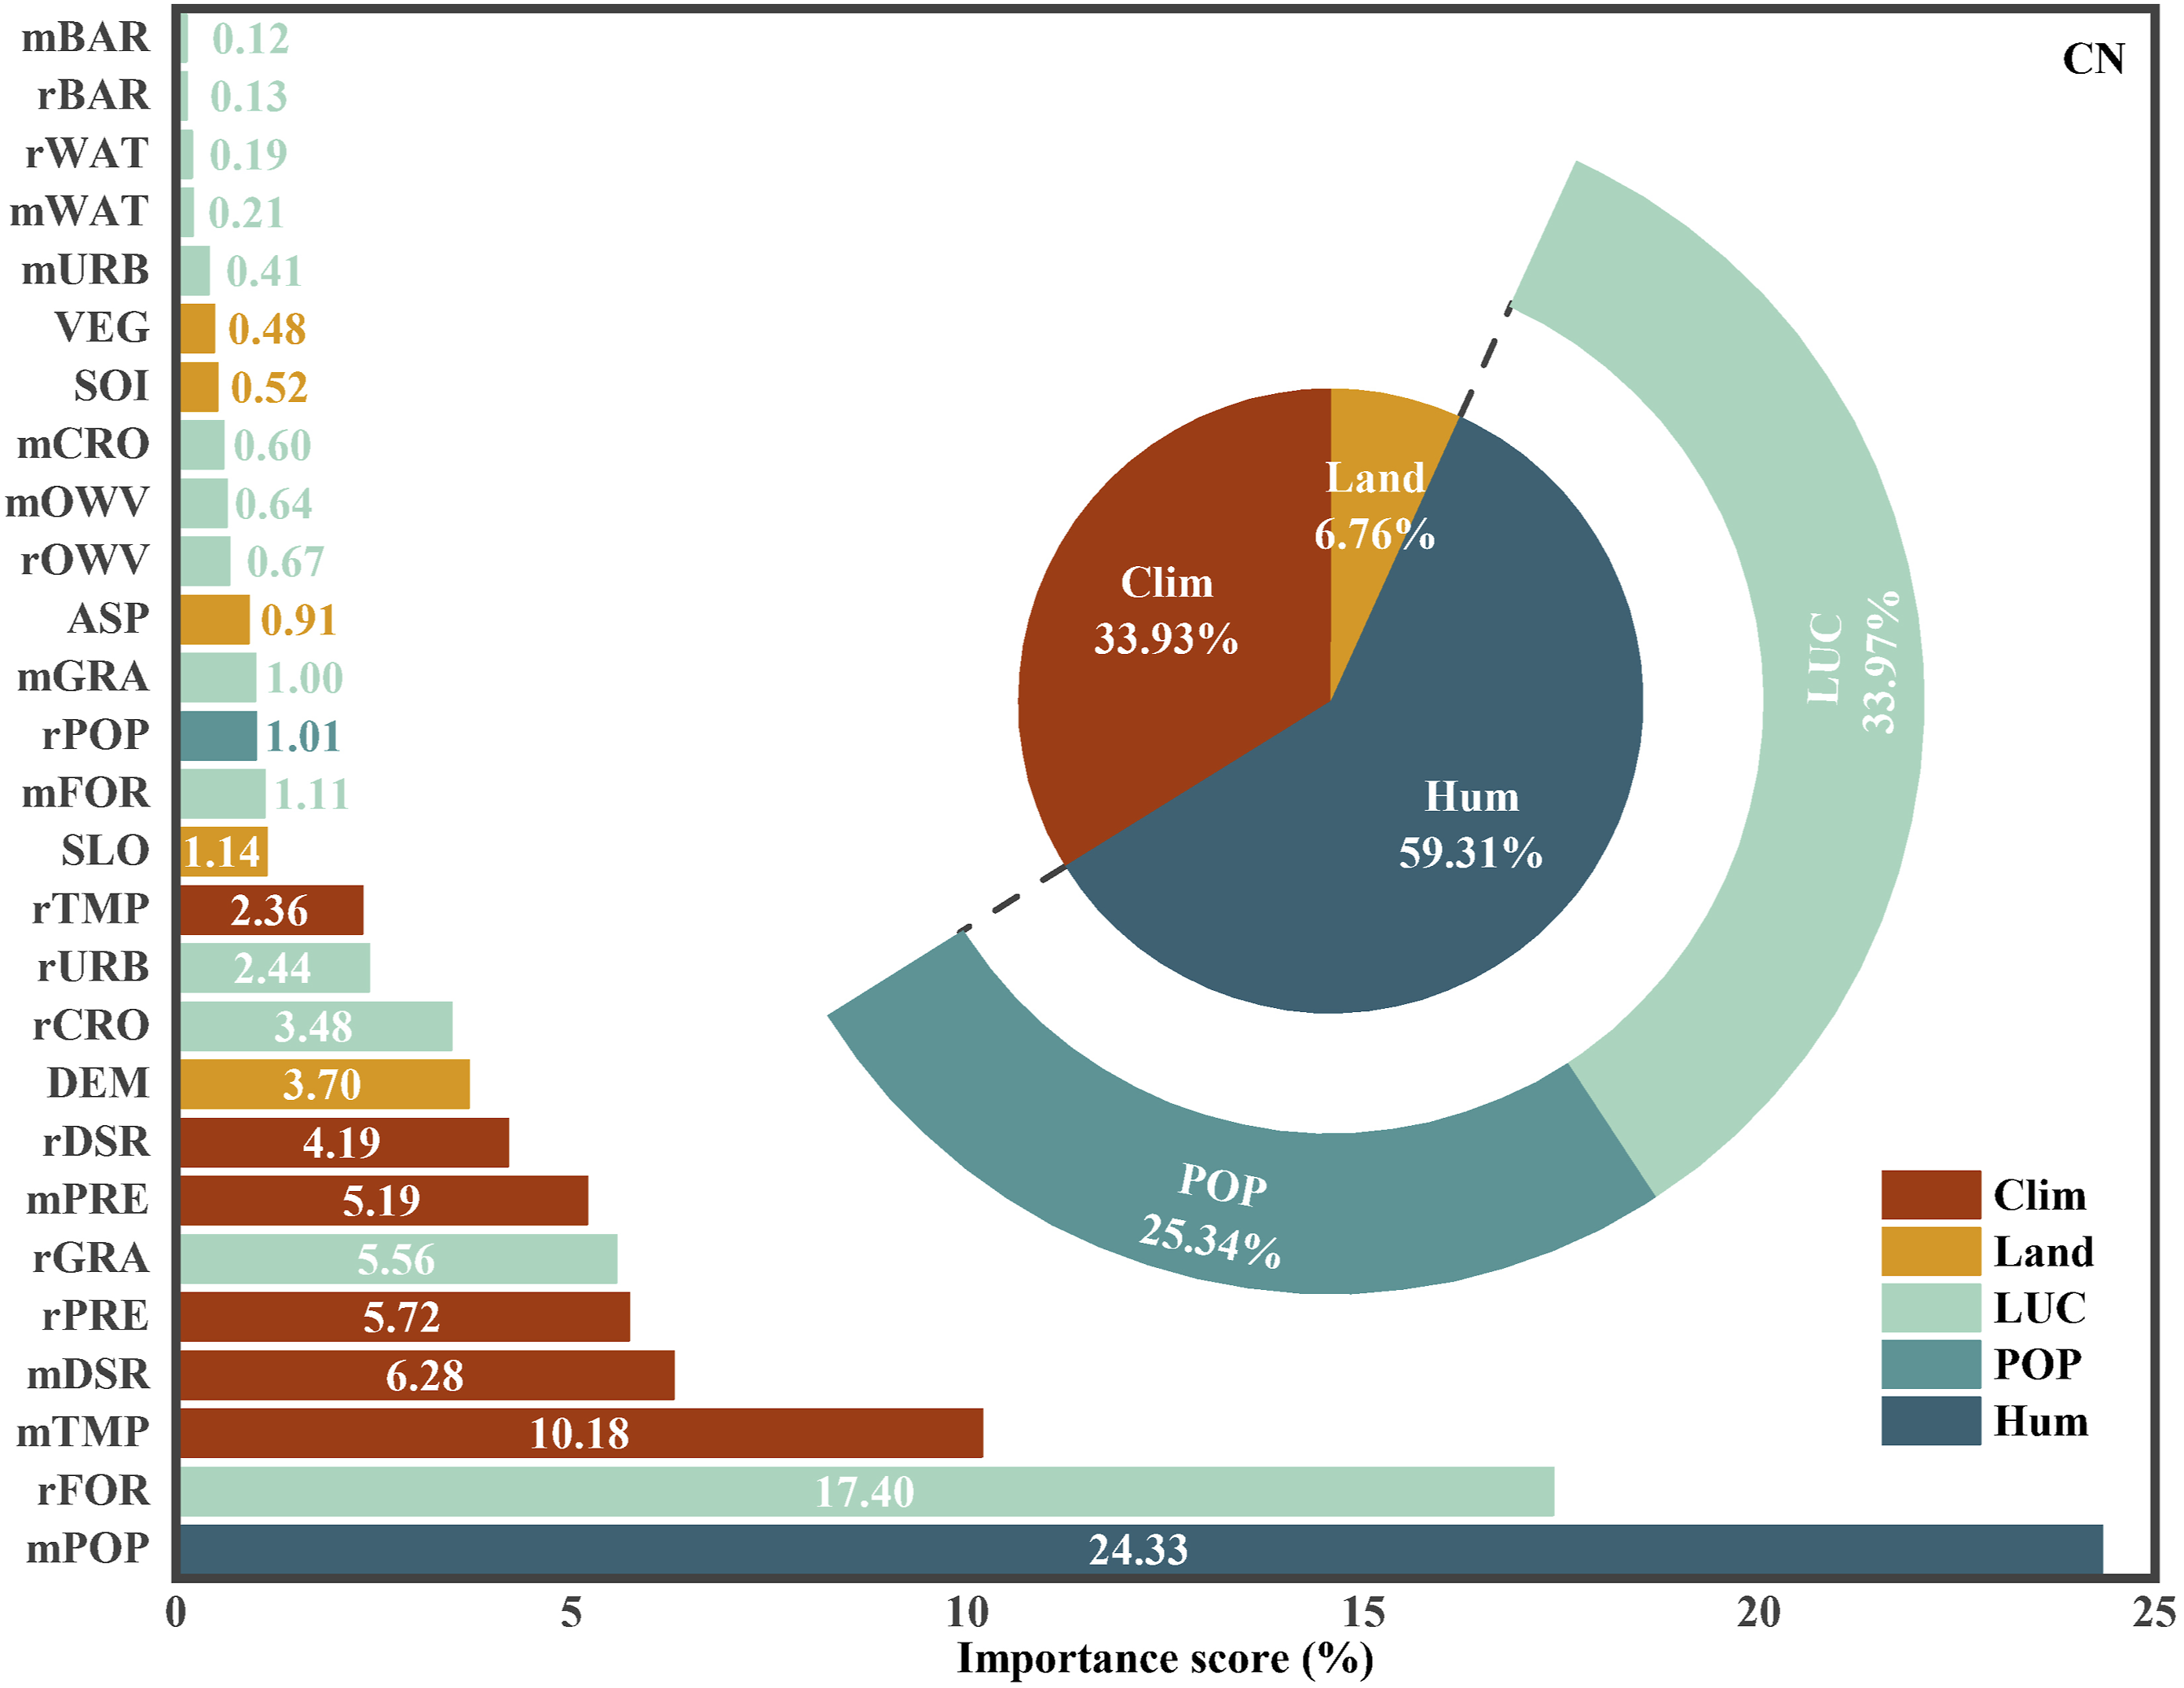
Across six geographical regions, all regions were primarily influenced by human activities (Hum), except for northern China (Figure 6). Population density (POP) scored highest in northwest and southwest China, while land use/cover (LUC) dominated the NPP variation in east, south-central, and northeast China. Among the factors associated with LUC, the highest contribution to NPP variation in east and south-central China was forest variation (rFOR), with 24.68 ± 0.39% and 41.65 ± 0.30% (Table S6), respectively, while that in northeast China was grass variation (rGRA, 20.38 ± 0.30%). NPP variation in northern China was mainly influenced by climate factors (Clim, 52.38 ± 0.91%), especially for precipitation conditions (mPRE, 28.28 ± 0.80%). Among land surface properties (Land), elevation (DEM) was the dominant factor. The relative contribution of different factors estimated by RF for distinct regions of China (NE, NC, EC, SC, NW, and SW represent the northeast, north, east, south-central, northwest, and southwest China, respectively).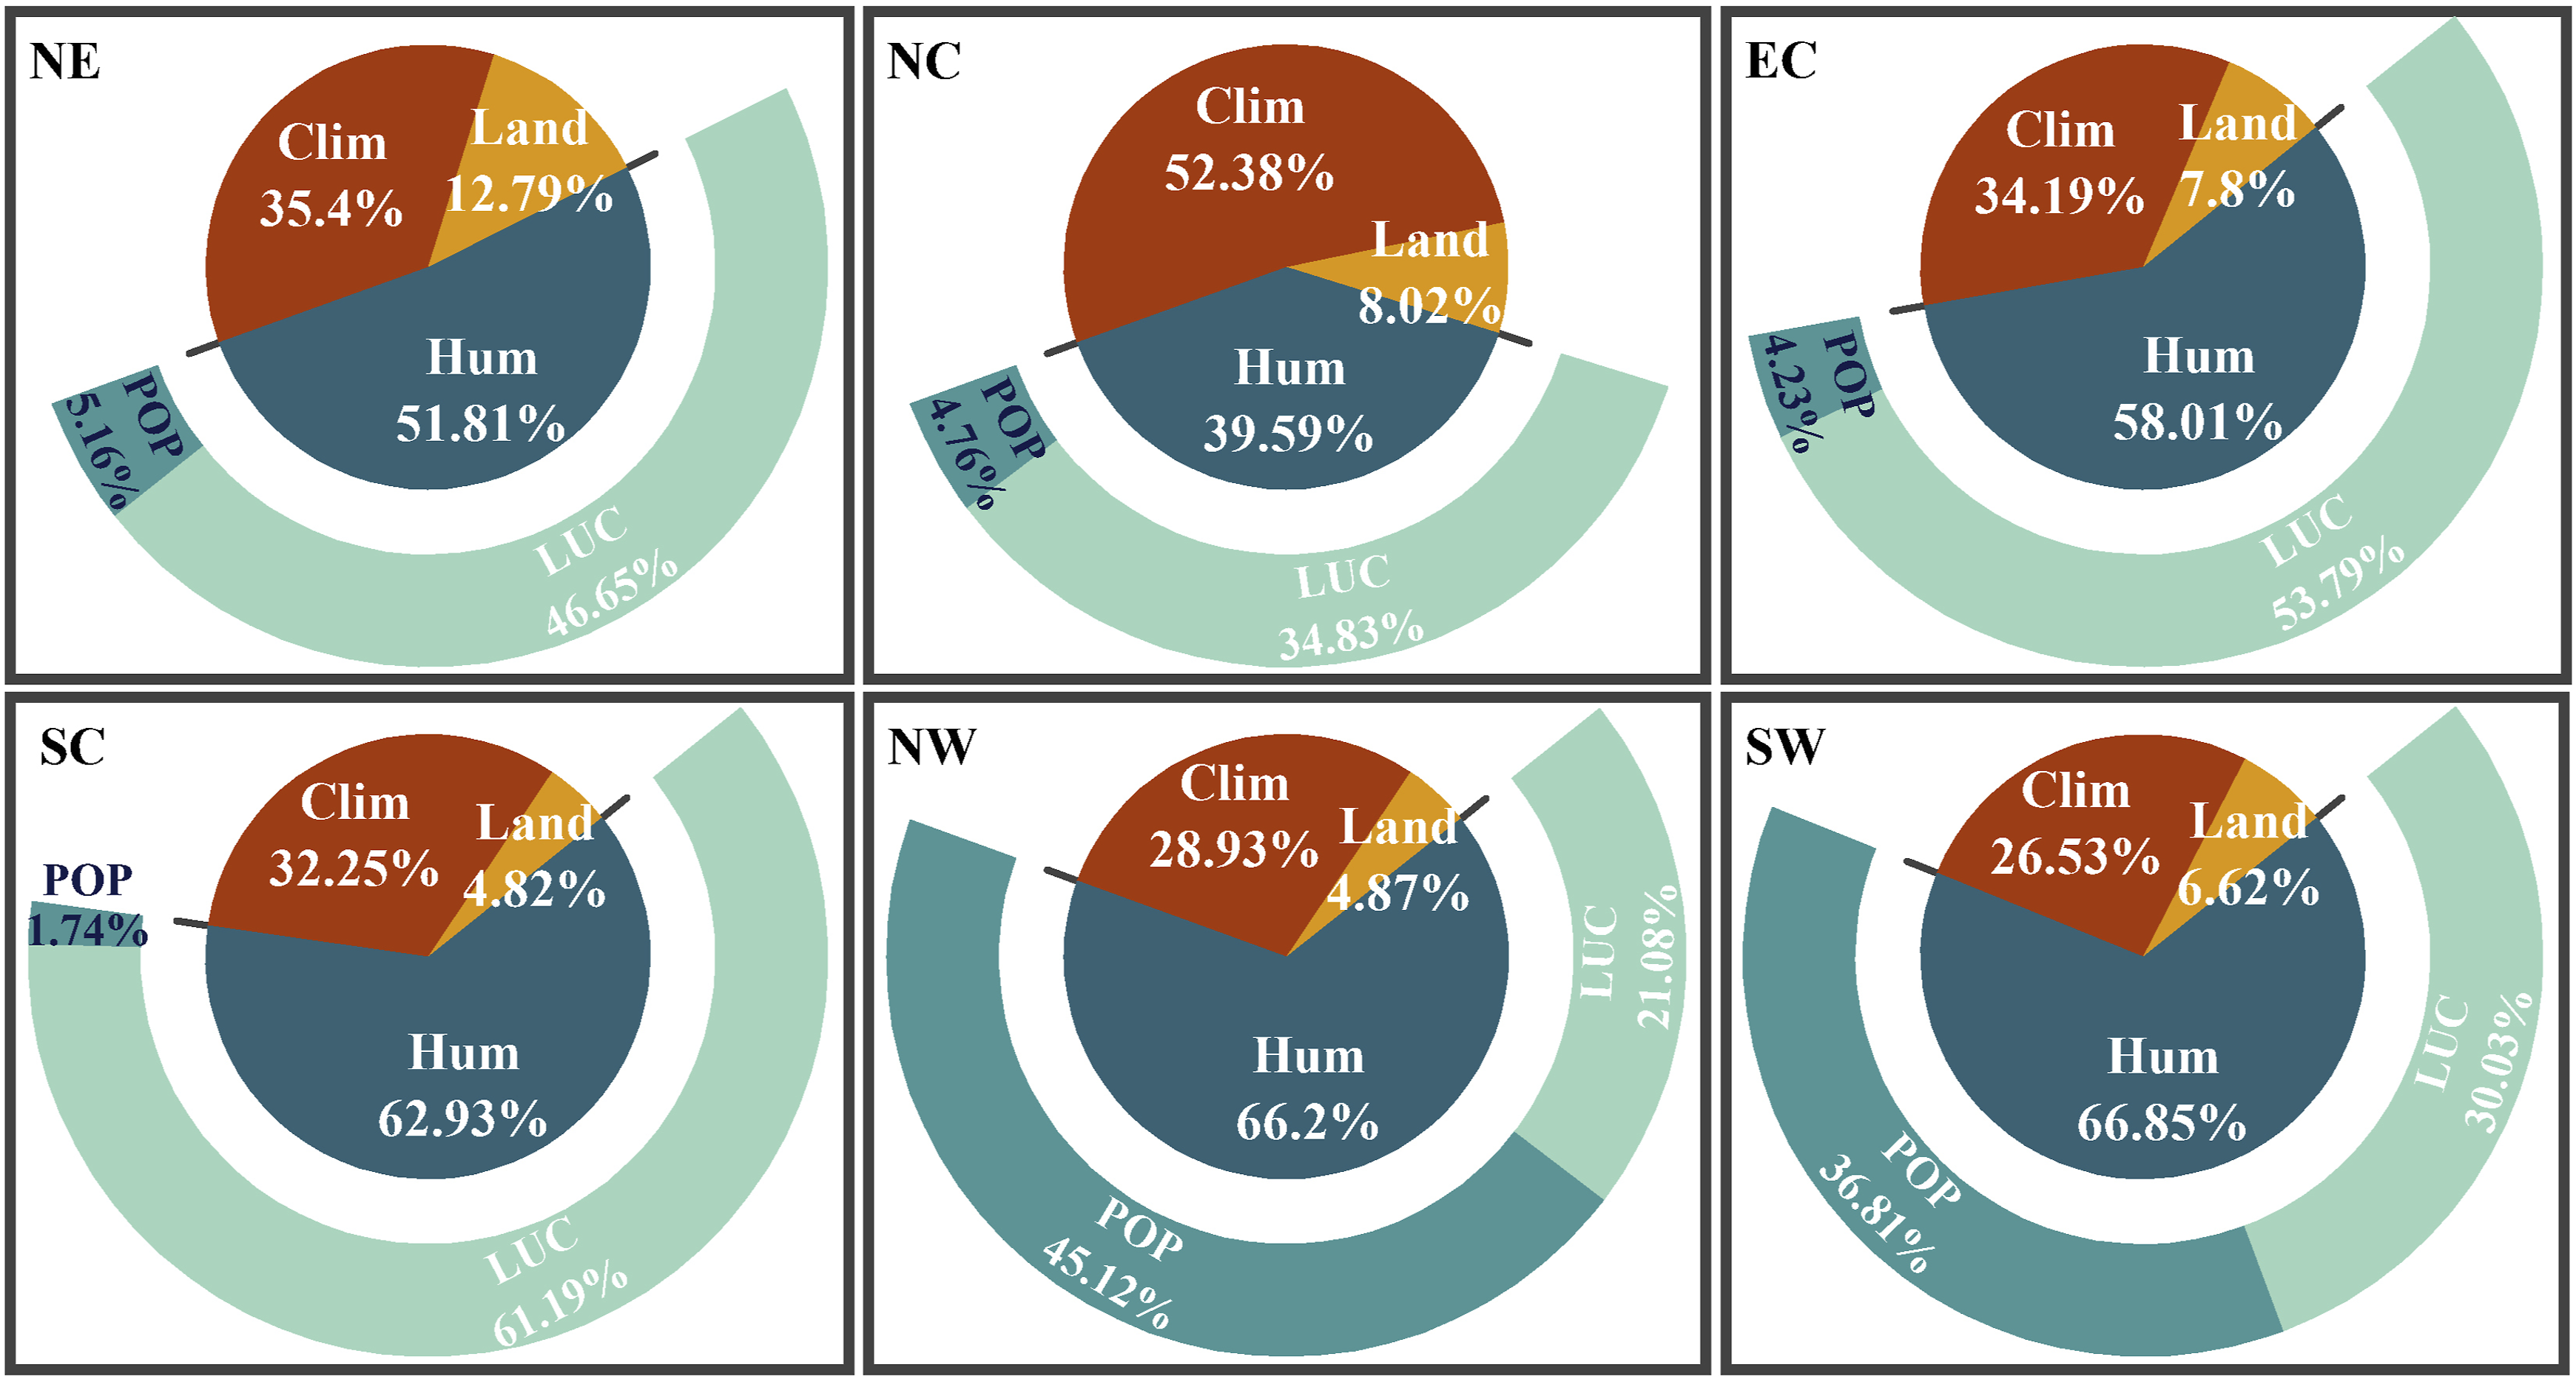
Across China and six geographic regions, the number of impact factors at the low level and above was all greater than 8, with a combined score of more than 85%. Common among these driving factors are the anthropogenic factors of forest change (rFOR) and cropland change (rCRO), elevation (DEM), and climatic conditions (mPRE, mTMP, and mDSR).
Correlations between climatic, human, land surface factors and NPP variation
All variables’ relative contributions included in RF are ecologically significant, but high-impact variables might be correlated with additional drivers (Cutler et al., 2007). As shown in Figure 7, the relationship between NPP variation and all drivers was statistically significant, with p < .001. Land use/cover (LUC) appeared as the most influential variable, whereas forest change (rFOR) was highly correlated with NPP variation (rNPP) (correlation coefficient: 0.48). Such a positive correlation highlighted the crucial role of forests in carbon sequestration, which may contribute to China’s goal of carbon neutrality. The effects of precipitation and temperature conditions should be considered in ecological projects (rFOR vs mPRE: 0.23, rFOR vs mTMP: 0.21), if necessary, accompanied by human intervention (irrigation, fertilization, etc.). Average annual temperature (mTMP) was the primary factor among the climate factors. It was significantly correlated with average annual precipitation (mPRE), solar radiation (mDSR), and elevation (DEM) with correlation coefficients of 0.76, −0.68, and −0.69 correspondingly. That reflected that the lower the elevation, the higher the temperature, and the higher the precipitation, then the solar radiation was lower under the impact of precipitation. These results further suggested that an extensive increase in NPP was attributed to human activities and that the magnitude of NPP changes depended on the baseline climatic conditions. Correlations between climatic, human, land surface factors, and NPP variation (*, **, and *** represent significant at 95%, 99%, and 99.9% confidence level, respectively).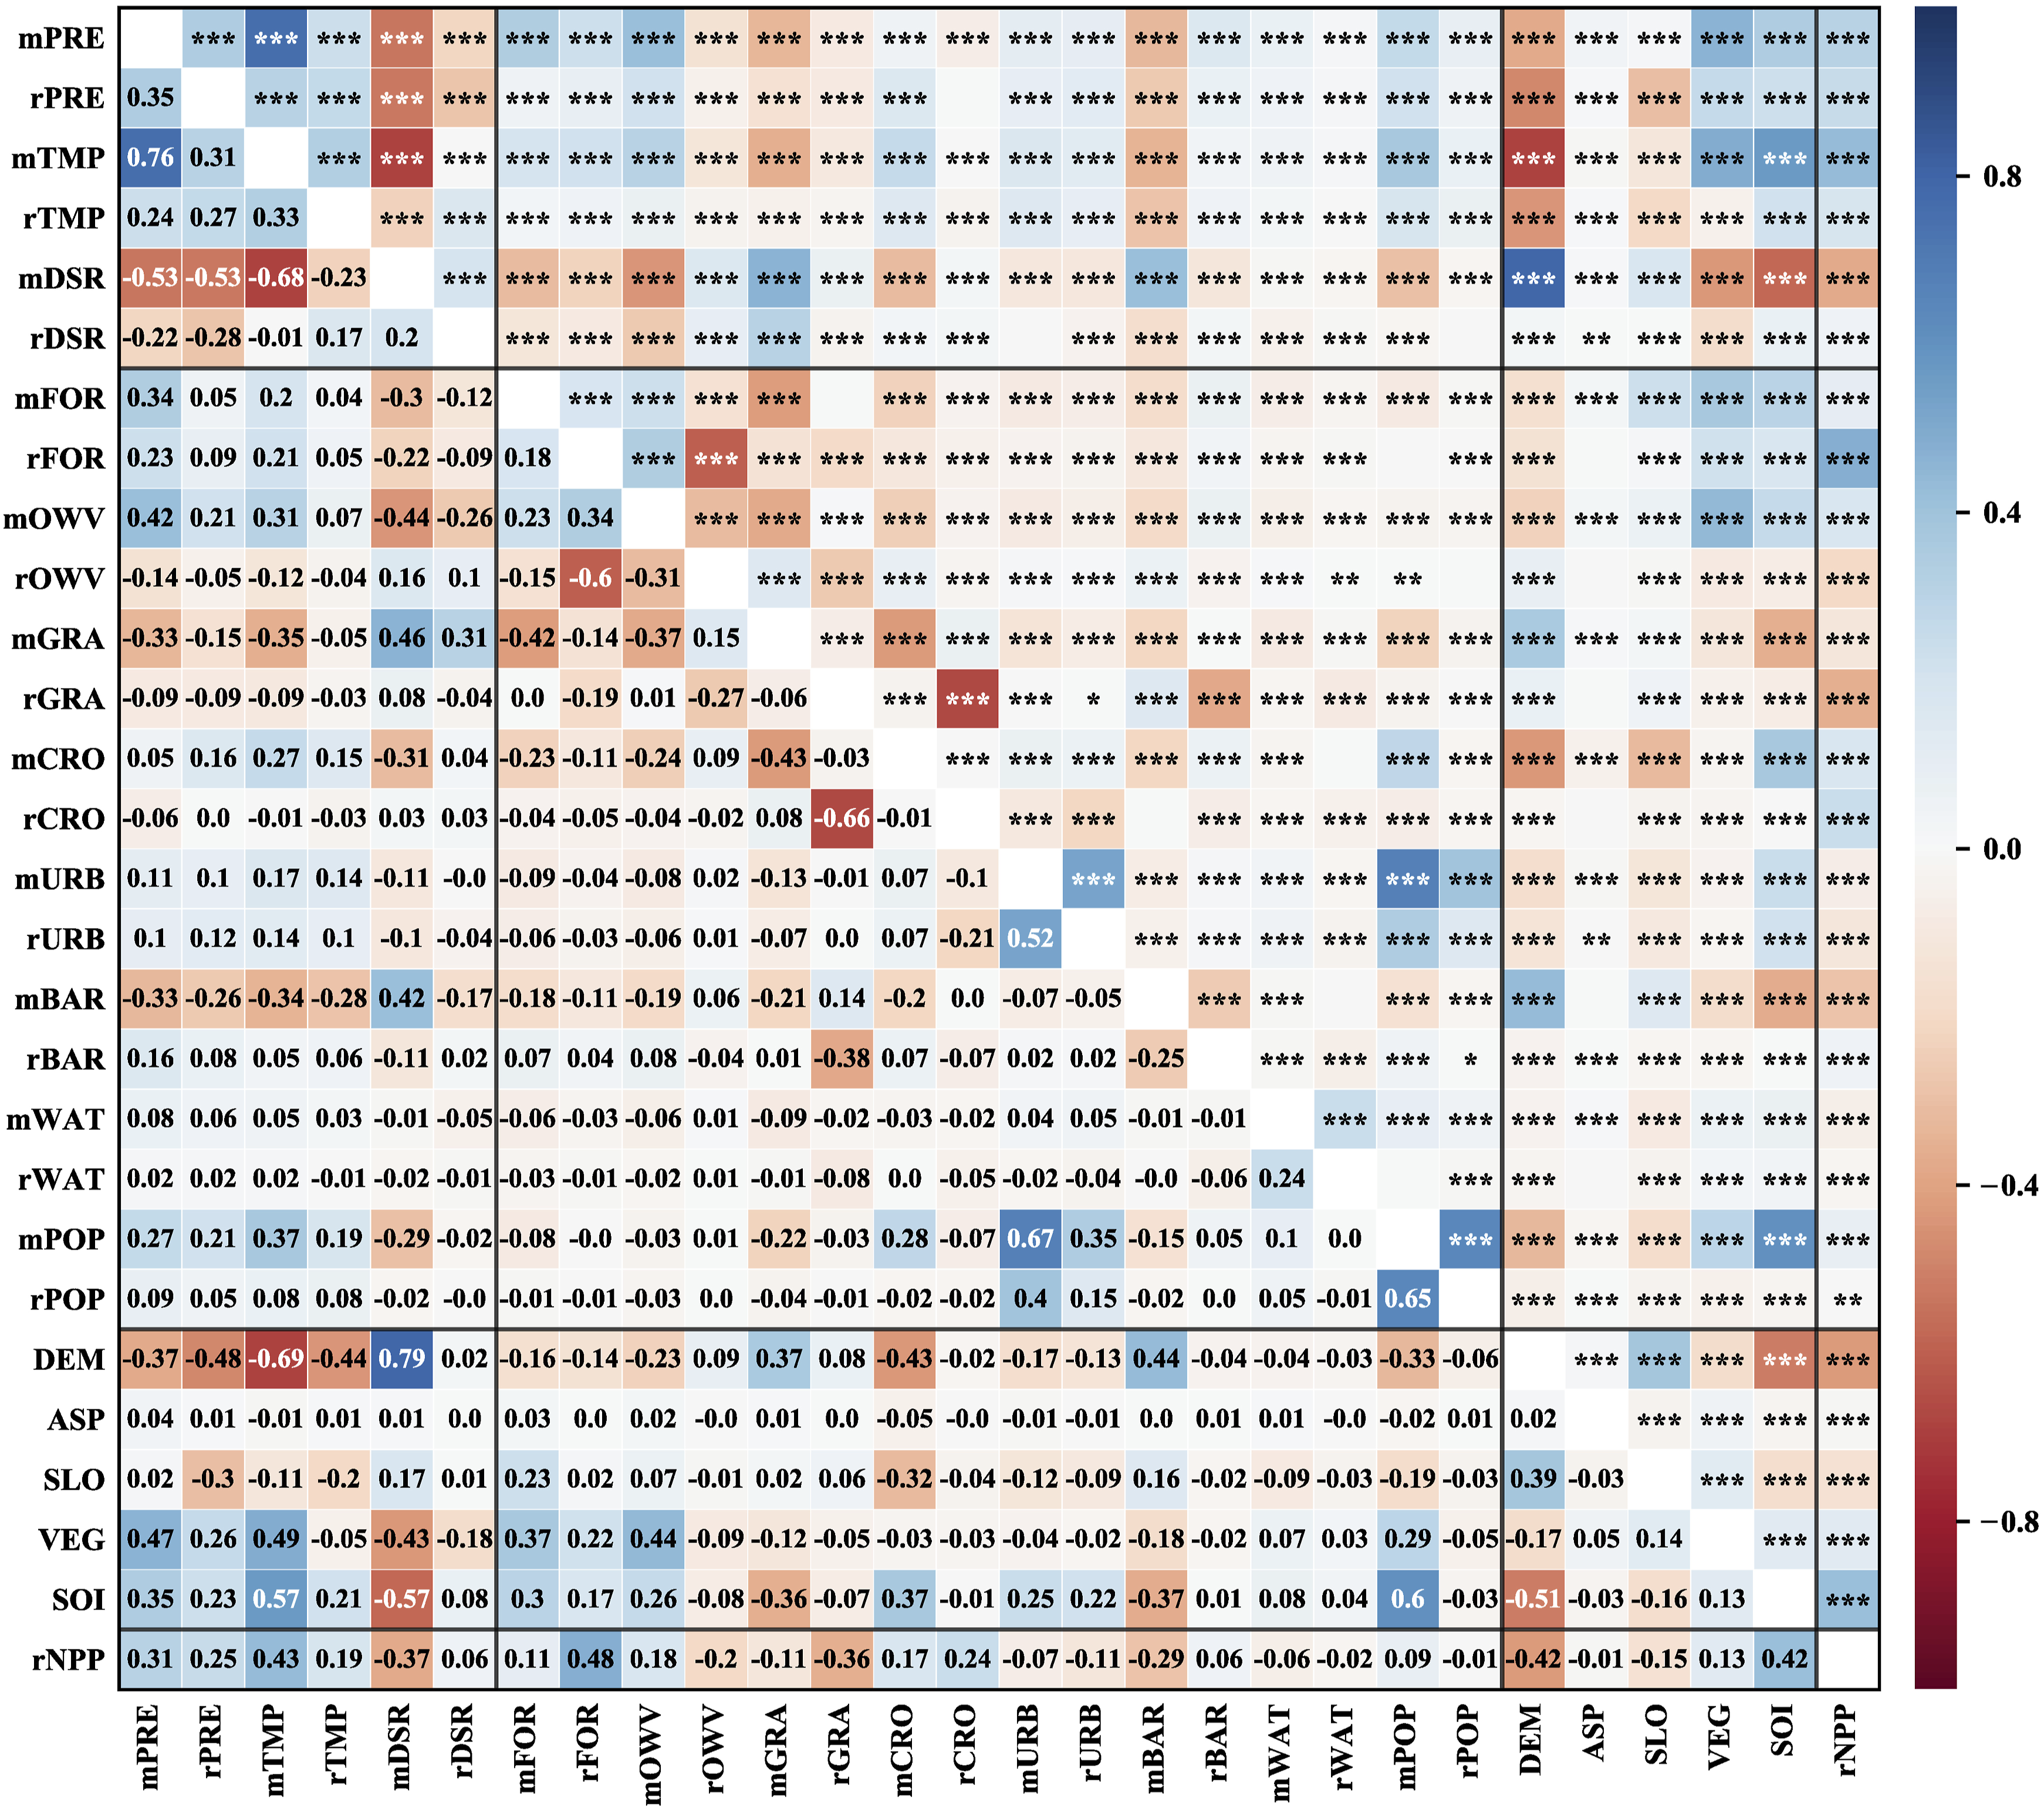
Discussion
Spatiotemporal variation of NPP
This study showed an apparent decrease in the average NPP of China from southeast to northwest. Previous studies have noted a comparable pattern (Chen et al., 2021; Wang et al., 2017b). This phenomenon is probably caused by a climatic gradient (i.e., temperature and precipitation) (Richardson et al., 2013; Zhang et al., 2016). Locations with lower NPP were primarily found in north and northwest China, which can be interpreted by the spatial variability of precipitation (Liang et al., 2015). Most of these regions reported annual total precipitation of less than 400 mm (Figure 8(a)). In addition, the distribution of vegetation species driven by climate was another pivotal factor that affected the distribution of NPP in China, as grassland or desert vegetation covered in northwest and north China (Figure 8(f) and (i)). Contrastingly, Chinese eastern and southern regions had a wide geographical distribution of forests and shrubs. The climatic conditions with mean temperatures above 16°C and annual precipitation above 1000 mm were well-suited to vegetation growth in these regions (Figure 8(a) and (b)), and then NPP values were generally higher. The annual average and trend of (a) precipitation, (b) temperature, (c) solar radiation, (d) area proportion of FOR, (e) area proportion of OWV, (f) area proportion of GRA, (g) area proportion of CRO, (h) area proportion of URB, (i) area proportion of BAR, (j) area proportion of WAT, (k) population density, (l) NPP in different regions of China.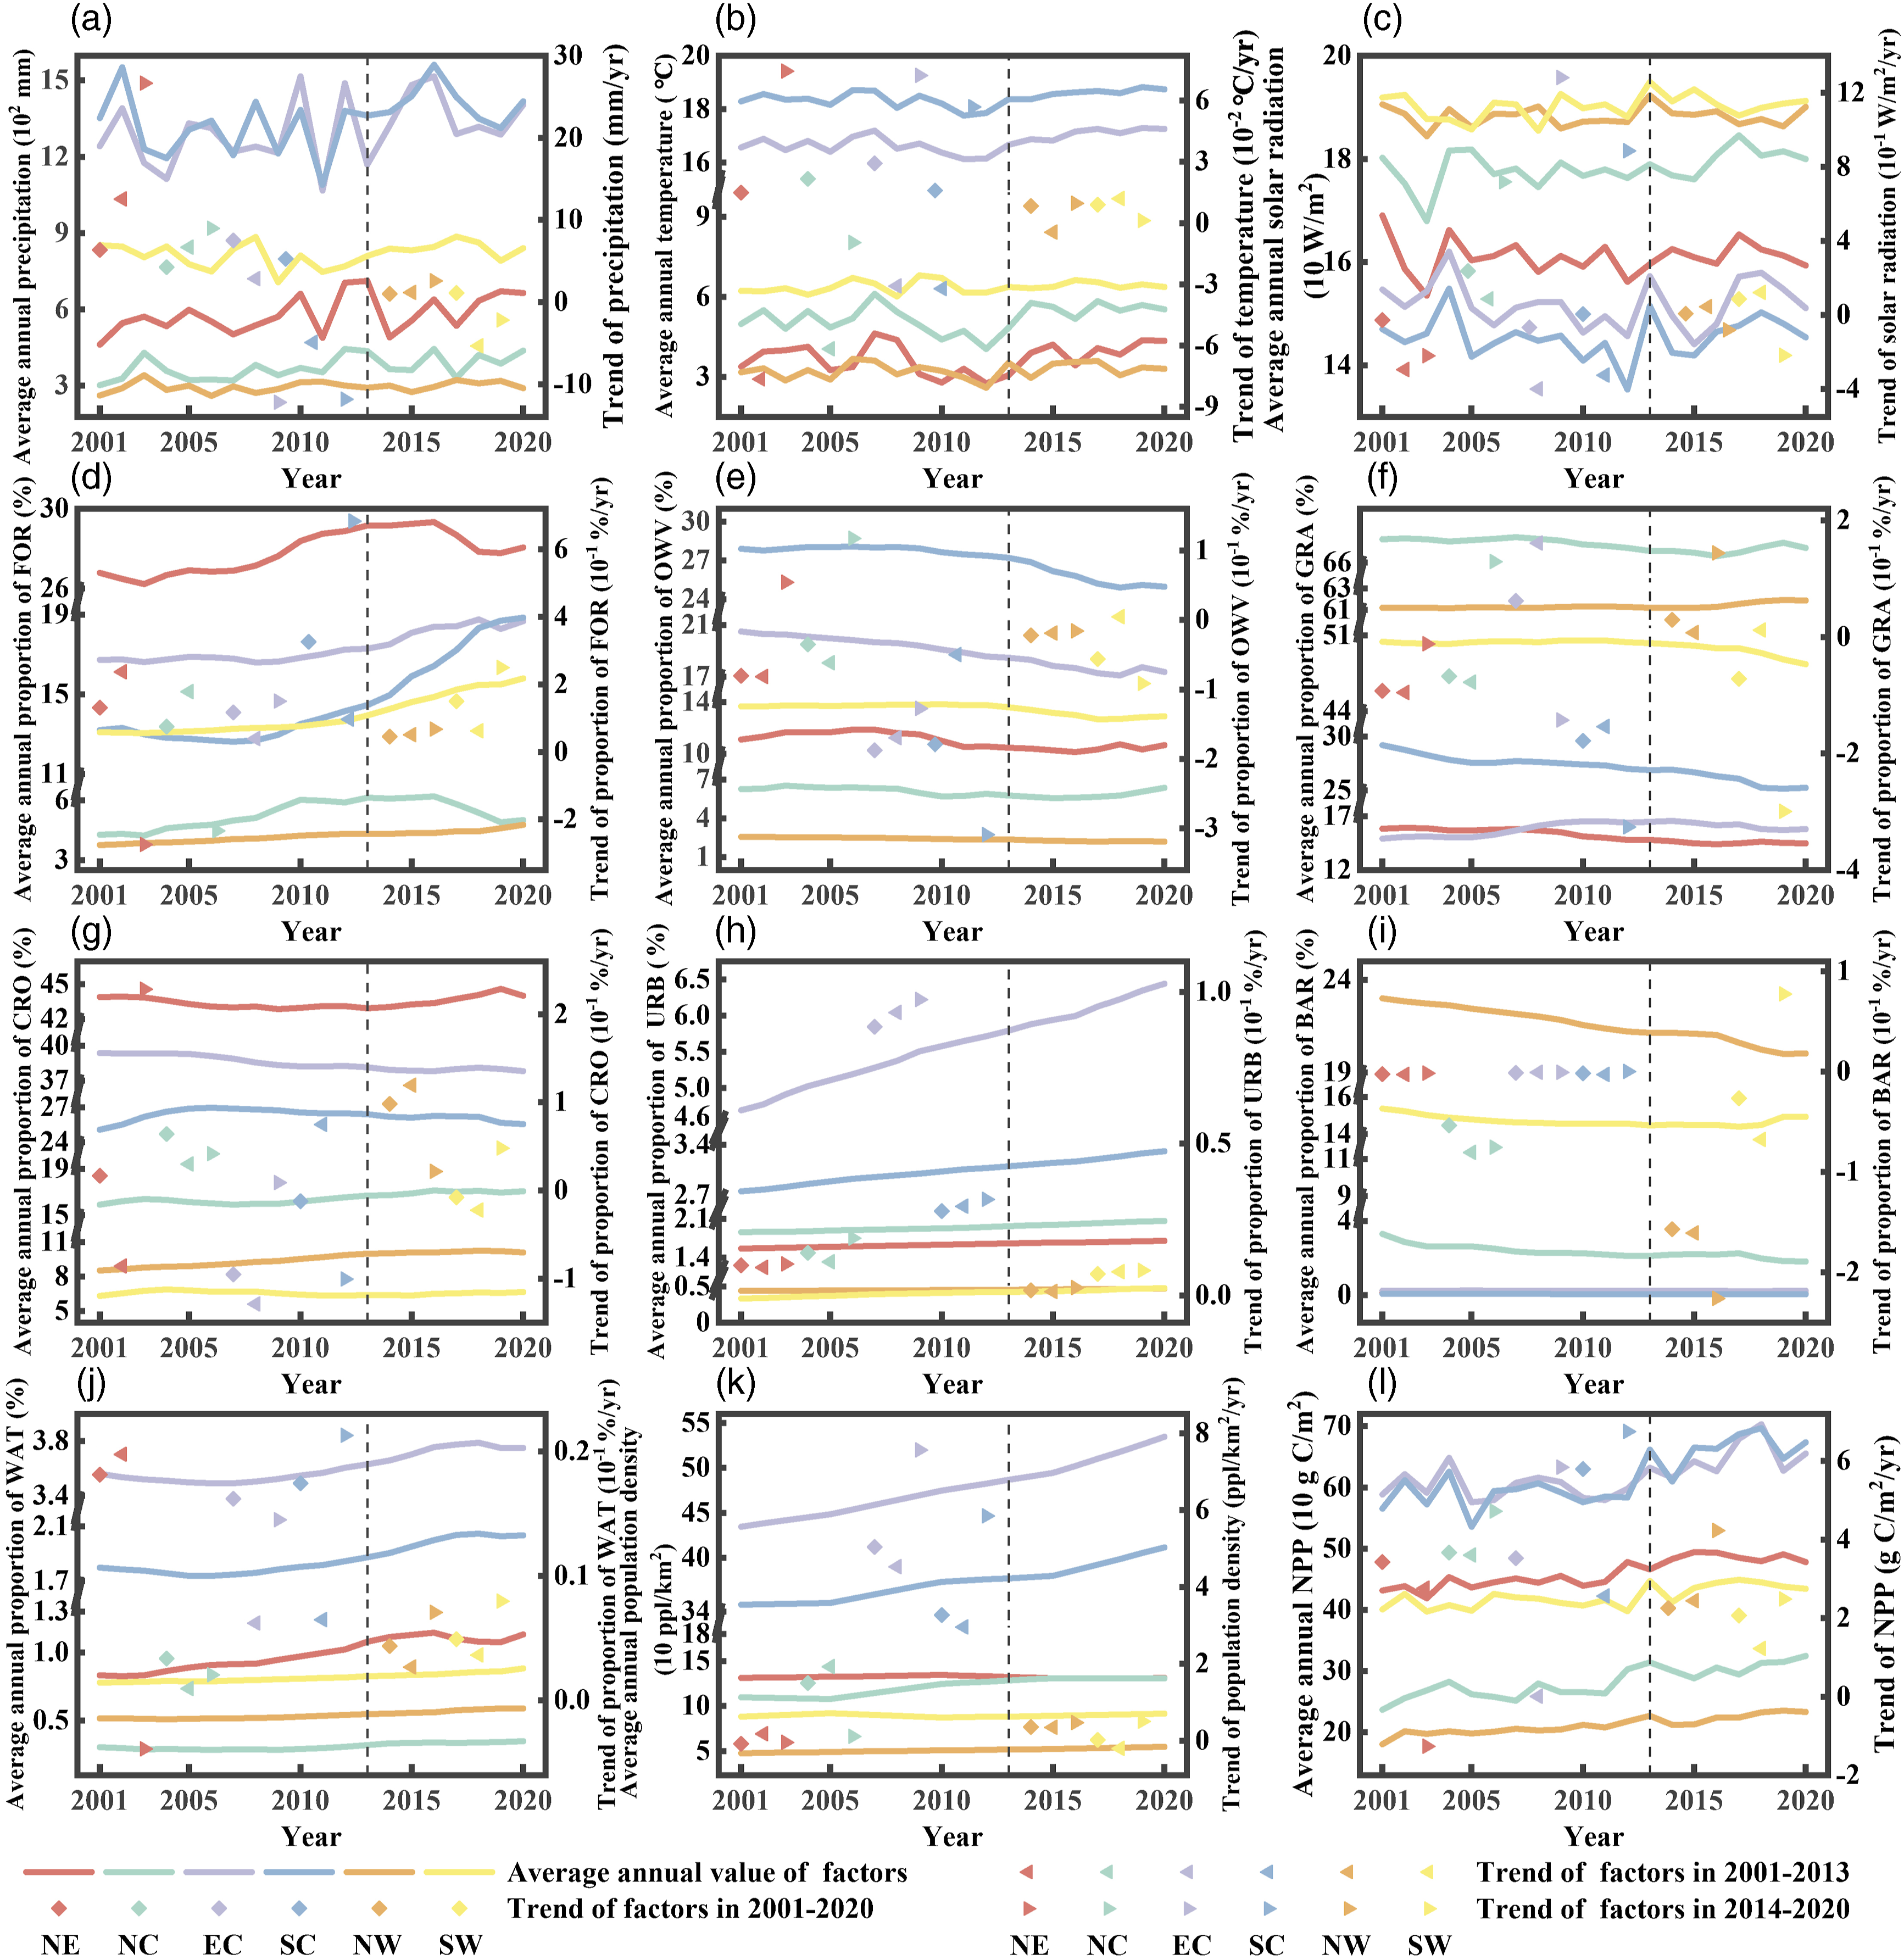
Total NPP increased at 24.91 Tg C/yr speed, in line with previous studies (Chen et al., 2021). Most Chinese regions showed an NPP increasing trend, which might be related to the intensification of ecological consciousness, especially for the implementation of ecological projects (Figure S3) (Cao et al., 2011; Lu et al., 2018; Shao et al., 2022). Conversely, the NPP reducing trend accounted for approximately 8.96%, distributed in eastern and central China (Guan et al., 2019; Wang et al., 2021). The descent was perhaps a result of urbanization. Rapid urbanization led to a gathering of people, a reduction of woodlands, and a frequent occurrence of extreme weather, which all could weaken vegetation’s carbon sequestration capability (Figure 9). Besides, the conversion of cropland or grassland to urban also further contributed to NPP loss (Liu et al., 2019). These results recommended that enhancing the construction and management of natural reserves and reducing the intensity of anthropogenic interference will contribute to improving ecological benefits and achieving the goal of carbon neutrality. The annual average and trend of (a) precipitation, (b) temperature, (c) solar radiation, (d) area proportion of FOR, (e) area proportion of OWV, (f) area proportion of GRA, (g) area proportion of CRO, (h) area proportion of URB, (i) area proportion of BAR, (j) area proportion of WAT, (k) population density, (l) NPP in different trends of NPP (whole, Dec*, Inc* represent all trends, significant decrease trends (p < .05), significant increase trends (p < .05), respectively).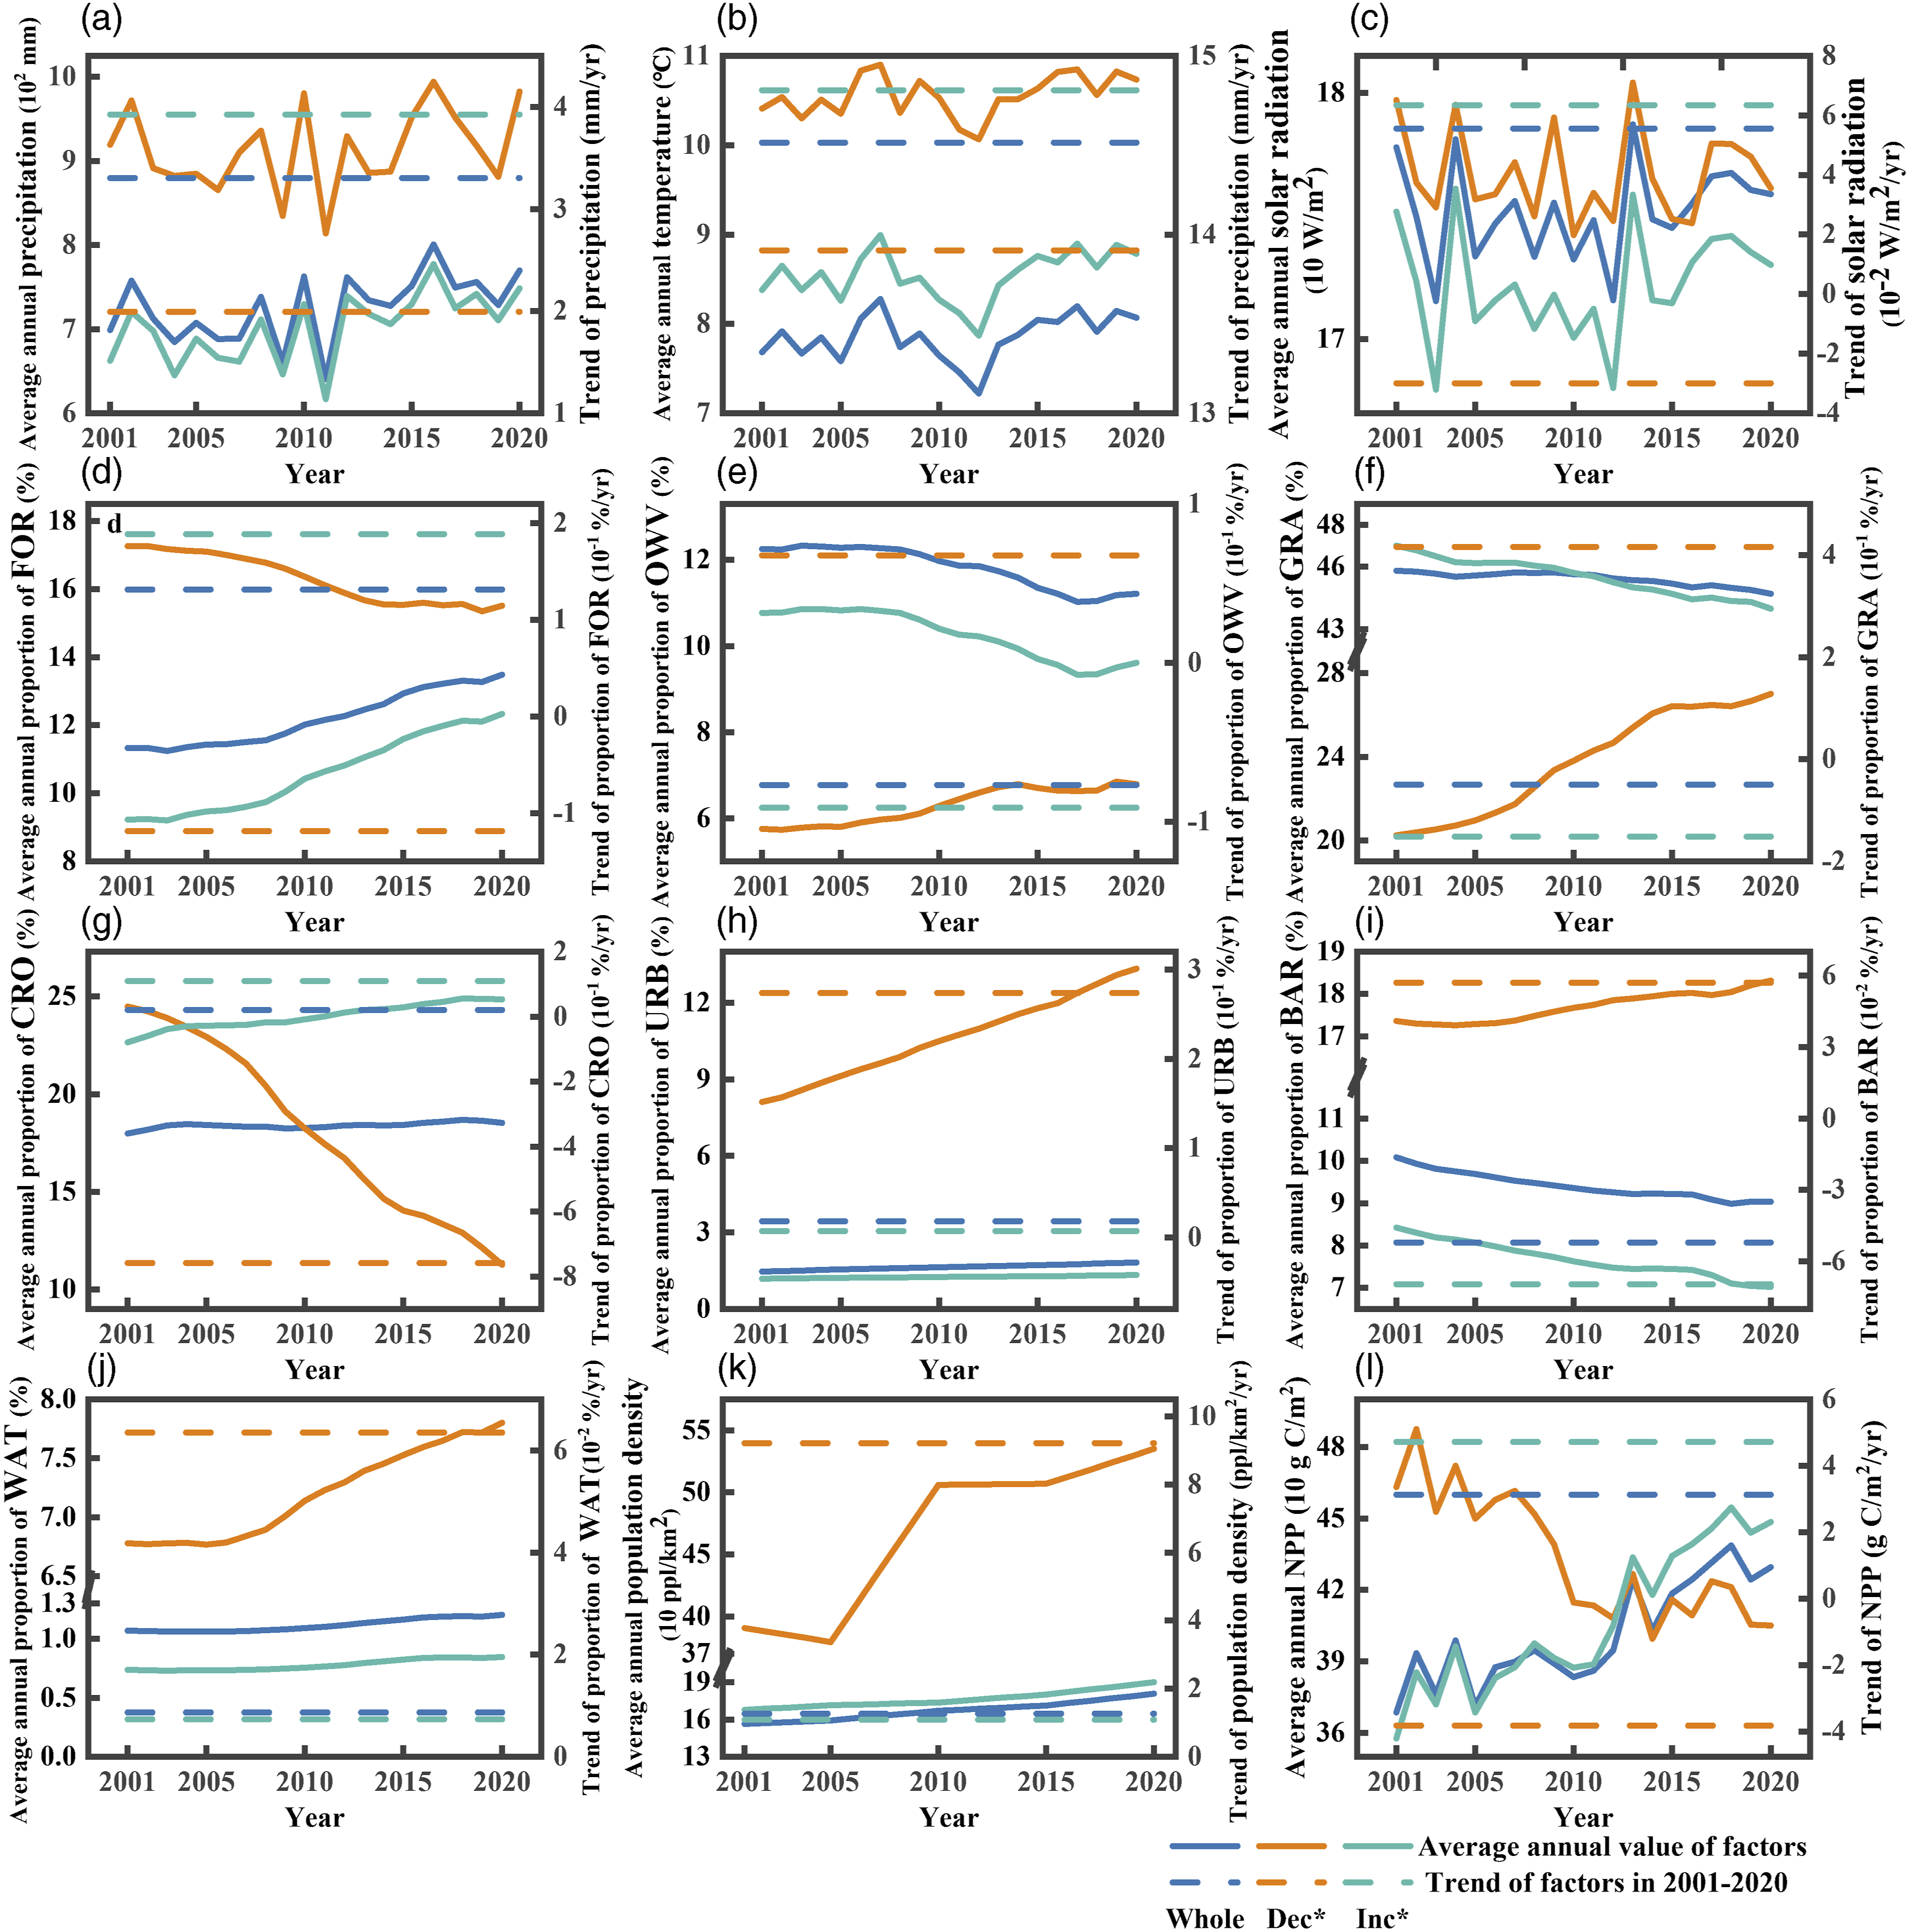
Leading driving factors of NPP variation
Various factors related to climatic factors, human activities, and land surface properties all carry inconsistent degrees of impact on NPP variations. Identifying the main drivers of NPP variations can provide scientific support for addressing global climate change and ecological conservation (Liu et al., 2021a). In China, human activities significantly influenced vegetation carbon sequestration (Hum, 59.31 ± 0.06%) (Table S4), and this impact was higher than climatic factors (Clim, 33.93 ± 0.07%) (Chen et al., 2020b). Land use/cover (LUC, 33.97 ± 0.09%) was a key driver of NPP variability, specifically increased forest cover (rFOR, 17.40 ± 0.12%), showed that increasing forest cover could be a helpful strategy for increasing carbon sinks in China (Zhou et al., 2017b). In parallel, climatic factors (Clim, 33.93 ± 0.07%) also affected vegetation growth and NPP variability, as supported by historical studies (Hao et al., 2014; Ren et al., 2022; Shi et al., 2023). Population density (POP, 25.34 ± 0.07%) also required attention. We individually analyzed the relative contributions and correlation of drivers at zones of the significantly decreased NPP and the significantly increased NPP to clarify further the impact of different factors on NPP dynamics (Figure S4–6). The result indicated that human management (Hum, 64.29 ± 0.17%; mPOP, 28.92 ± 0.07%) increased NPP when the average population density was below 190 people/km2 (Figures 9(k) and 10 Inc* and Figure S5). This may be attributed to human management in urban (irrigation, fertilization, introduction of species, etc.) that promotes plant growth, while the urban heat island effect indirectly generates optimal climatic conditions for vegetation development (Chen et al., 2022; Zhang et al., 2022a; Tong et al., 2020). In contrast, climate was the significant reason for the decrease in NPP (Clim, 48.51 ± 1.73%), especially for the high temperature (mTMP, 34.94 ± 1.33%; mTMP vs rNPP, −0.58) (Figure S6). Additionally, forest degradation and deforestation caused by climate or human activities (mFOR, 16.05 ± 0.88%; rFOR, 9.94 ± 1.52%) negatively affected the carbon sequestration of vegetation (Figure 10 Dec*) (Liu et al., 2019; Zhong et al., 2019). Overall, climatic conditions significantly limit the restoration of ecological systems. Ecological building strategies require consideration of climatic factors, coupled with controlling the intensity of economic activities (deforestation, cultivated land occupation, e.g.) and tightening the construction and management of nature reserves, which can help achieve ecological restoration and carbon neutrality goal. The relative contribution of different factors in different trends of NPP (Dec*, Inc* represent the significant decrease trends (p < 0.05), significant increase trends (p < 0.05), respectively).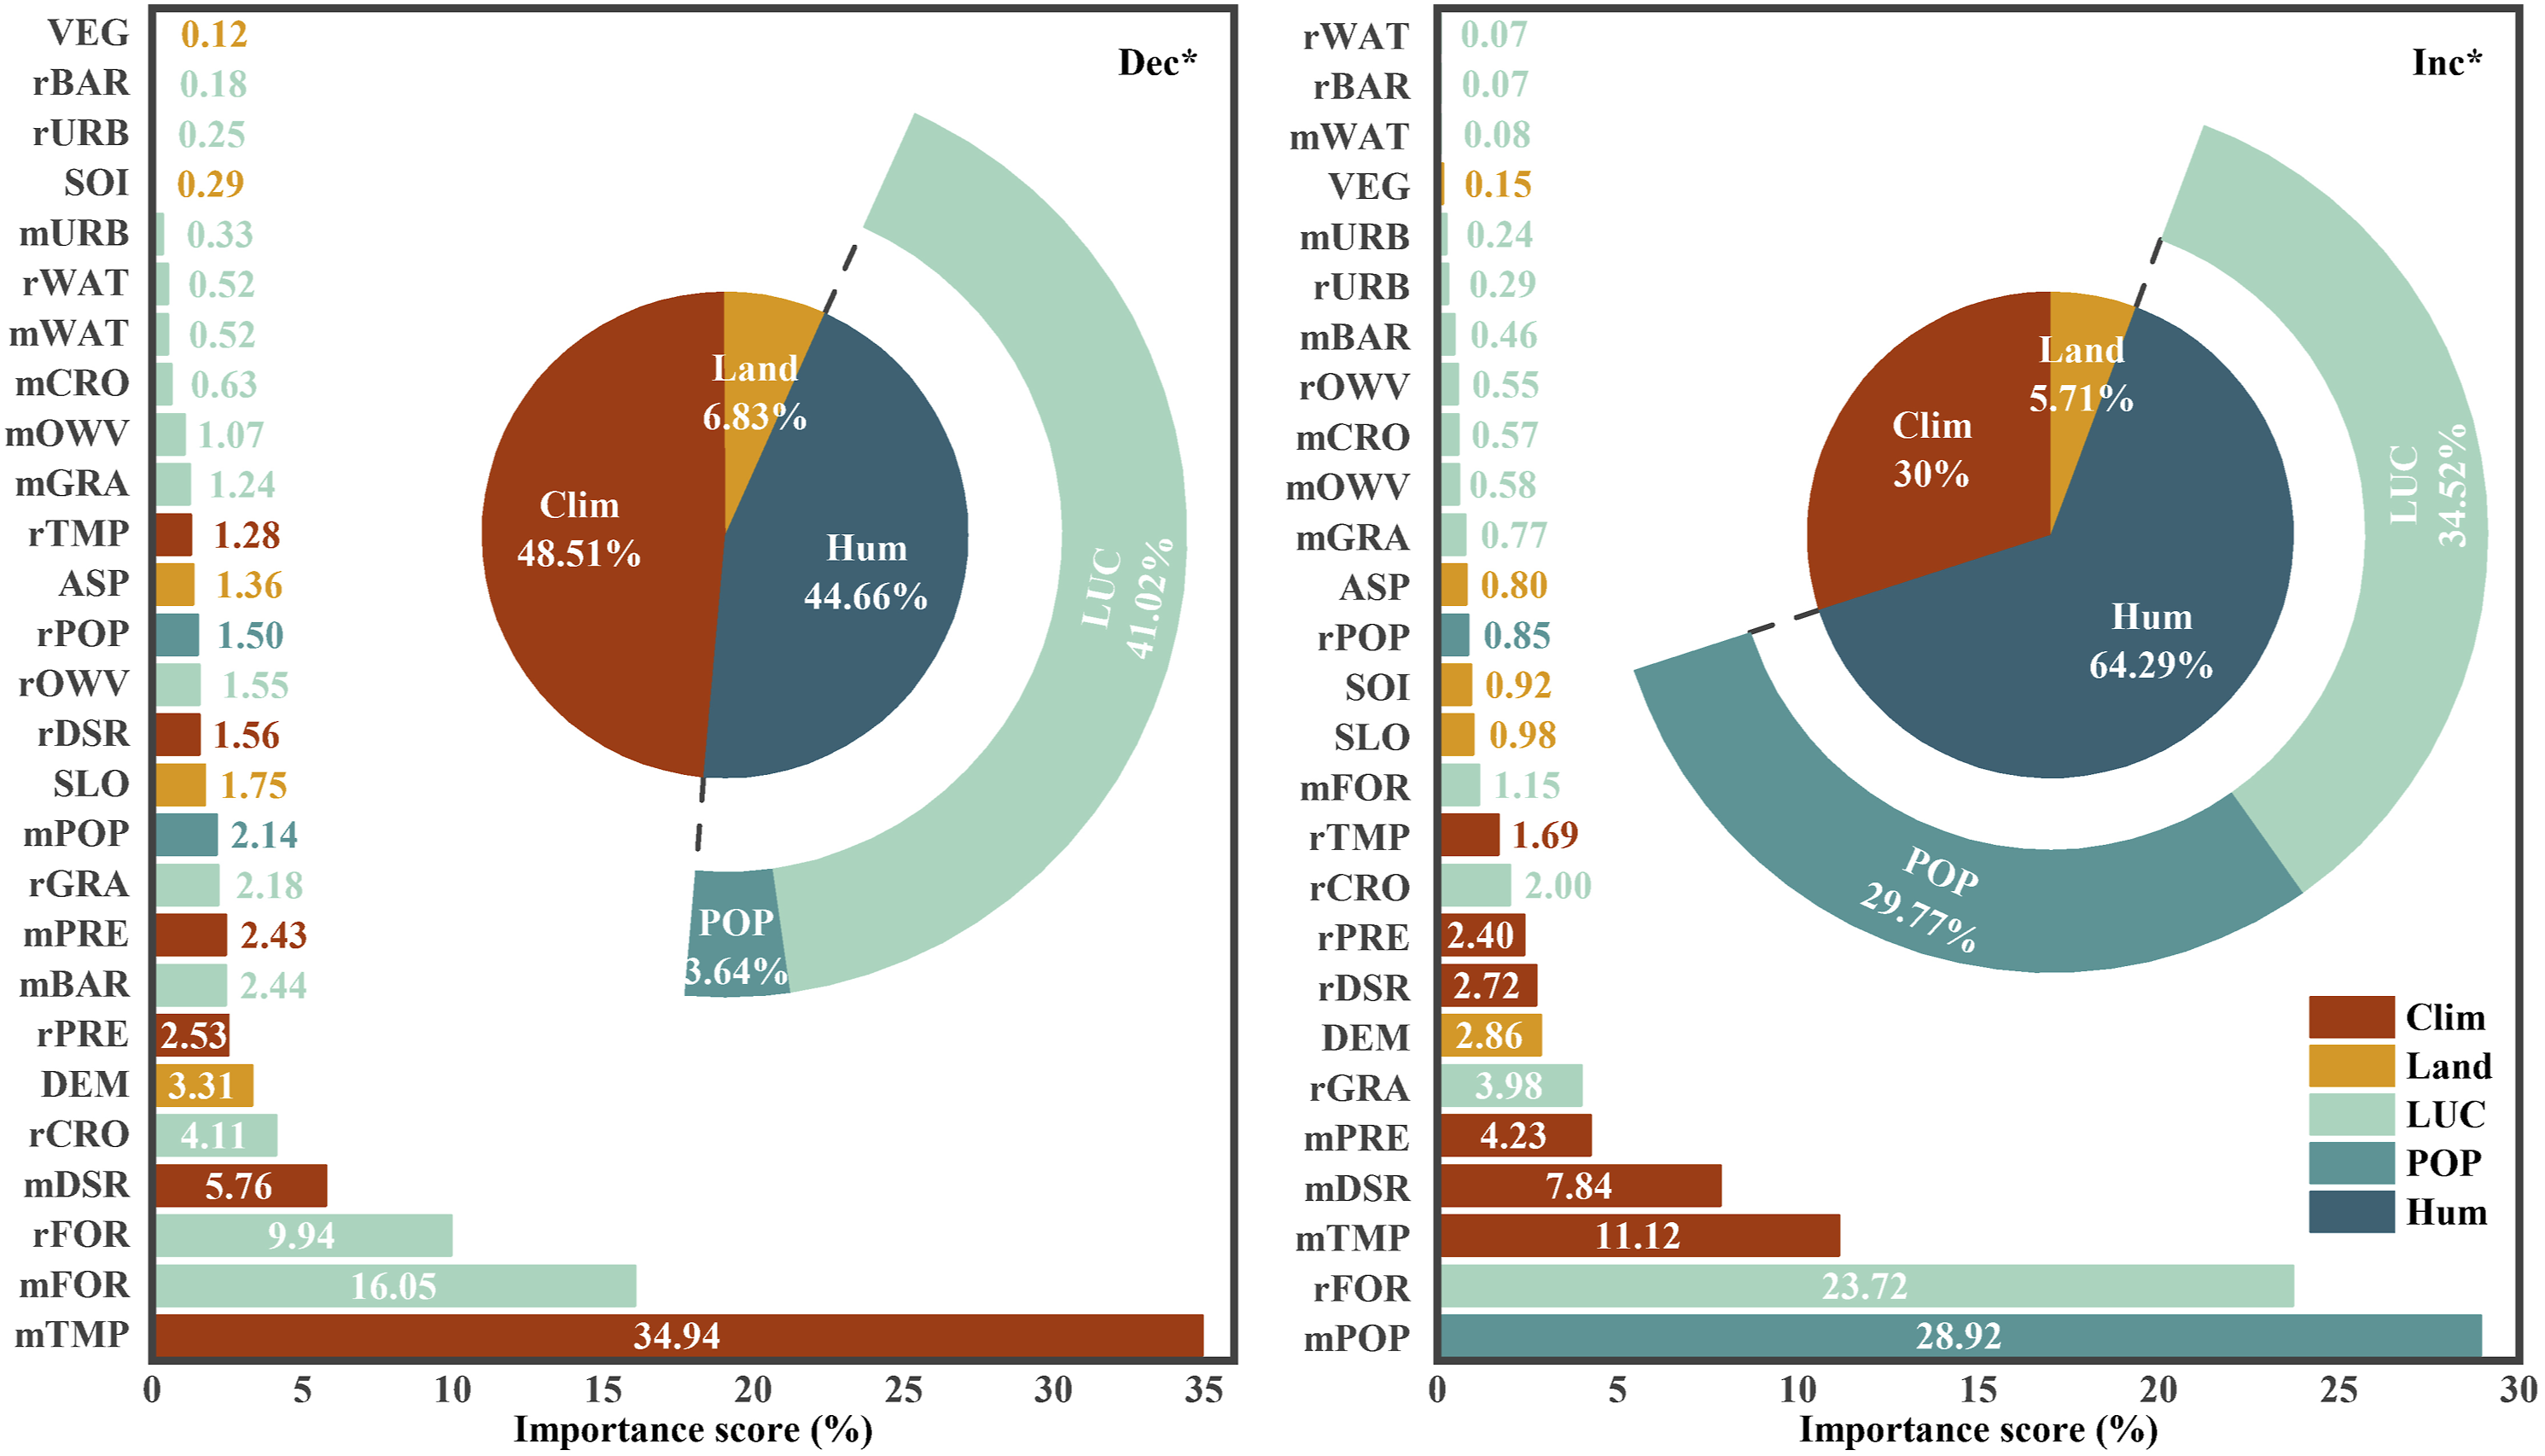
There was significant variation in the leading driving factors of NPP change across different regions of China, which can inform targeted initiatives to increase carbon storage and achieve carbon neutrality. Human activities were the predominant driving factor of NPP variation throughout China’s geographic regions, excluding northern China. There are predominantly arid or semi-arid climates in north and northwest China with annual precipitation below 400 mm, which led to precipitation being a limiting factor for vegetation growth in this region. Moreover, land use/cover had less impact on NPP variation than climate, which suggested ecological projects might have limited implications on re-vegetation in these regions (Cai et al., 2020). The leading influencers of NPP changes in northern China were precipitation (mPRE, 28.28 ± 0.80%), grassland changes (rGRA, 20.44 ± 0.77%), and temperature (mTMP, 8.17 ± 0.11%). In the northern agriculture-animal husbandry ecotone, a zone of north China with relatively high precipitation and temperature, NPP increased significantly and ecological restoration was better (Hao et al., 2014; Zhou et al., 2007). The climate continued to play a dominant role in NPP changes in north China. Thus, the additional inputs for ecological restoration projects in north China might require a more rigorous assessment, especially the significant forest degradation observed after 2013 (Figure 8(d)). Appropriate irrigation, increasing precipitation, and planting drought-tolerant vegetation may be effective measures to enhance ecological benefits in northern China.
Population density contributed the most to NPP variation in northwest (mPOP, 44.06 ± 0.14%) and southwest (mPOP, 35.70 ± 0.21%) China. Lower population density was typical in both regions, particularly in highland mountainous areas with poor precipitation and cold temperatures. Thus, in urban areas of this region, human management, such as artificial irrigation and fertilization, directly promoted vegetation growth. The urban heat island effect also indirectly creates favorable conditions for surrounding vegetation growth (Zhang et al., 2022a). Precipitation was the second highest contributing factor in northwest China (mPRE, 15.56 ± 0.34%; rPRE, 5.44 ± 0.21%), which indicated that precipitation could restrict plant photosynthesis. In places with better water availability (glacial meltwater, inland lakes or higher precipitation) in Xinjiang and the Loess Plateau, the agricultural development (rCRO, 11.04 ± 0.14%) and forest growth (rFOR, 3.79 ± 0.08%) significantly increased NPP (Shi et al., 2007, 2021; Zhang et al., 2018). In southwest China, ecological projects, including the Grain for Green Project (GGP), the Natural Forest Protection Project, the Yangtze River Shelter Forest Project, and the Karst Rocky Desertification Comprehensive Control and Restoration Project, have increased forest cover (rFOR, 16.46 ± 0.28%) within Sichuan, Yunnan, Guizhou, and Chongqing combination (Chen et al., 2020b; Qi et al., 2013; Zhang et al., 2021). Nevertheless, climate change (rPRE, 9.51 ± 0.20%) has degraded Tibet’s primary forests and the Tibetan Plateau’s alpine grasslands (Han et al., 2018; Sun et al., 2016; Wang et al., 2022c; Zhang et al., 2014). Therefore, constructing an ecological environment in western China should be adapted to local conditions, and the intensity of human activities should be controlled. In northwest China, the water supply should be monitored, and the measure of irrigation and drought-tolerant vegetation plantation may be helpful to ensure the efficiency of ecological projects (Li et al., 2021a; Wang et al., 2023). In southwest China, it is essential to protect natural forest resources, implement afforestation and reforestation policies, and prohibit unreasonable exploitation.
In east (LUC, 53.79 ± 0.31%), northeast (LUC, 46.65 ± 0.70%), and south-central (LUC, 61.19 ± 0.29%) China, land use and cover had the highest contribution to NPP variation, which could indicate these areas had significant benefits of ecological projects (Chen et al., 2021). Since “North Shelter Forest,” “Forest Protection,” and “GGP” projects were introduced, grassland in northeast China has been converted into forest or farmland (rGRA, 20.38 ± 0.30%), and then forest coverage has increased dramatically (rFOR, 14.88 ± 0.45%), which all brought a higher NPP and resulted in higher ecological and social benefits (Zhu et al., 2006b, 2017). Temperature and DEM contributions (mTMP, 10.71 ± 0.22%; DEM, 9.19 ± 0.65%) and their correlation with NPP changes (mTMP, −0.12; DEM, 0.1) (Figure S7) reminded us that warming might negatively affect ecosystems (forest species changes, forest fires, pests or others) in northeast China (Wang et al., 2013). Accordingly, to cope with climate change, northeast China should proceed with ecological projects and develop vegetation adaptive to warmer and drier conditions (He et al., 2020; Wang et al., 2013). Southeast China has a suitable climate for people and abundant vegetation. Still, rapid urbanization and economic development brought ecological and environmental problems (e.g., atmospheric and water pollution) and severe problems of vegetation destruction and degradation problems (Liu et al., 2018; Yang et al., 2020; Zhang et al., 2020). To overcome the previous problem, the Chinese government has, since the 1990s, launched the projects of “GGP,” “River Shelter Forest,” and “Karst Desertification Control” and initiated the building of an ecological civilization (Du et al., 2021; Wang et al., 2013). Therefore, during 2001–2020, southeast China showed continued growth of forest cover (rFOR: EC, 24.68 ± 0.39%; SC, 41.65 ± 0.30%), an impressive increase of vegetation NPP, and a great benefit of ecological projects under suitable climate (Chen et al., 2019, 2020b; Tong et al., 2020; ). Solar radiation (EC: rDSR, 9.17 ± 0.36%; mDSR, 7.84 ± 0.24%. SC: mDSR, 10.99 ± 0.30%; rDSR, 4.45 ± 0.20%.) was the determining climatic influence of vegetation growth in southeast China. The significantly increased solar radiation in south China might be one of the primary reasons for China’s accelerated NPP growth after 2013 (Figure 8(c) and (l)) (Wang et al., 2017a, 2017b). Southeast China should proceed to strengthen its environmental management and ecological construction efforts to reduce environmental pollution, which will be of great relevance in accelerating the achievement of the carbon neutrality target.
Uncertainties and limitations
Understanding the mechanisms of NPP is essential for managing terrestrial ecosystems and achieving carbon-neutral target. We modelled and assessed the spatiotemporal pattern of NPP in China and explored the relative contribution of three category factors on NPP variation. However, there remained some uncertainties and limitations in our study. Considering the time range of our research was 2001–2020, and the accuracy of datasets was important (Bormann et al., 2009; Zhao et al., 2015), we obtained all datasets that were widely used and validated in China. The spatial resolution of these datasets was inconsistent. We processed all data to the spatial resolution of 5 km using the typical average and cubic interpolation methods because of the inconsistent spatial resolution of these datasets and the attempt to reduce the missing data in the FPAR dataset. This resolution was considered acceptable in modelling NPP and its variation in China (Ahl et al., 2005; Chen et al., 2021; Gu et al., 2017; Sun et al., 2021). The analysis of model validation also suggested that the NPP simulated by the CASA model in this study performed well in China. Still, the inconsistency of data resolution and the simple processing method of data inevitably included uncertainties in the results. Besides, long-term series analysis (the MK method) usually requires 30 years of data at least for reliable results (Xue et al., 2021). We should attempt to produce a long-time series of higher-quality NPP products by improving the processing of datasets and using better remote sensing products in future works.
Various factors, not only physiological and ecological factors but also environmental factors, can influence vegetation NPP. Environmental factors, such as CO2 concentration, nitrogen deposition, soil nutrients, and soil moisture, can affect vegetation NPP by affecting vegetation photosynthesis (Friend et al., 2014; Liu et al., 2013). In this study, we focused on the relative impact of human activities, climate change, and land surface properties on vegetation NPP variation, ignoring the influence of environmental factors. That is a limitation of this study, and we will try to include environmental factors in our analysis of drivers in future works. Besides, this study did not give the site-based contribution of different factors on NPP variation. In the future, we could consider combining machine learning and factorial experiments (Tian et al., 2022) to map the contribution of factors which could inform ecological restoration strategies in specific locations. Moreover, the interactions between drivers were not profoundly explored. We will attempt to use a combination of machine learning and geographically weighted regression (Wang et al., 2022a) to gain a deeper understanding of the mechanisms behind NPP variation by depicting the interactions between multiple factors more accurately.
Conclusion
We used the CASA model to simulate the productivity patterns of Chinese vegetation. Then, the RF model was applied to analyze the relative contributions of climate, human activities, and land surface properties to NPP dynamics. NPP’s spatial distribution typically followed a declining direction from southeast to northwest. There was a notable increase in total NPP from 2001 to 2020. The increased NPP in China was primarily driven by human activities, with a 64.29 ± 0.17% contribution from human activities at the significantly increased NPP zone. That resulted from human management providing advantageous conditions for vegetation growth and ecological projects such as afforestation contributing to increased forest cover. This finding highlighted the importance of ecological restoration initiatives and forest carbon sinks for ecological restoration and achieving carbon neutrality goal in China. The primary driving factors of NPP variation performed differently in different geographical regions. North China maintained climatic dominance (52.38 ± 0.91%), and precipitation (33.39 ± 0.80%) was the chief limiting factor for vegetation growth. There was a need to consider the interaction of grassland change (20.44 ± 0.77%) with climate and ecology in northern China. Human activities made the most significant contribution to the NPP variation of the remaining geographies, indicating the encouraging achievements of eco-engineering and eco-civilization in these regions. Human management measures, along with precipitation, drove NPP to increase in northwest and southwest China. In east, northeast, and south-central China, NPP variation mainly resulted from land use change, primarily grassland, cropland, and forest change, which indicated the effectiveness of ecological engineering in these regions. Simultaneously, the negative impacts of warming on forest ecosystems in northeast China (forest species changes, forest fires, pests or others) demand attention. As for south-central and east China, we should focus on the problem of atmospheric pollution to avoid the loss of carbon sinks due to solar radiation reduction. Overall, ours expand the understanding of the driving factors of NPP change, informing different strategies for achieving ecological restoration and carbon neutrality.
Supplemental Material
Supplemental Material - Human activities significantly impact China’s net primary production variation from 2001 to 2020
Supplemental Material for Human activities significantly impact China’s net primary production variation from 2001 to 2020 by Yiling Cai, Xiaoping Liu, Kangyao Liu, Li Zeng, Youyue Wen, Changjiang Wu, Haoming Zhuang, and Bingjie Li in Journal of Progress in Physical Geography: Earth and Environment.
Footnotes
Author contributions
Y.C. (First Author): Conceptualization, Methodology, Software, Formal analysis, Writing-Original Draft, Visualization, Writing – Review & Editing; X.L. (Corresponding Author): Conceptualization, Supervision, Resources, Funding acquisition; K.L.: Writing – Review & Editing; L.Z.: Writing – Review & Editing; F.P.: Writing – Review & Editing; H.Z.: Software; Y.W.: Software, Funding acquisition; C.W.: Resources; B.L.: Resources.
Declaration of conflicting interests
The author(s) declared no potential conflicts of interest with respect to the research, authorship, and/or publication of this article.
Funding
The author(s) disclosed receipt of the following financial support for the research, authorship, and/or publication of this article: This study was financially supported by the National Science Fund for Distinguished Young Scholars (grant 42225107); the National Key Research and Development Program of China (grant 2022YFB3903402); the National Science Foundation for Young Scientists of China (grant 42007406); and the Guangdong Natural Science Foundation-General Program (grant 2022A1515010632).
Supplemental Material
Supplemental material for this article is available online.
References
Supplementary Material
Please find the following supplemental material available below.
For Open Access articles published under a Creative Commons License, all supplemental material carries the same license as the article it is associated with.
For non-Open Access articles published, all supplemental material carries a non-exclusive license, and permission requests for re-use of supplemental material or any part of supplemental material shall be sent directly to the copyright owner as specified in the copyright notice associated with the article.