



Abstract
Fine particulate matter (PM2.5) is a major source of air pollution and exerts serious impacts on human health. The 3D urban landscape patterns can significantly affect the diffusion and emissions of PM2.5. However, studies on the relationships between 3D urban landscape patterns and PM2.5 pollution across different seasons remain understudied. With the ground-level air pollutants estimated by the remote sensing and fine-scale building information, this study applied the multiscale geographically weighted regression model to explore such relationships. Wuhan, the largest metropolis in Central China, was selected as the study area for the application of our methodology. The results showed that the direction, degree, and scale of the effect of 3D urban landscape patterns on PM2.5 pollution varied across seasons. For building height, the standard deviation of building height had a significant positive correlation with PM2.5 all year round. For building density, the building count density showed a significant positive correlation with PM2.5 in general, with the bandwidth in winter and autumn smaller than in spring and summer. The building plan area fraction exerted both positive and negative influences on PM2.5, dependent on season and location. The bandwidth of it gradually increased from spring to winter, with the effect changing from local to regional scale. For building volume, the floor area ratio showed a significant negative correlation with PM2.5 in winter and autumn, and a localized effect was found, especially in winter. The findings of this study provide practical implications for urban planning and policy making to mitigate PM2.5 pollution in the rapidly urbanizing regions.
Introduction
Air pollution has become one of the most serious environmental problems in China (Lu et al., 2020). PM2.5 (particulate matter with aerodynamic diameter less than 2.5 μm) is one of the main air pollutants and poses a great threat to public health (Ulpiani, 2021). PM2.5 can induce asthma and respiratory inflammation (Liu et al., 2022), jeopardize lung functions (Hou et al., 2020), and even promote the incidence of cancer (Park et al., 2022). It is estimated that the deaths related to PM2.5 pollution in China increased from 714,000 in 2000 to 971,000 in 2017 (Yue et al., 2020). To prevent and control PM2.5 pollution, the Chinese Ministry of Ecology and Environment revised the Ambient Air Quality Standards in 2012 (GB3095-2012) and PM2.5 pollution was included in air quality assessment for the first time. Moreover, the State Council of China launched the Air Pollution Prevention and Control Action Plan (APPCAP) in 2013. As the largest air pollution control action ever implemented, the plan aims to reduce PM2.5 concentrations by 10%–25% by 2017 in the cities at prefecture level and above. Up to 2018, however, only 121 out of the 338 cities (accounting for 35.8%) met the standard value of PM2.5 concentrations regulated by the GB3095-2012. Thus, PM2.5 pollution is still a major environmental problem in China and remains a perennial concern to the public. To identify the influencing factors of PM2.5 pollution and take effective measures to abate PM2.5 pollution in Chinese cities have become urgent issues.
During periods of heavy PM2.5 pollution, measures such as promotion of clean energy technology, limitation of the number of vehicles, and relocation of industry are effective at controlling PM2.5 emissions and improving air quality. However, when air quality enters the phase of moderate and low pollution, the above-mentioned measures may become less effective as the sources of PM2.5 emissions become concealed and changeable (Li et al., 2023). At this point, shaping urban landscape patterns is found to be one of the most effective ways to alleviate PM2.5 pollution (Mao et al., 2022). Based on remote sensing data, the impacts of urban size, fragmentation, and compactness on PM2.5 pollution at regional and national scales have been investigated (Sun et al., 2022; Tan et al., 2023; Zhao et al., 2022). In particular, urban compactness has a complex relationship with PM2.5 pollution. On the one hand, a large and compact city tends to have heavier PM2.5 pollution than a decentralized and multi-center city due to its poor diffusion conditions (Mao et al., 2022). On the other hand, the compact urban form can shorten commuting distances and reduce the PM2.5 emissions from public transportation (Wang et al., 2022a). These studies take the city as a whole to explore the relationships between 2D urban forms and PM2.5 pollution, whereas the intra-urban variability of PM2.5 has been ignored. Recent study has shown that the spatial variability of PM2.5 is non-negligible and is closely related to urban landscape heterogeneity (Yuan et al., 2019), which should stimulate our attention.
Recently, advances in high-resolution remote sensing, SAR, and LiDAR facilitate the acquisition of 3D urban information, and the influence of 3D urban landscape patterns on PM2.5 concentrations has been increasingly investigated (Ke et al., 2022; Liu et al., 2021; Xu and Chen 2021; Yuan et al., 2019). A majority of studies have explored such influence based on fixed and mobile air quality monitoring stations (Chen et al., 2021; Ke et al., 2022; Liu et al., 2021; Wang et al., 2022b; Zeng et al., 2022). It has been shown that the 3D urban landscape patterns are closely related to the diffusion and emissions of PM2.5. First, the 3D urban landscape patterns can change ventilation, air temperature, and humidity through the canyon effect, shading effect, and wind-blocking effect, thus affecting the diffusion of PM2.5 (Ke et al., 2022). Second, the 3D urban landscape patterns have a direct or indirect effect on the emissions of PM2.5. For example, Chen et al. (2021) reported that the area with higher floor area ratio (FAR) tends to have larger population and vehicles, resulting in more PM2.5 emissions. In addition to station-based observations, recent development of remote sensing and data processing techniques also enable acquisition of high-resolution and spatially continuous PM2.5 data. Based on remote-sensing-estimated PM2.5, Yuan et al. (2019) explored the associations between built environments (i.e., land use, land cover, and urban form) and PM2.5 concentrations in the central urban area of Wuhan using the spatial lag and error models. Yang et al. (2022) assessed the impact of urban landscape patterns on PM2.5 pollution in Nanchang through adoption of the local climate zones. Undoubtedly, these studies provide a new perspective for urban planning to mitigate PM2.5 pollution.
Although recent studies have made great progress, they have some limitations. First, few studies have taken into account the seasonal effect. The meteorological conditions and PM2.5 pollution sources can vary largely in different seasons. These may cause the relationships between 3D urban landscape patterns and PM2.5 pollution to vary through the year. For example, Cao et al. (2021) found that the influence of 3D urban landscape patterns on PM2.5 pollution is more pronounced in spring and autumn than in winter and summer in Beijing. Second, PM2.5 pollution and urban landscape patterns have high spatial variability. Global regression models assume that the relationships between explanatory and dependent variables are spatially invariable (Hu et al., 2022). By contrast, the geographically weighted regression (GWR) model allows regression coefficients to vary spatially (i.e., local fitting), thus producing higher explanatory power than global regression models (Su et al., 2012). However, GWR assumes that all spatial processes (i.e., explanatory variables) operate at the same spatial scale (Wang et al., 2022c). Previous studies have shown that the influence of 3D urban landscape patterns on PM2.5 pollution had a significant multiscale effect. For example, Shi et al. (2019b) found that compact and open high-rise built environments had a wider range of influence on PM2.5 pollution than the other types. Zeng et al. (2022) estimated PM2.5 concentrations using the land-use regression model and found that the optimal buffer sizes of building height and building coverage ratio were larger than building volume density. Alternatively, the multiscale GWR model (MGWR) allows the relationships between explanatory and dependent variables to vary on different scales with changeable bandwidths (Mansour et al., 2021). To our knowledge, few studies have used MGWR to explore the relationships between urban landscape patterns and PM2.5 pollution, although this approach has been increasingly used in geographical and ecological research (Bi et al., 2022; Mollalo et al., 2020; Rong et al., 2022).
With the above issues in mind, this study is designed to investigate the impact of 3D urban landscape patterns on PM2.5 pollution in the largest metropolis in Central China – Wuhan. Wuhan has experienced rapid urbanization since 2000, resulting in serious PM2.5 pollution (Fan et al., 2022; Xiong et al., 2017). Meanwhile, urban landscape patterns in Wuhan are complex with high spatial heterogeneity. Thus, it is an ideal place to carry out relevant research. Prior to the analysis, the spatiotemporal changes of PM2.5 concentrations in Wuhan during 2000–2018 are first analyzed using recently developed high-resolution remote sensing data to provide essential background information. The relationships between 3D urban landscape patterns and PM2.5 concentrations across different seasons corresponding to 2018 in the central urban area of Wuhan are then investigated using the MGWR model. The specific research objectives are to: (1) characterize the spatial patterns of PM2.5 concentrations across different seasons and the 3D urban landscape patterns in central Wuhan; (2) explore the relationships between 3D urban landscape patterns and PM2.5 concentrations in central Wuhan across different seasons; (3) analyze the seasonal and multiscale effects of the 3D urban landscape patterns on PM2.5 pollution. This study will hopefully improve understanding of the relationships between 3D urban landscape patterns and PM2.5 pollution, and provide valuable information on urban planning to mitigate PM2.5 pollution in rapidly urbanized regions like Wuhan.
Study area
Wuhan, the capital of Hubei Province, is the largest city in Central China (113°41′–115°05′ E, 29°58′–31°22′ N; Figure 1(a)). It lies at the confluence of the Yangtze River and Han River, covering an area of 8569.15 km2 and supporting a permanent population of 13.73 million in 2022 (NBSC, 2023). Wuhan has a subtropical monsoon climate and a flat terrain with low altitudes (generally less than 50 m). Summer (May, June, July, August, and September) is extremely hot and rainy, with daily maximum temperature frequently exceeding 35°C and accumulated rainfall between 600 and 1200 mm. Winter (December, January, and February) is cold and humid, with daily temperature range between 3°C and 12°C on average. Spring (March and April) is windy due to the strong air convection. Autumn (October and November) is sunny and cool with less rainfall (https://hb.cma.gov.cn/). With the rapid urbanization and industrialization, Wuhan has suffered PM2.5 pollution with varying degrees in recent decades (Supplemental Figures S1–S3), which threatens the health of local residents (Bi et al., 2022). On the left: the location of Wuhan in China (a) and the administrative division of Wuhan (b). On the right: the spatial distribution of buildings categorized by the number of floors in central Wuhan (c). The red dot pinpoints the geographically weighted city center.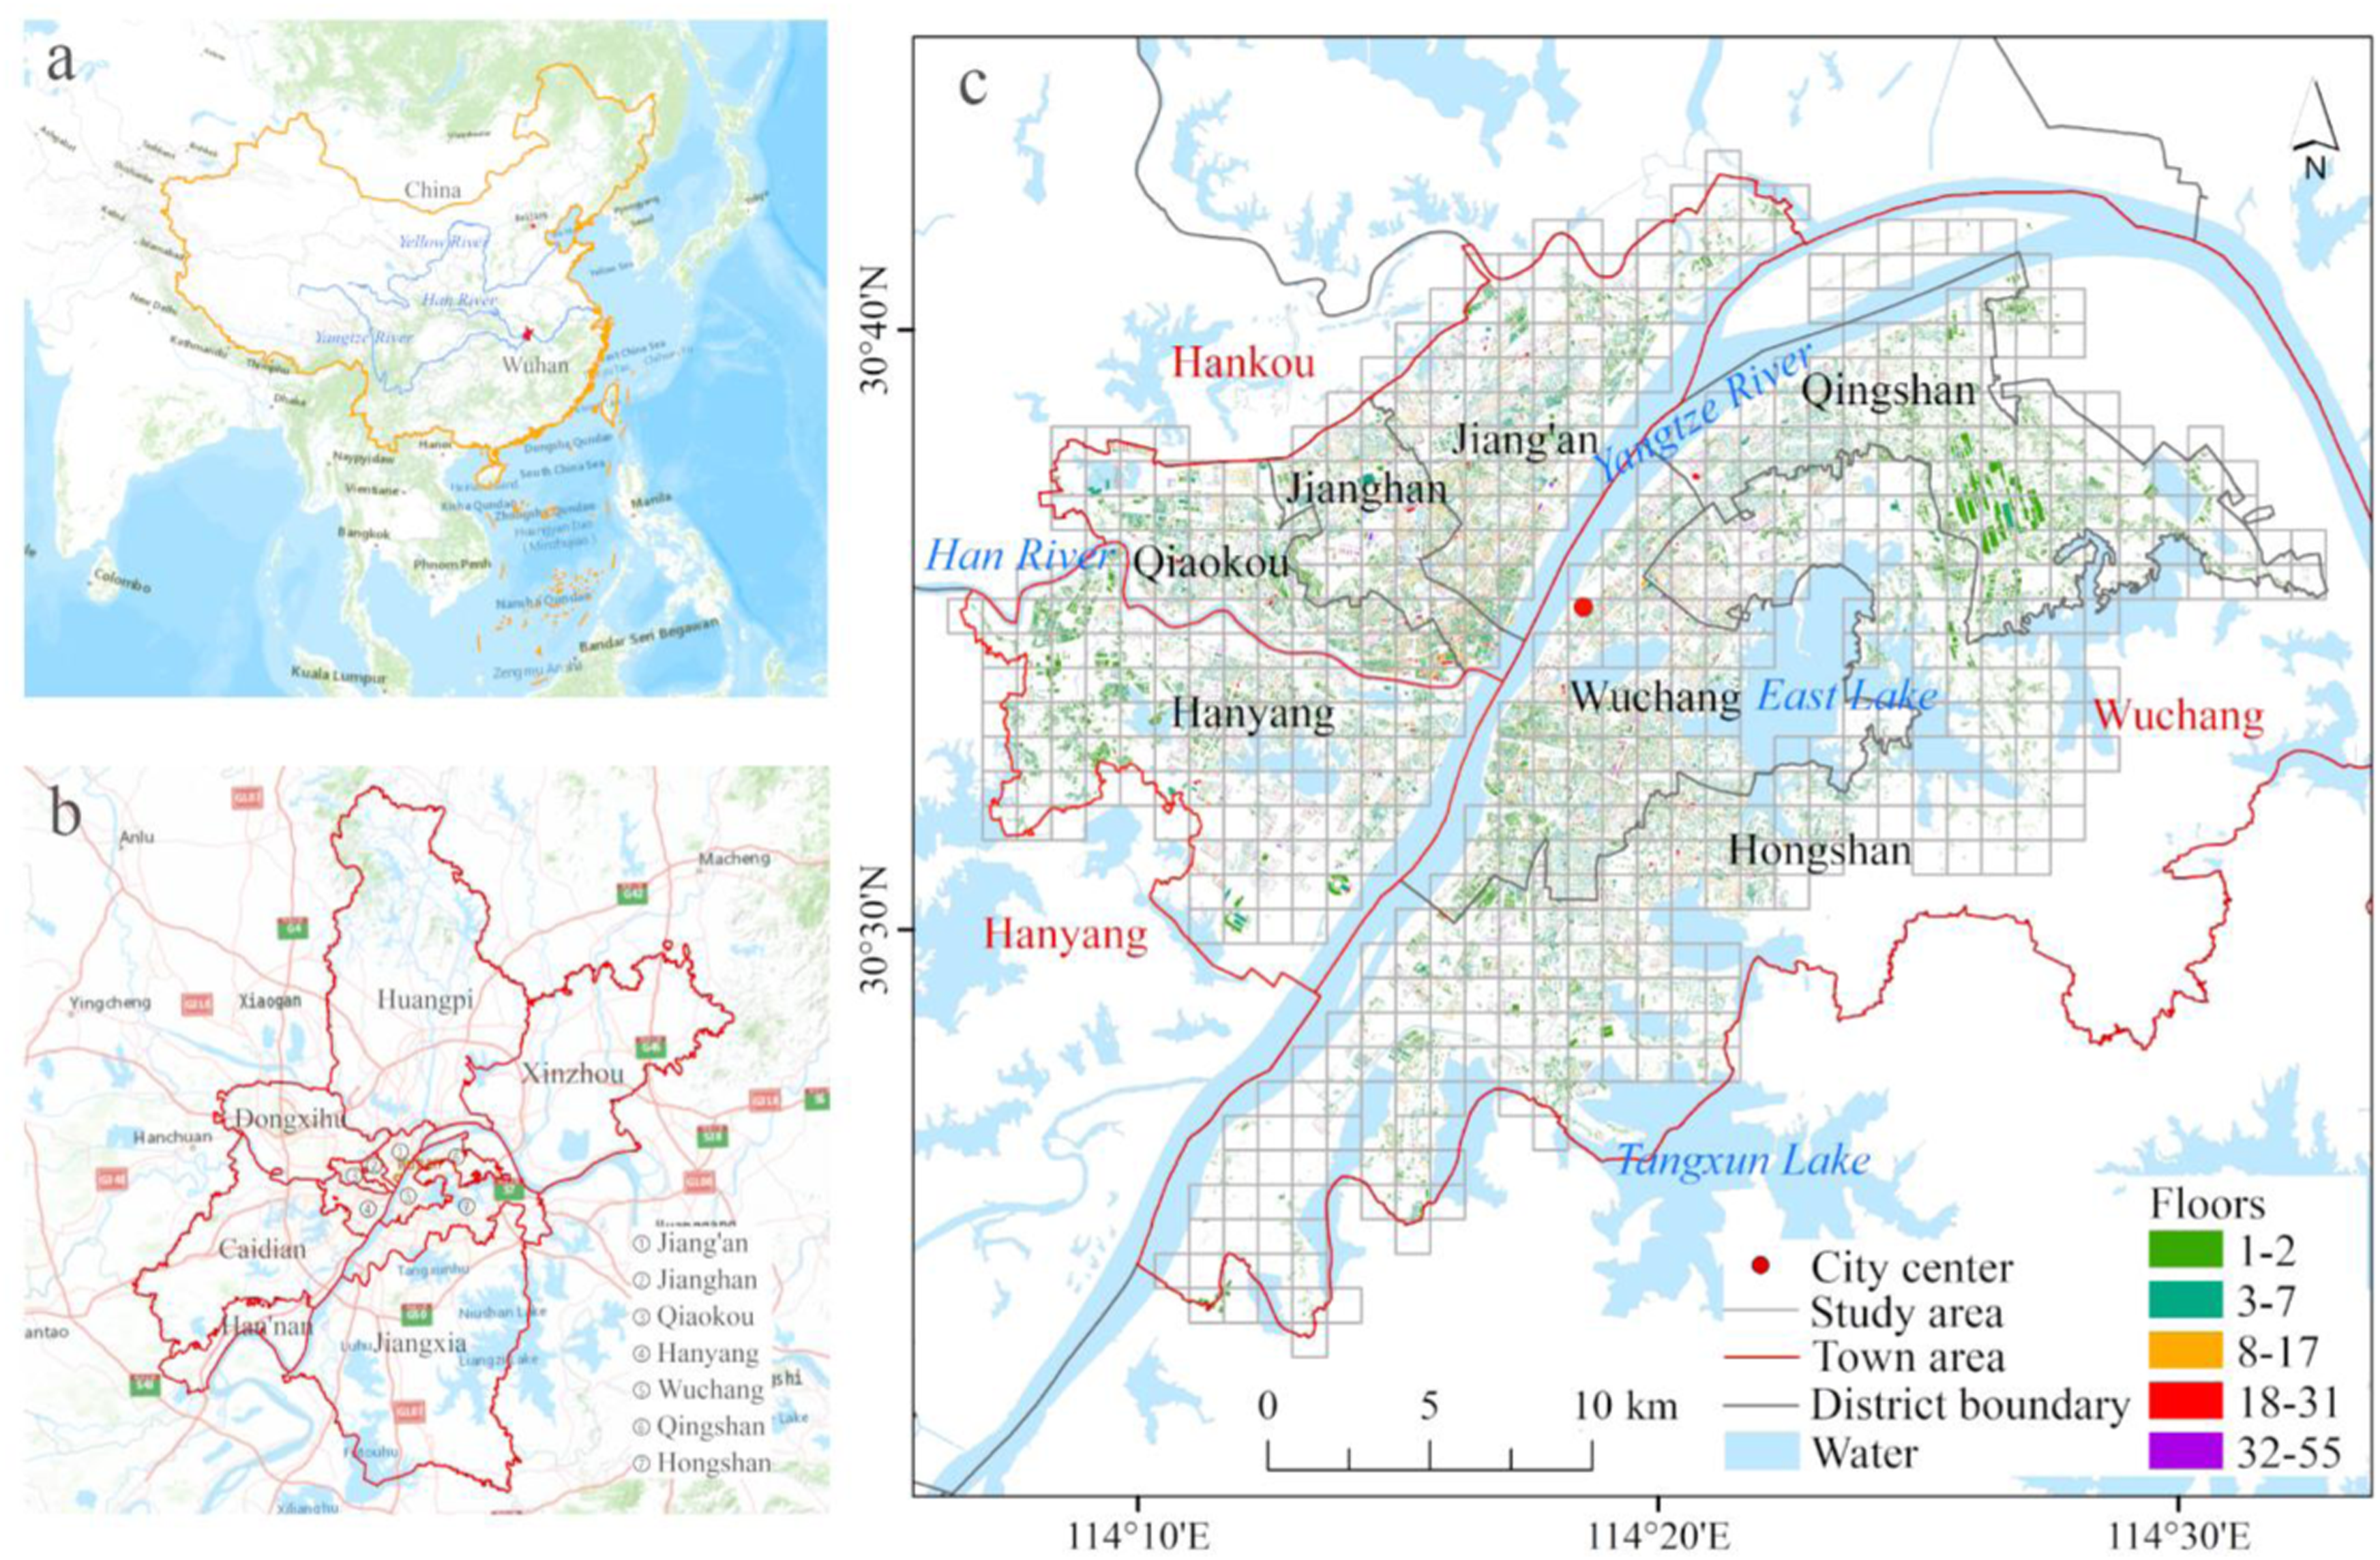
In response to the APPCAP, the Wuhan Municipal Ecology and Environment Bureau formulated a series of measures to abate PM2.5 pollution in 2014 (https://hbj.wuhan.gov.cn/). These measures included motor vehicle emissions reduction, dust control and removal, and clean energy utilization. By 2018, the PM2.5 pollution in Wuhan had been largely controlled, with the annual mean PM2.5 concentrations (45.35 μg/m3) being 44% lower than those in 2013 (80.71 μg/m3; Supplemental Figures S1–S3). Therefore, we chose 2018 to investigate the relationships between 3D urban landscape patterns and PM2.5 pollution. That is, we manage to reduce the influence of vehicle emissions, coal burning, and dust emissions on PM2.5 pollution and focus particularly on the impact of 3D urban landscape patterns. Our study area is focused on the central urban area of Wuhan (Figure 1(b) and 1(c)). The central Wuhan is composed of three towns (Wuchang, Hankou, and Hanyang) and seven districts (Jiang’an, Jianghan, and Qiaokou in the town of Hankou; Wuchang, Hongshan, and Qingshan in the town of Wuchang; Hanyang as a whole), where a large number of buildings formed a complex 3D urban landscape pattern.
Materials and methods
Data acquisition and processing
The PM2.5 data used in this study were collected from the China High Air Pollutants (CHAP) dataset (Wei et al., 2021; https://weijing-rs.github.io/product.html/). The dataset was produced based on the Space-Time Extra-Trees model to establish the relationship between PM2.5 concentrations and aerosol optical depths. Auxiliary data were used to improve the prediction accuracy of the model, including meteorological data (e.g., air temperature, relative humidity, and surface pressure), multi-resolution emission inventory for China, vegetation index, land cover data, and population data. The dataset covered a period of 2000–2022, with a spatial resolution of 1 km × 1 km and a temporal resolution of days. The dataset captured well the spatial variability of PM2.5 concentrations in China, with high prediction accuracy (CV-R2 between 0.86 and 0.90) and strong predictive power (R2 between 0.80 and 0.82). This dataset has been increasingly used in research focusing on public health, ecological quality, air pollution, and so forth (Feng et al., 2023; Jiang et al., 2023; Wang et al., 2023).
The 1:2000 building vector data covering central Wuhan in 2018 were produced by field surveys and provided by Wuhan Geomatics Institute (https://www.whkc.com/), with a position accuracy of 0.2 m. The data contained detailed information on building footprint, floor number, and building function (Figure 1(c)). According to the Chinese Design Code for residential buildings (GB50096-2011), we set the height of one building floor to 3 m so that the height of each building could be estimated. The building vector data were divided into 1 km × 1 km grids corresponding to the spatial resolution of the PM2.5 concentrations data using the fishnet tool in ArcGIS 10.7. The 3D urban landscape metrics were then calculated in each grid cell. As our study was focused on central Wuhan, a total number of 588 grid cells (i.e., samples) were used for subsequent statistical analysis.
Calculation of 3D urban landscape metrics
We calculated eight 3D urban landscape metrics on a 1-km scale based on the 1:2000 building vector data to characterize the 3D urban landscape patterns in central Wuhan. The eight metrics contained three height metrics, two density metrics, two volume metrics, and one compound metric. Specifically, the height metrics included building height density (BHD), building height range (BHR), and standard deviation of building height (H_STD). The density metrics consisted of building count density (BCD) and building plan area fraction (BAF). The volume metrics comprised FAR and building evenness index (BEI). BEI represents the uniformity of the spatial distribution of buildings (Yu et al., 2021). The larger the BEI is, the lower the similarity of morphology between buildings is. The one compound metric referred to sky view factor (SVF) in particular. SVF measures the degree to which the sky is obscured by the surrounding obstacles at a given point, and estimation of SVF is based on the sum of the angle elements reaching the visible sky in the hemisphere (Grimmond et al., 2001). Here, we adopted the method proposed by Li et al. (2021) to calculate SVF by subtracting the local shadows in all directions of a given point. The detailed formulas to calculate the eight urban landscape metrics can be found in Supplemental Table S1.
Previous studies have shown that these metrics have a direct or indirect impact on the emissions and diffusion of atmospheric pollutants. BHD, H_STD, and BHR indicate the roughness length of urban underlying surfaces, which are closely related to turbulent exchange in the urban canopy layer and the diffusion of PM2.5 (Cao et al., 2021; Xu and Chen, 2021). BCD and FAR are widely used to describe the intensity of human activities and reflect the level of PM2.5 emissions (Lin et al., 2017; Yuan et al., 2019). In addition, buildings with dense distribution and inconsistent directions represented by high BAF and BEI could block air convection and thus the diffusion of PM2.5 (Chen et al., 2021; Yu et al., 2021). SVF could also affect the diffusion of PM2.5 through regulating incoming solar energy and ventilation in the urban canopy layer (Chen et al., 2021). On the one hand, emissions of air pollutants from buildings (e.g., residential, commercial, and industrial emissions) contribute to PM2.5 pollution. On the other hand, the 3D urban landscape patterns can enhance or weaken the vertical and horizontal diffusion of PM2.5 pollutants through modification of microclimate.
Spatial autocorrelation analysis
The global Moran’s I was calculated to determine the degree of spatial aggregation and dispersion of PM2.5 concentrations in central Wuhan. The global Moran’s I ranges between −1 and 1. The closer the value is to 1, the higher the degree of aggregation is; conversely, the closer the value is to −1, the higher the degree of dispersion is. If the global Moran’s I is equal to 0, the spatial distribution of an object is deemed to be random (Li et al., 2018). Calculation of the global Moran’s I is as follows

In addition to the global Moran’s I, the local Moran’s I was further calculated to identify spatial clusters of PM2.5 with high or low values in central Wuhan. There are four types of spatial clustering patterns indicated by the local Moran’s I: high-high (HH), high-low (HL), low-high (LH), and low-low (LL). A significant positive value for the local Moran’s I indicates that a feature has neighboring features with similarly high or low feature values (HH or LL), while a significant negative value means that a feature has neighboring features with dissimilar feature values (HL or LH; Li et al., 2018). Calculation of the local Moran’s I is as follows


Spatial regression analysis
We used the MGWR model to explore the spatial relationships between 3D urban landscape patterns and seasonal mean PM2.5 concentrations in central Wuhan relative to 2018. To validate the effectiveness of the MGWR model, the GWR model was also adopted and compared with the MGWR model. The GWR model is developed for the analysis of spatial data in particular and allows the regression coefficients to vary locally by associating the explanatory variables with geographical locations (Hu et al., 2022). The GWR model is formulated as follows

The GWR model assumes that the spatial relationships between explanatory and response variables vary on the same spatial scale (i.e., all explanatory variables have the same bandwidth). However, previous studies have shown the multiscale effect of 3D urban landscape patterns on air pollution (Shi et al., 2019a; Zeng et al., 2022). To relax the assumption of GWR, we used the MGWR model proposed by Fotheringham et al. (2017) that allows the relationships between explanatory and response variables to vary on different scales (i.e., changeable bandwidths). Compared with GWR, the MGWR model considers the spatial heterogeneity of influencing factors and thereby reduces the collinearity and bias in parameter estimation (Hu et al., 2022). The MGWR model can well capture the local, regional, and global effects of explanatory variables, which is formulated as follows

The two regression models were run in the MGWR software version 2.2 developed by Oshan et al. (2019; https://sgsup.asu.edu/sparc/multiscale-gwr). The R2 (determination coefficients), adjusted R2, AIC (Akaike Information Criterion), and AICc (bias-corrected version of AIC) were used to evaluate the performance of the two models. The lower the AIC (and AICc) and the higher the R2 (and adjusted R2) are, the better the model performance is.
Results
Spatial patterns of seasonal PM2.5 concentrations
Prior to conducting the spatial regression analysis, we first show the spatial patterns of seasonal mean PM2.5 concentrations in central Wuhan relative to 2018. As illustrated in Figure 2, the urban core area had the lowest PM2.5 concentrations across all seasons, while the Qingshan District bore the highest PM2.5 concentrations. Generally, the northern part of central Wuhan had higher PM2.5 concentrations than the southern part. The exception was found in winter, when the concentrations of PM2.5 exhibited a decreasing trend from west to east. Throughout the year, the PM2.5 concentrations were the lowest in summer (≤38 μg/m3) and the highest in winter (73 μg/m3 on average), while the PM2.5 concentrations in autumn and spring were generally between 42 and 60 μg/m3. According to the China Ambient Air Quality Standard, the air quality of central Wuhan in 2018 was fine but not good. Obviously, the PM2.5 concentrations showed a spatial aggregated distribution (with the global Moran’s I between 0.89 and 0.94 at the 0.001 confidence level; Supplemental Table S2). The spatial aggregation patterns in spring and summer were similar (Supplemental Figure S4). That is, the urban core area along the Yangtze River was identified as a low-low clustering, while the Qingshan District and its surrounding areas showed a high-high clustering. In autumn and winter, the distribution of the spatial clusters was dispersed. The high-high clustering appeared on the western periphery of central Wuhan and, once again, the Qingshan District, while the low-low clustering was primarily found in the Wuchang and Hongshan Districts. A notable phenomenon was that the low-low clustering in winter was all around the inland lakes and rivers. Spatial patterns of seasonal PM2.5 concentrations in central Wuhan corresponding to 2018: (a) spring, (b) summer, (c) autumn, and (d) winter.
Spatial patterns of 3D urban landscape metrics
We next show the 3D urban landscape patterns in central Wuhan characterized by building height, density, and volume features (Figure 3). BHD, BAF, FAR, as well as BEI along the two sides of the Yangtze River were generally larger than other locations. Across the three towns, the four feature values were the highest in the town of Hankou. The variations of building height (i.e., H_STD and BHR) in the towns of Hankou and Hanyang were larger than in the town of Wuchang on the whole. By contrast, the spatial distribution of BCD was relatively homogenous. For the seven districts in central Wuhan, the Qingshan District had the lowest height and volume features but the highest density features. This is because the Qingshan District is an industrial zone possessing a large number of low-rise buildings with large building footprints. The height, density, and volume of buildings in the Hongshan District were the minimum across central Wuhan. To summarize, the town of Hankou had a high level of development with the spatial differences in building features being small, whereas the development in the town of Wuchang was imbalanced. Finally, the landscape openness represented by SVF on the east bank of the Yangtze River was lower than on the west bank. The Qingshan District, the locations around the East Lake, and the southern part of the Hongshan District had the largest SVF. Spatial patterns of (a) building height density, (b) building height range, (c) standard deviation of building height, (d) building count density, (e) building plan area fraction, (f) floor area ratio, (g) building evenness index, and (h) sky view factor in central Wuhan corresponding to 2018.
Relationships between PM2.5 concentrations and 3D urban landscape patterns
As the PM2.5 concentrations and 3D urban landscape patterns show significant spatial heterogeneity, we chose local regression models (i.e., GWR and MGWR) instead of global regression models to investigate the relationships between them. We first compared the performance of GWR and MGWR in different seasons. The results showed that MGWR performed better than GWR, with higher R2 and lower AIC across all seasons (Supplemental Table S3). In comparison, the performance of the MGWR model in spring was the best (R2 = 0.82 and AIC = 866.46), while that in winter was the worst (R2 = 0.67 and AIC = 1288.11). Herein, the MGWR model was utilized to explore the spatial relationships between 3D urban landscape patterns and seasonal mean PM2.5 concentrations relative to 2018 in central Wuhan. As shown in Figure 4, the local R2 of the MGWR model had higher values and spatial variability in spring and summer (0.63 and 0.62 on average) than in autumn and winter (0.54 and 0.52 on average). Moreover, the spatial variability of the local R2 in spring and summer showed similar patterns. Except the winter season, the locales around the East Lake had the maximum local R2 (0.8–0.9 in spring and summer and 0.7–0.8 in autumn), indicating that the 3D urban landscape patterns exerted a strong influence on the PM2.5 concentrations here. By contrast, the locales in the southern part of the Hongshan District had the minimum local R2 (less than 0.4 in general) in all seasons, especially spring and summer. Overall, the magnitude of the local R2 demonstrated the importance of 3D urban landscape patterns on PM2.5 concentrations in central Wuhan. The local R2 of MGWR between seasonal PM2.5 concentrations and urban landscape metrics in central Wuhan corresponding to 2018: (a) spring, (b) summer, (c) autumn, and (d) winter.
Bandwidths of the MGWR model for each urban landscape metric.

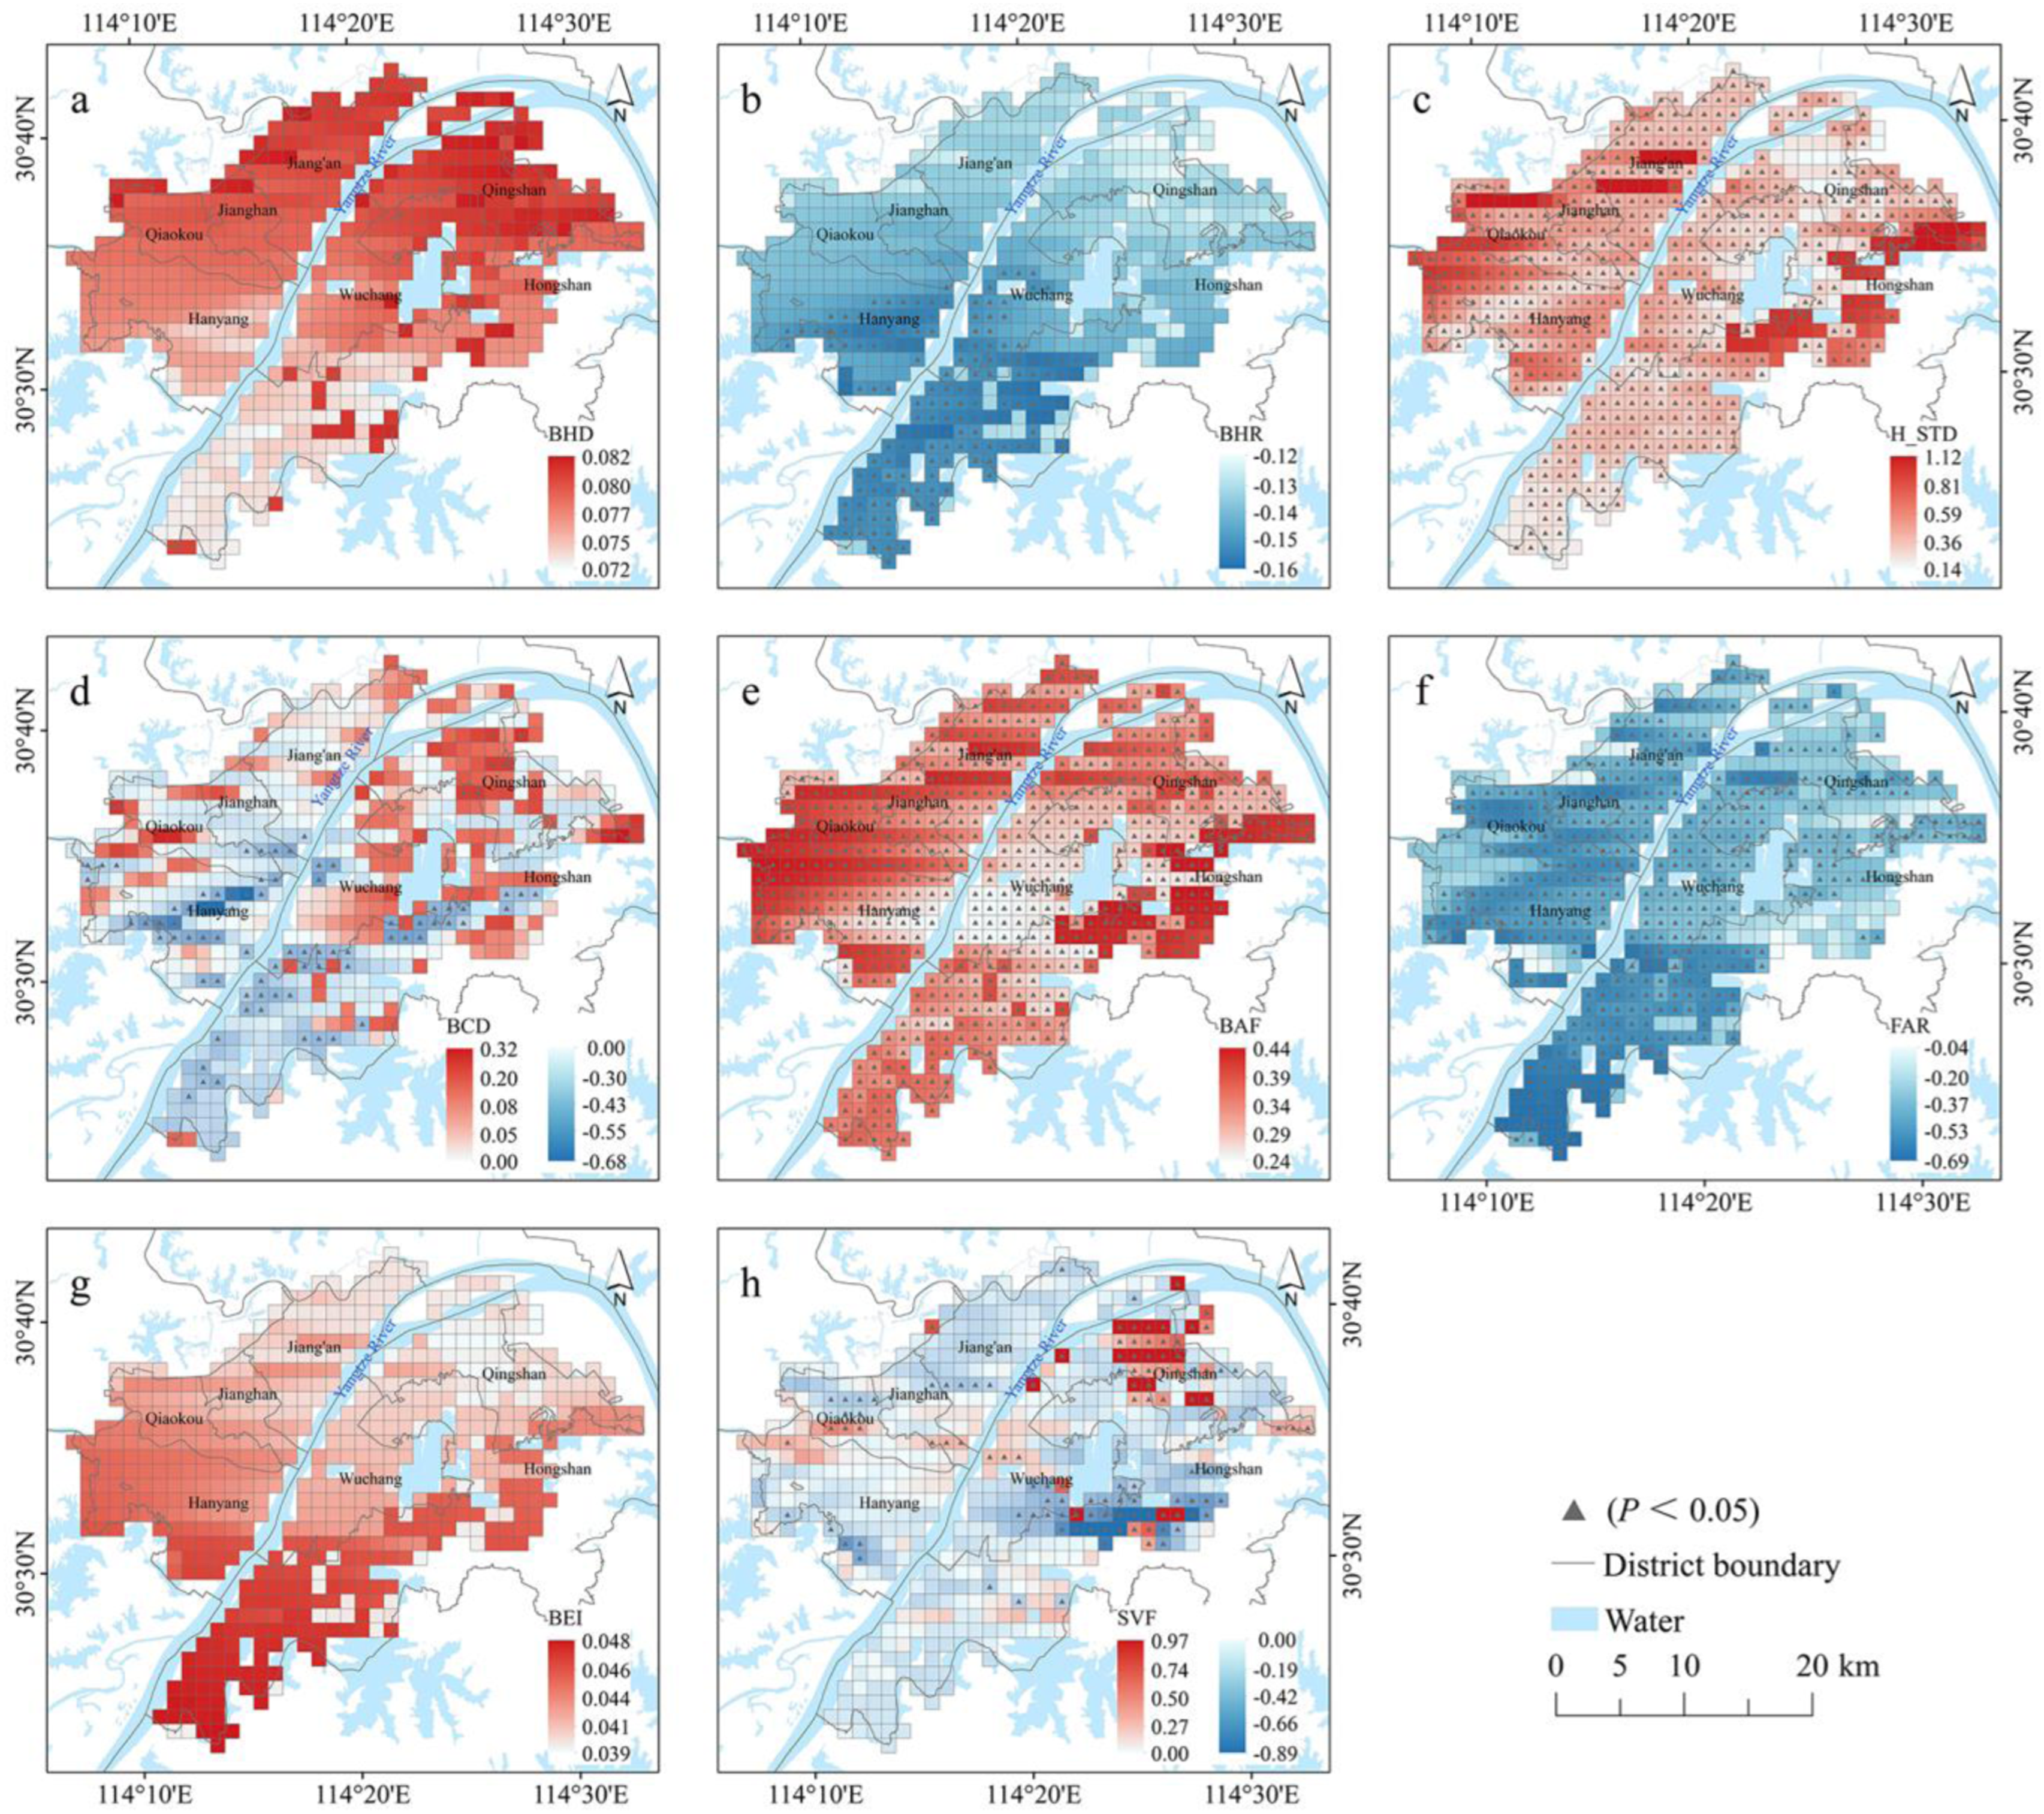
Finally, we show the spatial correlations between PM2.5 concentrations and 3D urban landscape metrics across different seasons in central Wuhan. In spring, BHR had a significant negative correlation with PM2.5 concentrations, while H_STD had a significant positive correlation with PM2.5 concentrations (Figure 5). The correlation between H_STD and PM2.5 concentrations was the strongest in the southern part of central Wuhan (the town of Hanyang and the southern Hongshan District). For the density metrics, a positive correlation between BCD and PM2.5 concentrations was found across the entire region, and the correlation was significant primarily in the northern part of the region, especially the Qingshan District. The correlation between BAF and PM2.5 concentrations was location-dependent with a small effect scale. In the urban core area around the city center, it was a significant negative correlation; in the Qingshan District to the north and the Hongshan District to the south, it was a significant positive correlation. The volume metrics (FAR and BEI) were negatively correlated with PM2.5 concentrations, but the correlations were extremely weak and insignificant. SVF exhibited a significant positive correlation with PM2.5 concentrations in the urban core area and the area in and around the Qingshan District, and the effect scale of SVF was close to BAF. Among these metrics, the absolute regression coefficients of BAF and SVF were the highest (up to 0.52), while those of the other metrics were less than 0.35 in spring. The spatial correlations between 3D urban landscape metrics and PM2.5 concentrations in summer were similar with those in spring (BEI was excluded from analysis because of the minimal regression coefficients across all seasons; Figure 6). However, the strength of the correlations in summer was generally stronger than that in spring (e.g., local regression coefficients up to 0.69 for SVF and 0.52 for BCD). The local regression coefficients of MGWR between PM2.5 concentrations and urban landscape metrics in central Wuhan in the spring of 2018: (a) building height density, (b) building height range, (c) standard deviation of building height, (d) building count density, (e) building plan area fraction, (f) floor area ratio, (g) building evenness index, and (h) sky view factor. The local regression coefficients of MGWR between PM2.5 concentrations and urban landscape metrics in central Wuhan in the summer of 2018: (a) building height density, (b) building height range, (c) standard deviation of building height, (d) building count density, (e) building plan area fraction, (f) floor area ratio, (g) building evenness index, and (h) sky view factor.

In autumn, FAR, for the first time of the year, showed a significant negative correlation with PM2.5 concentrations in all locales, and the regression coefficients equal to 0.35 on average (Figure 7). Except for FAR, H_STD and BAF also showed much stronger correlations with PM2.5 concentrations. The regression coefficients of H_STD became higher in all locales (0.31–0.35), and BAF had a significant positive correlation with PM2.5 concentrations across almost the entire region. Notably, the maximum regression coefficient for SVF reached 0.79 in autumn, especially in the Qingshan District. BHR had a smaller effect scale on PM2.5 concentrations in autumn, and the correlation was the highest among all seasons (up to −0.44). Once again, the correlation between BCD and PM2.5 concentrations was the strongest in the Qingshan District. In winter, the influence of H_STD, BAF, and FAR continued to enhance, with the regression coefficients up to 1.12, 0.44, and −0.69, respectively (Figure 8). In addition, the effect scales of H_STD and FAR became much smaller compared with the other seasons, with the regression coefficients showing greater spatial variability. Meanwhile, the correlation between BHR and PM2.5 concentrations became weak (−0.14 on average) and was significant merely in the southern part. In terms of BCD and SVF, the correlations between them and PM2.5 concentrations in winter were complex. For BCD, a significant negative correlation was found (especially in the town of Hanyang and the southern Hongshan District), with the maximum regression coefficient equal to −0.68. For SVF, the positive coefficients in the Qingshan District reached 0.97, while the negative coefficients in other locales were up to −0.89. The local regression coefficients of MGWR between PM2.5 concentrations and urban landscape metrics in central Wuhan in the autumn of 2018: (a) building height density, (b) building height range, (c) standard deviation of building height, (d) building count density, (e) building plan area fraction, (f) floor area ratio, (g) building evenness index, and (h) sky view factor. The local regression coefficients of MGWR between PM2.5 concentrations and urban landscape metrics in central Wuhan in the winter of 2018: (a) building height density, (b) building height range, (c) standard deviation of building height, (d) building count density, (e) building plan area fraction, (f) floor area ratio, (g) building evenness index, and (h) sky view factor.
Discussion
Both global and local autocorrelation analyses show that the seasonal mean PM2.5 concentrations in central Wuhan had significant spatial variability. Generally, the PM2.5 concentrations in the northern part of central Wuhan were higher than the southern part. The industrial emissions from the Qingshan District and external sources of air pollutants invading from the northern provinces (Hebei, Shandong, and Henan) contributed to the PM2.5 pollution in the northern part (Zhao et al., 2023). Meanwhile, the city center acted as a buffer zone to prevent the spread of PM2.5 pollutants from the north to the south to some degree (Yu, 2023). However, the spatial pattern of PM2.5 pollution in winter was different from the other seasons. The meteorological conditions (e.g., atmospheric inversion) in winter resulted in a weak impact of 3D urban landscape patterns on the diffusion of PM2.5 pollution through modification of microclimate (Cao et al., 2021). In addition, the combustion of biomass fuel and insufficient combustion of vehicle emissions aggravated PM2.5 pollution in winter. The exception was found around lakes where the PM2.5 concentrations were lower than in other places. The wet deposition of PM2.5 pollutants by the two large water bodies, that is, the East Lake and Tangxun Lake, significantly reduced the PM2.5 pollutants in the surrounding areas (Zhu and Zhou, 2019). Therefore, a decrease in PM2.5 concentrations from the west to the east was found in winter.
As global regression models may have significant estimated deviation (Bi et al., 2022), we used two local regression models (GWR and MGWR) to explore the relationships between 3D urban landscape patterns and PM2.5 pollution in central Wuhan. Compared with global regression models (e.g., ordinary least squares, spatial lag model, and spatial error model), GWR and MGWR considered geospatial heterogeneity and were more accurate in exploring the spatial relationships between explanatory and response variables (Supplemental Table S4). By contrast, the MGWR model produced higher explanatory power and accuracy than the GWR model due to the fact that spatial processes may operate at different scales in the real world (Fotheringham et al., 2017). The local R2 indicated that the 3D urban landscape patterns had lesser impacts on PM2.5 pollution in autumn and winter than in spring and summer. The results were consistent with previous research focused on the impact of urban form and size on PM2.5 pollution across China (Liu et al., 2018). Wu et al. (2015) also reported that urban landscape patterns had larger explanatory power on PM2.5 pollution in spring and summer than in autumn and winter in Beijing. The strong air convection and high temperature in spring and summer may strengthen the impact of urban landscape patterns on PM2.5 pollution through modification of microclimate, whereas the temperature inversion and increment of PM2.5 emissions may weaken such impact in autumn and spring. Further, we found that the 3D urban landscape metrics had the strongest association with PM2.5 pollution around the East Lake (except in winter). The lake breeze circulation triggered by the lake-land temperature difference may strengthen the ability of urban landscape patterns to modify microclimate and thus the diffusion of PM2.5 pollutants.
The varying bandwidths of the MGWR model captured the scale effects of 3D urban landscape patterns on PM2.5 pollution across different seasons. For example, BCD was closely related to the PM2.5 emissions (Lin et al., 2017). The PM2.5 emissions in autumn and winter were high with a relatively larger spatial heterogeneity in central Wuhan, which led to a localized relationship between BCD and PM2.5 pollution (i.e., smaller bandwidths). FAR was also closely related to the emissions of PM2.5 (Yuan et al., 2019). During the extreme cold and high PM2.5 pollution period, FAR also strongly modified airflow and thus the diffusion of PM2.5 (Jung and Yoon, 2021). Hence, a localized effect of FAR on PM2.5 pollution was found especially in winter. Conversely, BAF had larger bandwidths in autumn and winter than in spring and summer. BAF was closely related to ventilation and a densely built environment could block air convection and hinder the diffusion of PM2.5 (Chen et al., 2021). Spring had the highest wind speed in Wuhan, followed by summer, while autumn and winter had relatively low wind speed (Yang et al., 2019). The magnitude of wind speed corresponded well to the bandwidth of BAF across the four seasons. That is, high wind speed with large spatial variability led to a localized effect of BAF on PM2.5, whereas low wind speed with small spatial variability led to a globalized effect of BAF on PM2.5. We also found that the effect of BHD on PM2.5 was global all year round, although the correlation between them was not significant. Meanwhile, Liu et al. (2019) showed that BHD had a global effect on land surface temperature in central Wuhan when using MGWR. Essentially, this was due to the small spatial variability of BHD compared with other explicit urban landscape metrics (e.g., BCD, BAF, and FAR) in the study area.
It was also shown that the 3D urban landscape patterns had different relationships with seasonal PM2.5 concentrations in central Wuhan. For the height metrics, H_STD had a positive correlation with PM2.5 concentrations. Liu et al. (2021) found that H_STD more than 10 m led to a higher concentration and stagnation of air pollutants. BHR showed a negative correlation with PM2.5 concentrations. However, Cao et al. (2021) argued that the increase of BHR would reduce wind speed due to increased surface roughness and consequently accumulate PM2.5. In fact, BHR may not well characterize the variation of building height on a large spatial scale. For the density metrics, BAF had a complex relationship with PM2.5 concentrations. On the one hand, the densely built environment can raise air temperature in the street valley through radiation trapping, thus increasing the aerodynamic energy of atmospheric turbulence and promoting the diffusion of PM2.5 (Xu and Chen, 2021). On the other hand, it can also increase ground friction and reduce wind speed, thus hindering the diffusion of PM2.5 (Chen et al., 2021). The effect of BAF on PM2.5 concentrations could be positive and negative, dependent on which process is dominant. We show that BAF had a significant positive correlation with PM2.5 concentrations in general, indicating that the effect of BAF on ground friction might dominate. However, a negative correlation was found in the urban core area around the city center in spring and summer, indicating that the thermodynamic process might dominate. BCD generally had a positive correlation with PM2.5 concentrations because a higher BCD usually indicated higher PM2.5 emissions (e.g., more traffic loads and vehicle emissions; Lin et al., 2017). Notably, BCD and BAF showed a strong positive correlation with PM2.5 concentrations in the Qingshan District owing to the industrial emissions generated by a large number of factories.
In addition to the height and density metrics, we also examined some more complex metrics such as FAR and SVF. FAR is determined by both building height and density, and it is an important indicator of urban capacity. Usually, a higher FAR may result in more anthropogenic emissions and thus a higher level of PM2.5 pollution (Yuan et al., 2019). However, we found that FAR had a significant negative correlation with PM2.5 concentrations in autumn and winter across central Wuhan. Due to the effective measures taken by the government to abate PM2.5 pollution, the urban core area around the city center had lower PM2.5 concentrations than its surrounding areas in 2018. However, FAR along the two sides of the Yangtze River was generally larger than other locales. In addition, the Qingshan District owned the highest PM2.5 and the lowest FAR due to the large number of low-rise industrial buildings. From another perspective, a higher FAR can lead to a deeper urban canyon and accelerate the airflow velocity (Luo et al., 2023). Similarly, Jung and Yoon (2021), based on microscale simulation, also showed that FAR had a negative correlation with PM2.5 concentrations during the period of extreme cold and high PM2.5 pollution. SVF is a more complex metric measuring the openness of urban space and exerts a strong influence on microclimate through modification of incoming solar radiation and ventilation (Li et al., 2021). A high SVF will increase energy absorption while enhancing ventilation, and vice versa. Previous research frequently showed that SVF was negatively correlated with PM2.5 concentrations (Chen et al., 2021; Shi et al., 2018; Silva and Monteiro, 2016). In this study, we found that SVF had a significant positive correlation with PM2.5 concentrations in locales with low SVF (e.g., the Qingshan District). This was mainly due to industrial emissions from many low-rise industrial plants rather than the modification of microclimate.
Research on the effect of urban landscape patterns on PM2.5 pollution helps urban planning to improve air quality in urban environments. Our study makes a step forward, but there are limitations. First, the relationships between 3D urban landscape patterns and PM2.5 pollution may vary across different scales. Ke et al. (2022) found that BHD had a significant negative correlation with PM2.5 concentrations on a 500-m scale, while an insignificant negative correlation was found in this study on a 1-km scale. With advances in remote sensing and mobile monitoring techniques, future research should understand the effect of 3D urban landscape patterns on PM2.5 concentrations on different scales to facilitate cross-scale urban planning. Second, vegetation and water also play an important role in regulating PM2.5 pollution. Vegetation can hinder the dispersion of PM2.5 through modification of air flow and promote the deposition of PM2.5 through adsorption of leaves (Łowicki, 2019). Water bodies can lower ambient temperature and increase humidity owing to the high heat storage and evaporation, which promote the wet deposition of particulate matters and inhibit the secondary formation of precursors to particulate matters (Lou et al., 2017; Zhou et al., 2021). Third, the mechanisms for the impact of 3D urban landscape patterns on PM2.5 pollution need further exploration. Recently, mesoscale models have been used to explore such impact (Xu and Chen, 2021). However, advanced mesoscale models (e.g., WRF) only allow incorporation of limited urban canopy parameters (Deng et al., 2023). Some parameters exerting a strong influence on atmospheric environments have not been but should be considered in future model development. Finally, although the MGWR model reduces over fitting and under fitting of the GWR model by allowing the regression coefficients to vary on local, regional, and global scales, the problems may exist and should not be ignored (Su et al., 2022).
Conclusion
This study explored the relationships between 3D urban landscape patterns and PM2.5 concentrations across different seasons in central Wuhan using the MGWR model. The effect of 3D urban landscape patterns on PM2.5 pollution varied in different seasons in terms of the direction and degree of the effect: (1) the increase of H_STD significantly aggravated PM2.5 pollution through the year; (2) BAF had a positive correlation with PM2.5 concentrations in general except that a negative correlation was found in the urban core area in spring and summer due to the thermodynamic process; (3) BCD showed a positive correlation with PM2.5 concentrations especially in spring and summer; (4) the increase of FAR significantly reduced PM2.5 concentrations in autumn and winter; (5) SVF showed a significant positive effect on PM2.5 concentrations in the urban core area and the industrial zone. In addition, the effect scales of 3D urban landscape patterns also varied in different seasons: (1) SVF had the smallest bandwidths, indicating a localized effect on PM2.5 pollution; (2) the bandwidths of BCD in spring and summer were larger than those in autumn and winter, while the reverse was true for BAF; (3) FAR had a localized effect in winter while a global effect in the other seasons. To alleviate PM2.5 pollution, we suggest limiting the building count and reducing the building height variation to render a compact urban landscape pattern formed by high-rise buildings. Meanwhile, urban planners and policymakers should pay special attention to the PM2.5 pollution in the norther part of central Wuhan especially the Qingshan District, and take effective measures such as construction of public transport facilities, utility of clean energy, upgradation of emissions standards, and so forth.
Supplemental Material
Supplemental Material - Exploring the relationships between 3D urban landscape patterns and PM2.5 pollution using the multiscale geographic weighted regression model
Supplemental Material for Exploring the relationships between 3D urban landscape patterns and PM2.5 pollution using the multiscale geographic weighted regression model by Haoyan Duan, Qian Cao, Lunche Wang, Xihui Gu and Khosro Ashrafi in Progress in Physical Geography: Earth and Environment
Footnotes
Declaration of conflicting interests
The author(s) declared no potential conflicts of interest with respect to the research, authorship, and/or publication of this article.
Funding
The author(s) disclosed receipt of the following financial support for the research, authorship, and/or publication of this article: This work was supported by the National Natural Science Foundation of China (Grant numbers 42371115, 42371354) and Natural Science Foundation of Hubei Province (2022CFB039).

Supplemental Material
Supplemental material for this article is available online.
References
Supplementary Material
Please find the following supplemental material available below.
For Open Access articles published under a Creative Commons License, all supplemental material carries the same license as the article it is associated with.
For non-Open Access articles published, all supplemental material carries a non-exclusive license, and permission requests for re-use of supplemental material or any part of supplemental material shall be sent directly to the copyright owner as specified in the copyright notice associated with the article.
