
Abstract
Citizen science approaches are increasingly used to support data generation and public engagement across the environmental sciences, yet their wider pedagogical value within physical geography remains underexamined. To explore the value of mapping-based citizen science for both glaciological investigation and geographical learning, we developed GlacierMap, an interactive online tool enabling participants to map glacier change in Peru’s Cordillera Blanca over a 34-year period. GlacierMap was designed not only to assess the feasibility and value of crowd-sourced glacier mapping, but also as a vehicle to support experiential learning of the trends in, and impacts of, tropical mountain glacier retreat. Participants mapped glacier change from Landsat imagery for two different years, 1984 and 2018, with analysis of glacier extents mapped by both ‘expert’ and ‘non-expert’ participant groups supporting assessment of the value of GlacierMap as a data generation activity. Participant responses to pre- and post-mapping surveys were also analysed to understand the benefits, challenges, and limitations of citizen science for the purposes of crowd-sourcing glacier inventory data, dissemination, and geographical learning. We found that while many of the individual mapping contributions were a good fit to the Randolph Glacier Inventory, there was considerable variability in accuracy, for both experts and non-experts, likely due to challenges of image interpretation, levels of engagement with the task, and a need for more targeted pre-task training. Crucially, however, participants consistently reported improved understanding of glacier change and its downstream impacts, with teachers communicating the value of the tool for classroom use. These findings demonstrate that mapping-based citizen science can meaningfully enhance climate and spatial literacy, highlighting the potential for tools like GlacierMap to strengthen connections between physical geography research, schools, and wider publics.
Introduction
Citizen science and the value of mapping
Citizen science – the participation of people from outside professional organizations in the gathering or analysis of scientific data – is now a well-established field of research and practice. It is increasingly popular in natural science research (Buytaert et al., 2014; Lüsse et al., 2022) and recognised to be a useful tool for raising awareness and generating long-term knowledge exchange (Lorono-Leturiondo et al., 2019; Nelms et al., 2022). It can also play an important role in facilitating more active public engagement and improved public understanding of science (Hicks et al., 2019; Lüsse et al., 2022) and is seen to be part of a growing desire to empower and educate people to be active participants in their environment (Cross, 2019). However, many citizen science projects focus more on the quality of citizen-generated data than the potential for learning, despite these projects offering important opportunities to enhance skills development and demonstrate the relevance of different disciplines (Lüsse et al., 2022). At a time of rapid environmental change and climate crisis, engagement between geography researchers, teachers, learners, and the wider public has never been more important, and there is a clear need for the research community to engage with the development of innovative tools and approaches for geographical teaching, from early to higher education (Anderson et al., 2023). Citizen science has the potential to play an important role in this regard.
There are now many examples of citizen science initiatives in the environmental sciences (Conrad and Hilchey, 2011; Fraisl et al., 2022), including multiple field-based projects run by researchers and environmental organisations such as the Marine Conservation Society’s ‘Source to Sea Litter Quest’ (Marine Conservation Society, 2025) and the ‘FreshWater Watch’ project by Earthwatch Europe (Earthwatch, 2025). Projects such as ‘CrowdWater’ and ‘Nuestro Rio’ have recently demonstrated the value of combining local field observations with digital data collection (Rangecroft et al., 2023; Seibert et al., 2019), while also highlighting the challenges of digital tool-based initiatives (Blanco-Ramírez et al., 2025; Rangecroft et al., 2024). While recognising these inherent challenges, the application of remote methods for data generation, including geospatial monitoring and measurement, removes many of the physical barriers to contribution seen in field-based studies, widening the potential participant pool. Mapping tools formerly used primarily by those working in fields such as geography are now increasingly used within citizen science projects (Kerski, 2015), while tools such as Google Earth are now used widely by the public, highlighting the increasing role of geospatial data in everyday life. However, levels of digital and spatial literacy of citizen scientists vary considerably, posing potential challenges for both data collection and quality (Kosmala et al., 2016). Furthermore, participation in citizen science relies heavily upon on altruism (Dunkley, 2019; Etter et al., 2023), and activities must be considered carefully to reduce the potential burden on participants, particularly for low-income communities (Walker et al., 2020).
Mapping-based activities, whether field- or desktop-based, can have a multitude of benefits, including contribution to upskilling of both climate and spatial literacy. Furthermore, taking part in active research can help to situate learning within a real-world context, which is particularly relevant for school and university students (Clason et al., 2021). Glaciers are an important climate indicator providing visual evidence of both past and current environmental change (Thompson et al., 2021), and the socio-environmental impacts of glacier retreat are relevant for a wide range of publics. While glacier monitoring is now often conducted in a semi-automated way, and there have been recent advances in machine learning for this purpose (e.g. Bouchayer et al., 2022), manual digitisation of glacier-covered area is still central to glacier inventory research and quality control, particularly in areas of complex landscapes (Marochov et al., 2021). Furthermore, the act of mapping glaciers can allow participants to visually engage with environmental change while promoting increased understanding of processes and their impacts through experiential learning.
The GlacierMap project was designed to evaluate the effectiveness of citizen scientists as contributors to glacier inventories, but also, and more importantly, to assess engagement with crowd-sourced mapping as a mechanism for geographical learning and improved climate literacy. The project sought to promote understanding of the socio-environmental impacts of glacier retreat in a region undergoing rapid climatic and environmental change, and, in doing so, support geographical outreach and spatial skills development, particularly for young learners, through direct engagement with environmental data.
Glacier change and Peru’s Cordillera Blanca
Glaciers are undergoing widespread retreat in response to climate change (Dussaillant et al., 2025; Hugonnet et al., 2021; The GLaMBIE Team, 2025), and that retreat is likely locked-in over the coming decades, even if temperatures were to stabilize at present-day levels (Zekollari et al., 2025). However, the impacts of glacier retreat for water, energy, and food security, and other local-to-regional ecosystem services, are typically less visible in mainstream media than impacts such as sea level change. High elevation mountain regions at lower latitudes, such as the Andes and High Mountain Asia, are home to thousands of glaciers, with snow and ice melt providing important water resources for downstream populations, in addition to food supplies for many more (Clason et al., 2022). Indeed, these mountains are often referred to as ‘water towers’, supplying both the environment and ∼1.9 billion people with freshwater (Immerzeel et al., 2020). This supply becomes crucial to sustaining baseflow during the driest times of year when contribution from precipitation is low, yet water demand is high. In the tropical Andes of Peru, glaciers act as buffers to water supplies which are essential to resource security downstream (Drenkhan et al., 2023) and are especially important during the dry season and periods of drought (Buytaert et al., 2017). Glacier retreat and its associated impacts are not only a timely environmental challenge, but also a significant socio-economic consideration in regions which are more vulnerable to climate change and have lower adaptive capacity (Rangecroft et al., 2013).
Tropical Andean glaciers are retreating faster than glaciers in many other regions due to their relatively small size, elevation, and sensitivity to changes in climate (Bradley et al., 2006; Rangecroft et al., 2013). The glaciated Cordillera Blanca (Figure 1), which is the regional focus of the GlacierMap project, forms part of the Peruvian Andes, which are home to ∼70% of the world’s tropical glaciers (Clason and Rangecroft, 2025; Vuille et al., 2008) yet have experienced a 56% reduction in glacier area over the last ∼60 years (INAIGEM, 2023). The retreat of these glaciers, and the loss of the natural water storage they provide, is expected to have negative impacts on water availability in the region (Schauwecker et al., 2014), in addition to posing challenges for water quality, including rising stream water temperature and mobilisation of stored contaminants (Beard et al., 2022; Clason et al., 2022). (a) Glaciers of the Tropical Andes included in the Randolph Glacier Inventory (RGI) v7.0; (b) GlacierMap study extent within the Cordillera Blanca, with coverage of glaciers and glacier complexes included in the RGI 7.0 Consortium, 2023; (c) all participant-mapped outlines; (d) participant-mapped outlines following data cleaning and removal of statistical outliers.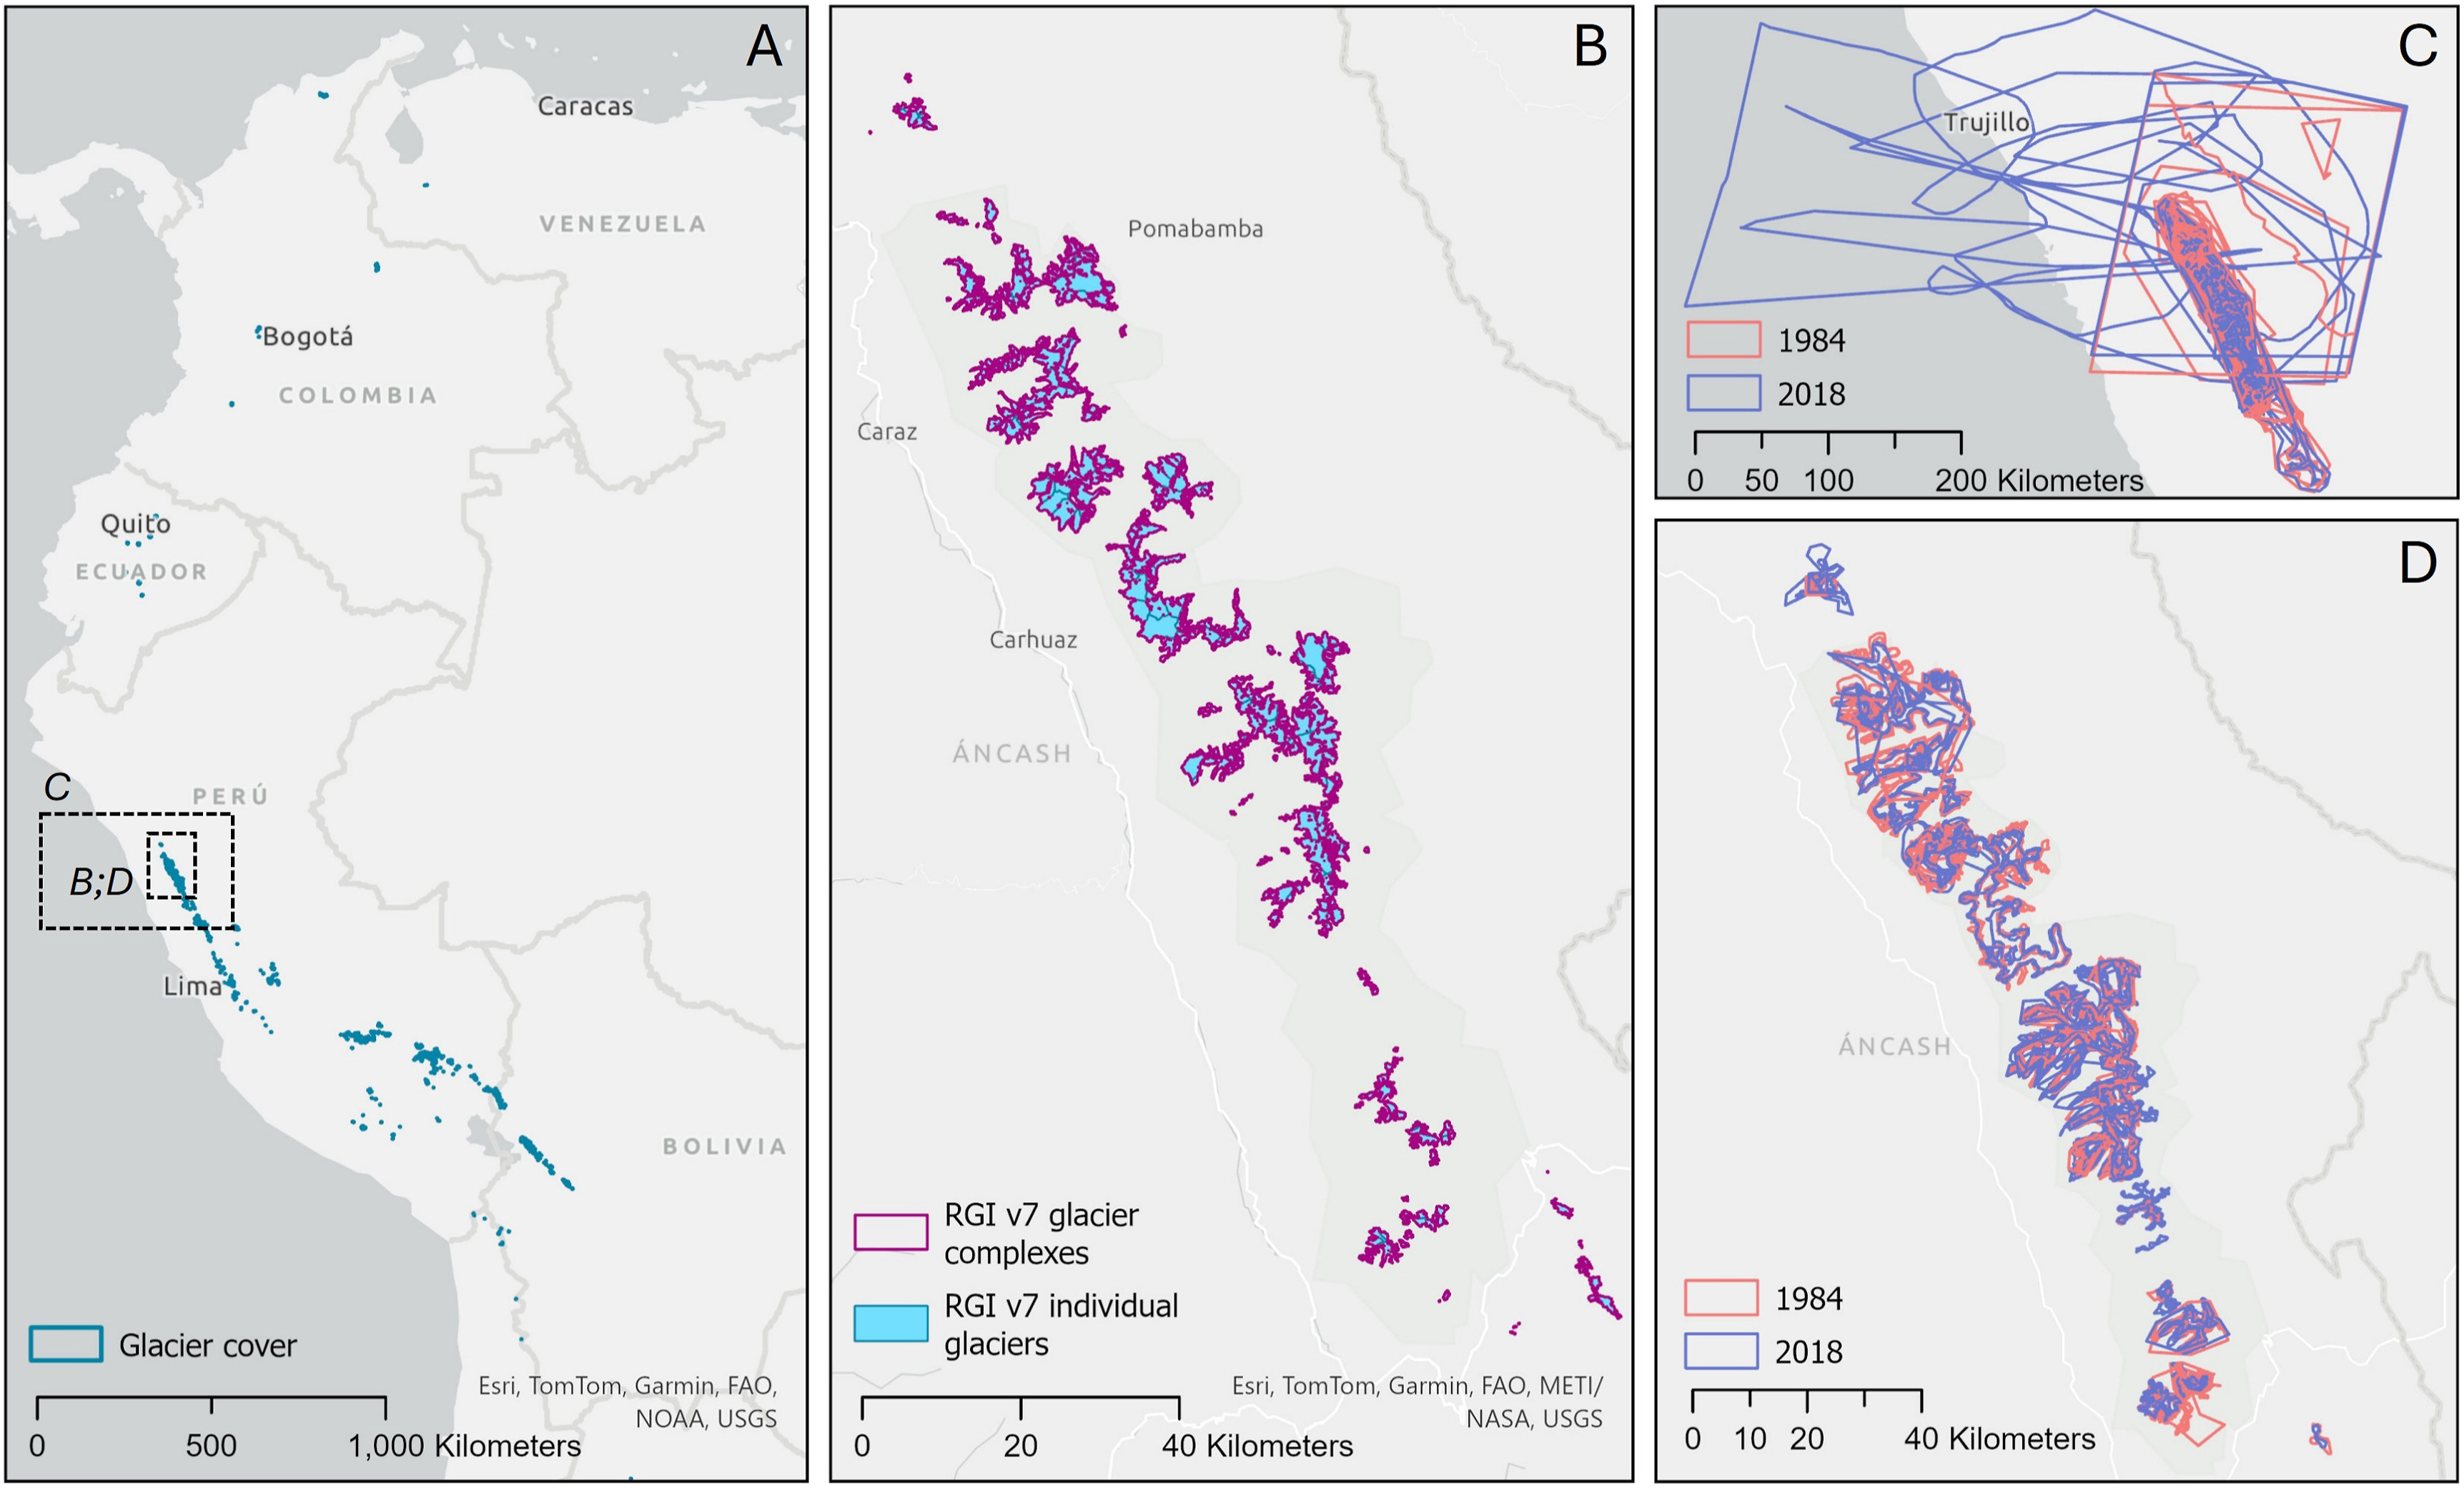
Changes to glaciers and the services they provide downstream offer valuable case studies for geographical learning that engages directly with contemporary global challenges. In the Cordillera Blanca, the rapid loss of glaciers and their importance for regional resource security make the area particularly significant in this regard. At the same time, the region remains comparatively underrepresented in public awareness and understanding – especially among UK audiences – when compared with more familiar regions such as the European Alps. This combination makes the Cordillera Blanca an ideal context in which to assess the educational value of participation in glacier mapping. In doing so, the project can also help to raise awareness of the critical challenges faced by communities living near glacierized regions among geographical communities that are more distant from the environmental changes occurring in places such as the Andes.
GlacierMap
GlacierMap is an online tool developed for crowd-sourced mapping of glacier area change in the Cordillera Blanca and was launched in 2020. A primary aim of the GlacierMap project was to create an opportunity for dissemination and learning of socio-environmental impacts of glacier retreat and changes to meltwater production in this region through ‘hands-on’ mapping of glacier change. We specifically designed the GlacierMap activity with a younger participant pool in mind, particularly UK school and university students, given the demonstrated pedagogical value of accessing the ‘virtual field’ (e.g. McDougall, 2019; Stokes et al., 2012). We reflect further on the value of GlacierMap as an educational tool within Clason et al. (2021). The app was developed to act as a vehicle for geographical outreach and upskilling by diversifying the methods by which the public can interact with environmental data. The outputs of the project also allowed for an evaluation of the efficacy of crowd-sourced glacier mapping in mountain regions for both development of climate and spatial literacy and for glacier inventory production.
Here we analyse participant mapping data and responses to surveys from a time-restricted pilot study to evaluate the opportunities and limitations of crowd-sourcing for glacier inventory production and enhancing climate literacy through experiential learning. We also discuss lessons and recommendations for future implementation of digital tool-based citizen science initiatives for geographical education and outreach.
Methods
GlacierMap workflow and participant recruitment
We developed the GlacierMap concept and mapping tool within an interdisciplinary team of physical and social scientists. GlacierMap is a free, web-based app embedded within the ArcGIS online interface. The core activity involves repeat manual digitisation of the outline of a randomly selected glacier from Landsat satellite imagery for 1984 and 2018. By digitising a glacier over this 34-year period participants can visually experience change in glacier-covered area identified by their own individual mapping effort. The act of mapping also allows participants to engage with glacier change in a hands-on capacity while promoting increased understanding through experiential learning (NASEM National Academies of Sciences Engineering and Medicine, 2018). Prior to its public launch and data collection period, we first tested GlacierMap with a small group of academics to identify any problems with the app workflow, surveys, or the mapping task itself.
The core workflow for the GlacierMap pilot study involved: (1) a survey to establish the demographics and prior understanding of participants; (2) completion of the mapping task for a single glacier for 2 years; (3) provision of information on the downstream impacts of glacier retreat in the Cordillera Blanca; (4) a follow-up survey to gauge the extent to which engagement with the mapping activity and information provided contributed to knowledge generation; and (5) an opportunity to provide feedback on participation. Participants could choose to map further glaciers should they wish following completion of the second survey.
Data collection for the pilot study ran for 4 months from 14th August 2020, with data downloaded on 3rd December 2020. Any mapping contributions submitted after this time are not included in the results presented here. To attract participants, a paid social media advertising campaign was run via Facebook for 8 weeks at the start of the pilot study. We further incentivised participation by including the option to take part in a prize-draw for a voucher on completion of the task. GlacierMap was advertised via networks such as teaching associations, academic and educational mailing lists, word-of-mouth promotion at university events, research team social media, and within a teaching group on Facebook. We chose to launch GlacierMap in August 2020 to coincide with teachers preparing for the return of the new school year (particularly in the UK) since the timing of the launch could have an impact on its initial success and/or recruitment.
Our intention was that through taking part in GlacierMap participants would: (1) increase their experience with geospatial data and its interpretation; (2) enhance their understanding of water resource pressures in Peru; and (3) contribute towards the generation of a crowd-sourced glacier inventory for the region. Peru’s Cordillera Blanca may be relatively unfamiliar to many students and other publics outside of Peru, making GlacierMap a useful tool to foster global and connective thinking and increase awareness of current real-world problems facing tropical mountainous regions under the climate and nature emergencies. Furthermore, GlacierMap can act as a novel educational tool to contribute to the upskilling of Geographic Information Systems (GIS) and satellite image interpretation in school settings (Clason et al., 2021).
Participant surveys
Two short surveys were conducted pre- and post-mapping to gather information on who was taking part and to assess changes in participant awareness and perception of glacier retreat (Tables S1 and S2). The first survey was designed to collect data on participant demographics, education, and prior understanding of glacier change and its impacts in the Peruvian Andes. On completion of the mapping task, participants were provided with information on the downstream impacts of glacier retreat in the Cordillera Blanca and were then asked to complete a second survey to assess the extent to which engagement with the mapping activity and information provided contributed to development of knowledge and change in perception. Participant feedback was also collected to enable the team to understand what worked well and what could be improved. We recognise that this approach provides a limited indication of changes in participants’ knowledge and awareness and does not capture whether any observed changes are sustained over time. The self-reported nature of the data and lack of follow-up mean that the findings should be interpreted as indicative rather than conclusive.
Mapping exercise
The mapping exercise begins with cloud-free Landsat imagery from December 1984, with one glacier selected at random within the app for the participant to map, and indicating the centre of the glacier with a green cross. The initial display area of the selected glacier is based on glacier location and extent according to the Randolph Glacier Inventory (RGI; RGI 7.0 Consortium, 2023), with glacier complexes used instead of individual glaciers where the upper catchment boundaries of outlets draining a single ice-covered peak were indiscernible. As this was a small-scale study with uncertainty over the number of citizen scientists who would contribute, GlacierMap draws upon a sub-set of 30 glacier-covered areas from across the Cordillera Blanca rather than attempting to include every individual glacier. Participants are provided with instructions on mapping glacier area using the ‘draw a polygon’ tool by clicking at multiple points around the glacier periphery. An ‘undo’ button allows for correction of mistakes, and participants can also delete the shape and start again allowing for practise. Once participants indicate that they are happy with their first mapping effort, the same glacier is presented on Landsat imagery from January 2018, and they are invited to repeat the mapping process. On completion, mapped glacier areas for 1984 and 2018 are illustrated in the app, allowing participants to view glacier area change over 34 years as indicated by their own mapping efforts. Participants are then provided with information about the impacts of glacier retreat in the region and have the option to map another glacier(s).
Analysis of survey data
Basic statistical analysis was used to analyse quantitative survey response data, while a thematic approach was taken to analyse the open-text responses. Themes were first identified in the data by two team members independently, and these were subsequently reviewed and discussed before a coding framework was established to quantify the frequency of these themes across the survey data.
Analysis of mapping contributions
Based on survey responses we split participants into ‘expert’ and ‘non-expert’ groups for analysis of mapping contributions. Experts were defined as participants who had either postgraduate study or employment experience with glaciology (see 'Participant demographics and prior knowledge') and accounted for 18% of participants. This grouping allowed us to maintain sufficient mapped outlines per group for most glaciers within our analyses; however, we acknowledge that within those with glaciology experience there will be variability in their prior exposure to interpretation of satellite imagery. To restrict analysis only to contributions of an acceptable quality, we removed 182 outlines based on visual quality checking of mapped outlines (Figure 1, panel C). This helped to eliminate scribbled contributions, or where mapped area was orders of magnitude more than other outlines. Statistical outliers were also removed prior to analysis of mapping data. For example, Glacier 10 was mapped 9 times by non-experts for 1984, with a mean area of 3.99 km2, and a range of 3.7 to 4.38 km2, when two statistical outliers of 0.69 and 151.4 km2 were removed. Outliers were defined as polygon area values below Q1 – 1.5 * IQR or above Q3 + 1.5 * IQR, where Q1 and Q3 are the first and third quartiles and the IQR is the interquartile range.
For each glacier, information on mapped area and the number of vertices created for each polygon were recorded, allowing for comparison of the average area of each glacier mapped by expert and non-expert groups respectively, in addition to how many outlines were produced by both groups for each glacier. While information on glacier area allowed us to assess the accuracy of and variability in participant mapping, we also wanted to assess the level of detail afforded to the task by participants. To provide a proxy for this – here referred to as ‘effort’ – we divided the number of vertices by glacier area for each individual mapping contribution. It is important to note that ‘effort’ refers only to mapping detail, rather than being a measure of mapping quality. Citizen scientist mapping of each glacier was also compared against RGI v7.0 glacier outlines for the region (Figure 1), including visual assessment to understand why differences in mapping arose (e.g. debris/snow cover). Finally, we produced heatmaps of overlapping glacier polygons for the entire dataset for each year to assess the extent to which individual contributions aligned and whether consensus may be useful for glacier inventory production.
Results
Participant demographics and prior knowledge
Five hundred and thirty-seven participants contributed to GlacierMap during the 4-month data-collection period (14th August to 2nd December 2020), of whom 51% identified as female and 46% as male. Participant age was skewed towards a younger population (reflecting our target group), with 51% of participants being under 21 years old. The largest participant age group was 19–21 (28%), followed by 16–18 (24%). The largest group by occupation was undergraduate students (40%), followed by school students (24%), teachers (9%), researchers (6%), university lecturers (5%), postgraduate students (4%), PhD students (3%), scientists (3%), and a variety of other occupations (6%). Most participants had attended university, with 33% of participants having studied up to undergraduate level and 17% to postgraduate level. 94% of participants had studied geography at school and/or university, including 14% up to GCSE level or equivalent (a subject-level qualification in the UK typically taken by students aged 14–16), 17% up to A-level (a subject-level qualification in the UK typically taken by students aged 16–18), 38% up to undergraduate level, and 17% up to postgraduate level. Although GlacierMap was designed primarily for a UK audience, the tool had a wide international reach: 43% of participants identified their country of residence as the UK, with further participants from Canada (19%), the USA (11%), Switzerland (4%), Peru (4%), and 19 other countries across the world. Most participants (85%) had not visited Peru. 40% of participants had some form of glaciology experience, largely through undergraduate education (22%), but also postgraduate education (8%) or employment (10%).
Participants were asked a short series of questions in the pre-mapping survey (Table S1) to gauge prior understanding of glacier change in Peru. 98% of participants stated that they agreed glaciers are changing in the Peruvian mountains, with 98% also stating that they thought glaciers in the Peruvian mountains were shrinking, indicating a high level of prior knowledge. Participants were also asked ‘What percentage of glacial area do you think has been lost in Peru since 1980?’ with a mean estimate of 41% (standard deviation 18.5), a minimum of 2%, and a maximum of 100%. On average this was a slight overestimation of the true value (∼30–40% with regional variability; Seehaus et al., 2019), but most answers were within +/− 10%. When asked: ‘Why do you think the area covered by glaciers has changed/reduced in the Peruvian Andes since 1980?’, 66% of participants mentioned climate change or global warming in open-text responses, while 48% mentioned warming temperatures and/or changes in precipitation. 27% of responses offered some further form of explanation about climate change, and 6% demonstrated technical understanding of climate. Only four participants (1%) stated that they were unsure or did not know why glaciers are retreating in Peru. When asked ‘On a scale of 1-10 (1 being not very serious, 10 being very serious), how would you rate glacial change as a global issue?’ the mean rating was 8.7, with a minimum of 1 and maximum of 10.
GlacierMap inventory and mapping accuracy
Nine hundred and forty-three glacier boundaries were contributed by participants prior to the removal of outlines that were either scribbles or orders of magnitude different to others (n = 183) and statistical outliers (n = 97) (Figure 1, panel C). Of the 663 outlines included for further analysis (Figure 1, panel D), there were 330 for 1984 and 333 for 2018, with 69 and 261 mapped by experts and non-experts for 1984, respectively, and 72 and 261 for 2018. An example of outlines mapped for Glacier 6 is provided in Figure 2. The maximum number of glaciers mapped by individual expert and non-expert participants was 12 and 14, respectively, for both years, although the median number of glaciers mapped by individuals was 1 for both groups and years. The detailed nature of the mapping task, and the required completion of two surveys, meant that participation in the pilot study took approximately 20 minutes from start to finish, so although participants could choose to map more than one glacier, many did not. Excluding outliers, the number of boundaries mapped per glacier ranged between 0 and 7 for the expert group and between 4 and 14 for the non-expert group (Table S3). Glaciers were assigned to participants at random, so the 30 glaciers did not receive the same frequency of mapping. There were no contributions from the smaller expert group for Glaciers 19 and 24 (Table S3). Example of participant mapping for Glacier 6 for 1984 (a); background image Landsat 5 and 2018 (b); background image Landsat 8. Corresponding RGI glacier complex, with individual RGI glaciers also illustrated (c).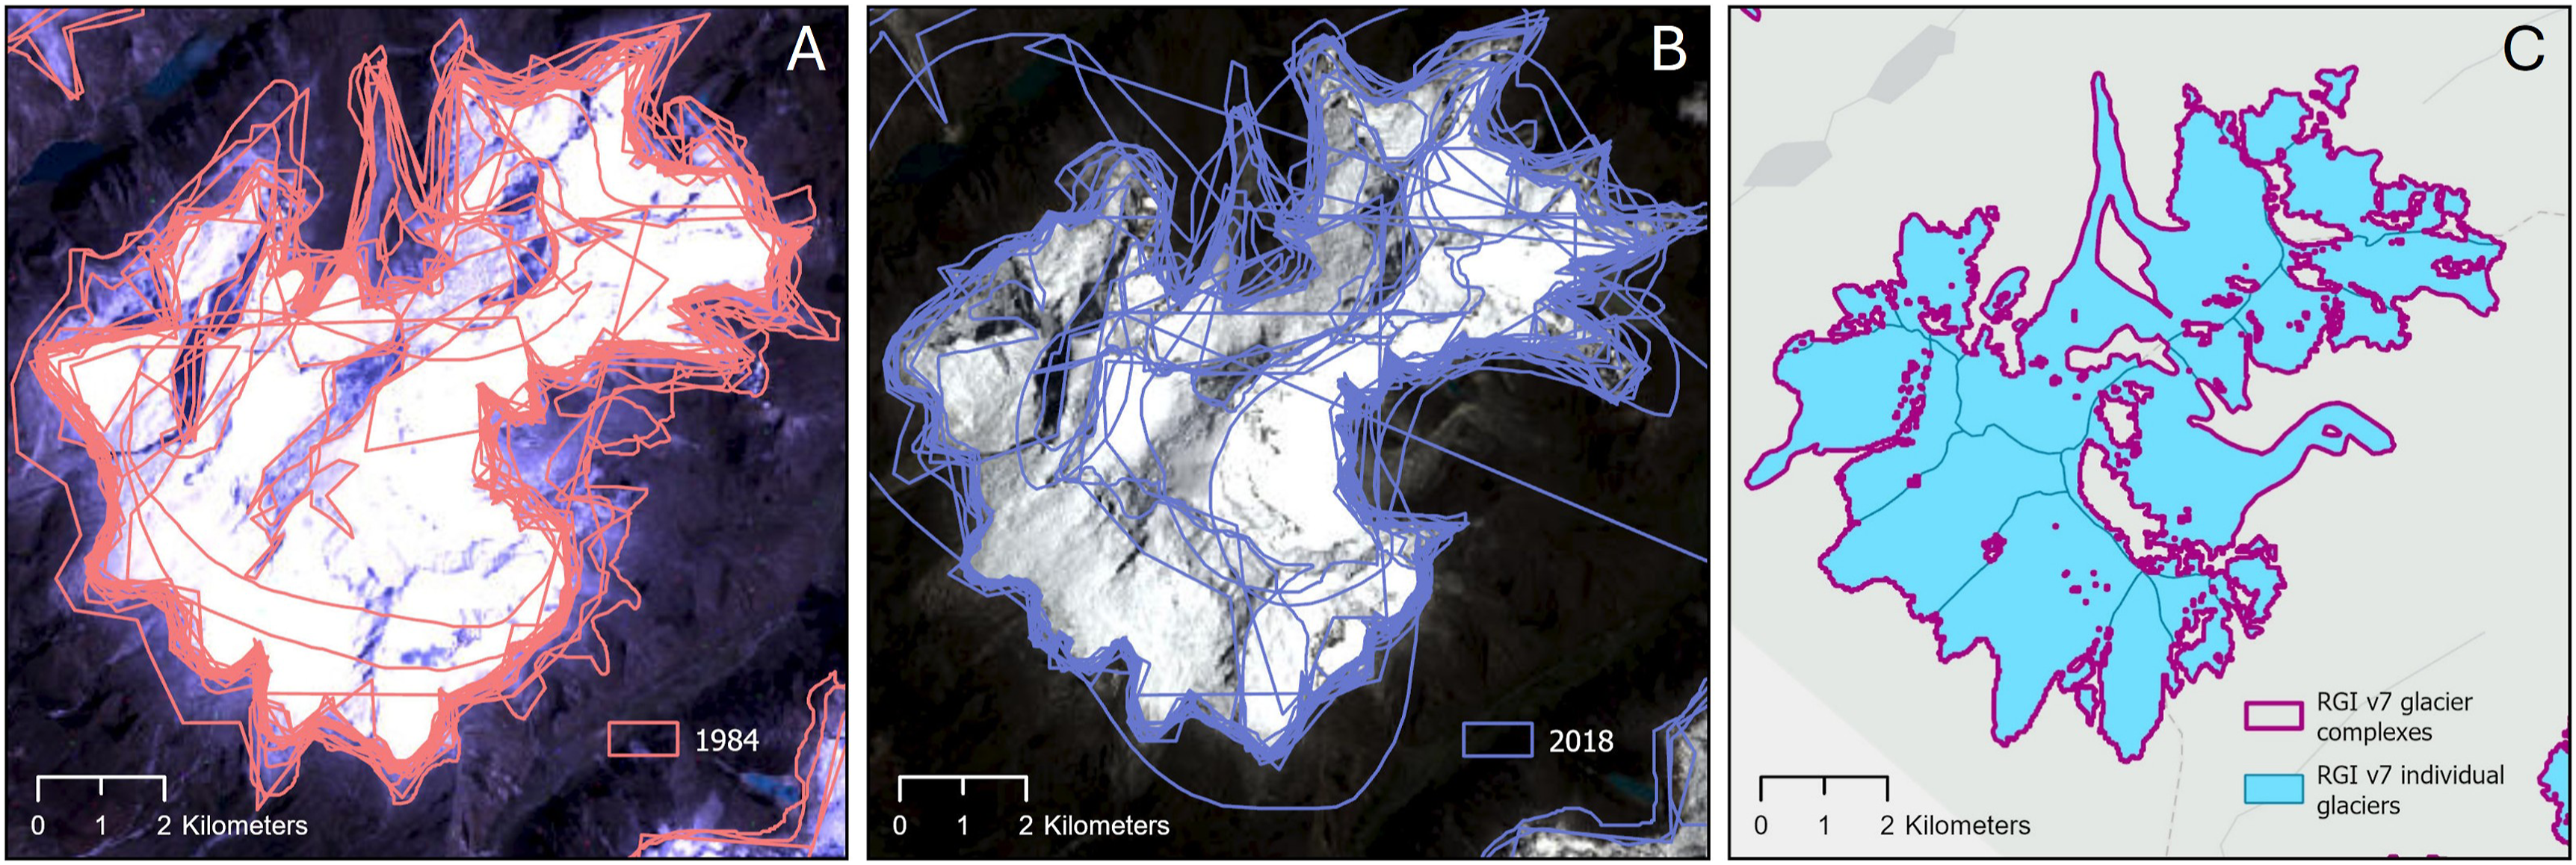
For several glaciers in our study sample, such as Glacier 6 (Figure 2), the glacier area represents an RGI glacier complex rather than individual outlets (see Table S3). We chose to use a mix of individual glaciers and glacier complexes due to the lack of clarity provided by Landsat imagery alone for where the upper and lateral bounds lie for some glaciers in this region. The complexity of glacier cover in the Cordillera Blanca proved to be one of the main challenges for mapping accuracy and comparability (see 'Challenges for crowd-sourced glacier monitoring'). Mean glacier area mapped by experts ranged from 78% smaller to 4362% larger than the RGI value, while mean glacier area mapped by non-experts ranged from 18% smaller to 2572% larger. Mean areas for 11 out of 28 glaciers were within 25% of the RGI area for the expert group, with a tendency to underestimate area (below the RGI value for 18 out of 28 glaciers). For the non-expert group, mean areas for 9 out of 30 glaciers were within 25% of the RGI area, and the majority of glacier areas (27 out of 30) were overestimated compared to the RGI value. To further assess whether crowd-sourced mapping could provide a useful basis for assessing glacier change, we produced heatmaps of glacier polygons based on the 663 mapping contributions considered in our analyses (Figure 3). Glacier area tends to be overestimated in comparison to RGI outlines where there is overlap between fewer than 10 polygons, so the use of overlapping features works better for those glaciers that were randomly allocated to a larger number of participants. Nevertheless, the heatmaps clearly illustrate changes in glacier area between 1984 and 2018. (a) Heatmaps of overlapping glacier polygons for all years across the full study area, where boxes indicate the locations of the 30 selected glaciers; (b) heatmap of 1984 polygons for Glaciers 4, 5, and 12; (c) heatmap of 2018 polygons for Glaciers 4, 5, and 12.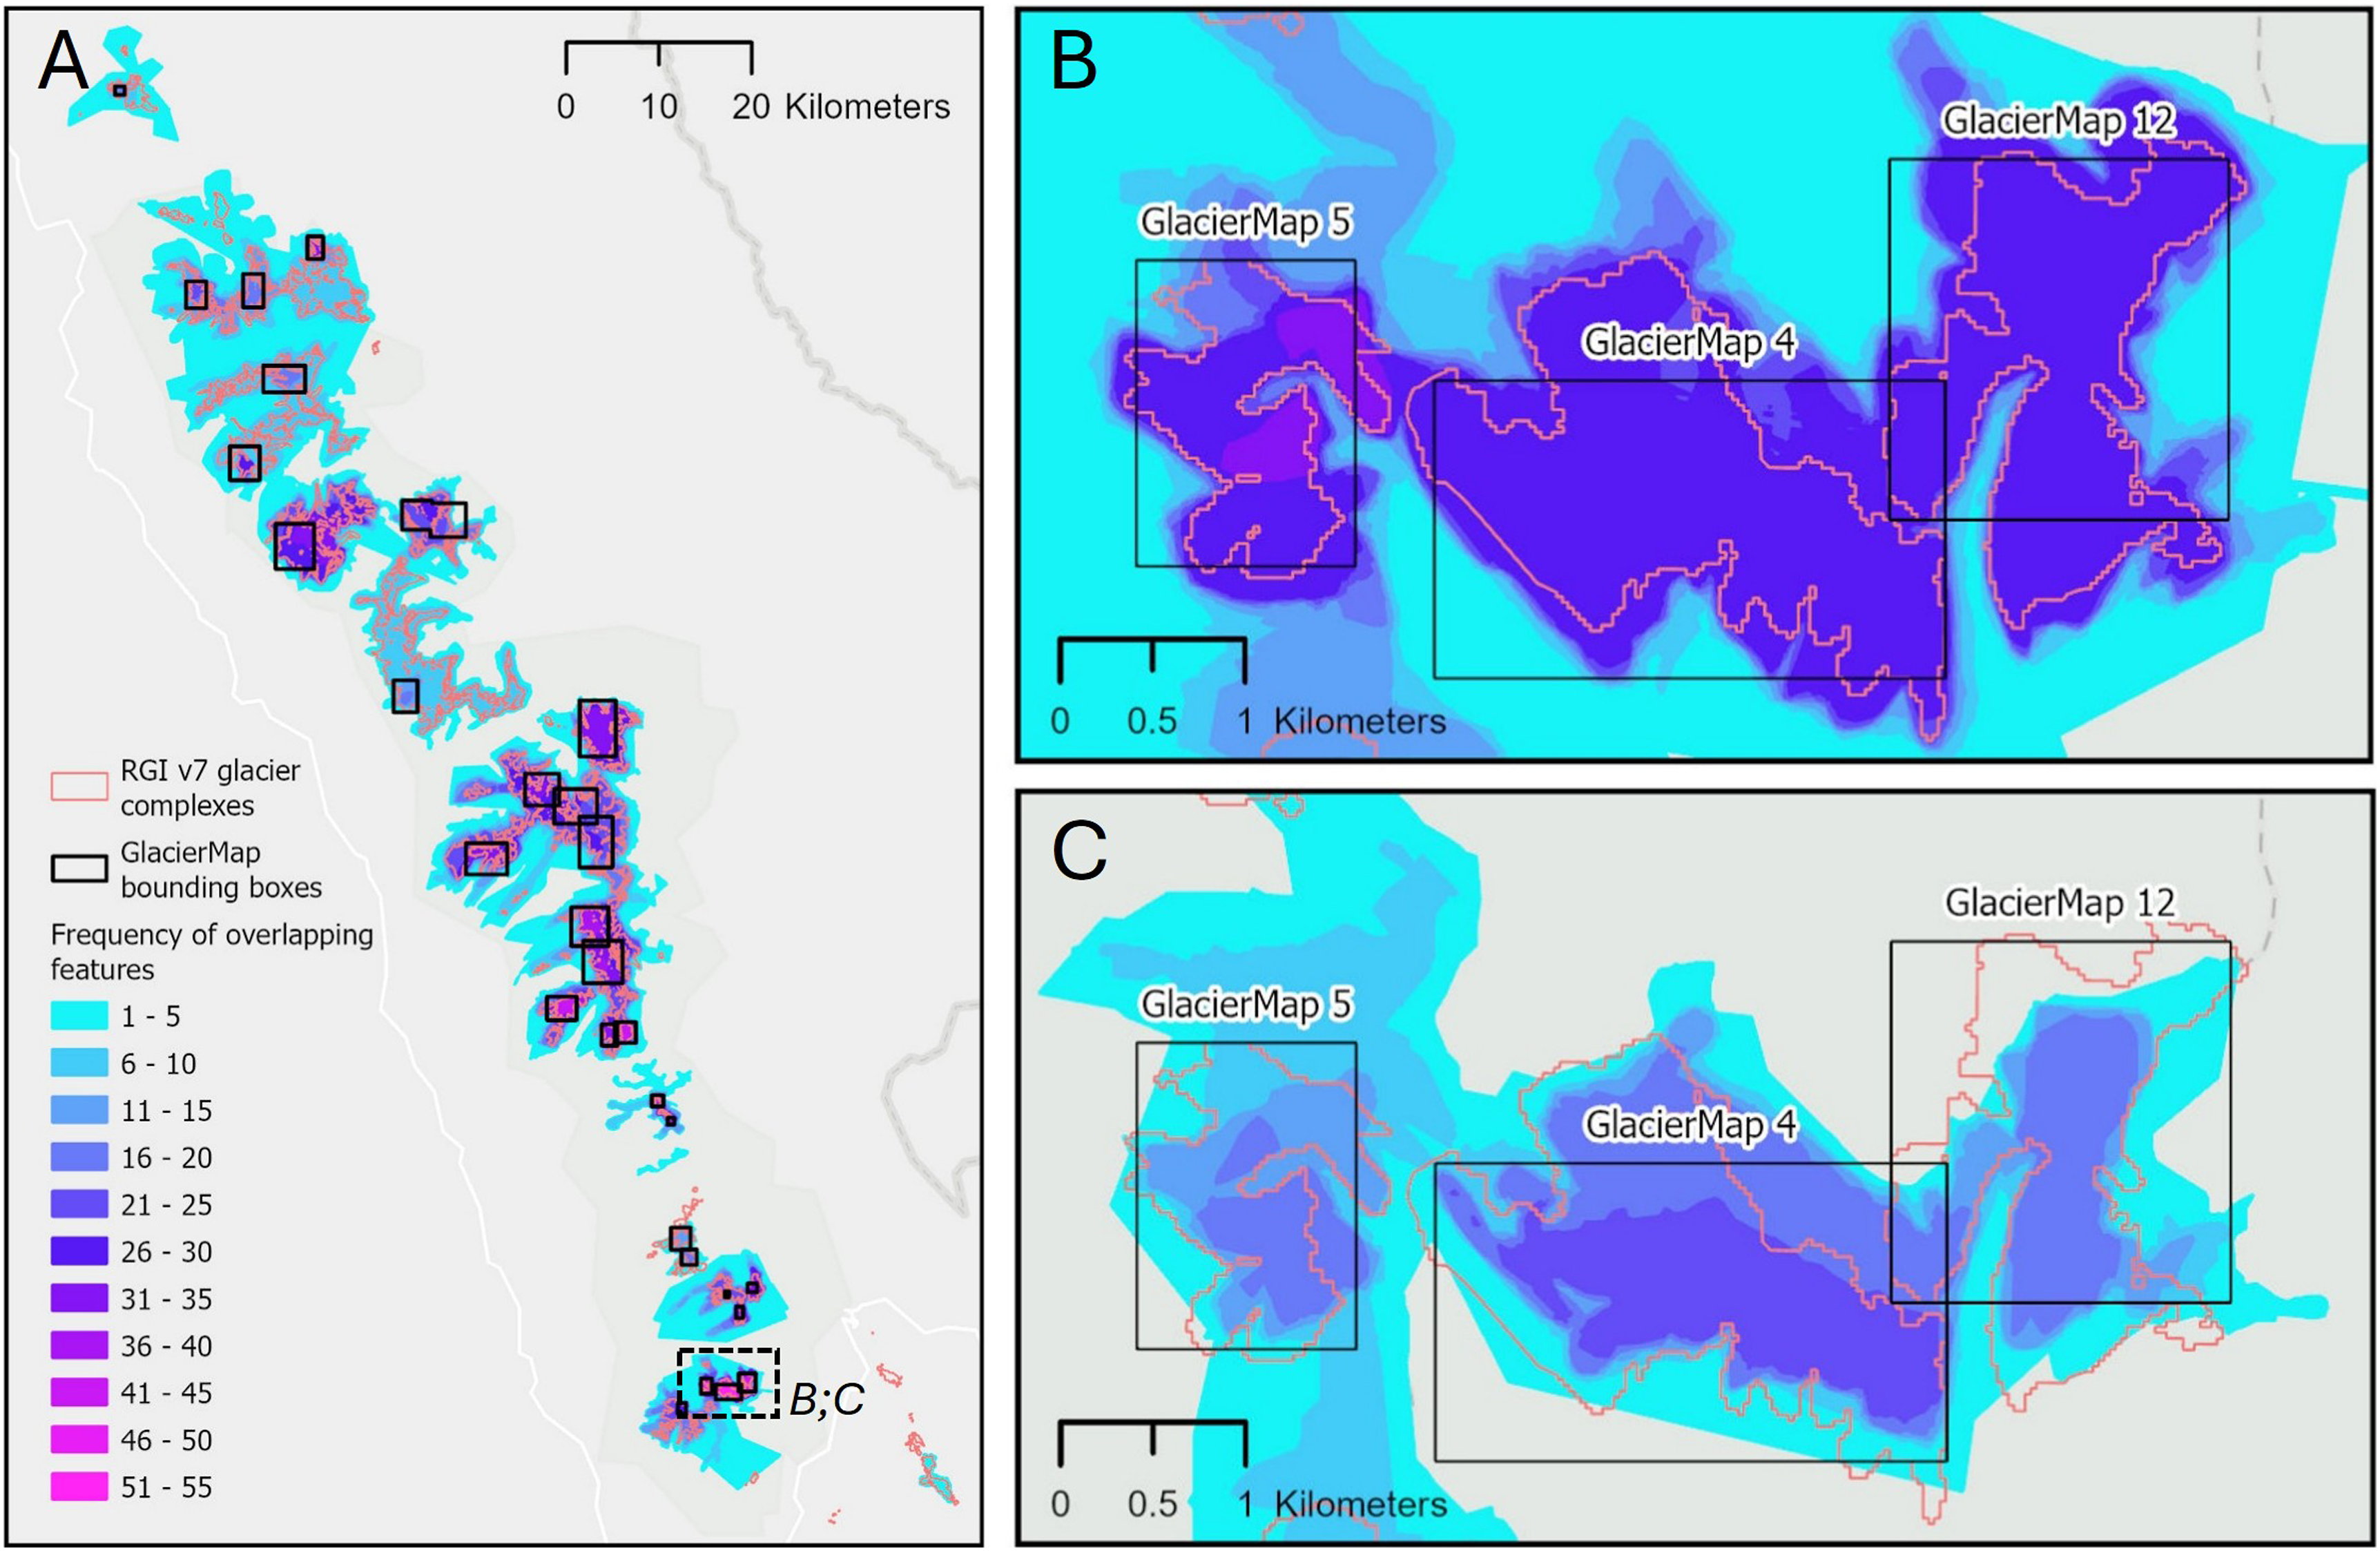
Expert versus non-expert mapping
Biases and variability in accuracy can be found in both professionally produced and citizen scientist-produced data (Kosmala et al., 2016), including within mapping tasks (Hillier et al., 2015; Racoviteanu et al., 2009). To assess differences in mapping contributions between those with or without significant prior experience in glaciology (postgraduate study or employment), we split participant mapping contributions into expert and non-expert groupings. Citizen science data is usually designed to be used as a collective, rather than relying on individual contributions, so here we discuss average mapping efforts of the two groups. Comparison of mean area mapped for each glacier for both 1984 and 2018 (Figure 4; Figure S1) demonstrates that for many glaciers the area mapped by non-experts is higher than that by experts, and with a larger range. However, we are also mindful of the larger number of participants in the non-expert group. This variability in non-expert mapped area is particularly notable for Glaciers 7, 11, 13, 15, and 27, and likely indicates difficulties such as interpreting the extent of glacier area where snow and debris are present, or in determining where a single glacier entity starts and ends. Prior exposure to interpretation of satellite imagery and understanding of spatial scale are likely also important factors, although we note that even experts have challenges in mapping glaciers, particularly where snow and debris-cover is present (Racoviteanu et al., 2009). While there are significant differences in the area mapped by the two groups, changes in glacier area are clearly identified for most glaciers between 1984 and 2018 (Table S3), with a median area decrease of 23% for the expert group and 15% for the non-expert group. This demonstrates that despite issues around mapping accuracy and variability, the activity has value as a vehicle for dissemination and spatial skills development, where achieving the ‘right answer’ is not necessarily a pre-requisite to learning. Expert versus non-expert mapping data for 1984 (outliers removed) for each of the 30 glaciers: (a) glacier area (RGI v7.0 glacier area provided for comparison); (b) number of vertices mapped; (c) mapping ‘effort’ (the number of vertices divided by mapped glacier area).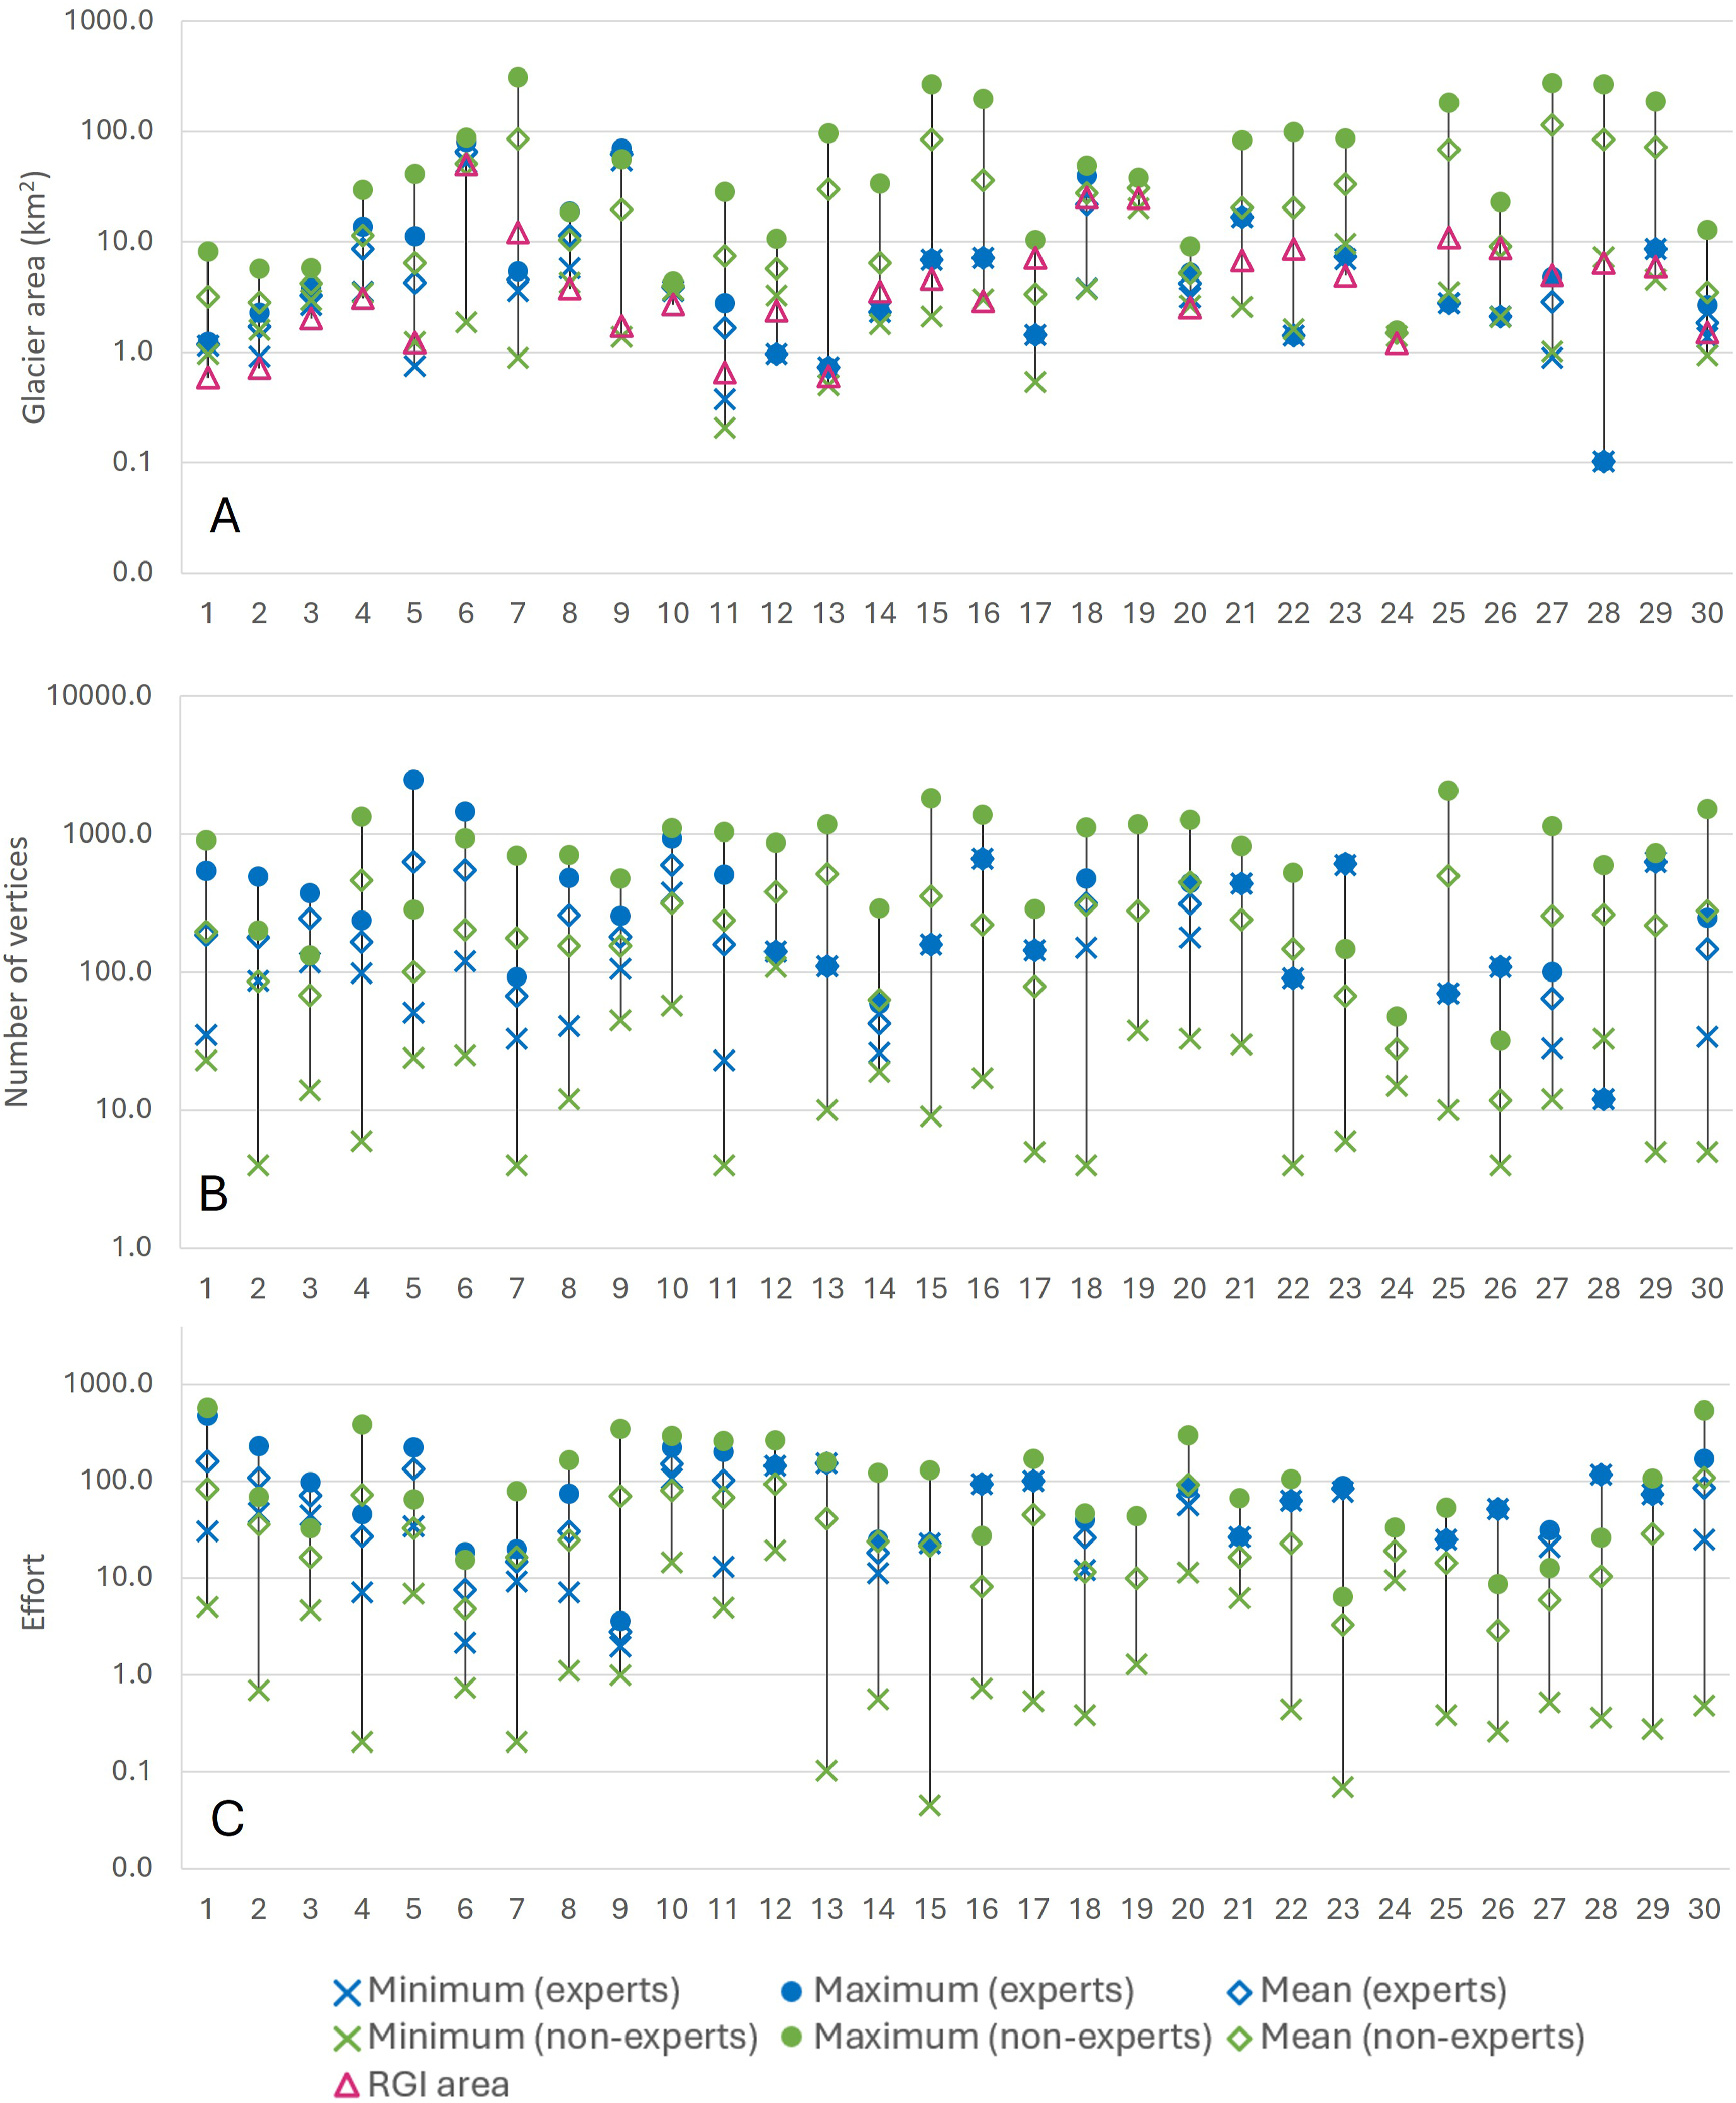
There is a larger range in the number of vertices mapped for individual glaciers by non-experts than experts (Figure 4; Figure S1), however there is an equal split in whether the mean number of vertices was higher for experts or non-experts for each glacier in 1984. For 2018, the mean number of vertices was higher for non-experts than experts (17 out of 28 glaciers, excluding two glaciers for which there were no contributions by experts). The glaciers included in our study range in size between 0.6 and 50 km2 (based on RGI v7.0) thus, we normalized the number of vertices by dividing vertices by mapped glacier area to provide a proxy for ‘effort’. Based on this proxy, we see a strong tendency for experts to map in a more detailed fashion than non-experts. For 1984, experts demonstrate more effort for 22 out of the 28 glaciers mapped by both groups, with a similar picture for 2018. It is important to reiterate, however, that ‘effort’ is a measure of mapping detail, not mapping quality. To assess whether there was possible fatigue for the task we also looked at the change in the number of vertices and effort for each group between 1984 and 2018. There is a decrease in the average number of vertices mapped by experts between 1984 and 2018 (−61.7 vertices; reduction observed for 20 out of 28 glaciers) and a much smaller decrease in the average number of vertices mapped by non-experts (−2.6 vertices; reduction observed for 15 out of 30 glaciers). However, there is an increase in effort for both experts (+24.7 vertices; increase observed for 18 out of 28 glaciers) and non-experts (+12.5 vertices; increase observed for 22 out of 30 glaciers), perhaps due to increased familiarity with the task when mapping a glacier for the second time.
Participant motivation, feedback, and changes in perception
Of the 537 participants who started GlacierMap and completed the pre-mapping survey, 286 went on to complete the follow-up survey (53%). To gauge any shift in perception of glacier change, we repeated the question ‘On a scale of 1-10 (1 being not very serious, 10 being very serious), how would you rate glacial change as a global issue?’ and found a small increase in the mean rating (9.1) in comparison to that from the initial survey (8.7). After being provided with information about glacier change in the region since 1980, 27% of participants stated that they were surprised to learn that glaciers in the Cordillera Blanca had lost ∼30% of their area, so while there was relatively little change in concern about glacier change, and baseline knowledge/concern was generally very high, engagement with mapping resulted in new knowledge about the degree of glacier area change for some participants. Thematic analysis of responses around why participants were surprised about the amount of glacier area change suggested that people found this to be unexpected (n = 29), that glacier retreat was more than they thought (n = 22)/less than they thought (n = 17), that they were surprised about glacier loss over a short period of time (n = 9), and they were surprised about climate change and/or glacier retreat in Peru (n = 4). Themes identified in responses by participants who were not surprised by the rate of glacier loss included awareness of glacier retreat (n = 102), awareness of climate change (n = 85), that similar change is seen elsewhere/globally (n = 47), that they had taught or learnt about this in geography (n = 31), or had previous experience/knowledge (n = 21). Although many participants had previous geography education (e.g. 94% of participants had studied geography at GCSE level or above), were aware of climate change, and/or had experience in glaciology (40%), a large number of participants nevertheless expressed their enjoyment in taking part in GlacierMap within feedback, and that both participation in the mapping exercise and information provided had helped to enhance their understanding of the impacts of climate change.
When asked how they had heard about GlacierMap, most participants (53%) said through a teacher, with a further 12% via word of mouth, 10% via Twitter, 9% via a University of Plymouth event, 8% via mailing lists, and smaller percentages through other avenues. Motivations for participation included for educational purposes (30%), to contribute to a scientific research project (19%), because they were interested in/wanted to know more about the topic (19%), to contribute to a citizen science glacier inventory (14%), curiosity (14%), and the chance to win a voucher (2%). Responses highlighted that neither the social media campaign nor prize draw were significant in attracting participants, and that teaching networks were most effective for recruitment. Participant motivations were in line with previous reflections on the role of altruism for contribution to citizen science by Dunkley (2019).
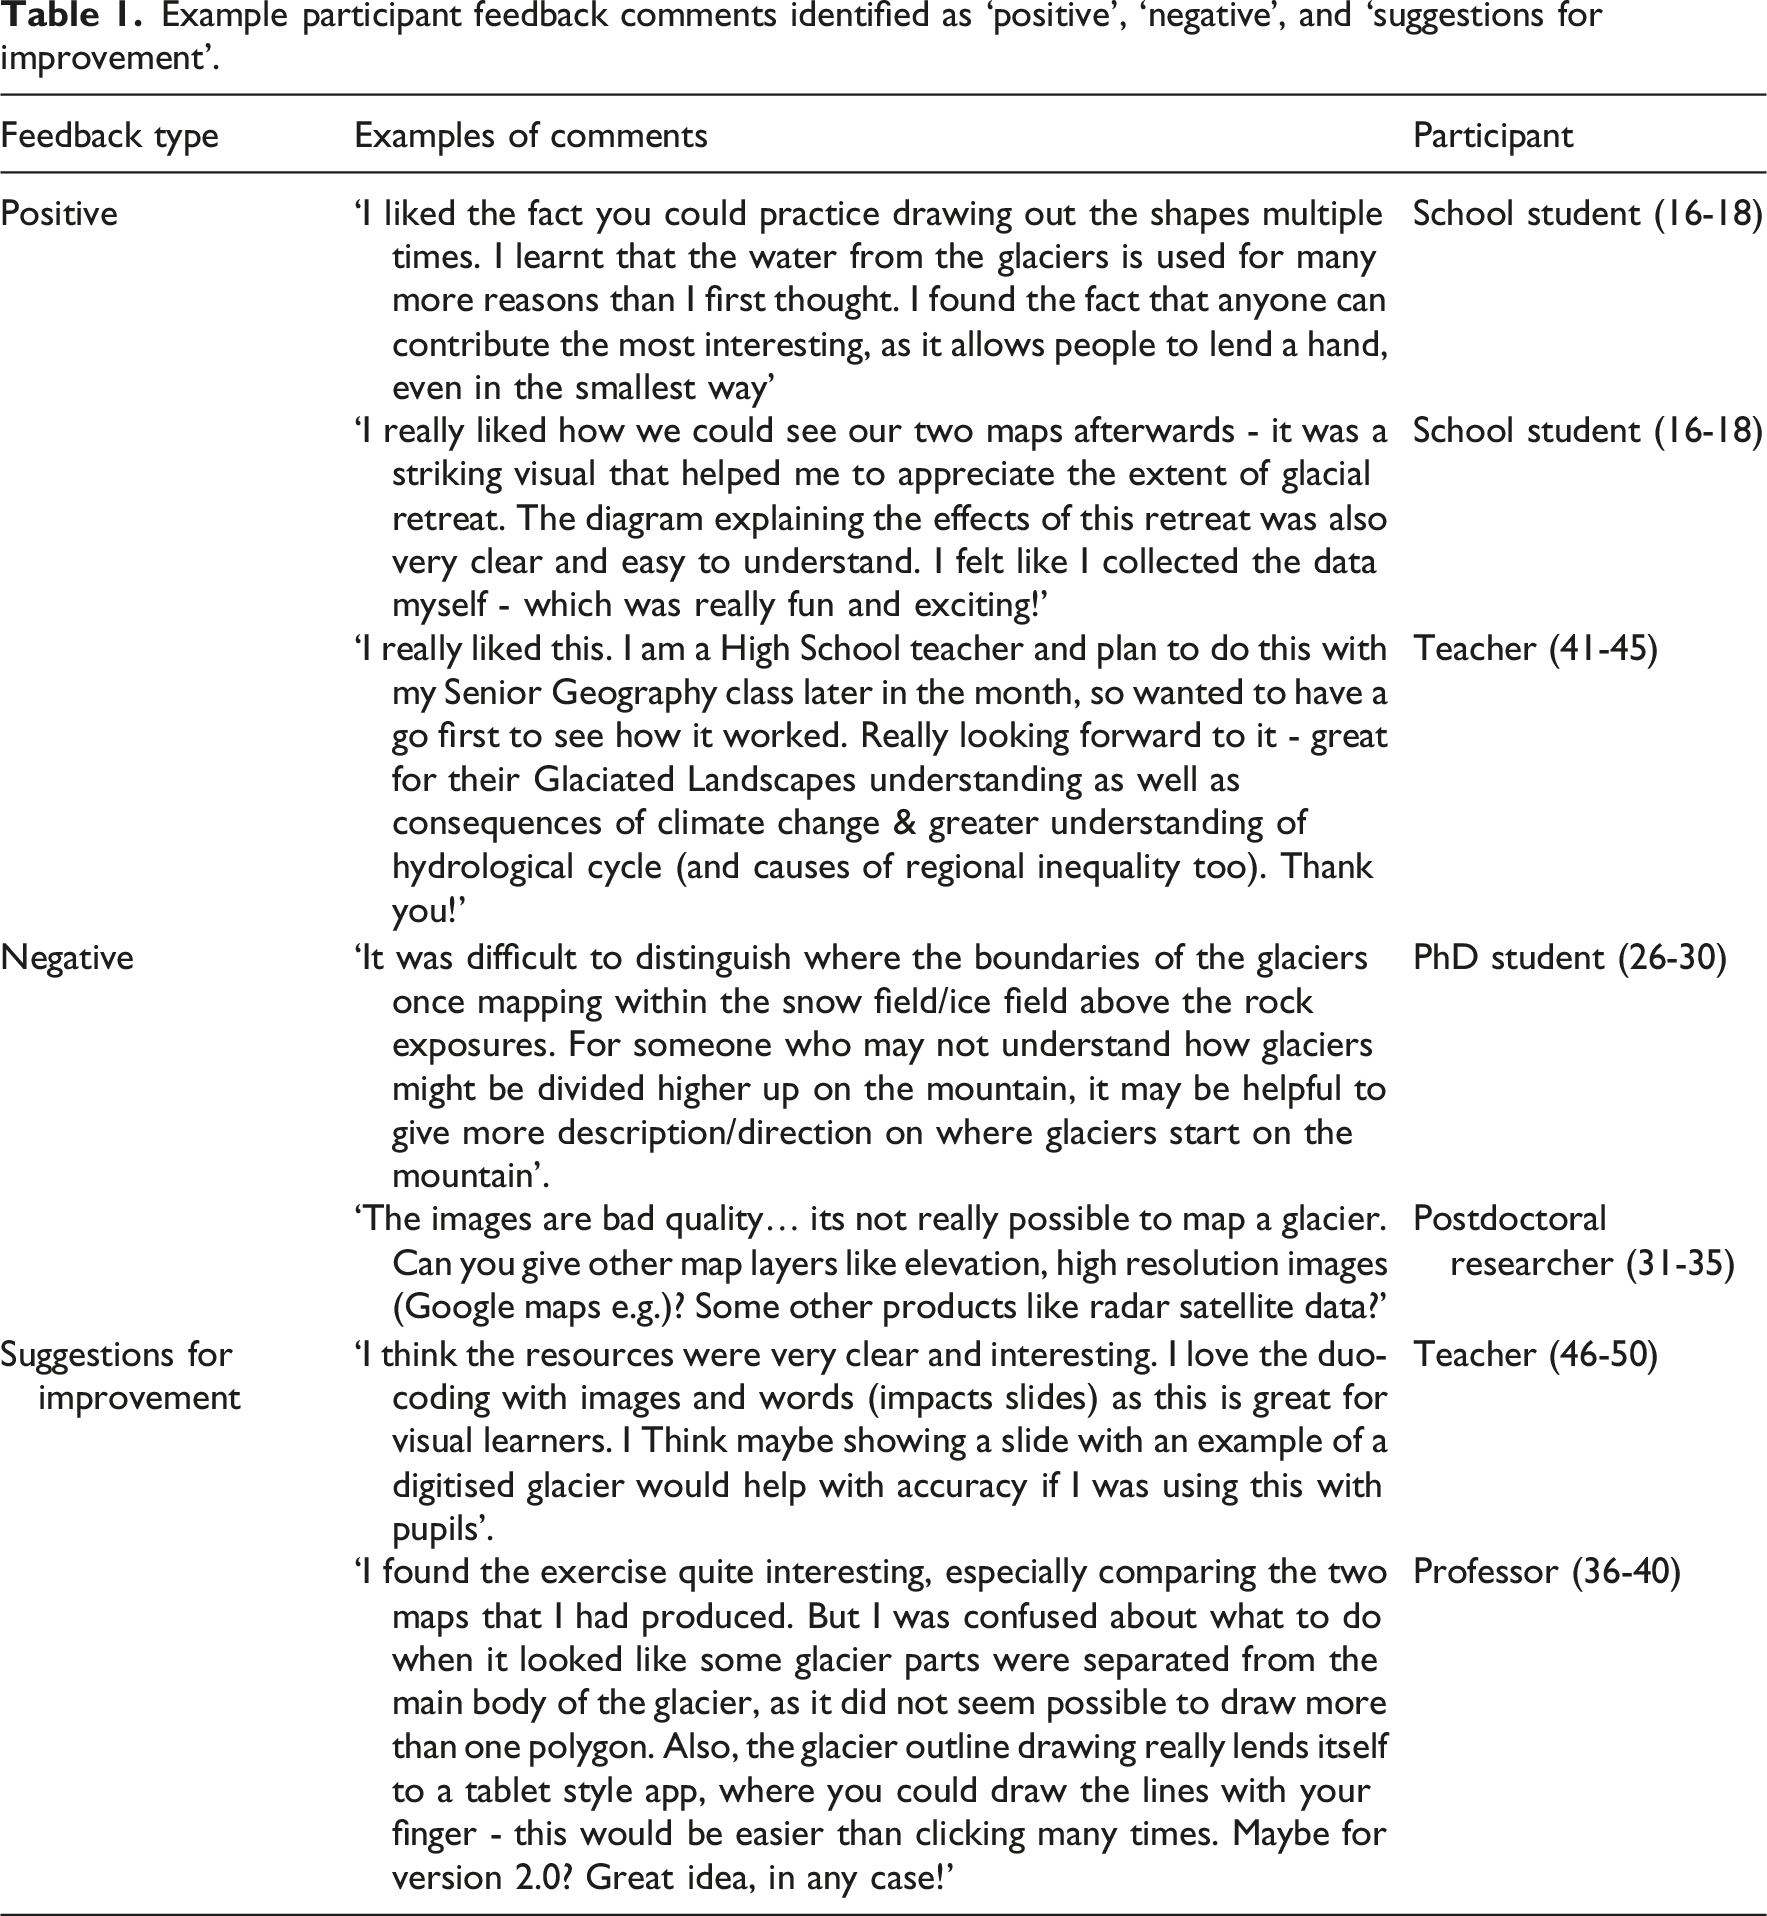
Example participant feedback comments identified as ‘positive’, ‘negative’, and ‘suggestions for improvement’.
Discussion
Challenges for crowd-sourced glacier monitoring
Our assessment of the glacier outlines contributed by participants highlights that while many were relatively similar to existing RGI glacier outlines for the region, the considerable variability in accuracy of individual glacier perimeters and areas renders most contributions unsuitable for the purposes of crowd-sourced glacier inventory and monitoring. We observed that ‘experts’ were not notably better than ‘non-experts’ with regards to mapping accuracy, illustrating the subjectivity in manual delineation of glaciers (Paul et al., 2013). The Cordillera Blanca was chosen for this project because UK school students are unlikely to have been exposed to the topic of tropical glaciers and the impacts of their retreat previously within their learning. However, the glaciers of the Cordillera Blanca are likely trickier to map in comparison to more easily defined and familiar valley glaciers in regions such as the European Alps, due to their extensively snow-covered summits, complex terrain, and debris cover, making delineation of upper and lateral boundaries difficult. Hillier et al. (2015) reflect on the challenges of mapping poorly defined landform boundaries in their study comparing mapping of drumlins on a synthetic landscape by 25 researchers with a range of previous experience in geomorphology, while Smith and Clark (2005) suggest that while there may be low variability in the mapping efforts of an individual, considerable variation can exist between mappers (Smith and Clark, 2005). There is thus a need to consider prior experience, differences in mapping approach, and the time and detail afforded to the task within the design of mapping-based citizen science initiatives, in addition to the challenges of mapping complex environments for experts and non-experts alike.
As noted above, the physical characteristics of the landscape in the Cordillera Blanca likely played a significant role in the accuracy of and variability in glacier mapping in this study (Figure 5). While we selected imagery to minimise cloud cover, which is often extensive in the region, the land cover remains complex, with shadowing due to the steep terrain, dynamically evolving debris cover on and proximal to glaciers, permanent and seasonal snow cover, and glacier-covered summits where individual glacier catchments merge and boundaries are unclear. We also opted to use medium-resolution Landsat 5 imagery to facilitate the illustration of glacier change since 1984 over a multi-decadal period, with Landsat 8 imagery selected for 2018 for consistency and comparability. However, the choice to maximise the period of possible glacier change necessitated neglecting the use of more recent imagery of higher resolution and often higher acquisition frequency. When combined with the complexity of the landscape, the spatial resolution of the imagery likely posed a considerable challenge for mappers without prior experience in glaciology and/or satellite image interpretation, particularly since the public are now used to viewing high resolution imagery from providers such as Maxar and Airbus within tools such as Google Maps. This further highlights the importance of training to enable appropriately informed collection of data of adequate quality (Strobl et al., 2020). Examples of challenges for identifying glacier cover within the Cordillera Blanca. Overestimation of glacier area due to snow cover for some polygons (panels (a)–(c); disparity between mapped outlines due to glacier debris cover (panels (d)-(f)); differences in the scale of mapping due to unclear glacier boundaries (panels (g)–(i)). Panels (a), (d), and (g) show Maxar imagery with RGI v7.0 outlines, panels (b), (e), and (h) Landsat 5, and panels (c), (f), and (i) Landsat 8.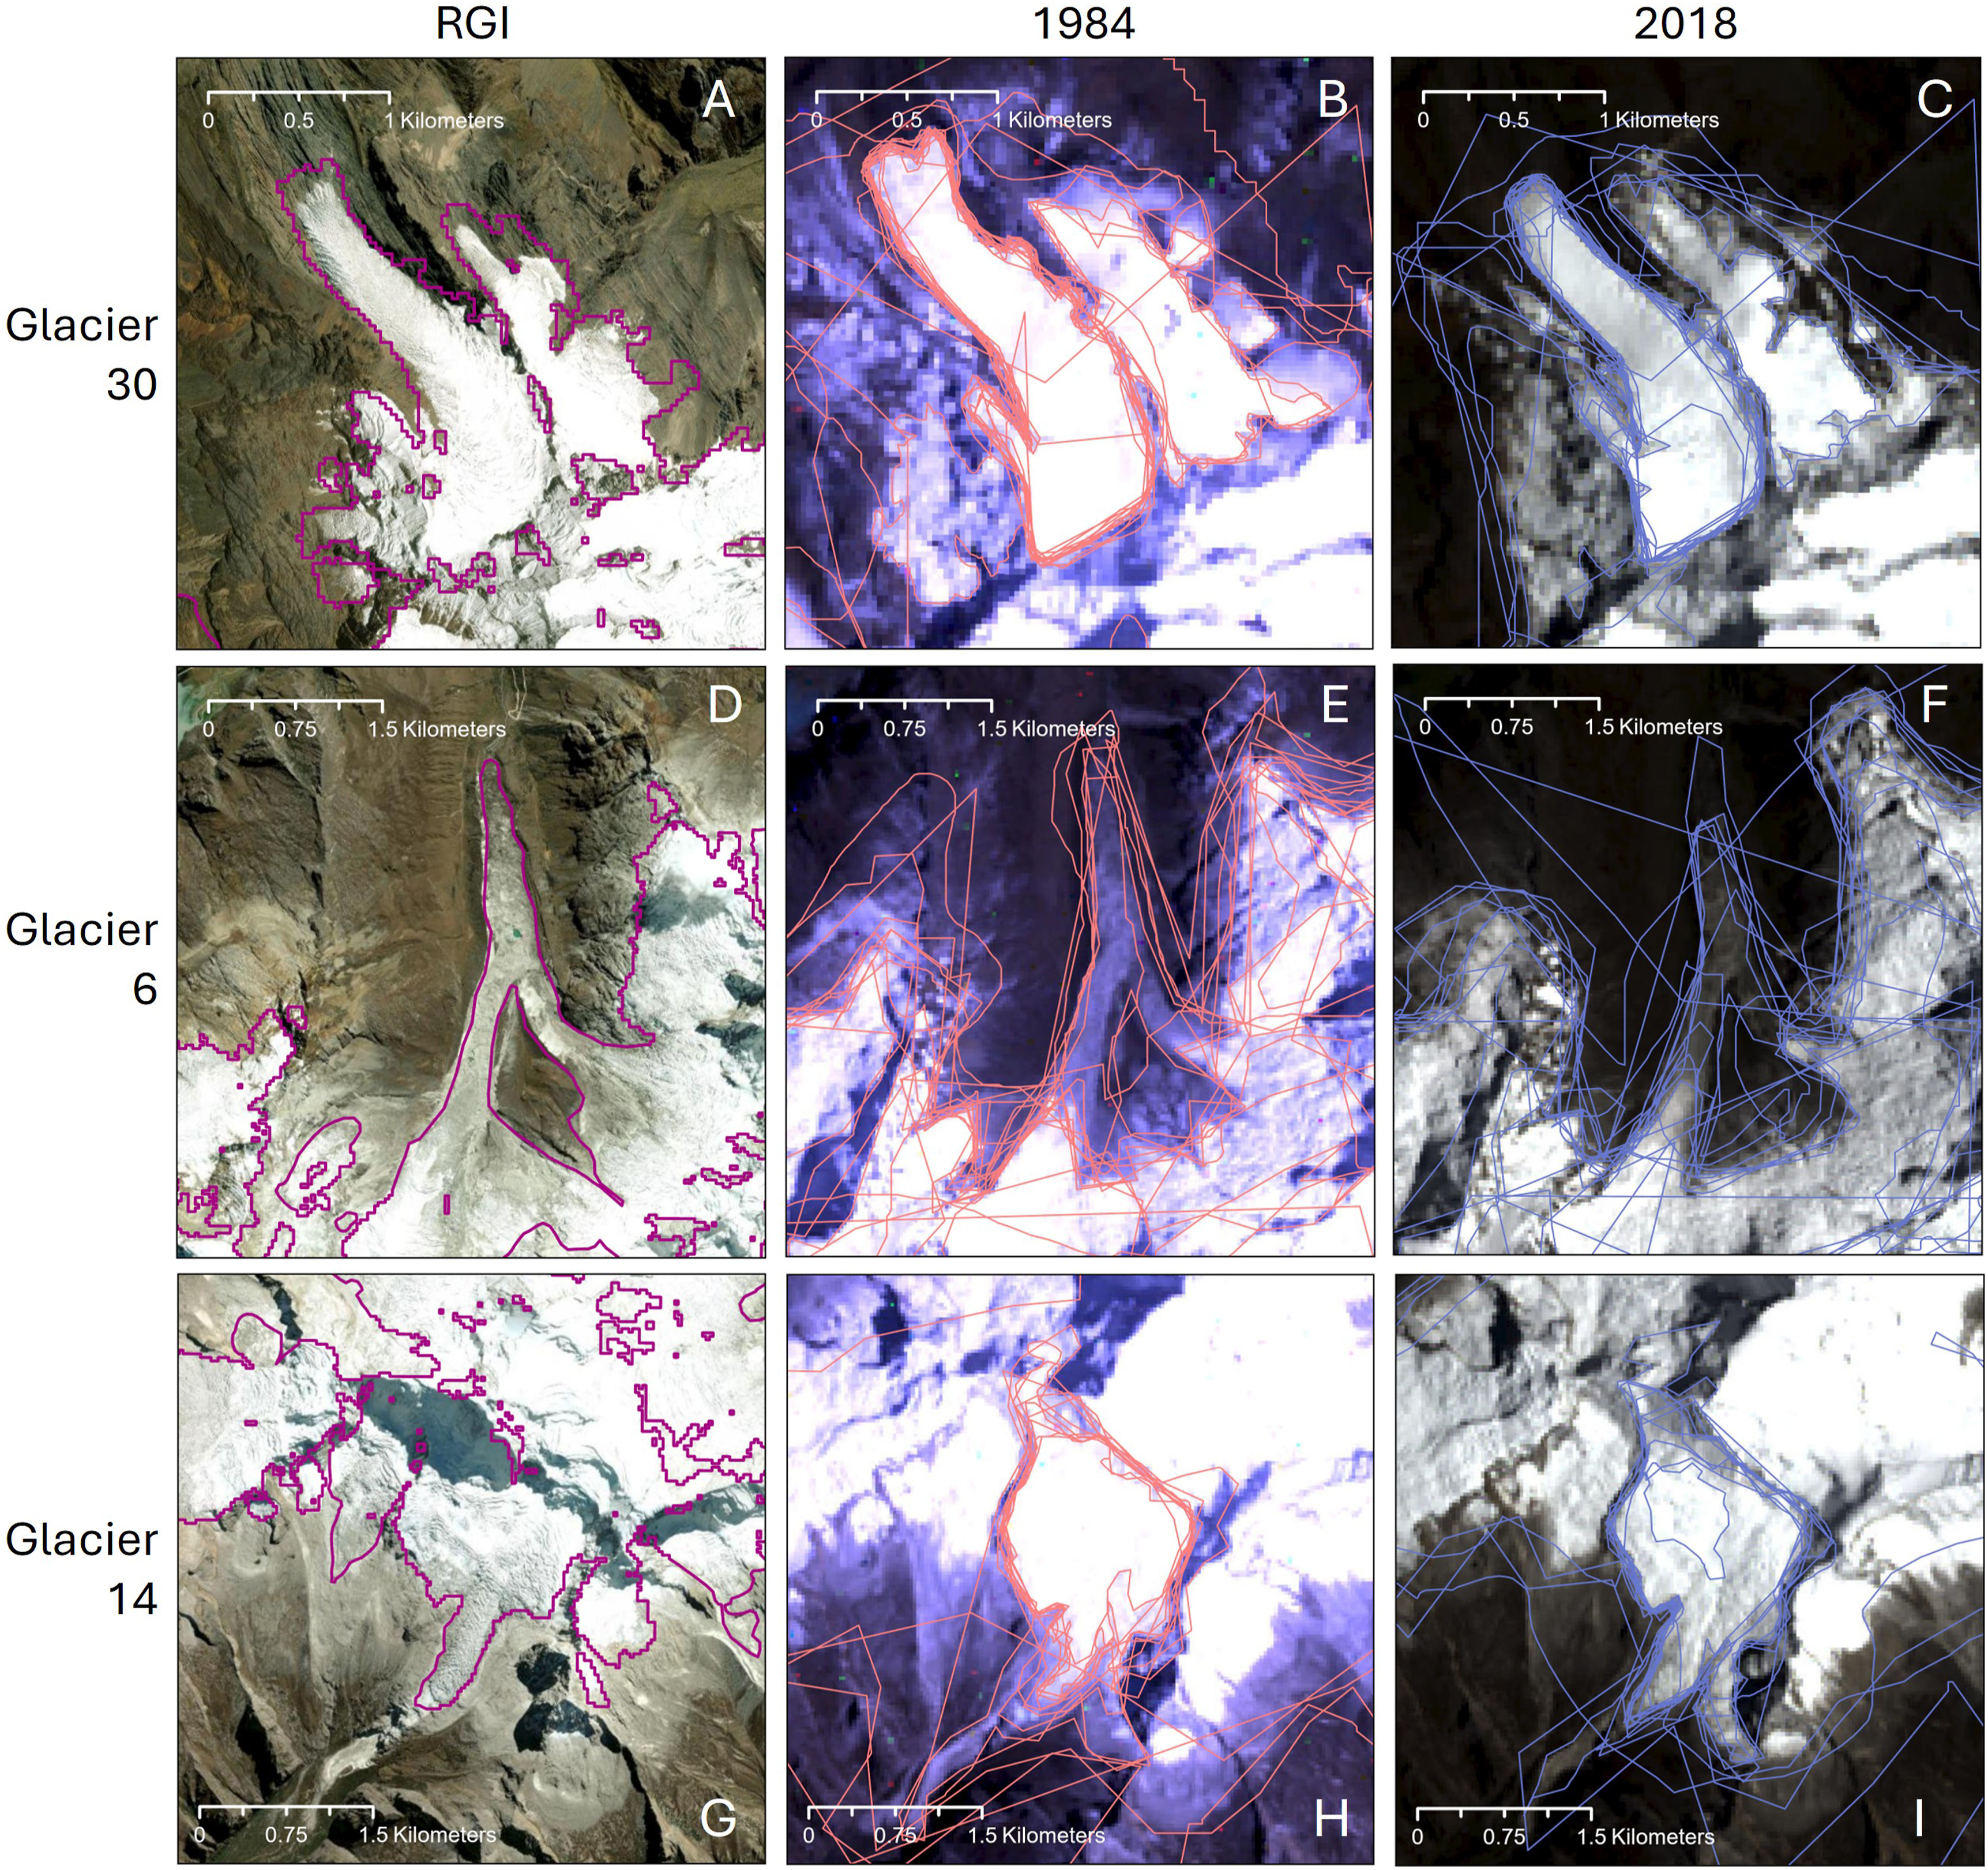
The limitations above notwithstanding, it is important to note that citizen science mapping efforts did not need to be ‘correct’ to enhance participant awareness or generate interest in the topic. Even accounting for error, in most cases mapping resulted in a visible change in glacier area. Combined with the provision of information on the impacts of environmental change, engagement of citizen scientists with tasks like GlacierMap can therefore provide participants with a deeper understanding of environmental processes and challenges, regardless of the value for data generation.
Value of citizen science for glaciological learning and outreach
While the value of the activity for generation of high-quality data was limited, particularly at the individual glacier scale, feedback from participants indicated clear value in engaging with GlacierMap in terms of enhancing understanding of the less-publicized impacts of glacier change and for climate literacy more broadly. The mapping activity was identified as a useful tool for teaching and geospatial skills development, with multiple secondary school teachers stating that they planned to use GlacierMap in class, and student participants noting that they felt they had contributed to research and that visualisation of glacier change helped to highlight the extent of glacier retreat. Providing information on the impacts of glacier retreat, changes to meltwater supplies, and downstream implications in the region was also identified as a valuable addition, with survey responses indicating that engagement with the task had led to knowledge generation around the scale and rate of glacier retreat, in addition to implications of climate and glacier change. This highlights the role of digital citizen science tools in bridging the divide between research and perceptions of the socio-environmental relevance of educational materials, particularly for young learners (Lüsse et al., 2022; Stuckey et al., 2013). The use of virtual resources such as GlacierMap thus provide opportunities to diversify the case studies and technologies used in teaching, while also acting as a vehicle for subject-specific training around spatial and climate literacy. We further discuss the learning benefits of GlacierMap in Clason et al. (2021).
Responses to participation were positive overall, however some suggestions for improvement related to a desire for participants to compare their efforts against those of others or outlines from an existing glacier inventory, allowing them to visualise how ‘well’ they did (n = 12). This ties into the idea of ‘gamification’ where participants try to beat either their own previous efforts or those of others. Gamification has been shown to be an effective incentivisation for participation in citizen science (Sajan and Sapkota, 2025), with studies indicating that gamified apps are often rated higher by users than those that are purely informative (Beck et al., 2019). There are now multiple examples of the use of gamification in citizen science activities (e.g. Strobl et al., 2019), including projects about the cryosphere such as the ‘Ice Flows’ game, which combines video game-style play with learning about polar ice sheet change (Ice Flows, 2025). Integration of gamification may also appeal to those participants who took part in but were less engaged with the GlacierMap task, submitting mapping contributions that were a scribble or contained only a handful of points. However, the length of time required for completion of the mapping task may also be at odds with the nature of gamification, where rewards are typically felt faster or after less effort.
Recommendations for future citizen science initiatives
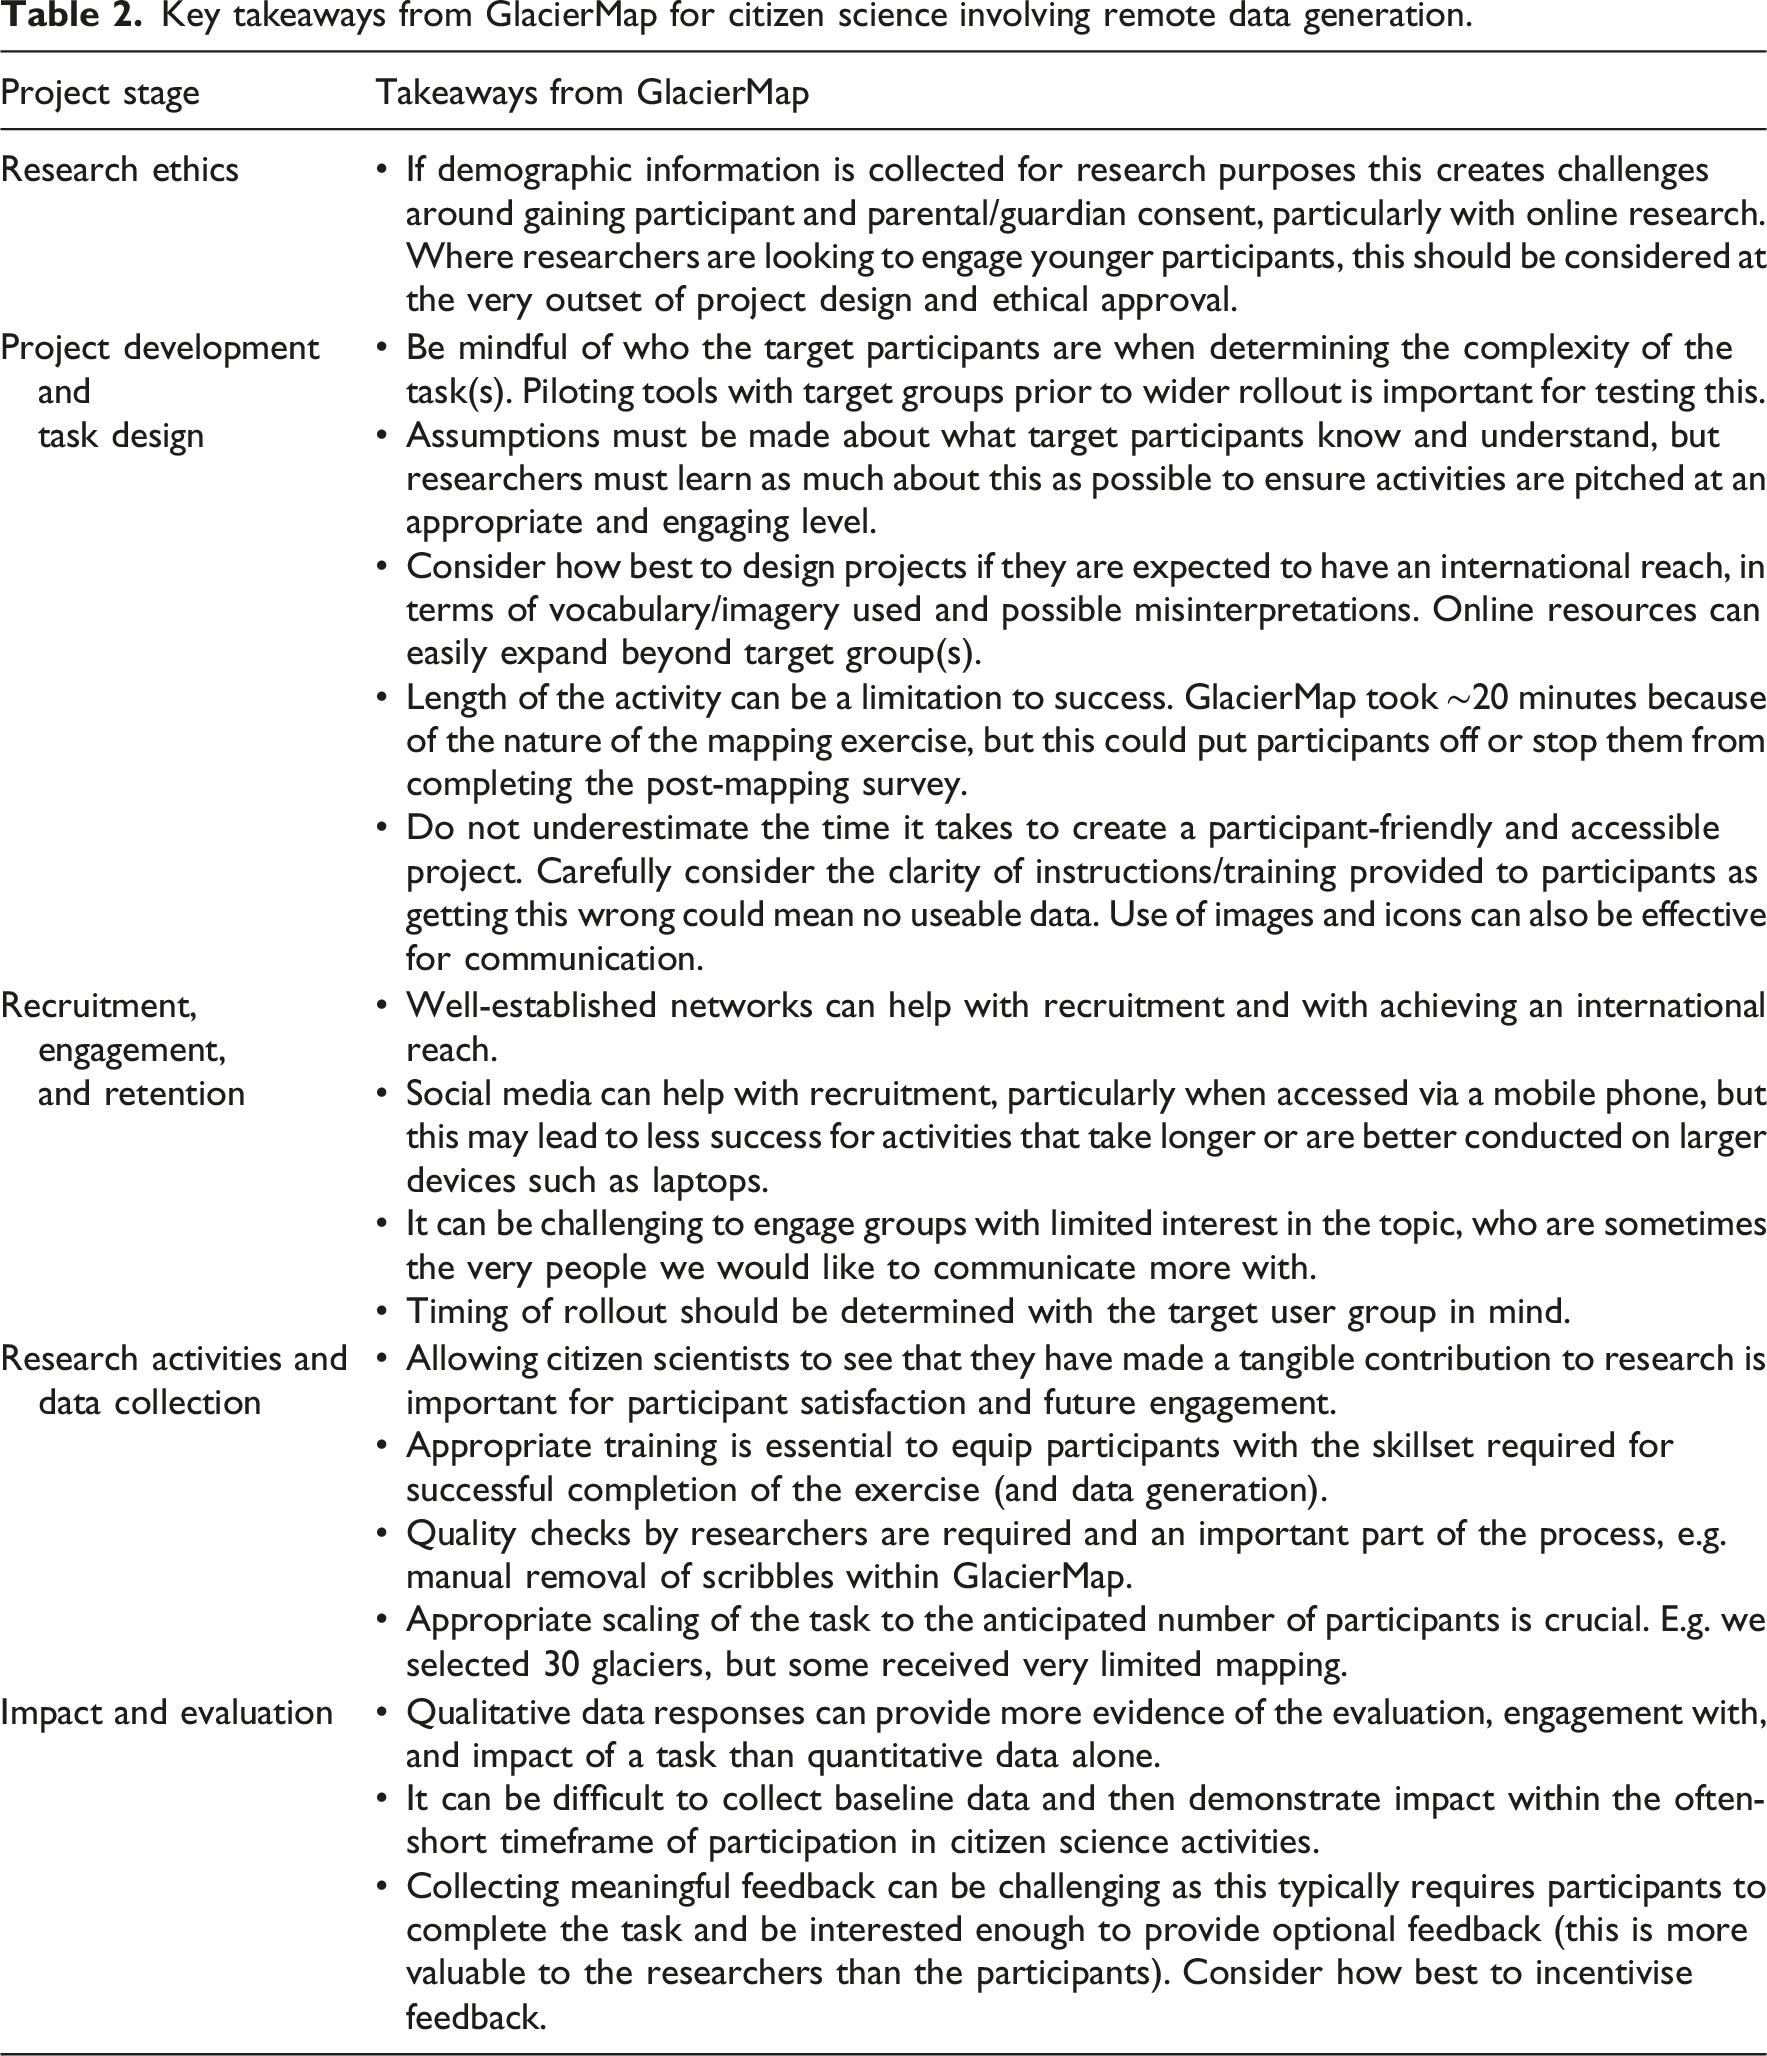
Key takeaways from GlacierMap for citizen science involving remote data generation.
We identify two key themes for consideration in the development of future geographical citizen science initiatives involving remote data generation: in-task engagement and participant inclusivity. While the majority of participants who started the mapping task within GlacierMap completed mapping for both years, most chose not to map additional glaciers, and feedback highlighted a desire for more training and indication of personal performance. Participants could practise mapping and compare their own glacier outlines for different time periods, encouraging interactive learning, but more could be done to demonstrate individual contribution to data generation. Indeed, allowing citizen scientists to see that they have made a tangible contribution to research is crucial to their experience. The most immersive collaboration between scientists and non-scientists is often through joint data analysis aimed at hypothesis testing and knowledge generation (Buytaert et al., 2014), so allowing users to formulate their own research questions and answer them through analysis (Newman et al., 2010) could also be a step forward in engagement, although trickier to design in the context of an online tool. Ensuring participants experience early success with a task, or can gauge their own progress, may also encourage more prolonged engagement with activities (Newman et al., 2010), highlighting the importance of equipping participants with enough information and training for successful completion. Gamification, as previously discussed, is one way to assess personal performance, however explicit comparison of participant contributions with the ‘right answer’ – in this case RGI glacier outlines – would also provide a simple way to facilitate this while focussing on data generation and exposure to GIS.
GlacierMap was designed as an English-language platform targeted primarily at students in the UK due to the scope of project funding; however, we had considerable interest and engagement from participants in other countries, including Peru, where we received enquiries from local teachers about creation of a Spanish version of the tool. Where international reach is a key goal of citizen science initiatives, securing funding of appropriate time and financial scope is a challenge that should be considered carefully, and had we the resources available we would have prioritised creation of a version tailored to Peruvian participants. In addition to considering how digital citizen science initiatives can be made more inclusive in terms of language, digital poverty should also be an important consideration in project conceptualisation, particularly where target participant groups affect or are affected by the environmental processes being studied. In cases such as this, in-person engagement that makes digital tools accessible should be an integral part of the research design. For example, the ‘Nuestro Rio’ project, which used a mobile phone app to assess local perceptions of water quality in Peru’s Rio Santa catchment, involved both fully remote participation and local field visits to areas where smart devices and/or internet access were limited (Rangecroft et al., 2023, 2024). Despite the challenges inherent in the design and implementation of citizen science projects, the development of novel technologies such as GlacierMap nevertheless offer important opportunities for engaging young learners in the current climate and nature crises, and enhancing the scientific literacy crucial for future contribution to democratic societal decision-making (Yacoubain, 2018).
Conclusions
Analysis of participant contributions to and feedback on GlacierMap has identified both challenges and opportunities for the application of citizen science for glacier monitoring and education. While many of the crowd-sourced outlines were a good fit to those for the RGI, a combination of complex topography and land cover in the region, and the moderate resolution of the satellite imagery, led to inaccuracies and considerable variability in mapped glacier extent for experts and novice glaciologists alike. Our results nevertheless demonstrate how digital, mapping-based tools can strengthen engagement between the geographical research and educational communities. Although individual glacier outlines varied in accuracy, the directionality of glacier change was usually correct, supporting the value of GlacierMap as a vehicle for the development of spatial and climate literacy. Participant feedback also indicated that the interactive nature of the tool, the opportunity to visualise glacier retreat, and the integration of contextual information about downstream impacts all contributed to deeper conceptual understanding of environmental change. Importantly, GlacierMap proved particularly effective for engagement with students: more than half of participants learnt about the tool through teachers, while educators highlighted its usefulness for teaching of glaciated landscapes, hydrological processes, and climate change impacts, with some noting intentions to adopt it in classroom settings. By demonstrating both the pedagogical value of experiential, map-based inquiry and the feasibility of integrating satellite data interpretation into school curricula, this work shows how citizen science platforms may help to foster earlier and more meaningful connections between physical geography research and young learners.
Supplemental material
Supplemental material – Crowd-sourced glacier mapping as a tool for enhancing climate literacy and data generation
Supplemental material for Crowd-sourced glacier mapping as a tool for enhancing climate literacy and data generation by Caroline Clason, Sally Rangecroft, Shaun Lewin, Gina Kallis, Tom Mullier, Will Blake, Iain Stewart in Progress in Physical Geography: Earth and Environment.
Footnotes
Acknowledgements
We thank the individuals and networks who helped us to reach potential participants, including the Geographical Association, the Royal Scottish Geographical Society, and the Scottish Association of Geography Teachers. We also thank the Editor and reviewers for their comments which helped to improve our paper. Most importantly, we thank everyone who contributed to mapping glaciers within GlacierMap. GlacierMap is freely available for use at ![]() .
.
Ethical considerations
This project received ethical approval from the University of Plymouth in 2020. Due to the participatory nature of the work and the collection of demographic data, appropriate ethical considerations were taken into account to ensure the protection of both participants and researchers. In line with University of Plymouth ethics guidance, GlacierMap could only be completed by participants aged 16 years or above. The landing page for GlacierMap also provided details about the project, how data would be used and stored, and how long participation in the activity would take, which is standard practice for research data collection with participants. All data was collected anonymously and stored securely in line with the University of Plymouth’s research data policy.
Consent to participate
Informed consent and confirmation that participants were aged 16 or above was a compulsory first step of participation in GlacierMap. Participants were also informed that they could withdraw from the study if they wished.
Author contributions
CC and SR devised the GlacierMap project and secured funding, SL and TM developed the online app, and GK and SR designed the surveys. CC, SR, SL, and GK analysed the data collected by GlacierMap, and all authors contributed to the production of this manuscript.
Funding
The authors disclose receipt of the following financial support for the research presented in this article: this work was supported by the Biotechnology and Biological Sciences Research Council (grant number BB/T018690/1 awarded to CC).
Declaration of conflicting interests
The authors declared no potential conflicts of interest with respect to the research, authorship, and/or publication of this article.
Data Availability Statement
Mapped glacier area data are available within the supplementary materials and glacier polygon data can be provided upon request.
Supplemental material
Supplemental material for this article is available online.
References
Supplementary Material
Please find the following supplemental material available below.
For Open Access articles published under a Creative Commons License, all supplemental material carries the same license as the article it is associated with.
For non-Open Access articles published, all supplemental material carries a non-exclusive license, and permission requests for re-use of supplemental material or any part of supplemental material shall be sent directly to the copyright owner as specified in the copyright notice associated with the article.