
Abstract
Power systems of today are highly complex and highly interconnected. It generates electricity by burning fossil fuels (coal, natural gas, diesel, nuclear fuel, etc.), which produces harmful gases and particles, pollutes environment, and degrades lives. To mitigate the bad impact of burning fossil fuels and meet the increase in electrical system, demand distributed energy sources employing nonconventional energy sources like wind and solar are used. Electric power generation through the nonconventional energy sources has become more viable and cheaper than the fossil fuel–based power plants. This article explores the development of a microgrid model incorporating wind turbine generators, diesel generator, fuel cells, aqua electrolyzers, and battery energy storage systems. An optimization scheme for fixing the proportional–integral controller parameters of frequency regulation is developed for different possible combinations of wind power with other distributed energy resources in the microgrid.
Introduction
Around the world, conventional power systems are facing problems of gradual depletion of fossil fuel resources, poor energy efficiency, and environmental pollution which have led to a new trend of generating power locally at distribution voltage level with the help of renewable energy resources (Chowdhury et al., 2009). As today’s society has become totally dependent on the technological services with sophistication, there exists an increased demand for more reliable power and more robust power delivery structure, which put a lot of pressure on the traditional power system. The power system reliability as well as the service differentiations can be improved by way of integrating large number of small distributed energy resource (DER) units (Driesen and Katiraei, 2008) as needed by the customers.
As DERs are having low energy density and are dependent on the climatic conditions of a region, they are of smaller capacity. Since they are located closer to the load centers, the transmission and distribution losses are minimized. The micro-sources like wind, photovoltaic (PV), hydro and fuel cell (FC) emerge as alternatives for power generation which provide pollution-free green energy. A DER can be connected directly to the distribution network or can be interconnected to form microgrid (MG), as the power generated from renewable/non-conventional energy resources are at distribution voltage level (Chowdhury et al., 2009; Driesen and Katiraei, 2008). DERs can be used to perceive the benefits like increased energy efficiency, reduced carbon emission, and improved power quality and reliability (PQR) (Hatziargyriou et al., 2007).
Due to the developments in the power electronics technology, the performance and efficiency of distributed generation has been significantly improved. Employment of inverter interfaced distributed generation in power systems mitigates the peak load and improves the power quality (Mohamed and El-Saadany, 2008; Nikkhajoei and Lasseter, 2009; Wei Li and He, 2014).
An MG can be defined as a group of loads, diesel generator (DG) units, and energy storage systems (ESS) operated in coordination to supply power connected to the power system at the distribution level at a single point of connection called the point of common coupling (PCC) (Bacha et al., 2015; Lasseter, 2002). In MGs, there are two possible modes of operation: one is the grid-connected mode and the other is islanded mode or the autonomous mode. In general, MGs are operated in grid-connected mode; but it is designed in such a way that they have sufficient power generation capacity, control, and operational strategy to supply power at least a part of the load even after the disconnection from the utility grid and hence the MG remains in isolated mode of operation.
The operation of MGs can be controlled with the help of controllers like micro-source controllers (MC) and a central controller (CC). Based on the type of DER units, their level of dissemination, characteristics of load connected, and power quality constraint, the control and operation of MG is different from that of traditional power generation systems (Katiraei et al., 2008; Lasseter, 2002; Peças Lopes et al., 2006). In grid-connected mode, most of the system-level dynamics are dictated by the utility due to the relatively small size of micro-sources. In stand-alone mode, the system dynamics are dictated by micro-sources themselves, their power regulation control and, to an unusual degree, by the network itself (Pogaku et al., 2007). From the grid point of view, the advantage of an MG is that it is acting as a controlled entity, that is, as an aggregated load within the power system. From customers’ point of view, advantage of MG is that, it supplies uninterruptible power to meet the local electrical/heat requirements, increases reliability, minimizes the losses, and offers good voltage support. From ecological point of view, advantage of MGs is that use of low-carbon technology reduces the pollution of environment and hence global warming. In grid-connected mode of operation, the micro-sources are controlled in order to inject the demanded power into the network and the MG should ensure a smooth changeover from grid-connected to islanded mode or vice versa depending on the grid conditions. While working in stand-alone mode, sources are controlled so that all the local loads are fed by micro-sources themselves, maintaining the required voltage and frequency within the allowed limits (Luo et al., 2013; Pogaku et al., 2007).
There are different control strategies for a voltage source inverter (VSI)-based MG system to inject clean sinusoidal voltage and current to the power system even in the presence of non-linear loads or grid voltage distortions (Palizban and Kauhaniemi, 2015). Different micro-sources, storage devices, and concept of MG along with operation of MG and recent researches that are taking place related to MG and the role of MG in the environment have been reviewed and discussed (Jiayi et al., 2008; Ustun et al., 2011; Zamora and Srivastava, 2010). Basak et al. (2012) have discussed and reviewed about the integration of DERs, operation, control, power quality issues, and stability of MG system to implement MG successfully in real power scenario. Vandoorn et al. (2013) have presented an overview of different control strategies for grid forming converters in islanded MGs. The behavior of the inverter in an MG system under different operating scenarios like failure of utility power, variation of frequency, harmonic currents on the inverter side, and fault currents in the grid-connected and islanded mode have been studied and demonstrated (Cornforth et al., 2011). With the help of the study, the authors have concluded that intelligent controllers are needed for inverters in an MG system in order to provide reactive power control, voltage support, and to eliminate the harmonics. Different control structures for the distributed power generation systems (DPGS) based on micro-sources have been discussed focusing on harmonic compensation in Blaabjerg et al. (2006). Also the authors have addressed different control strategies that can be implemented under unbalanced grid fault conditions.
A coordinated scheme for generating active power is devised between the battery energy storage system (BESS) and a smart load (SL) for an MG comprising of wind turbine generator (WTG) and a small hydro power plant (Serban and Marinescu, 2011). As the renewable energy sources like wind and PV are varying in nature, the frequency control is complicated. This leads to the integration of DG, FC, BESS, and flywheel (FW) like sources in the MG. The authors suggest an intelligent approach for proportional–integral (PI) controller tuned using fuzzy logic and particle swarm optimization (PSO) algorithm equipped for DG and FC controls the frequency deviation effectively (Bevrani et al., 2012). In autonomous mode, where MG consists of WTG and DG, the load frequency control can be provided using BESS, super capacitor, and superconducting magnetic energy storage like energy sources. For DG, the PI controllers are optimized using genetic algorithm (GA) (Supriyadi and Nandar, 2013). PI controllers found using H∞ and μ-Synthesis method are employed for an MG consisting of WTG, PV, DG, microturbine (MT), FC, BESS, and FW (Bevrani et al., 2016).
A power management strategy is devised for an MG to account for changes in power delivered by the wind generator using BESS and settle down frequency deviations within the limit (Li et al., 2016). A control strategy for load shedding scheme is suggested for an MG consisting of distributed sources like WTG, MT, PV, and BESS when there is an imbalance between generation and system demand (Marzband et al., 2016). To control the frequency deviations in an MG comprising of WTG, PV, DG, BESS, and FW, PI controller is used which is self tuned using human brain learning algorithm (Khalghani et al., 2016).
When an MG is connected to the utility grid, the frequency control issues of the system are taken care mainly by the utility grid. However, in the stand-alone mode, the frequency control of the MG becomes much more critical and this article explores the development of MG model for frequency control for an MG operating in the autonomous mode.
Modeling of the hybrid MG for frequency stabilization
The configuration of the hybrid system comprising the following energy sources—(1) wind, (2) diesel, (3) aqua electrolyzer (AE), (4) FC, and (5) BESS—is shown in Figure 1. A part of WTG output is absorbed by the AE to generate hydrogen which is used as fuel for the FC. The total power supplied to the load Ps is given by

where PWTG, PDG, PFC, and PAE are the output power of WTG, DG, and FC and input power to the AE, respectively.
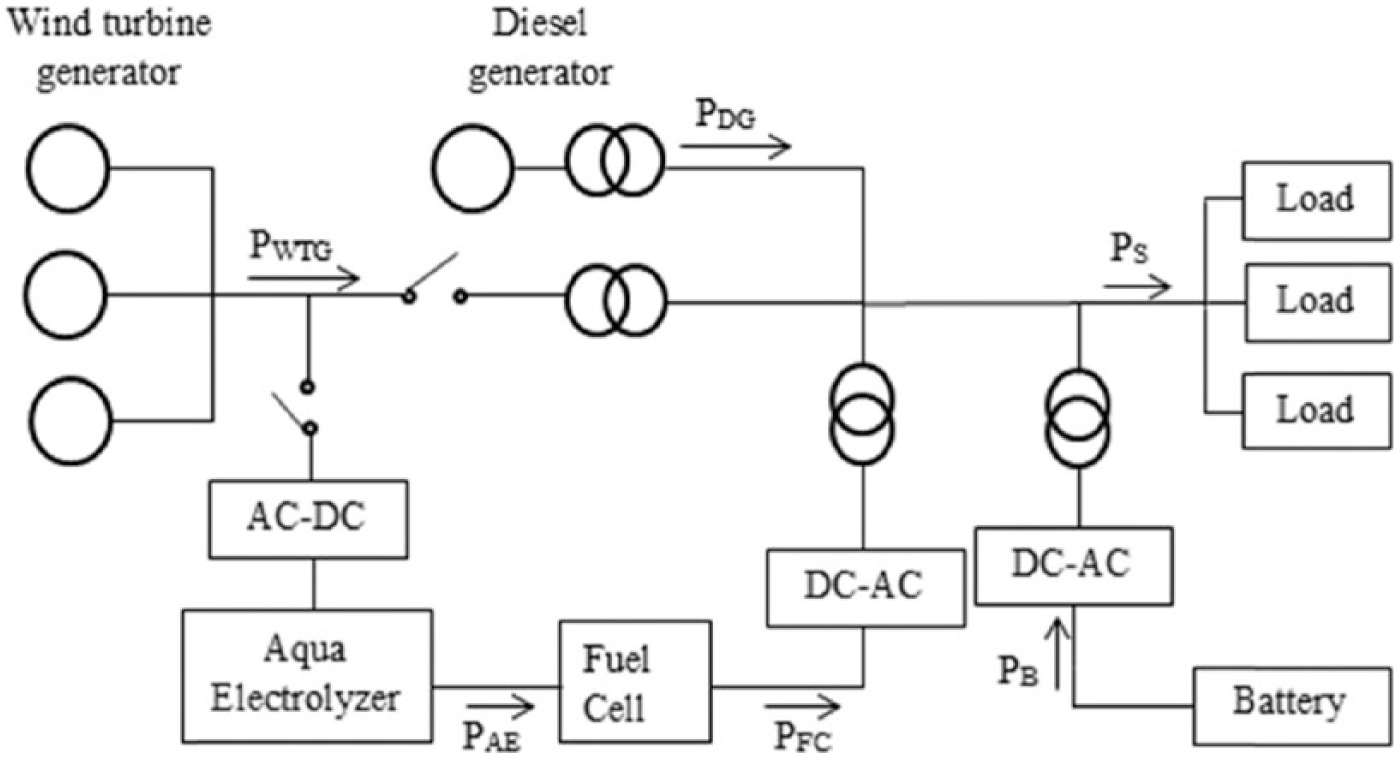
System configuration.
System modeling
The wind speed varies with time. Usually, the total wind speed is the algebraic sum of base wind speed, gust wind speed, ramp wind speed, and noise wind speed. In this article, the wind speed data collected from the meteorology department have been utilized for simulation purposes. The mechanical power of wind turbine is given by

where ρ (=1.25 kg/m3) is the air density and Ar (=1735 m2) is the swept area of blades (Lee and Wang, 2008).
Transfer functions of generating systems
The transfer function of the MG system comprising WTG, DG, AE, FC, and BESS are represented by the first-order lag (Senjyu et al., 2005), and it is shown in Figure 2


where TWTG, TDG, TAE, TFC, and TB are the time constants of WTGs, DGs, AEs, FCs, and batteries, respectively. The time constants of TWTG, TDG, TAE, TFC, and TB are 1.5, 2.0, 0.2, 4.0, and 0.1 s, respectively.
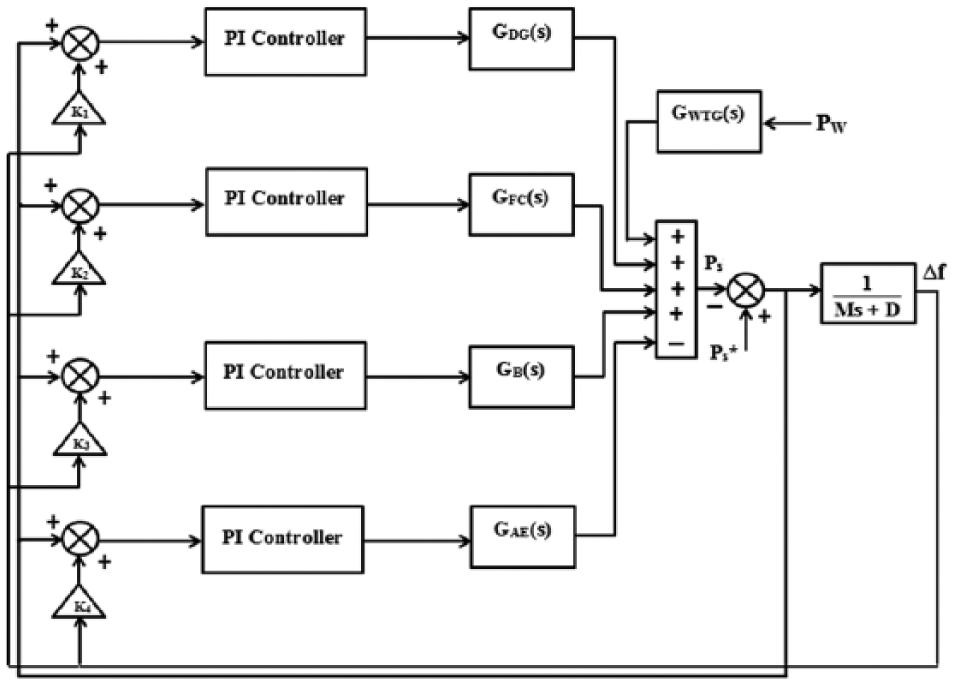
Block diagram of hybrid microgrid.
Power deviation and frequency deviation
To meet the required load demand

As load demand varies, there is a deviation in the system frequency (Δf) and denoted as

where Ksys is the system frequency characteristic constant. Time delay exists between system frequency variation and power variation and the transfer function is expressed as

where D and M are inertia constant and damping constant, respectively. The values of K1, K2, K3, and K4 are found using Ziegler–Nichols method (Mallesham et al., 2011).
PI controller design
The simulation has been carried out in the MATLAB/Simulink. To get the optimized values of PI controllers using SDO (Simulink Design and Optimization) toolbox, the following steps have to be followed:
Select the signal constraint block from the SDO toolbox and drag it to the Simulink model where the parameters have to be tuned.
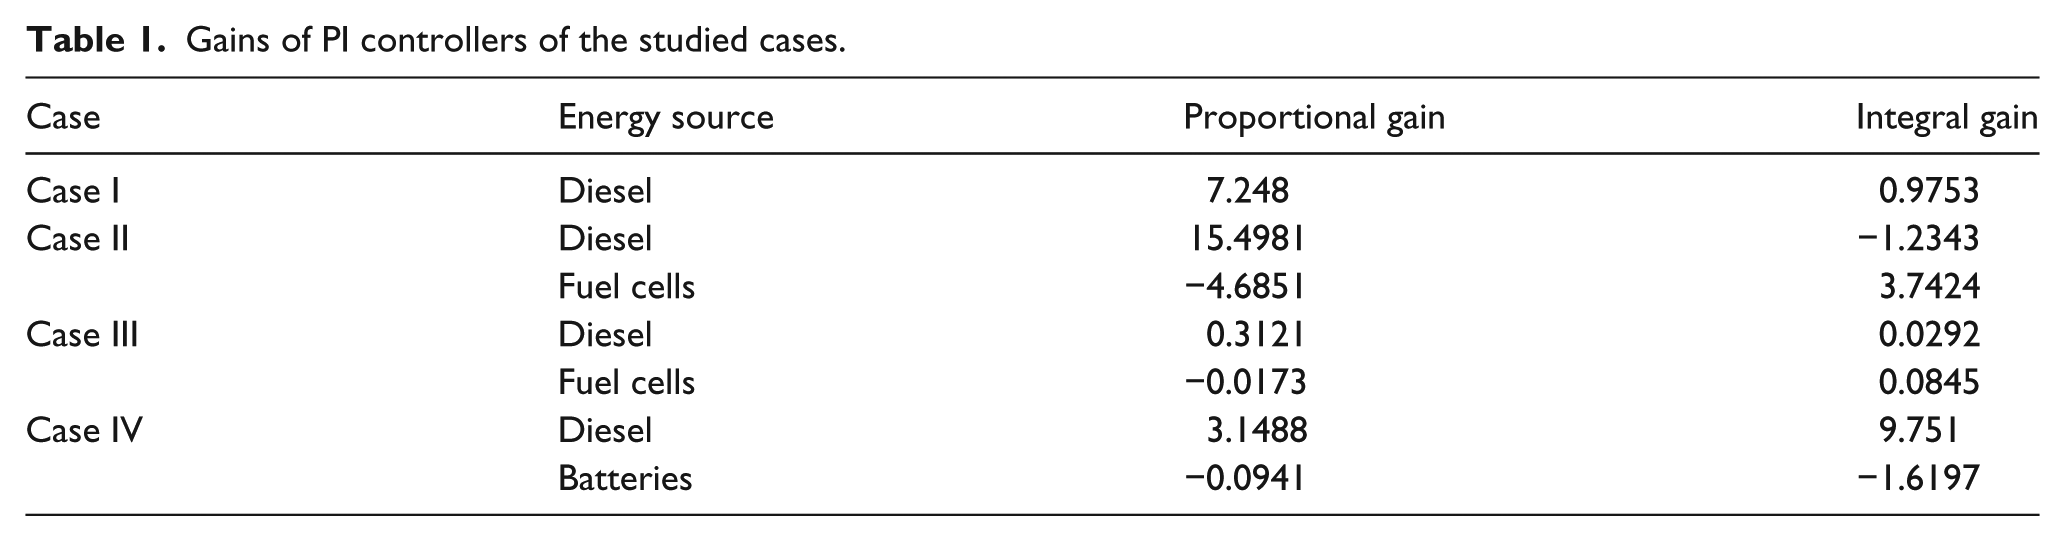
In the goals, the desired response has been set and the parameters are tuned until the desired response has been attained. The Simplex Search method is opted for optimization. The optimized values of the PI controllers obtained through SDO toolbox are given in Table 1. In Table 2, the peak overshoot and settling time for four cases are tabulated. The system parameters are taken from Lee and Wang (2008) and Senjyu et al. (2005). The SDO toolbox has the provision to specify the desired time response after a perturbation in the MG system. The optimized values of the PI controllers are obtained from the specified parameters for the time response such as initial value, rise time, settling time, and peak overshoot. The simulation parameters used are given in Appendix 1.
Gains of PI controllers of the studied cases.
Time response specifications.

Simulation results
In this section, performance of WTG, DG, FC, AE, and BESS have been analyzed. For four studied cases, wind velocity Vw data have been taken from the meteorology department and load demand
Case I
In case I, WTG and DG alone are employed to meet the system demand in the stand-alone MG. The net power generation is expressed as

Figure 3(a) shows the output power of WTG, Figure 3(b) shows the output power of DG, and Figure 3(c) shows the frequency deviation ∆f. As the output power of WTG is not enough to supply the system demand, DG starts to generate the power. The system frequency is oscillatory which shows that the total amount of generation is not adequate to meet the MG demand.
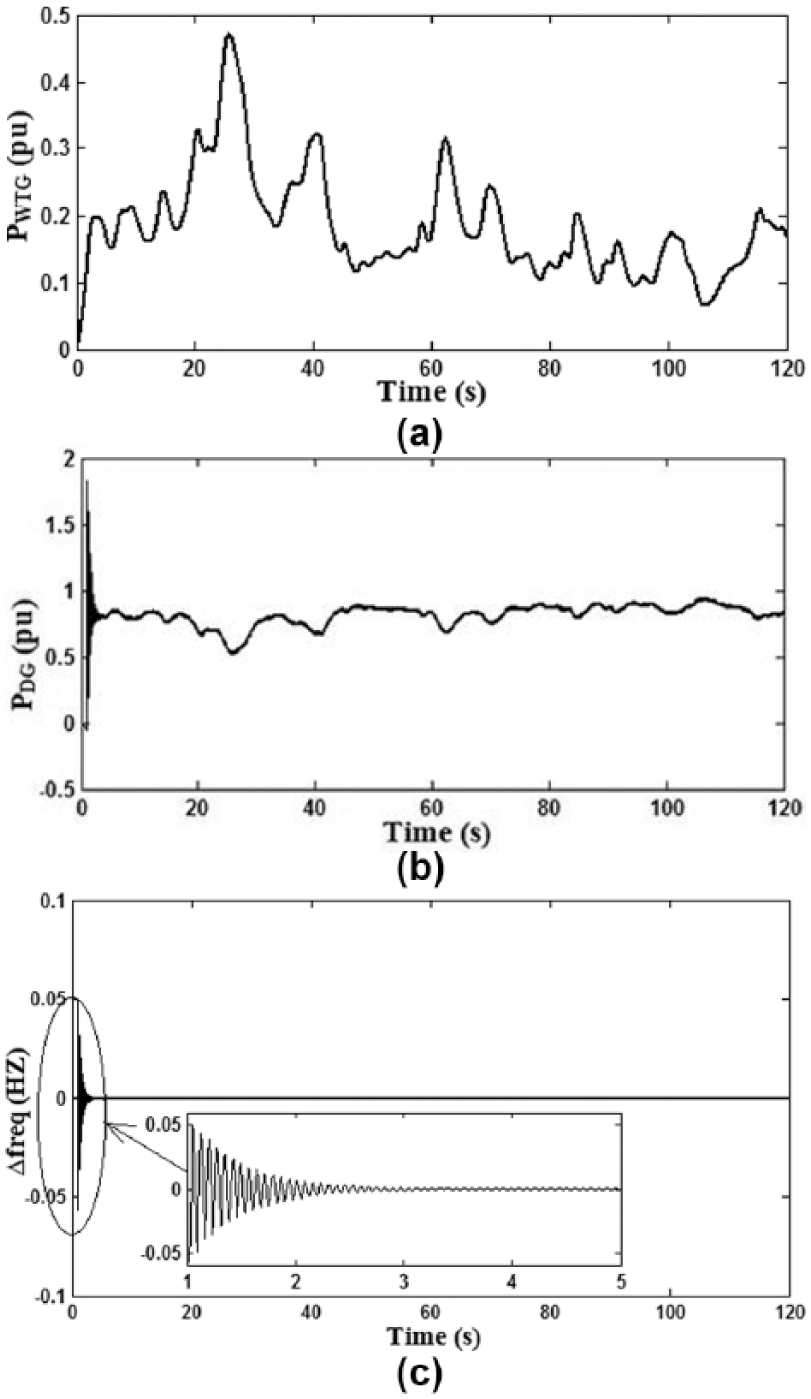
Case I (a) power output of wind turbine generator, (b) power output of diesel generator, and (c) frequency deviation of the microgrid.
Case II
Simulation results for case II incorporate WTG, DG, FC, and AE. Some part of WTG power is sent as input to the AE to produce hydrogen gas which is the fuel source for the FC. The net power generation is expressed as

The simulation results for case II are presented down. Figure 4(a) shows the variations in generating power of the WTG, Figure 4(b) shows the variations in generating power of the DG, Figure 4(c) shows the output power variations of AE, Figure 4(d) shows the output power variations of AE, and Figure 4(e) shows the frequency deviation. Some part of the output power of WTG is absorbed by the AEs. The remaining power is used to balance the real power demand. The total energy so produced by all the energy sources is adequate to supply the demand. Hence, the system frequency deviation is stabilized even with variations in wind speed compared to case I. The system experiences a peak overshoot of −0.03 Hz and settles down within 1.5 s.
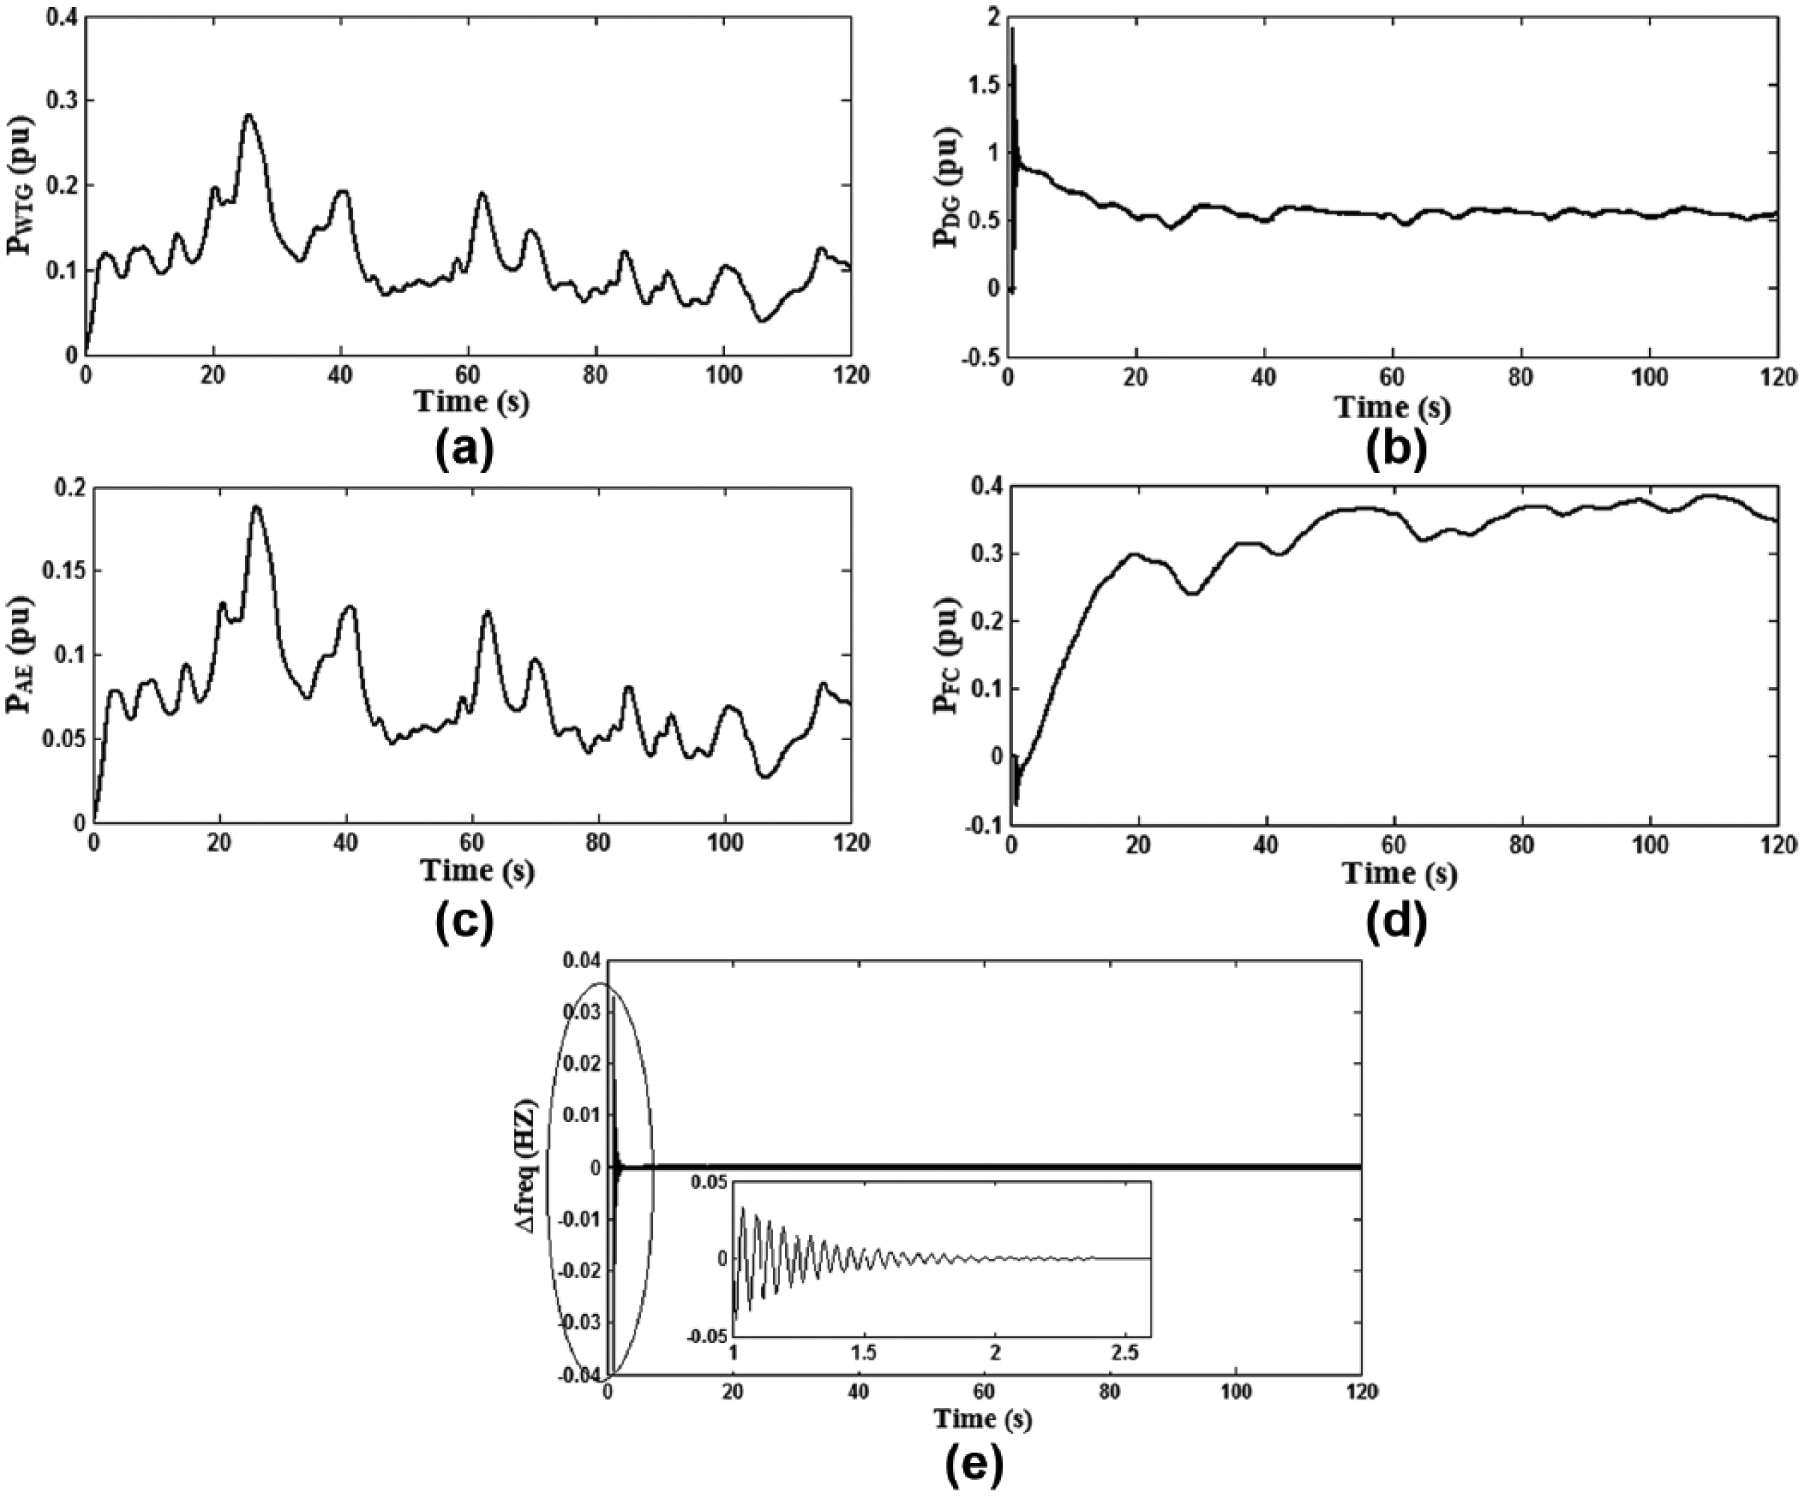
Case II (a) power output of wind turbine generator, (b) power output of diesel generator, (c) power output of aqua electrolyzer, (d) power output of fuel cell, and (e) frequency deviation of the microgrid.
Case III
WTG, DG, FC, and AE are utilized to meet the demand. In this case, the total output power generated by the WTG is sent as input to the AE to produce hydrogen to feed FC. The net power generation is expressed as

Figure 5(a) shows the variations in generating power of WTG, Figure 5(b) shows the variations in generating power of the DG, Figure 5(c) shows the output power variations of AE, Figure 5(d) shows the output power variations of AE, and Figure 5(e) shows the frequency deviation. With the variation in the wind energy, the energy so produced by the DG and FC are not enough. Therefore, the system frequency becomes oscillatory. This is due to the full consumption of power by AE from WTG.
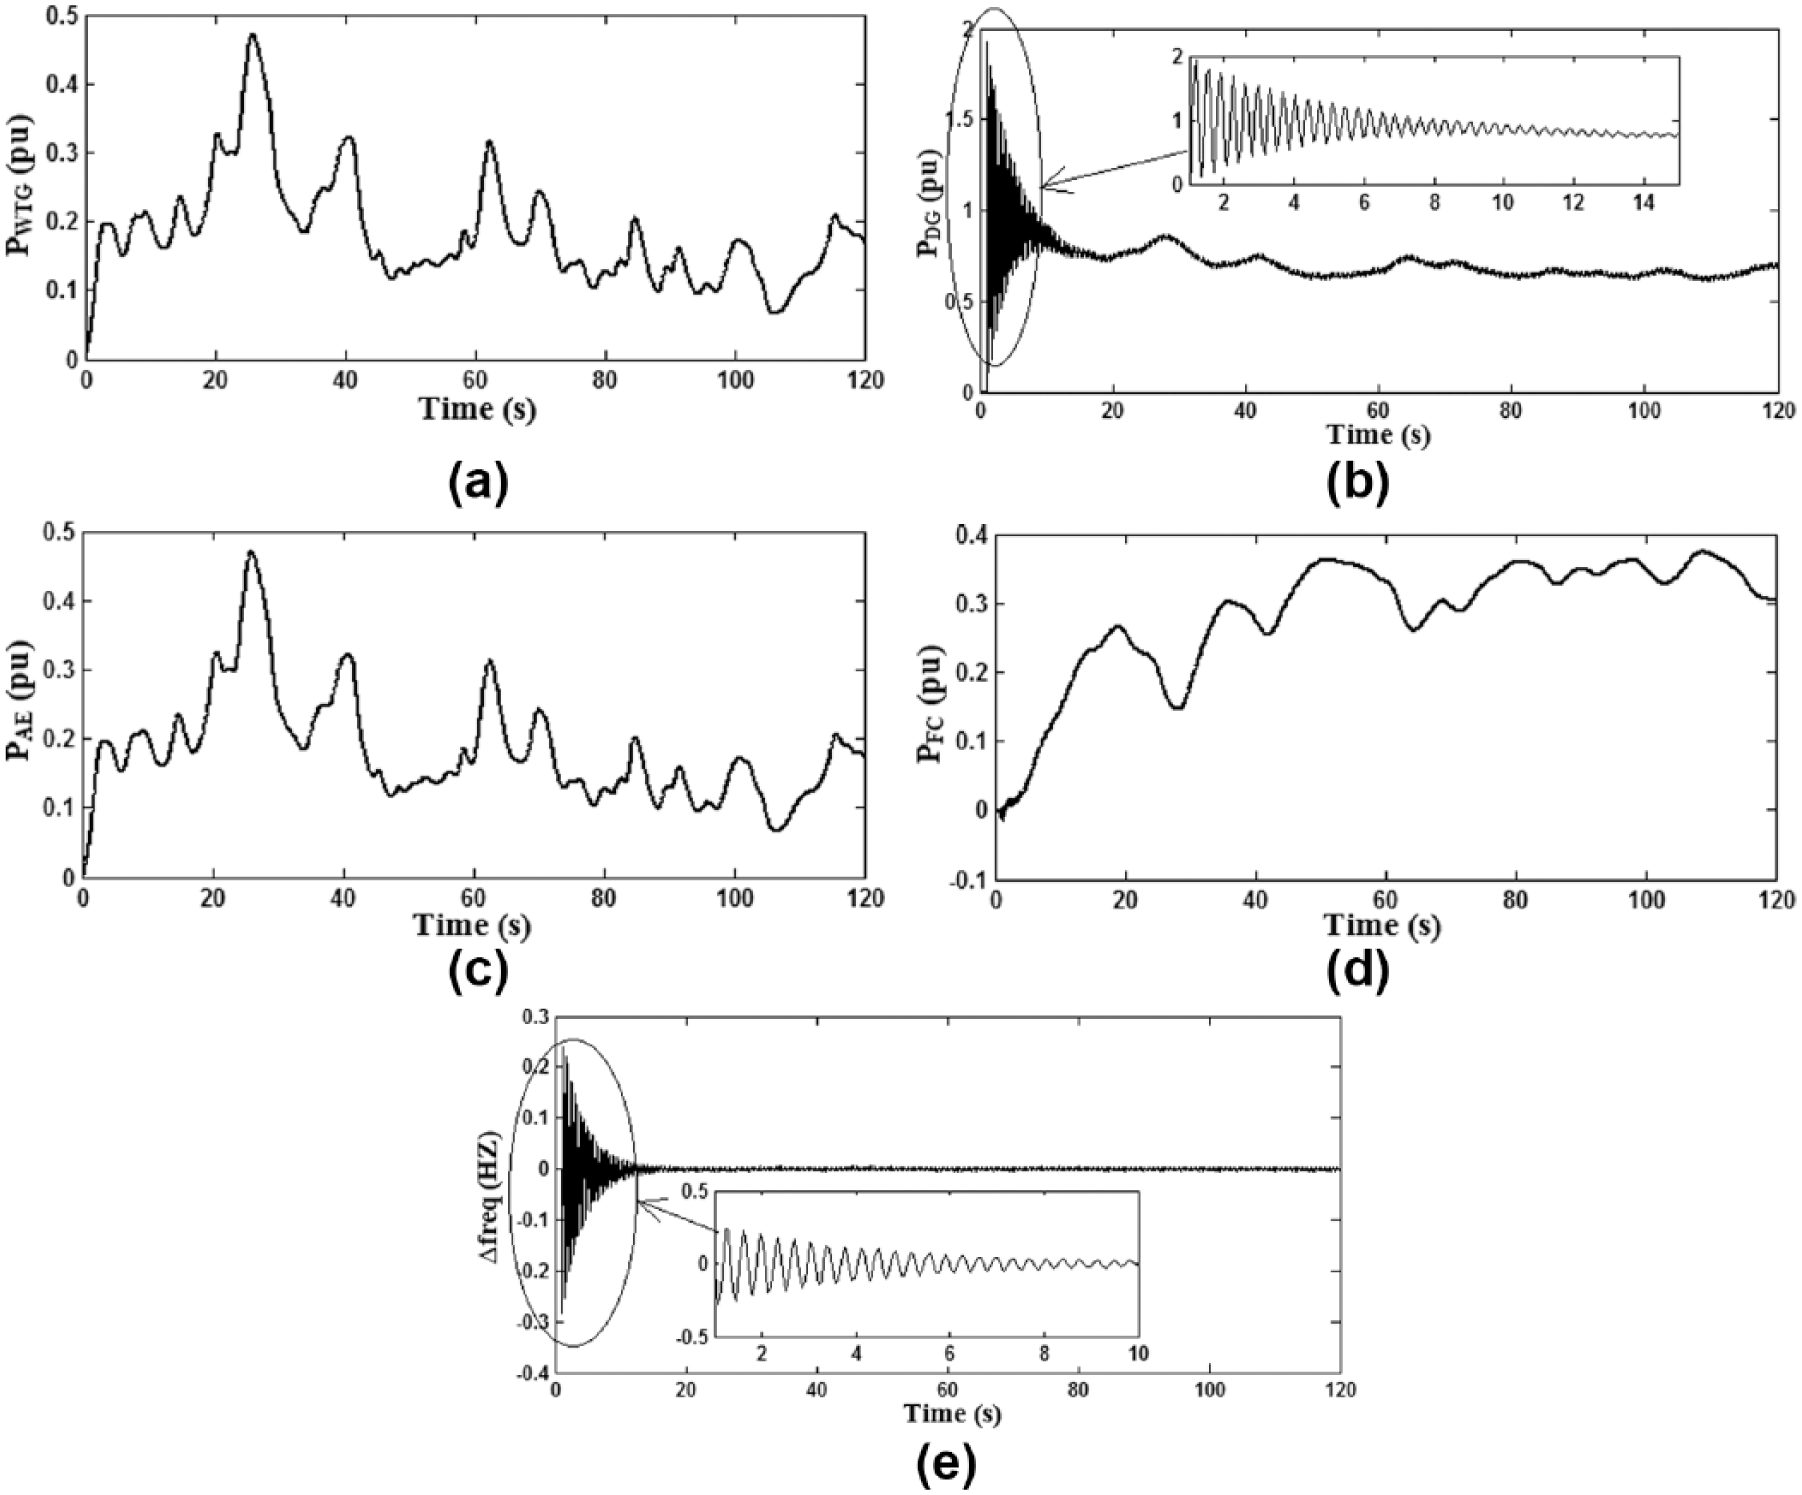
Case III (a) power output of wind turbine generator, (b) power output of diesel generator, (c) power output of aqua electrolyzer, (d) power output of fuel cell, and (e) frequency deviation of the microgrid.
Case IV
This case uses WTG, DG, and BESS. In case of surplus generation from the WTGs, its output is utilized to charge the battery storage systems. If wind generation is inadequate, then the battery storage systems participate to deliver the required real power output to meet the system demand. The net power balance equation for this case is given as

Figure 6(a) shows the variations in generating power of WTG, Figure 6(b) shows the variations in generating power of the DG, Figure 6(c) shows the generating power of BESS, and Figure 6(d) displays the system frequency deviation ∆f. BESS discharges when power shortages occur and charges when power is surplus. Although the wind power fluctuates, DG and BESS supply the adequate power demand.

Case IV (a) power output of wind turbine generators, (b) power output of diesel generator, (c) power output of BESS, and (d) frequency deviation of the microgrid.
Discussion
Case 1 study utilized wind and diesel energy sources alone for meeting the system demand. With the fluctuation in the wind energy, the DGs produce power to meet the demand. The total generating power is not adequate to supply the required demand. Hence, the system frequency has slight deviation. In case 2, system uses FCs in addition to the existing wind and diesel energy sources, which stabilizes the system frequency deviations much effectively. Since a portion of the WTGs output is given to the AE for hydrogen generation and the remaining output is used to balance the real power demand, the supply demand error is comparatively less than the other cases and the frequency oscillations are stabilized. In case 3, the total wind energy output is utilized for the electrolysis process by the AE to generate hydrogen and the total energy generated by all sources is not adequate to meet the system demand. This results in system frequency oscillations. In case 4 of the simulation study, when the output power of WTG is low, no surplus energy can be stored in the battery. The DG output is connected to the system to supply the demand and the system has slight deviation in the frequency. The system is expensive and needs more large capacity batteries.
Conclusion
The hybrid MG model has been developed with different energy sources and the simulation results have been studied for four cases. The PI controllers are designed for the DGs, FCs, and batteries using Simulink optimization toolbox. Time response analysis shows that Case 2 is the optimized one for frequency control in the MG since only a fraction of the WTG output is sent to the AE for hydrogen generation. The result also shows that PI controllers tuned using SDO toolbox settles the frequency deviation better than the trial and error method.
Footnotes
Appendix
Simulation parameters.
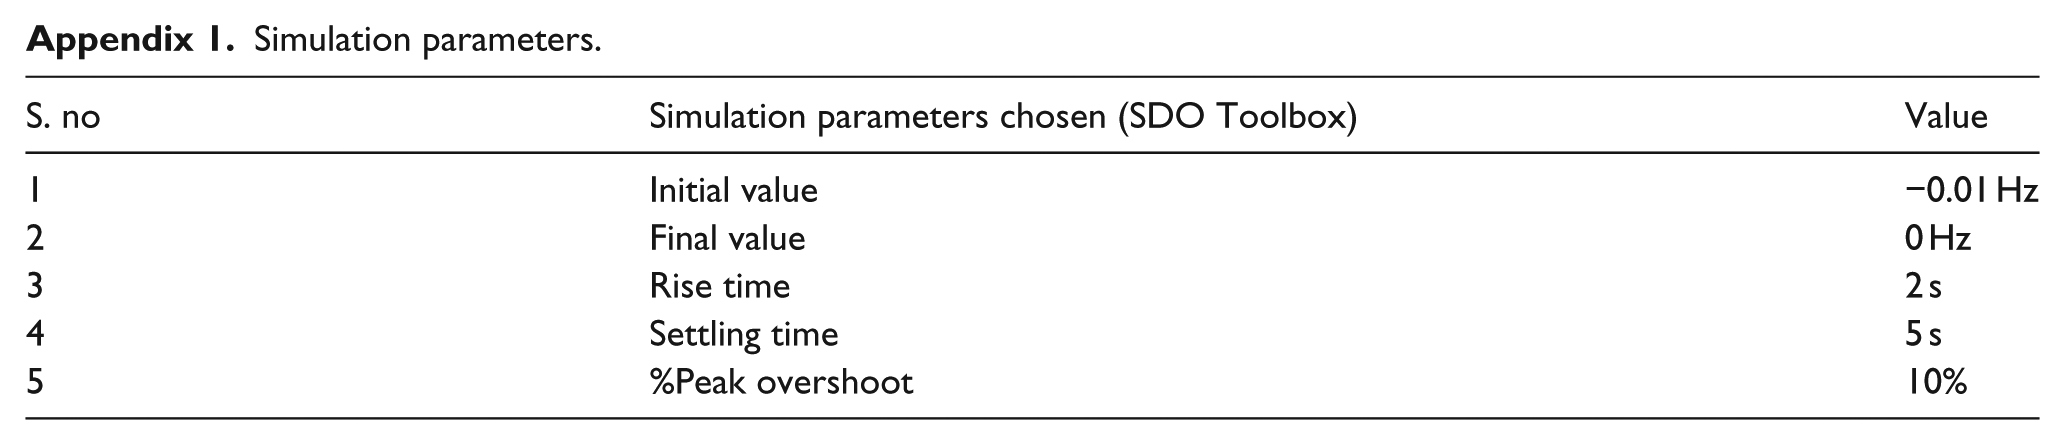
| S. no | Simulation parameters chosen (SDO Toolbox) | Value |
|---|---|---|
| 1 | Initial value | −0.01 Hz |
| 2 | Final value | 0 Hz |
| 3 | Rise time | 2 s |
| 4 | Settling time | 5 s |
| 5 | %Peak overshoot | 10% |
Declaration of conflicting interests
The author(s) declared no potential conflicts of interest with respect to the research, authorship, and/or publication of this article.
Funding
The author(s) received no financial support for the research, authorship, and/or publication of this article.