



Abstract
The use of thick airfoils toward the outboard part of horizontal axis wind turbine blades is a promising concept to reduce the cost of wind energy. In fact, thick airfoils have higher area moments of inertia than those of thin airfoils, normally employed toward the outboard part of the blade. Replacing thin airfoils with thicker ones would therefore allow one to improve the structural properties of the blade, reducing the mass needed to ensure its structural integrity. Conventional thick airfoils, however, are generally characterized by worse aerodynamic performance with respect to those of thin airfoils, which make them less attracting for their use toward the outboard part of the blade. The research reported in this paper deals with the development of an optimization system for the aerodynamic design of thick airfoils, aiming to improve their aerodynamic performance, and therefore making them more suitable for their usage toward the outboard part of the blade. In order to determine the effect of the use of thick airfoils towards outboard sections, a blade design incorporating a newly designed 30% thick airfoil is assessed both statically and dynamically. The results showed that mass reduction can be achieved with the use of ad hoc optimized thick airfoils with limited penalty in power production.
Introduction
The design of airfoils for horizontal axis wind turbine blades is dictated by both aerodynamic and structural considerations. Generally, the design of the airfoils at the outboard part of the blade is driven by aerodynamic performance, while the design of the airfoils destined to the inboard part is dictated mainly by structural requirements. Therefore, thin airfoils, which have better aerodynamic performance than those of the thick ones, are used towards the outer part of the blade, while thick airfoils, which have better structural characteristics than those of the thin ones, are used towards the inner part.
A promising approach towards the cost reduction of wind energy is represented by extending the use of thick airfoils also towards the outboard part of the blade. In fact, replacing thin airfoils with thicker ones would increase the area moments of inertia, and therefore less mass is needed to guarantee the structural integrity of the blade. However, conventional thick airfoils, the design of which is typically driven by structural requirements, would introduce a penalty in terms of aerodynamic properties. With respect to thin airfoils, thick airfoils are indeed characterized by worse aerodynamic performance in terms of early stall, high drag losses, and strong sensitivity to roughness. One possible solution to this limitation is to design specially tailored thick airfoils for the outboard part of the blade, taking into account both aerodynamic and structural requirements.
The development of tailored airfoils for horizontal axis wind turbines has been one of the main research topics in the wind energy field over the past three decades. Tangler and Somers (1995) designed the so-called NREL airfoils specifically optimized for stall regulated, variable-pitch and variable-rotor speed wind turbines. Björck (1990) and Timmer and Van Rooij (2003) also made an important contribution in this field by developing respectively the wind turbine dedicated FFA and TU Delft airfoil families. Fuglsang et al. (2004) presented the design and experimental verification of the Risø-B1 airfoil family for MW-size wind turbines with variable speed and pitch control. The design optimization of wind turbine airfoils is a complex multidisciplinary problem in which target functions and constraints need to be chosen carefully. An overview of the requirements needed for wind turbine airfoils is given by Grasso (2011).
Boorsma et al. (2015) investigated the usage of optimized thick airfoils toward the outboard part of rotor blades, showing promising results in terms of power performance under static operative conditions. Under dynamic conditions, however, these authors showed that the (static) design angle of attack is rarely maintained, resulting in a larger power performance penalty. This highlights the importance of considering rotor off-design conditions in the airfoil design. As suggested by Boorsma et al. (2015), the present work’s goal is to address these issues optimizing the airfoil’s performance over a range of angles of attack instead of taking a single design point, making the rotor performance more robust to operative condition changes.
The main drive of the work reported here is two-fold. On the one hand, it aims at developing and assessing a design framework for the aerodynamic design optimization of thick airfoils, with the goal to improve their aerodynamic performance, therefore making them more suitable for usage toward the outboard part of the blade. In this work, particular focus has been put on widening the angle of attack range for which the airfoil is designed, taking into account both clean and soiled blade surface. Such approach aims to optimize the airfoil, in clean and soiled conditions, not only for a given static operational condition but also for dynamic conditions.
On the other hand, the reported work aims at demonstrating the effectiveness of the developed framework by performing the design optimization of a 30% thick airfoil, and assessing its application towards outboard sections on the 10 MW INNWIND reference turbine (Zahle et al., 2013). Hereto a number of redesigns are performed incorporating the new 30% thick airfoil instead of the 24% thick profile as used for the reference case. The rotor performance are assessed in steady and dynamic conditions, including clean and soiled cases. Here it is mentioned that the redesigns are aimed at evaluating the effect on rotor performance rather than cost of energy reduction by further upscaling (which is the subject of the integral innovation evaluation within the European project INNWIND.EU).
As will be explained below, the dynamic power performance of the rotor designs have been determined considering the tip speed ratio fluctuations (due to dynamic operative conditions) for both the 10 and 20 MW INNWIND reference rotors, defining them as tip speed ratio probability distributions.
Methods
The 10 and 20 MW INNWIND reference turbines have been used for the current study. The blades of this turbine are equipped with FFA airfoils (Björck, 1990), ranging from 24% thickness at the tip to 60% thick section at the root. The thinner airfoil, used at the outer part of the blade, is named
The other profile is designed using an optimization framework, featuring an optimizer coupled with an airfoil geometric module defining the parametrization of the airfoil shapes (see Figure 1) and the ECN panel code RFOIL (Van Rooij, 1996) to calculate the aerodynamic performance of the profiles.
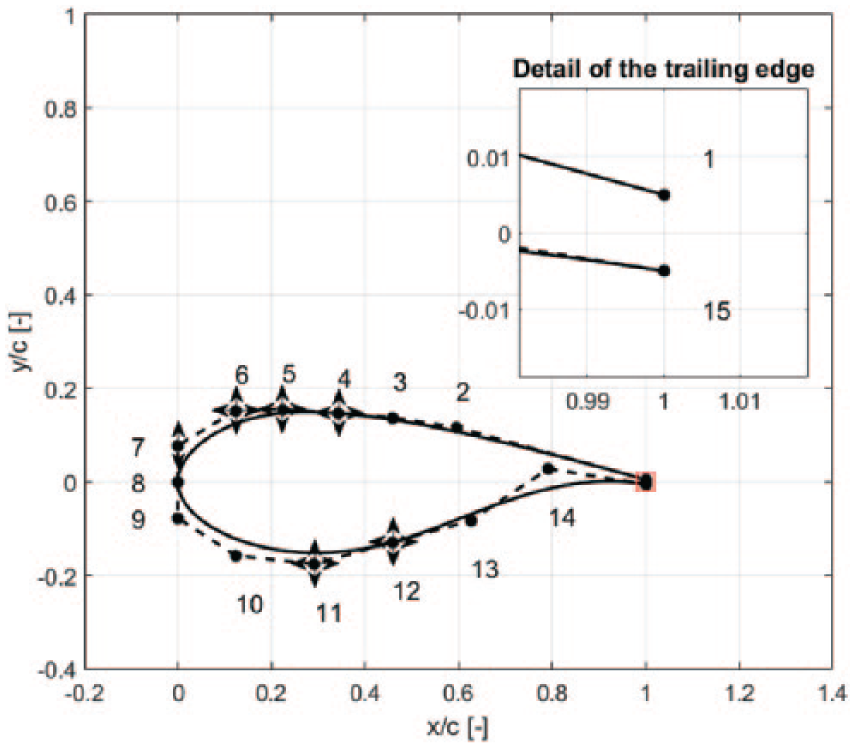
Airfoil parametrization. The airfoil shape is defined by a composite Bézier curve controlled by 15 points. Horizontal and vertical arrows denote the actual degrees of freedom.
Since wind tunnel data is not available for all airfoils under consideration, and we would like to end up with a fair comparison between the profiles, the aerodynamic polars for all airfoils (needed for the blade redesign) are evaluated using RFOIL using the appropriate Reynolds numbers. Both clean (transitional) and soiled (fully turbulent) surface conditions are determined by specifying, on both sides, the transition location at 5% chord for the latter.
The RFOIL version being used here features an improved prediction of the drag coefficient for thick sections by means of a newly implemented empirical correction based on the momentum thickness (Ramanujam et al., 2016). For the sake of a fair comparison, the usage of new airfoil data from RFOIL also necessitated a planform redesign of the reference blades.
As mentioned above, the research work reported in this paper has been carried out within the framework of the European project INNWIND.EU. One of the aim of this project is to investigate the technical feasibility and the economical profitability resulting from upscaling wind turbine rotors up to 20 MW. One of the challenges related to wind turbine upscaling is clearly the large increase in the aerodynamic loads. One of the possible ways to tackle this issue, and ensure the structural integrity of very large blades, is to enhance blades structural properties increasing the relative thickness of their airfoils and using blunt trailing edge, also outboard, where the aerodynamic performance are indeed important. The INNWIND reference turbine defined with this scope was indeed developed using a 24% thick blunt airfoil at the tip, namely the FFA-W3-241 airfoil. FFA-W3-241 airfoil has 0.6% chord blunt trailing edge. The new airfoil has been developed with a comparable value, namely 1% chord.
One of the aim of this paper was to assess the performance of rotors featuring thick airfoils towards outboard sections. This assessment was performed by comparing 3 rotors. The first rotor is the INNWIND reference one, which implement the reference 24% thick FFA-W3-241 airfoil outboard. The second rotor was defined implementing a thicker airfoil outboard, belonging to the same family of the airfoil being used in the INNWIND reference rotor. For this scope the 30% thick FFA-W3-301 airfoil was chosen. The third rotor implements a newly developed thick airfoil outboard. To make a fair comparison between the second and the third rotors, the new airfoil has been designed constraining the relative thickness to 30%. However, the airfoil thickness could be chosen as design variable, and this will be taken into account in future development.
Airfoil optimization strategy
This section deals with the design optimization of a 30% thick airfoil to be used at the outer part of the 10 MW INNWIND reference rotor.
In this design optimization problem, the design angle of attack and Reynolds number were chosen based on the actual operative angle of attack and Reynolds number at the outboard part of the blade of the 10 MW INNWIND reference turbine, at the optimal tip speed ratio of 7.5. Moreover, the lift coefficient at the design angle of attack was constrained to be comparable to that of the baseline
At design conditions, it is therefore assumed that the newly developed airfoil will operate at the same angle of attack range as that of the 10 MW INNWIND reference rotor, implying that the blade implementing the thicker airfoil will be characterized by the same chord distribution.
The airfoil design optimization reported below was carried out for a design angle of attack of 7°, while the RFOIL calculations were performed at a Reynolds number of
Objective function
The performance parameter considered in this study was the lift to drag ratio (
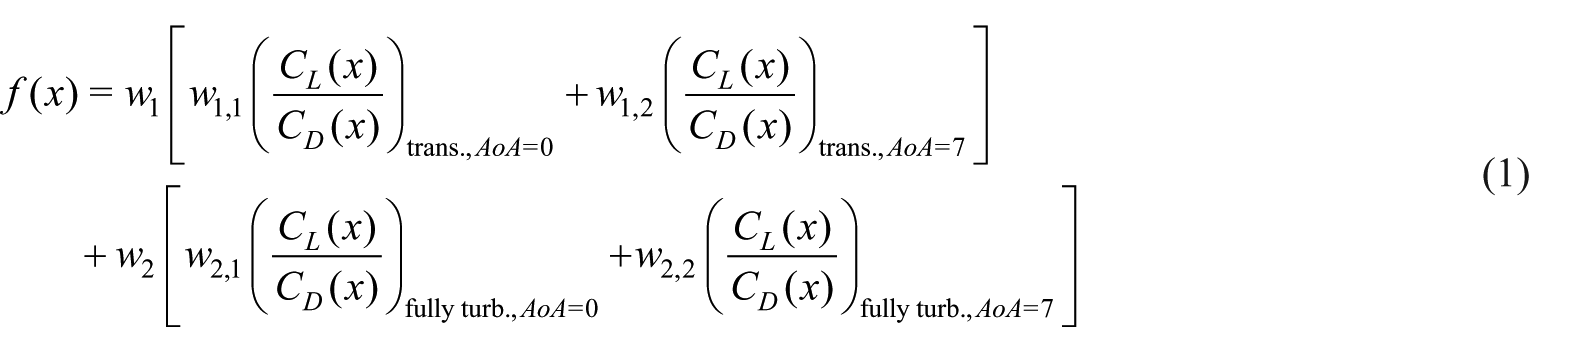
Objective function’s weights.

The aim of the objective function above was to maximize the airfoil efficiency in both transitional and fully turbulent conditions, over the range of angle of attack between 0° and 7°. As mentioned above, optimizing the airfoil over a range of angles of attack, rather than a single angle of attack, allows the airfoil’s performance to be less sensitive to variations of the angle of attack due to, for example, sudden wind variations which cannot be followed by the rotor controller.
The selection of 0° and 7° as the evaluation angles of attack of the lift to drag ratio, and the selection of the same weights (
The quality of the trade-off, as well as the operative range of angle of attack in which the airfoil will likely operate in dynamic conditions, were here judged qualitatively. This qualitative approach evidently is affected by limitations, leading to a suboptimal design. Indeed, the airfoil optimization does not include quantitative information about the actual angle of attack range, and the probability that the angles of attack will actually occur on the rotor. The combined optimization of the airfoil shape and the rotor blade planform is a possible way to solve this problem and, as mentioned below, it will be a topic for future research.
The roughness sensitivity is one of the negative inherent characteristics of thick airfoils. In this study this problem is tackled by giving a much larger weight to the efficiency in fully turbulent flow (i.e.,
Constraints
With respect to the design angle of attack, during the course of the optimization, the stall margin was set to 5° for both transitional and fully turbulent polars. The stall angle was defined as the angle of attack in which the drag coefficient becomes the double of that at 0°.
In the optimization problem reported here, the only structural criteria was represented by a constraint on the relative thickness of the airfoil, constrained to vary between 30% and 35%. It is therefore expected that, since the objective function aims to maximize the aerodynamic efficiency, the optimization problem’s result (at convergence) is an airfoil with minimum allowed relative thickness, namely 30%.
Free transition and fully turbulent polars were calculated by means of RFOIL for an angle of attack range from −4° to 16°. Free transition polars were determined by setting RFOIL’s Ncrit parameter to 9. Fully turbulent polars were instead determined by tripping transition at 5% chord from the leading edge on both suction and pressure sides.
The maximum lift coefficient in clean conditions was constrained to be lower than 1.85. The maximum lift was constrained to avoid excessive aerodynamic loads in case of sudden increase of the angle of attack over the outboard part of the blade, potentially resulting in structural issues. The value of 1.85 was chosen to be comparable to that of the maximum lift of the baseline
At the angle of attack of −4°, the drag coefficient in fully turbulent conditions is constrained to be lower than 0.028. It is seen in fact that, during the airfoil optimization, without this constraint the slope variation of the pressure side beyond the maximum thickness location towards the training edge becomes very large. At negative angle of attack, the large slope variation induces massive separation in fully turbulent flow. Therefore, this constraint on the drag coefficient in fully turbulent conditions at −4° has the effect of reducing the slope variation of the rear part of the pressure side.
Rotor analysis and design
For the planform redesigns, the ECN tool BOT was used, which allows to design a (rigid) blade geometry for optimizing annual yield by using quasi steady aerodynamics in the form of blade element momentum theory. In the current work the optimization was only performed in partial load (constant pitch angle and tip speed ratio), which reduces the optimization to obtaining a maximum power coefficient
Implementing the thicker airfoil can be achieved in numerous ways. In previous studies (Boorsma et al., 2015), two different possibilities have been investigated, namely reducing the chord length (maintaining the same absolute thickness) and increasing the absolute thickness (maintaining the chord length). The first option aims at reducing the flatwise fatigue loads (which eventually allows to reduce blade mass used for flatwise bending stiffness) while the second option aims at mass reduction in the girders due to increased height to achieve the same bending stiffness.
In this work, the redesigns have been performed following the second approach, namely keeping the chord distribution constant and increasing the absolute thickness. This planform redesign option together with the two different 30% thick airfoils (
Results and discussion
Airfoil design
The result of the optimization problem presented above is a newly developed 30% thick airfoil named “

Airfoil geometries.
The geometry of this airfoil is compared to those of the
Transitional and fully turbulent lift coefficient as a function of the angle of attack of the three airfoils are shown in Figure 3. It is seen that all airfoils have their maximum clean lift coefficient at the same angle of attack (around 14°). The

Lift coefficient
Drag coefficient in clean and soiled condition is depicted in Figure 4. As expected, the
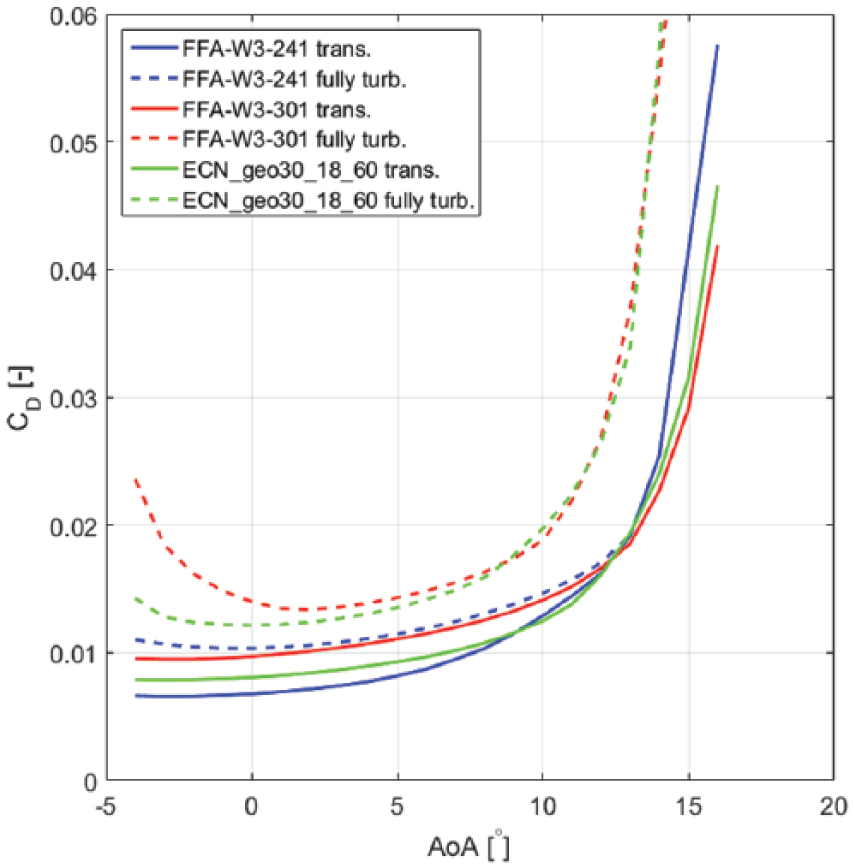
Drag coefficient
Figure 5 shows the lift to drag ratio for the three considered airfoils. The
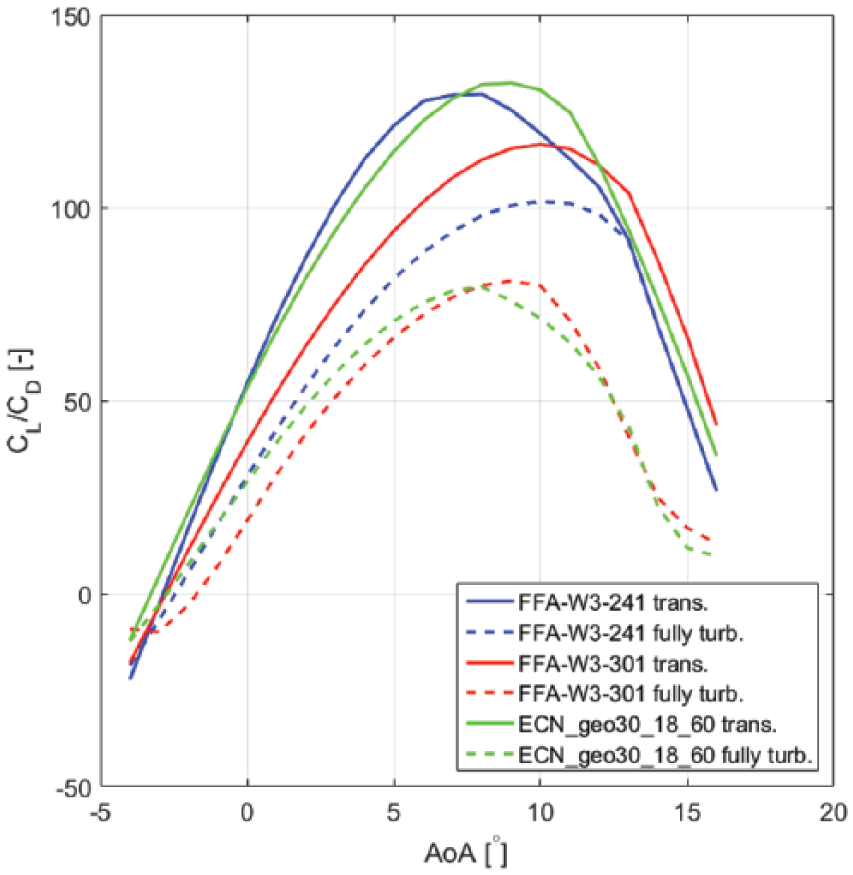
Lift to drag ratio
In clean conditions, for the 30% thick
The transitional
As seen, the newly developed 30% thick airfoil achieved, for a broad angle of attack range, a similar
However, the performance of the new 30% thick airfoil is affected by much larger degradation due to soiled conditions than the 24% thick airfoil (39% against 27% lower
Rotor design and evaluation
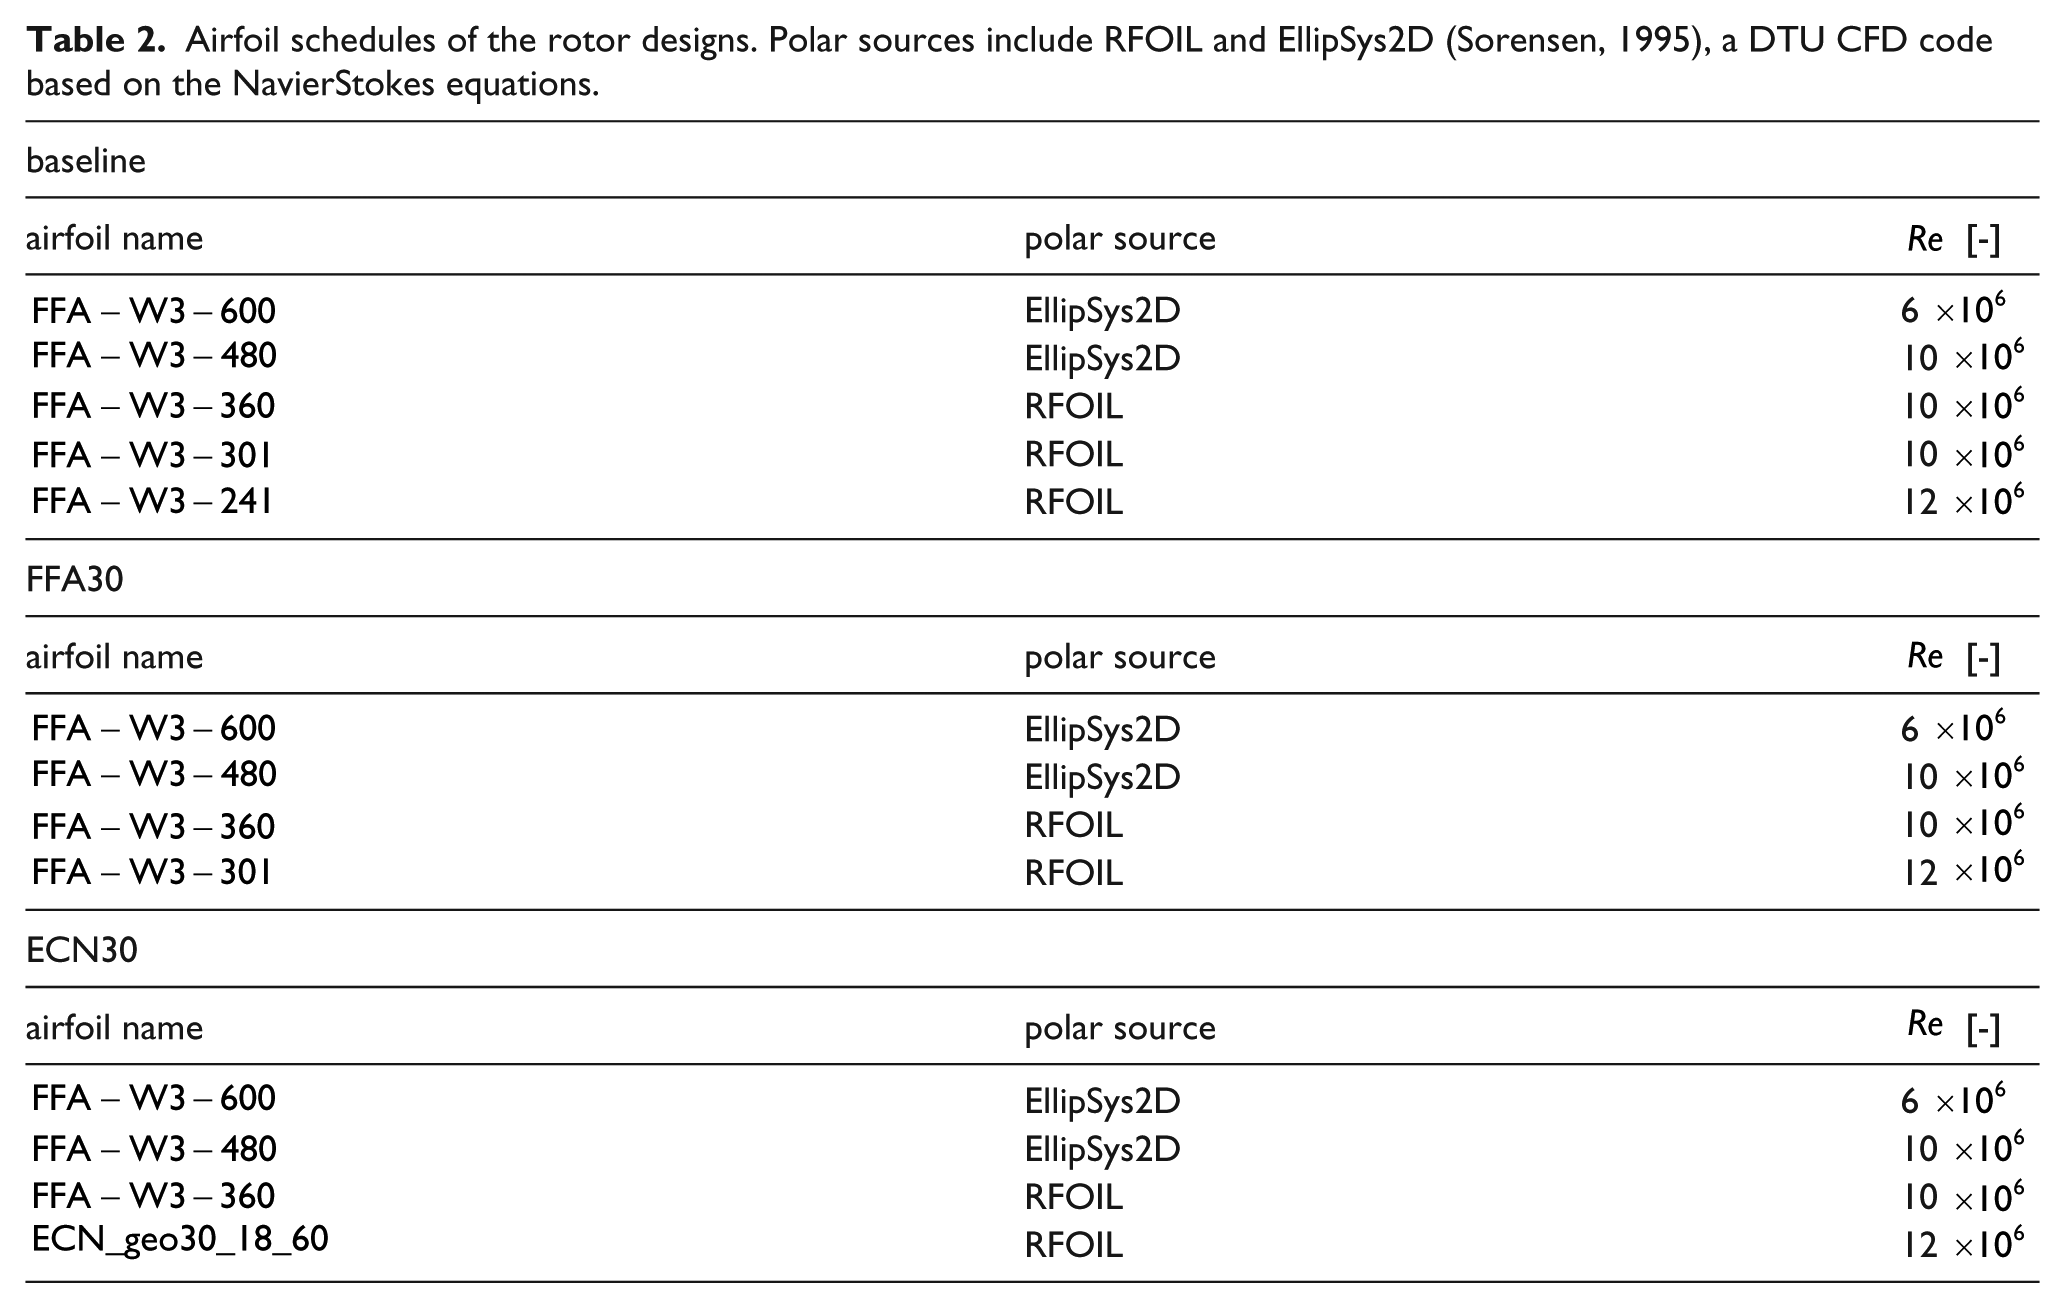
The airfoil schedules of the three rotors developed in this study, named baseline, FFA30 and ECN30, are depicted in Table 2. This table shows the source and the Reynolds number of the airfoil polars used in the rotor analyses and designs reported below. The 24% thick airfoil, making up the outboard part of the baseline blades, was replaced by the 30% thick airfoils
Airfoil schedules of the rotor designs. Polar sources include RFOIL and EllipSys2D (Sorensen, 1995), a DTU CFD code based on the NavierStokes equations.
The baseline rotor was based on the 10 MW INNWIND reference rotor. More specifically, the former rotor is the result of a planform optimization of the latter one. The optimization of the 10 MW INNWIND reference rotor was needed to provide a fair comparison between the baseline rotor and the newly developed ones. The blade planform of the baseline rotor was optimized for maximum
From root to tip, each blade of the baseline rotor uses FFA airfoils, spanning the relative thickness from 60% to 24%. The relative thickness distribution of the baseline rotor’s blades was taken the same as that of the 10 MW INNWIND reference rotor.
The resulting absolute thickness, chord and section twist angle of the baseline rotor are depicted in the top plot of Figure 6 and in Figure 7, respectively.
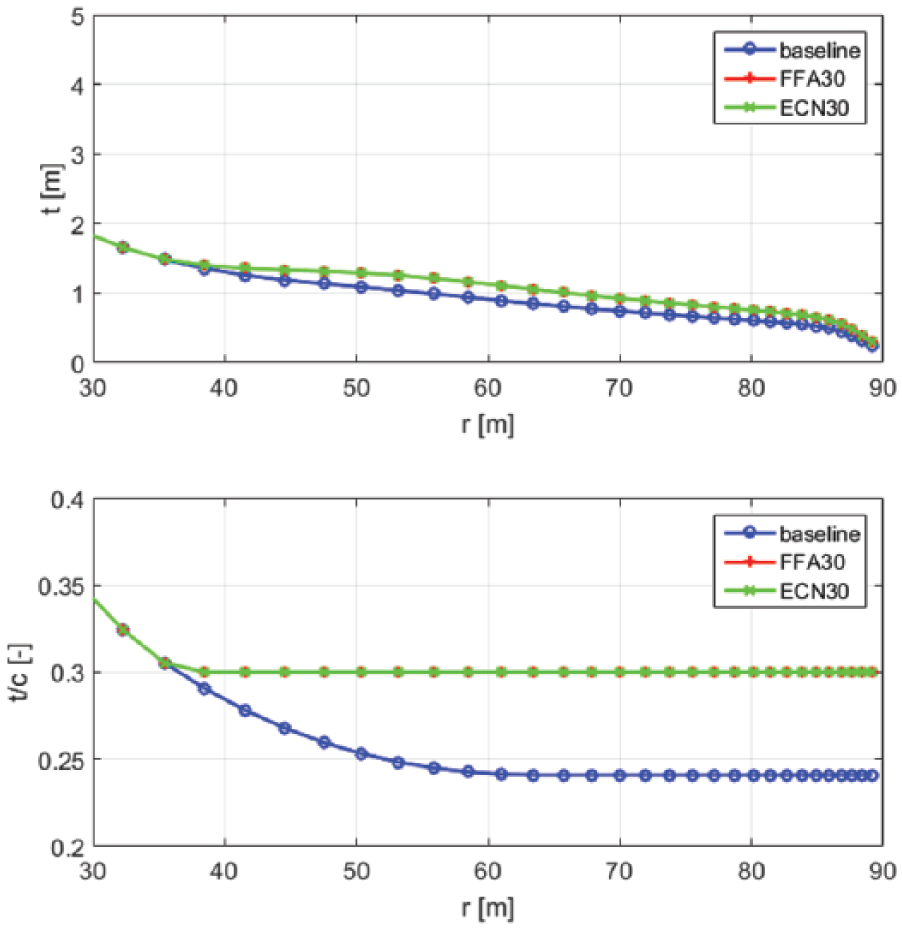
Absolute blade thickness
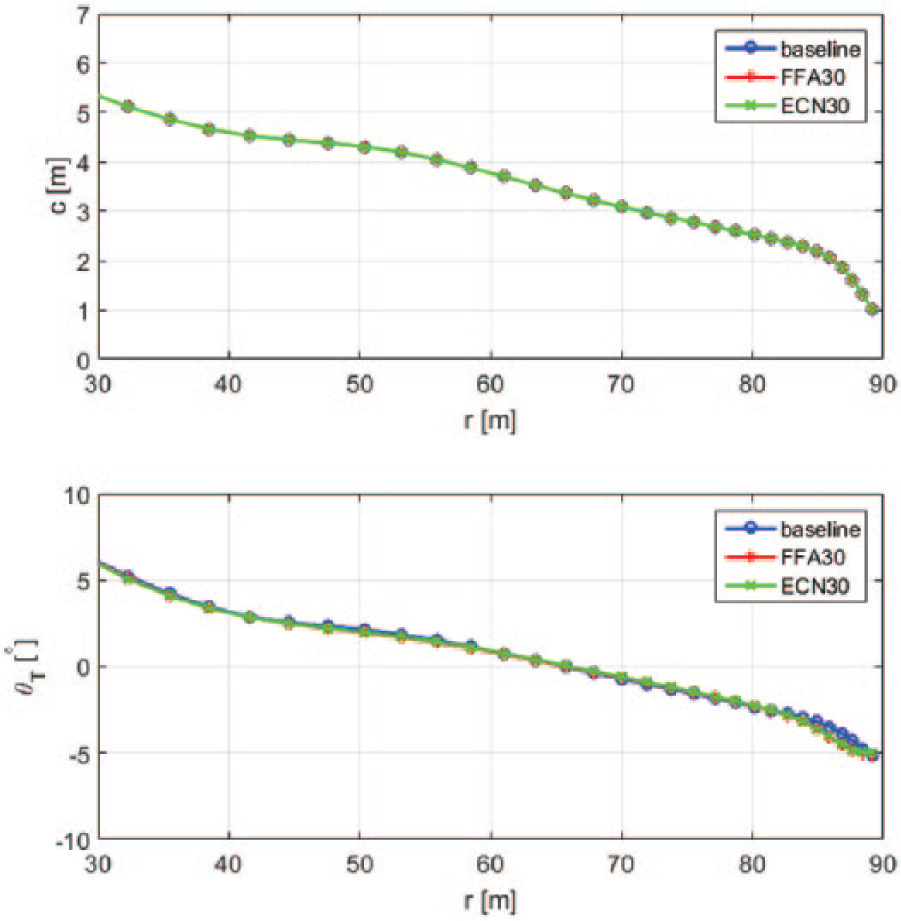
Chord
The relative thickness distributions of the FFA30 and ECN30 rotor were based on that of the baseline one up to approximately 35 m from the blade root, beyond which it is constant and equal to 30%. A comparison of the relative thickness distribution along the outboard blade span of the three rotors is shown in the bottom subplot of Figure 6.
The following part of the report discusses the results of the FFA30 and ECN30 rotor redesigns, and compares these rotors’ performances with those of the baseline one, considering both clean and soiled conditions. Rotor analyses in soiled conditions have been determined by replacing the transitional polars (used in the rotor optimizations) with fully turbulent ones over the last 45 m of the blade (i.e., over the last 50% of the blade span).
Rotor planform optimization of the rotors implementing 30% thick airfoils at outboard sections
The FFA30 and ECN30 rotors’ designs were determined by keeping the chord distribution constant and equal to that of the baseline one (see top subplot of Figure 7), and increasing the absolute thickness (see top subplot of Figure 6) to achieve the given relative thickness distribution as explained above (see bottom subplot of Figure 6).
Subsequently, the section twist angle and blade pitch angle of the FFA30 and ECN30 rotors were optimized for maximum
Table 3 shows the optimal tip speed ratio and maximum power coefficient in transitional flow conditions for the three investigated rotors. It is noted that the optimal tip speed ratio it is not equal to 7.5, despite it being the design tip speed ratio. The reason for that is due to the fact that the rotor evaluations have been done with Aero-Module (Boorsma et al., 2011), while the optimizations have been performed by means of BOT. The choice of a different evaluation tool, responsible for the deviations in the optimal
Design tip speed ratio
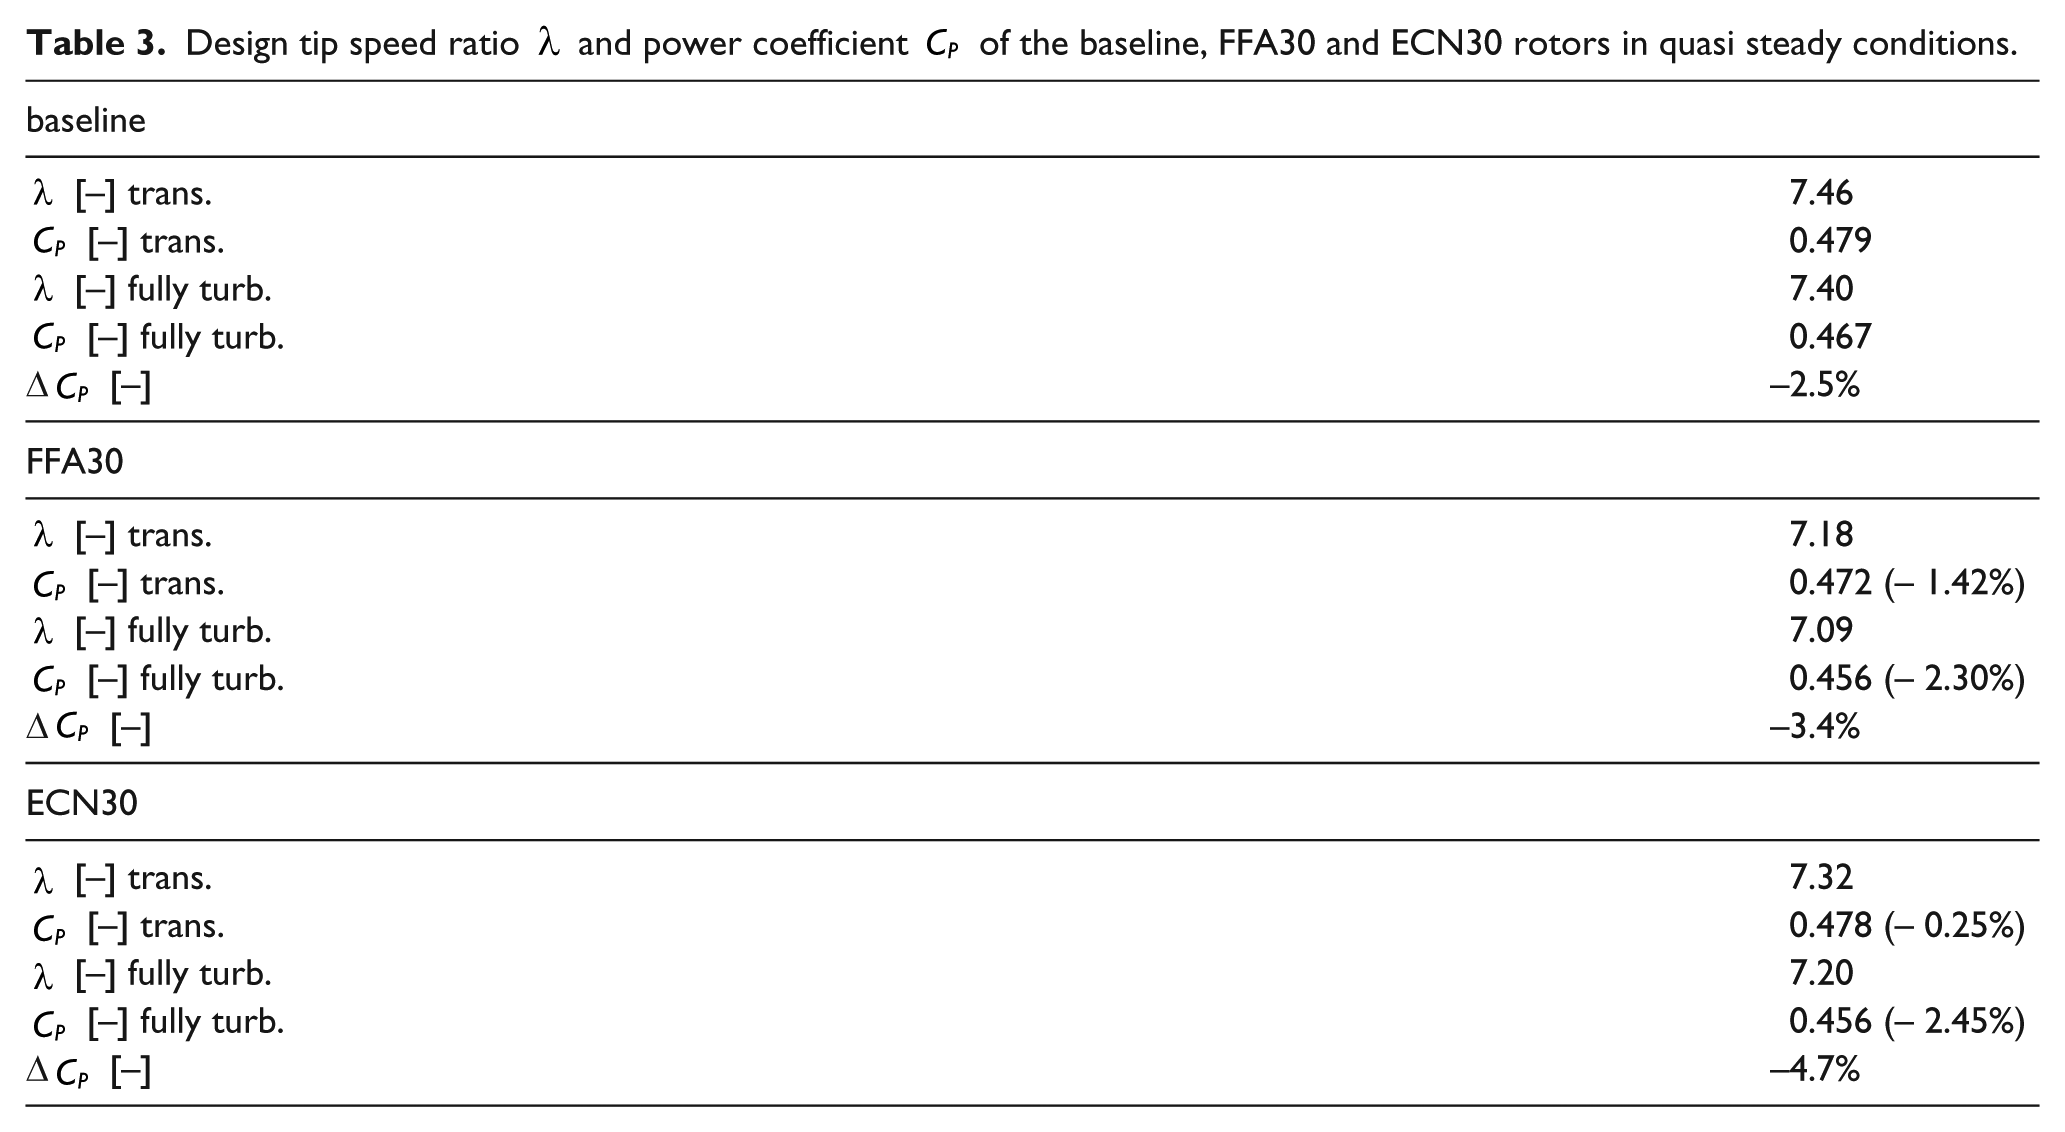
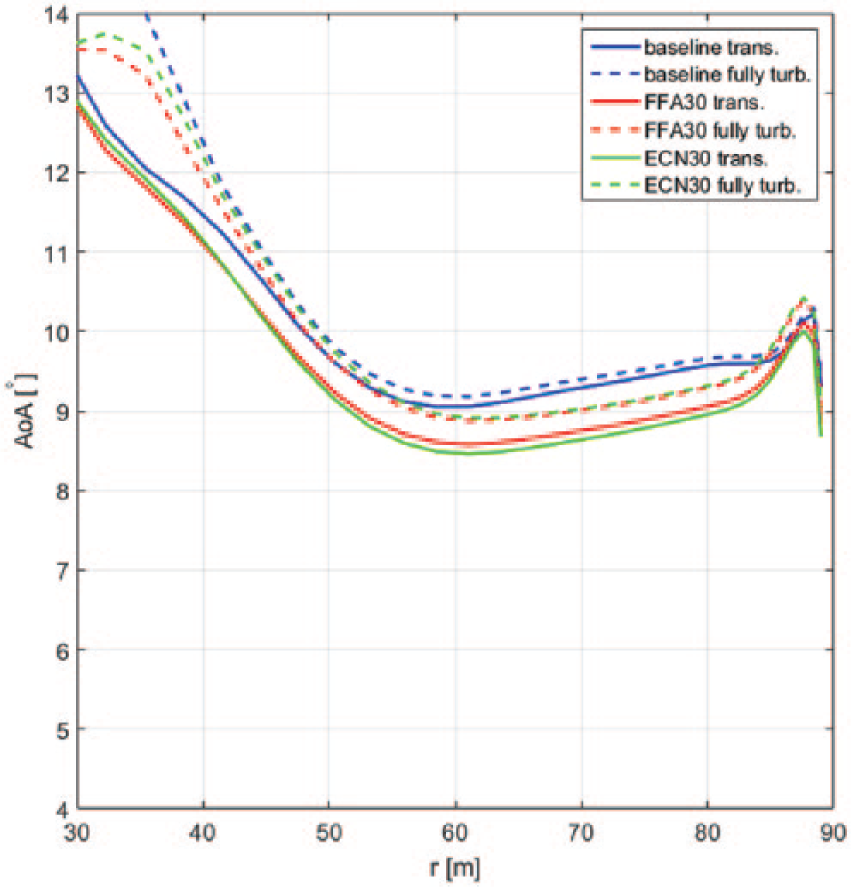
In clean conditions, at optimal
The blade planform optimization allowed the rotors to operate at maximum
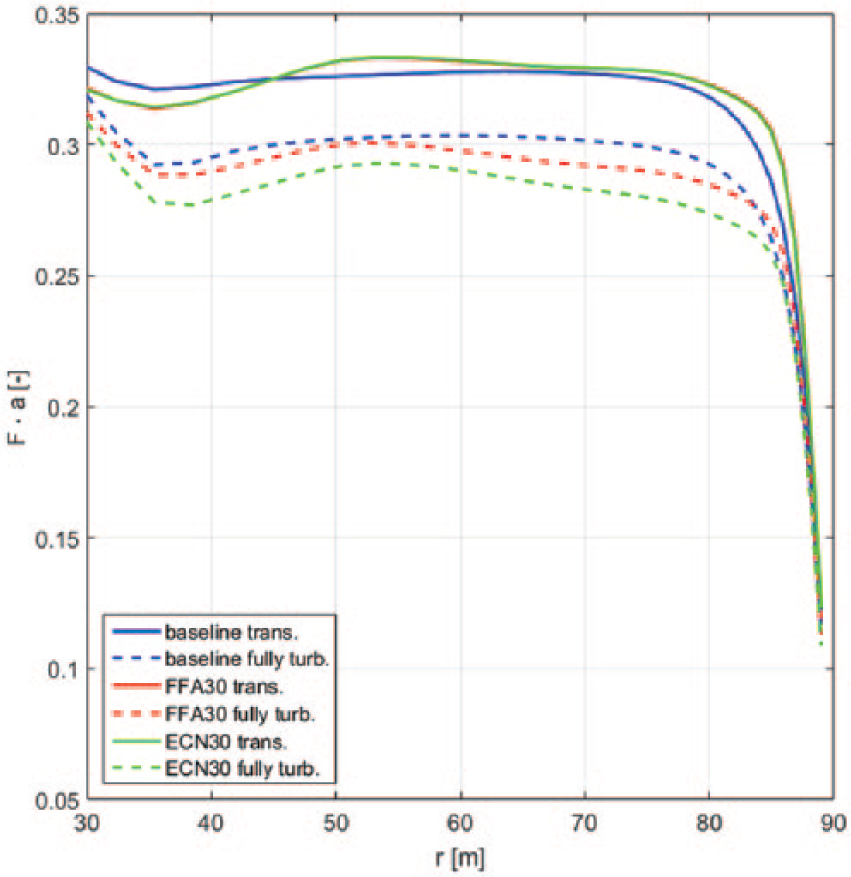
Annulus averaged axial induction factor
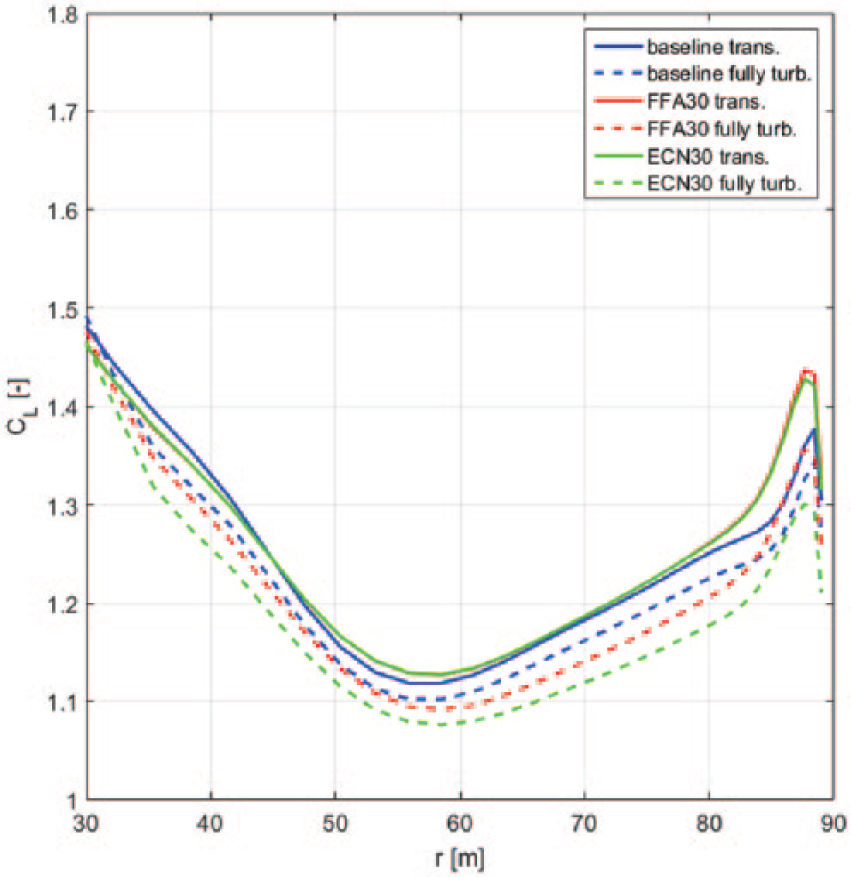
Lift coefficient
However, since the lift coefficient curve of the
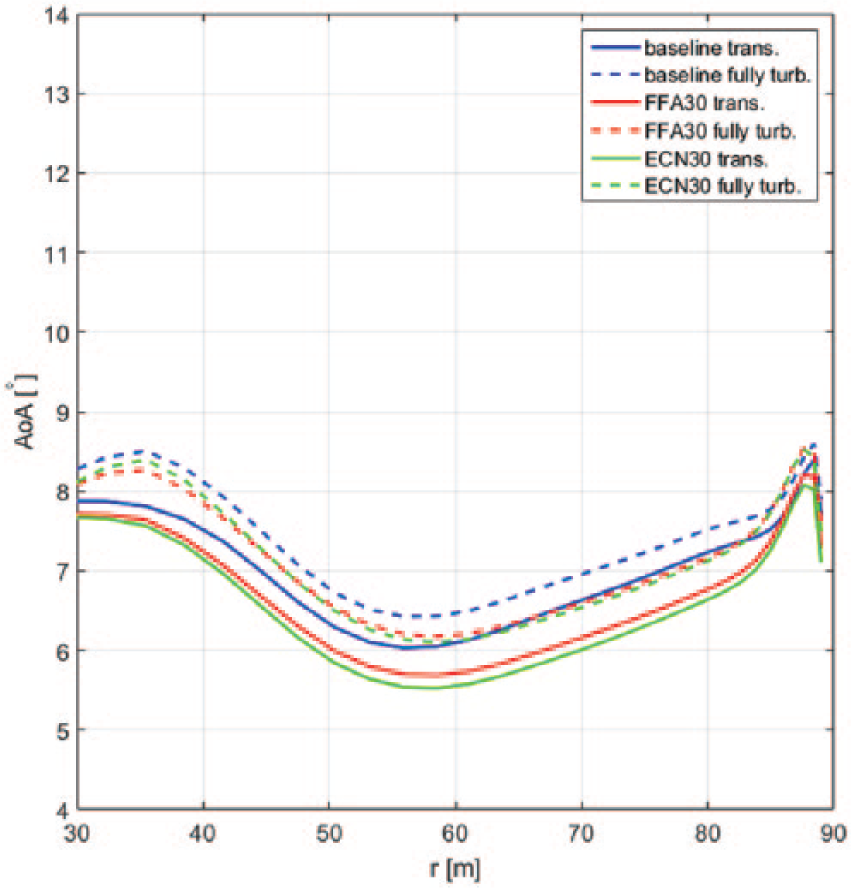
Angle of attack
Under these operational conditions, the lift to drag ratio of the both FFA30 and ECN30 rotors is worse than the baseline (Figure 11), leading to the aforementioned decrease in power performance.
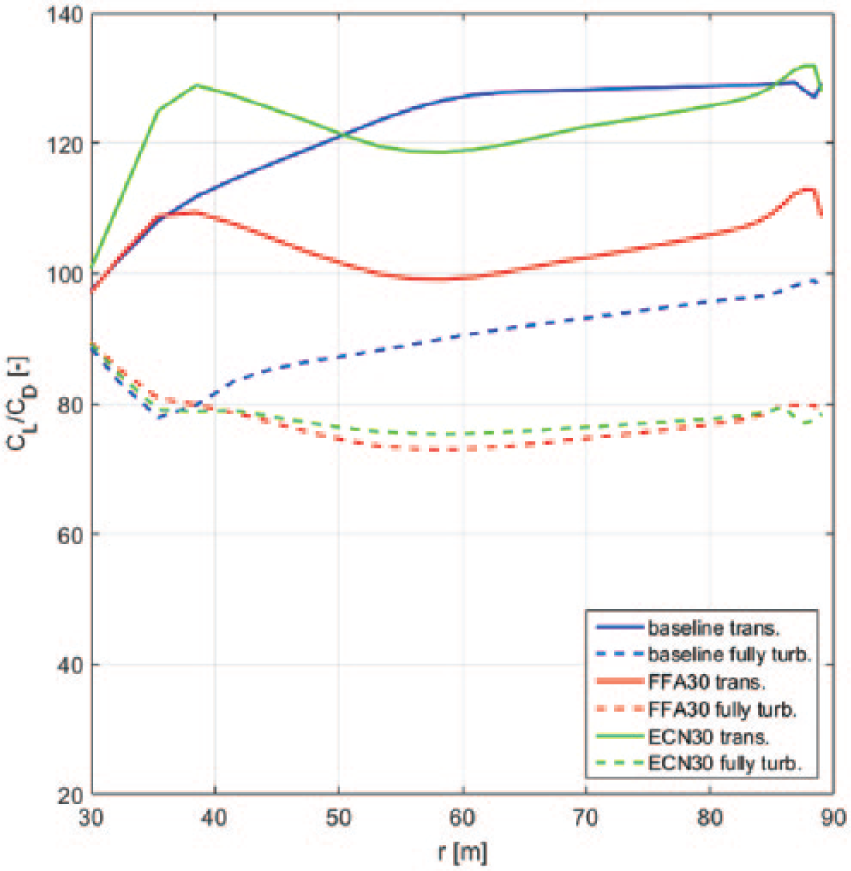
Lift to drag ratio
As seen in Table 3, in soiled conditions the rotors operate at slightly lower tip speed ratios than the optimal ones. At these tip seed ratio the baseline rotor has larger
For all rotors, under fully turbulent flow, due to smaller tip speed ratios enforced by the controller, the operative angles of attack increase with respect to those in transitional flow. This is confirmed by looking at Figure 10. The angle of attack increase is around 0.5°, which does not pose any issue related to the stall margin.
Despite the larger angles of attack, in soiled conditions, the airfoils are able to generate less lift (Figure 9), with considerable larger drag (Figure 12). Overall, the lift to drag ratio of the baseline rotor is larger than that of the FFA30 and ECN30 rotors (Figure 11). For the latter two rotors the lift to drag ratios are comparable. However, with respect the

Drag coefficient
Roughness sensitivity is expressed by the parameter ∆
Evaluation of rotor dynamic performance considering the 10 and 20 MW INNWIND reference rotors’ tip speed ratio probability distributions
Figure 13 shows the power coefficient as a function of the tip speed ratio for the baseline, FFA30 and ECN30 rotors. As reported above, it is noted that, at the optimal tip speed ratios, the baseline rotor has the larger value of power coefficient, followed respectively by the ECN30 and the FFA30 rotors.
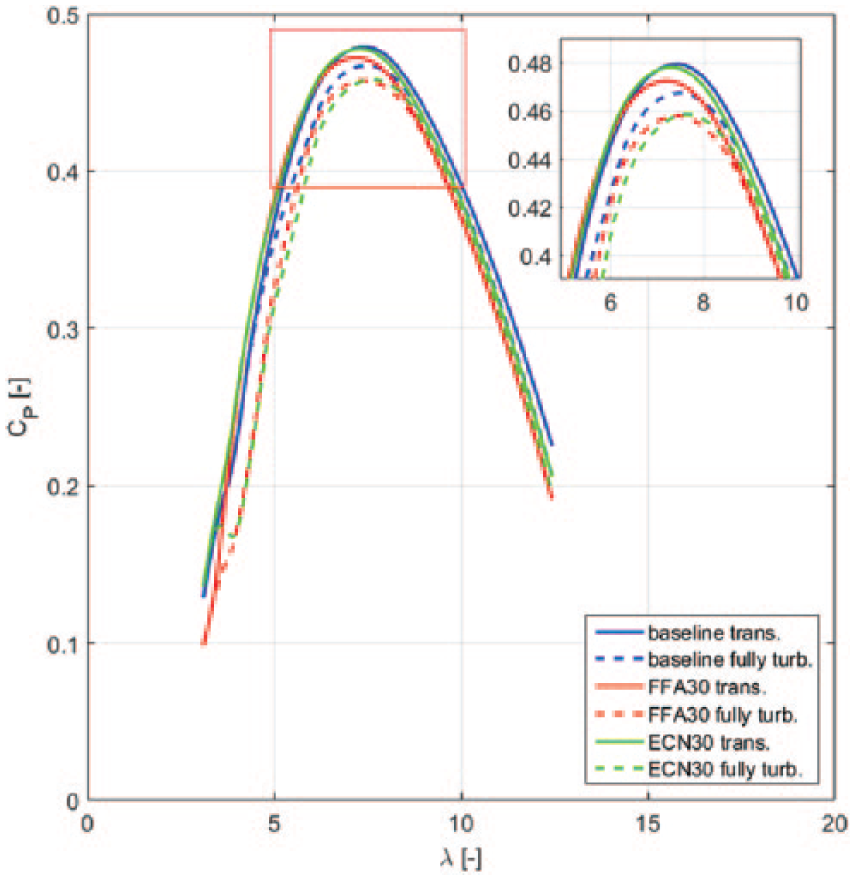
Power coefficient
At the design conditions, however, the tip speed ratio varies around the design one as a consequence of the rapid fluctuations of the wind speed, which cannot be followed by the rotor. The tip speed ratio fluctuations for the 10 and 20 MW INNWIND reference rotors are here expressed as tip speed ratio probability distributions. These are determined based on detailed aero-elastic simulations under turbulent wind speeds varying between 4 and 12 m/s, including the wind turbine controller. The simulations are performed with turbulent wind according to the wind class of the two turbine models: the 20 MW rotor is designed for class 1C (12% turbulence), while the 10 MW rotor is class 1A (16% turbulence). For each wind speed, six different wind realizations are simulated (two with yaw misalignment of 8°, two with aligned flow, and two with misalignment of −8°).
For constructing the probability distributions, shown in Figure 14 (for the 10 MW rotor) and Figure 15 (for the 20 MW rotor), only that part of the time series have been used when the controller operates to maximize power (and not to control rotor speed at cut-in or rated), in order to make sure that effects induced by the controller are not included into the analysis. The simulations are performed with the Focus/Phatas software, and using the DTU reference wind turbine controllers for these turbines.
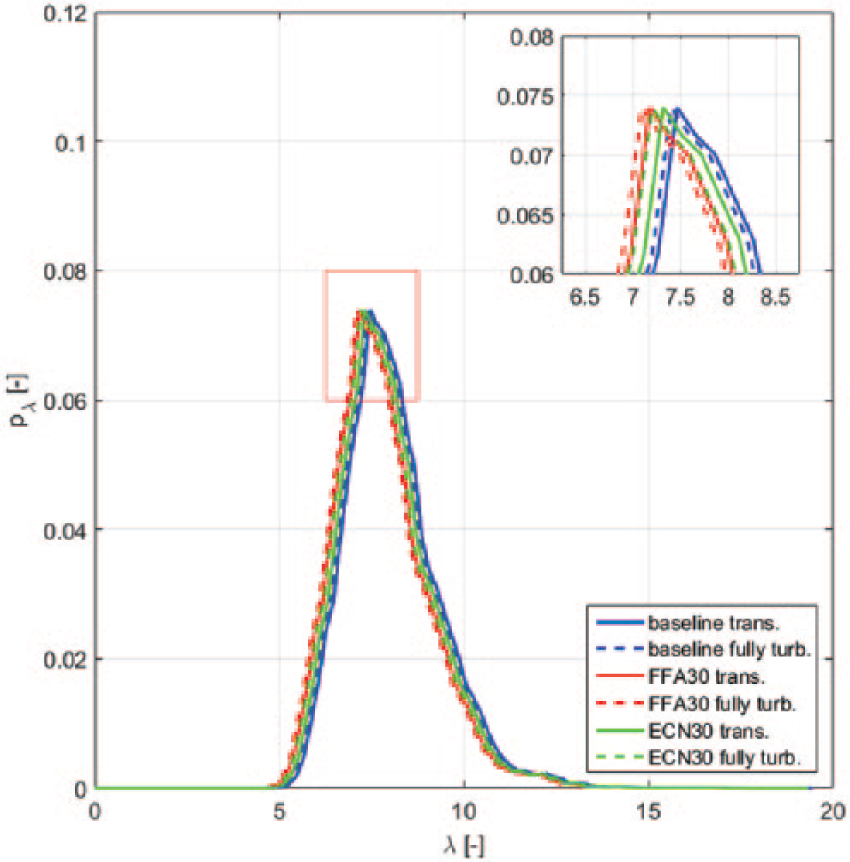
Tip speed ratio probability distribution

Tip speed ratio probability distribution
It can be observed that the probability distribution for the 10 MW rotor is broader than that for the 20 MW rotor. The reason for that is the different wind class for these two designs (see above). Due to the higher turbulence (16%) in the 10 MW case, there are more variations in the wind, leading to more variations in the tip-speed ratio.
Note, also, that both probability distributions are asymmetric with respect to the design tip speed ratio of 7.5. In particular, larger probability resides towards higher tip speed ratios. This is easily explained by observing that the wind velocity is in the denominator of the relation for the tip-speed ratio: a sudden decrease of the wind speed has a larger impact on the deviation of the tip-speed ratio from its design value than is the case with increase of the wind speed. It is noted that the probability distributions are asymmetric with respect to the optimal tip speed ratios. In particular, larger probability resides towards higher tip speed ratios. This is easily explained by observing that the wind velocity is in the denominator of the relation for the tip-speed ratio: a sudden decrease of the wind speed has a larger impact on the deviation of the tip-speed ratio from its design value than is the case with increase of the wind speed.
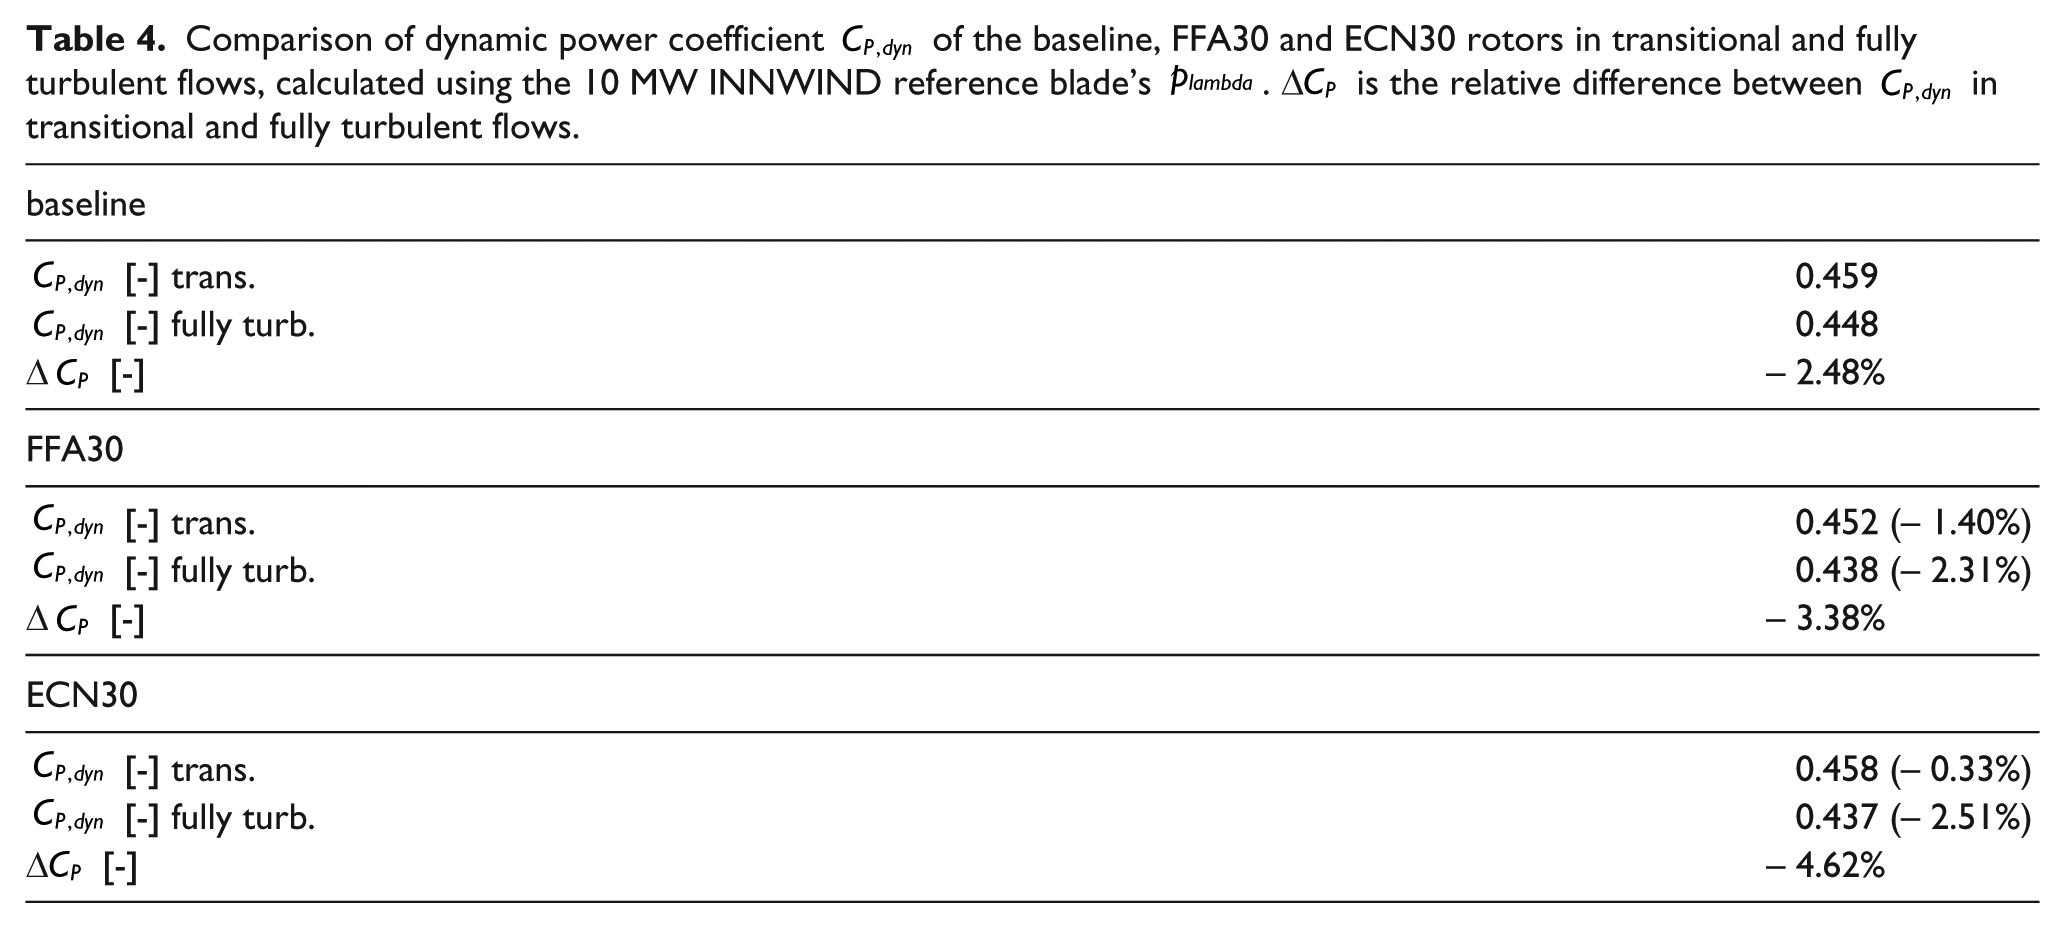
Given the dynamic behavior of the rotors, a more indicative figure to assess their performance is the “dynamic CP”, denoted by the symbol “

To consider dynamic conditions,
Comparison of dynamic power coefficient
Comparison of dynamic power coefficient
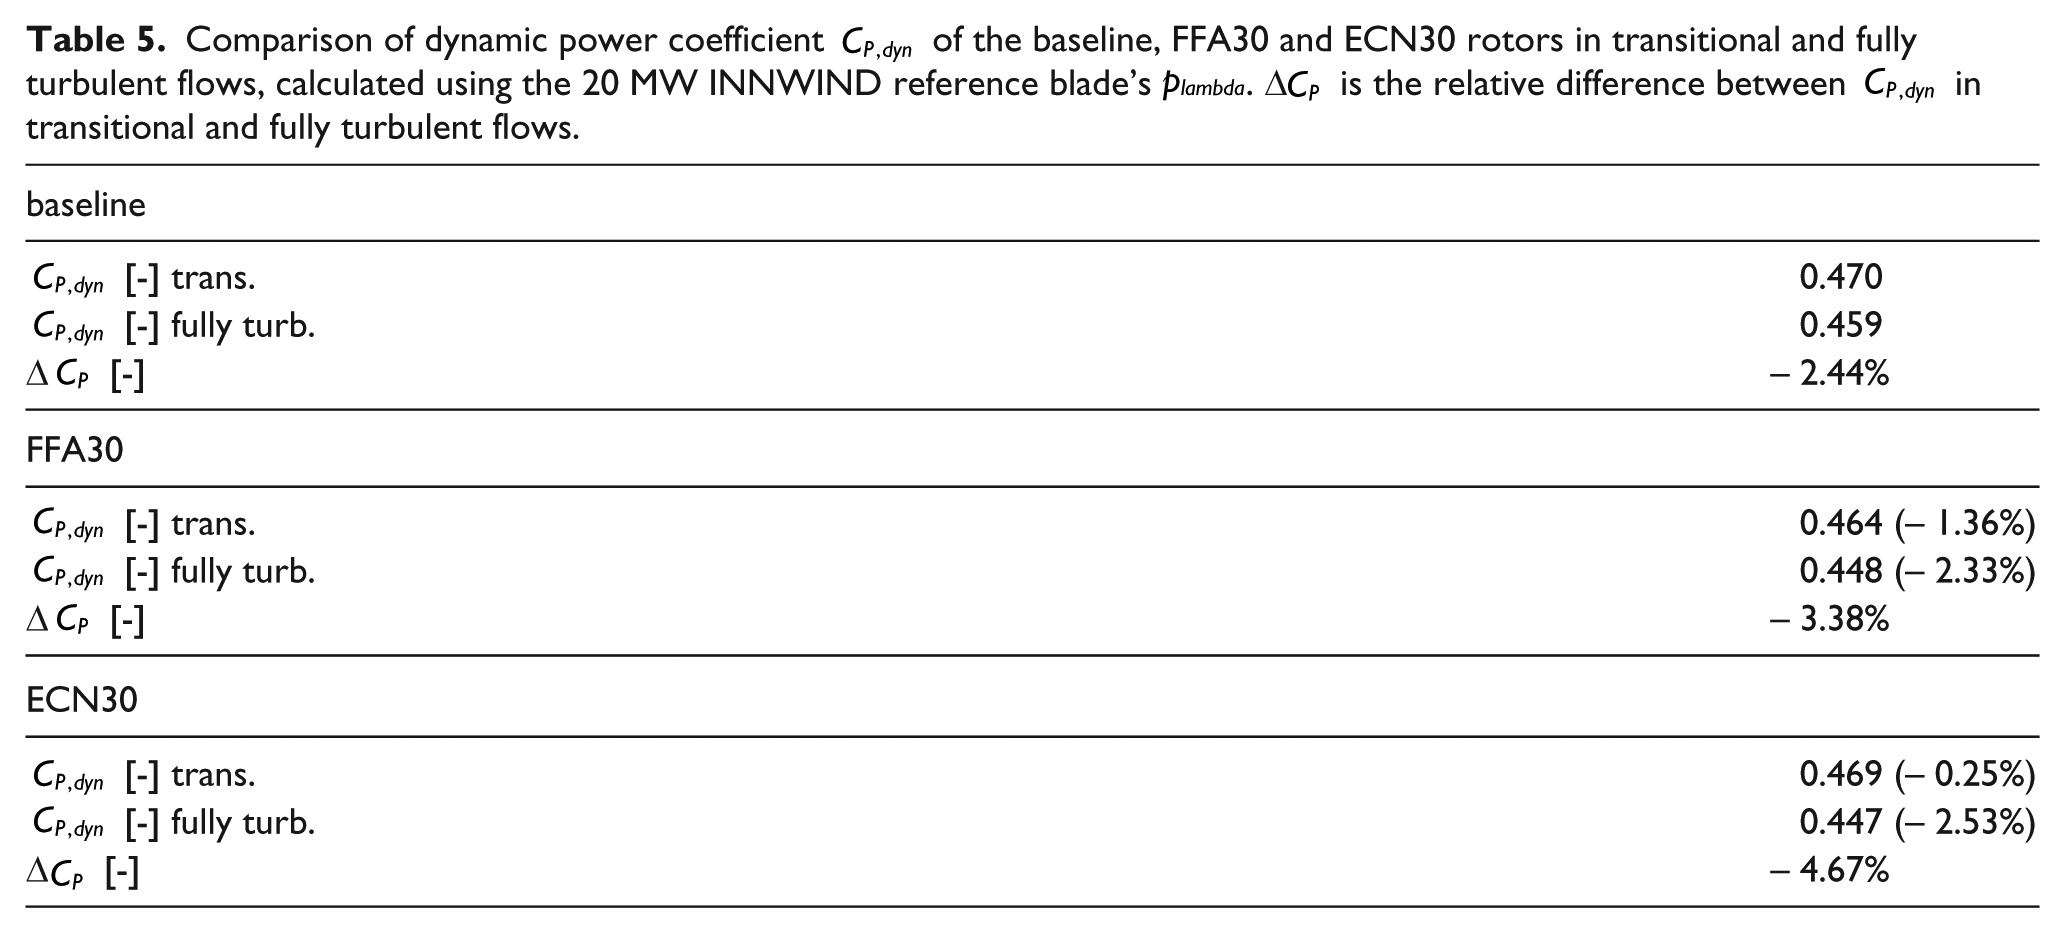
In clean conditions, considering the 10 MW rotor’s tip speed ration probability distribution,
For the 20 MW rotor, in clean conditions, the baseline rotor has the larger dynamic
In order to make sure that the stall margin requirements are also met at high angles of attack, resulting from dynamic variations of the tip speed ratio, the rotors’ angle of attack distributions are evaluated at a tip speed ratio of 6 (see Figure 16). As seen from the tip speed ratio probability distributions, this is an actual tip speed ratio that the turbine rotors experience in dynamic conditions. As seen in Figure 16 the angle of attack distribution is below 10°, confirming that all tip airfoils operate below stall in both clean and soiled conditions.
Angle of attack
Based on these results, it is observed that the power performance penalty in dynamic conditions of the rotor design implementing the new 30% thick airfoil towards outboard section is limited in clean conditions. This penalty grows when the dynamic performance are calculated using the tip speed ratio probability distribution of the 10 MW INNWIND rotor, as it is wider than the 20 MW rotor, and therefore the
Conclusion
A new 30% thick airfoil has been developed for outboard sections and its application has been investigated on a baseline rotor based on that of the 10 MW INNWIND reference turbine, whose blades implement the 24% thick
The new airfoil design has been optimized to maximise the lift to drag ratio over a broad range of angles of attack in both clean and soiled conditions. This has aimed to both increase the airfoil’s aerodynamic performance and reduce its performance sensitivity to dynamic and rough conditions. It is however seen that, despite the fact the aerodynamic efficiency of the new 30% thick airfoil in clean conditions is analogous to that of the 24% reference airfoil, it is characterized by much larger roughness sensitivity.
The application of the new 30% thick airfoil towards the outboard sections has been investigated on the baseline rotor, replacing the reference 24% thick airfoil. Both steady and dynamic performance of the developed rotors are assessed in term of power coefficient and stall margin. The dynamic power performance of the rotor designs have been determined considering the tip speed ratio fluctuations (due to dynamic operative conditions) for both the 10 and 20 MW INNWIND reference rotors, defining them as tip speed ratio probability distributions.
The adopted redesign concept is achieved by increasing the baseline absolute thickness and maintaining the same chord length. This option allowed the airfoil to operate at design conditions, meeting the stall margin requirements in static/dynamic and clean/soiled conditions.
In clean conditions, the application of the newly developed 30% thick airfoil towards the outboard part of the blades, leads to a rotor having aerodynamic efficiency very close to that of the baseline rotor. At the design tip speed ratio, the power coefficient decrease of the new rotor is around 0.3% in both static and dynamic conditions. In soiled conditions however, the large roughness sensitivity of the new airfoil results in a larger penalty in terms of power coefficient decrease. The power decrease due to soiled conditions is around 5% for the rotor implementing the new 30% thick airfoil, while it is around 2.5% for the baseline rotor (soiled conditions are here enforced over the last half of the blade).
Based on the reported calculations, the overall performance of the thick airfoil concept is judged to be promising in clean conditions. Under these circumstances, the power performance penalty is indeed limited. However, the large roughness sensitivity affecting thick airfoils might represent the bottle neck of their application at the outboard part of large blades.
Future research will focus on a more thorough assessment of the rotors, including ultimate and fatigue load analysis and the evaluation of the actual mass reduction achievable. Another possible developments of the current optimization approach is to include detailed information about the actual blade angles of attack and their probability distribution at earlier stage, during the airfoil optimization phase itself. For this reason, future work will be directed towards the integrated design optimization of the airfoil geometry and the blade planform. In this optimization framework, the objective function will be based on the power production in dynamic conditions, including load and soiled performance assessment.
Future work will also include performance validation of the new airfoil by means of experiments.
Footnotes
Declaration of conflicting interests
The author(s) declared no potential conflicts of interest with respect to the research, authorship, and/or publication of this article.
Funding
The author(s) disclosed receipt of the following financial support for the research, authorship, and/or publication of this article: The European Union’s INNWIND.EU project funded this work.