
Abstract
This article describes a multiphase computational fluid dynamics–based numerical study of the aeroacoustics response of symmetric and asymmetric wind turbine blade profiles in both normal and icing conditions. Three different turbulence models (Reynolds-averaged Navier–Stokes, detached eddy simulation, and large eddy simulation) have been used to make a comparison of numerical results with the experimental data, where a good agreement is found between numerical and experimental results. Detached eddy simulation turbulence model is found suitable for this study. Later, an extended computational fluid dynamics–based aeroacoustics parametric study is carried out for both normal (clean) and iced airfoils, where the results indicate a significant change in sound levels for iced profiles as compared to clean.
Introduction
Cold climate areas have good potential for wind energy, and combining these resources with typically low population densities make these areas suitable for wind energy development. However, icing on wind turbines is recognized as a hindrance limiting the wind energy production at elevated cold climate sites. Regions with heavy icing, where icing has a major impact on wind turbine performance and annual energy production contains 4% of installed wind turbines worldwide. Wind energy capacity is growing rapidly in the cold climates of the world. According to the latest foresight between 45 and 50 GW of wind energy, projects are planned to be built in cold climate regions (Mundo Solar, n.d.).
For cold climate operations of wind turbines, better knowledge of atmospheric ice accretion on wind turbine blade is critical in determining what geometric features of blade profile (airfoil) contribute to the performance degradation during ice accretion and how these may differ for other airfoils. Atmospheric ice accretion on wind turbine blade mainly occurs due to collision of super-cooled water droplets. These super-cooled water droplets may immediately or with some short delay change into ice on surface. Ice accretion on wind turbine blade profile can cause a change in its geometry such as an increase in camber, and change in airfoil nose radius and thickness which may cause a significant change in its aerodynamic performance. In terms of geometric properties, blade profiles (airfoil) can be divided into two categories: (a) symmetric and (b) asymmetric. Asymmetric blade profiles are curved differently along top and bottom sides, whereas symmetric airfoils have the same shape along both sides. Asymmetric blade profiles have increased lift-drag ratios and more desirable stall characteristics as compared to symmetrical airfoils. Blade profile geometry can also affect the ice accretion process along its surface similar to airflow and droplet behavior.
Wind turbines have certain aeroacoustic behavior that shows unique characteristics. Noise generated from wind turbine blades directly affects nearby residents. Noise associated with wind turbine can be influenced by the climate they are operating in. Ice accretion on wind turbines further complicates the aeroacoustics response of the blade profile. Out of all the aerodynamic noise mechanisms, airfoil self-noise is the one which is affected most by the ice accretion. Airfoil self-noise is dependent on turbine rotor blade specifications (airfoil geometry, angle of attack, etc.) and atmospheric conditions. In ice-prone cold regions, wind turbine operations become more challenging, as ice accretion on wind turbine blades changes its aerodynamics and affects the aeroacoustics that can possibly exceed the allowed noise limits by the regulators. Aeroacoustics of wind turbine blade is linked with the blade profiles geometry; therefore, aeroacoustics response of wind turbine blade can be different along the root and tip sections for clean and iced profiles.
There have been many studies about wind turbine noise generation. Fujii et al. (1984) measured the noise emitted by wind turbines having different tower leg cross-sectional shapes. The results showed that a cylinder elliptic cross section would be the quietest for the operating parameters considered. Brooks et al. (1989) reviewed previous research about airfoil self-noise and prediction. Björkman (2004) carried out long-time noise measurements near existing wind turbines showing an increase in the high-frequency range with the increase in wind speed. Oerlemans et al. (2007) used a microphone array to identify the virtual position of the noise sources. The conclusion was that, except a small contribution of the hub, the noise is mainly generated by the rotor blades and practically all noise emitted toward the ground is produced during the downward motion. Extensive measurements were carried out around the National Renewable Energy Laboratory (NREL) Phase VI turbine by Hand et al. (2001) and Schreck and Robinson (2004), giving a database for examination and comparison with numerical simulations. Mo and Lee (2011) used large eddy simulation (LES) turbulence model to simulate the aeroacoustics noise from the NREL phase VI wind turbine. However, they did not investigate audible frequencies in the range of 1–5 kHz, for which the human ear is most sensitive. Ewert and Schröder (2004) applied a hybrid method based on LES of compressible flow and acoustic perturbation equations to predict trailing edge noise. Morris et al. (2004) used computational fluid dynamics (CFD) approach to study several computational aeroacoustics (CAA) techniques that offer considerable promise for the prediction of noise from wind turbines.
Experimental measurements of wind turbine noise, however, have several limitations due to varying atmospheric conditions; the experiments are not repeatable and have to be carried out over a long time. It is difficult to isolate the contribution from different components of the wind turbine. CFD-based numerical approach can be a good alternative to better study and understand the aeroacoustics of wind turbine blade profiles. This article describes a multiphase CFD-based numerical study to better understand the aeroacoustics response of symmetric and asymmetric blade profiles for both normal and icing conditions. Numerical results of NACA 0012 for normal conditions are compared with the experimental data. Later, a CFD-based parametric study is carried out to analyze the effects of the ice accretion on symmetric and asymmetric profiles aeroacoustics response.
Numerical setup
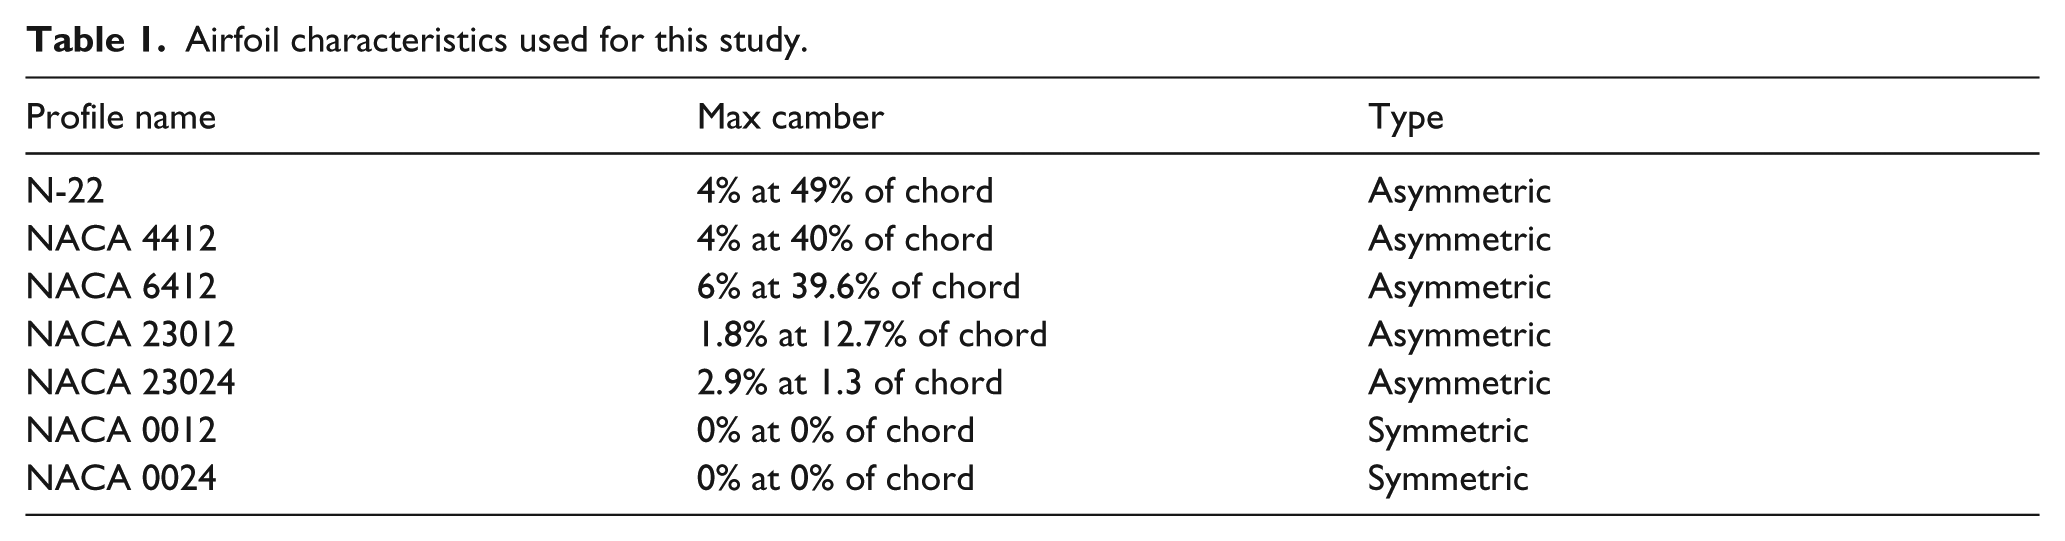
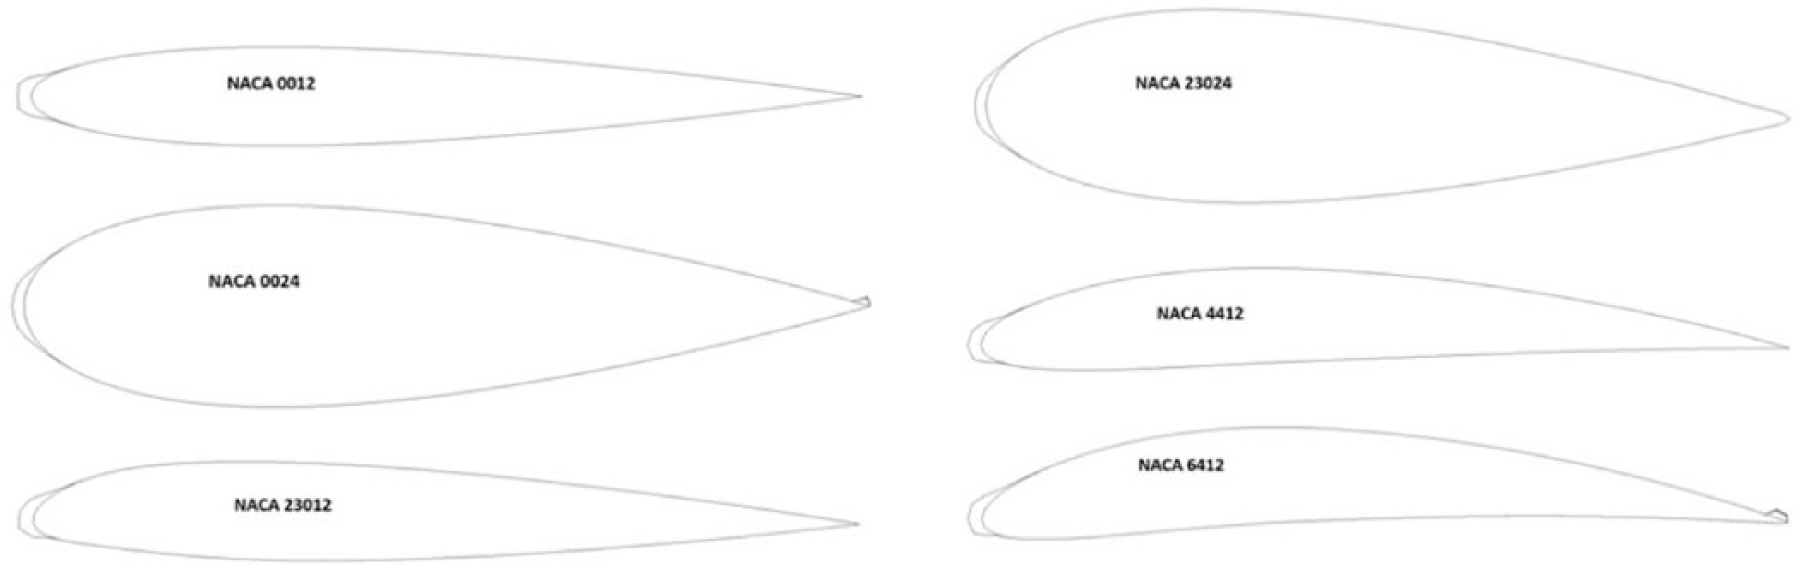
Symmetric and asymmetric blade profiles such as N-22, NACA0012, NACA0024, NACA4412, NACA 6412, NACA23012, and NACA23024 have been used in this study. Table 1 provides a list of airfoils used for this study.
Airfoil characteristics used for this study.
The multiphase aeroacoustics numerical study has been carried out using ANSYS FLUENT, whereas for simulating the ice accretion on profiles, FENSAP-ICE has been used. O-type structured numerical grid is used, whereas to accurately determine the boundary layer characteristics (shear stresses and heat fluxes) for iced profile, a y+ value less than 1 is used near the wall. The blade profile surface roughness height is calculated according to Shin et al. (1991). Three different turbulence models (Reynolds-averaged Navier–Stokes (RANS), detached eddy simulation (DES), and large eddy simulation (LES)) are used to make a compromise between acceptable computational cost and the required accuracy in simulating the turbulent flow in a previous work realized (Caicedo and Virk, 2017). Two-phase flow for icing simulations is solved using Eulerian approach, which consists of the Navier–Stokes equation, augmented by the water droplets continuity and momentum equations. The water droplet drag coefficient is based on the empirical correlation for the flow around the spherical droplets described by Clift et al. Langmuir-D type droplet size distribution spectrum is used for the ice accretion numerical analyses. Surface thermodynamic and icing rates are calculated using the mass and energy conservation equations, considering the heat fluxes due to convective cooling, evaporative cooling, latent heat of fusion, viscous heating, and kinetic heating. ALE (Arbitrary Lagrangian–Eulerian) formulation was used for the mesh displacement due to ice accretion in time. All the numerical simulations are carried out in the operating conditions specified in Table 2.
Operating conditions used for the simulations.
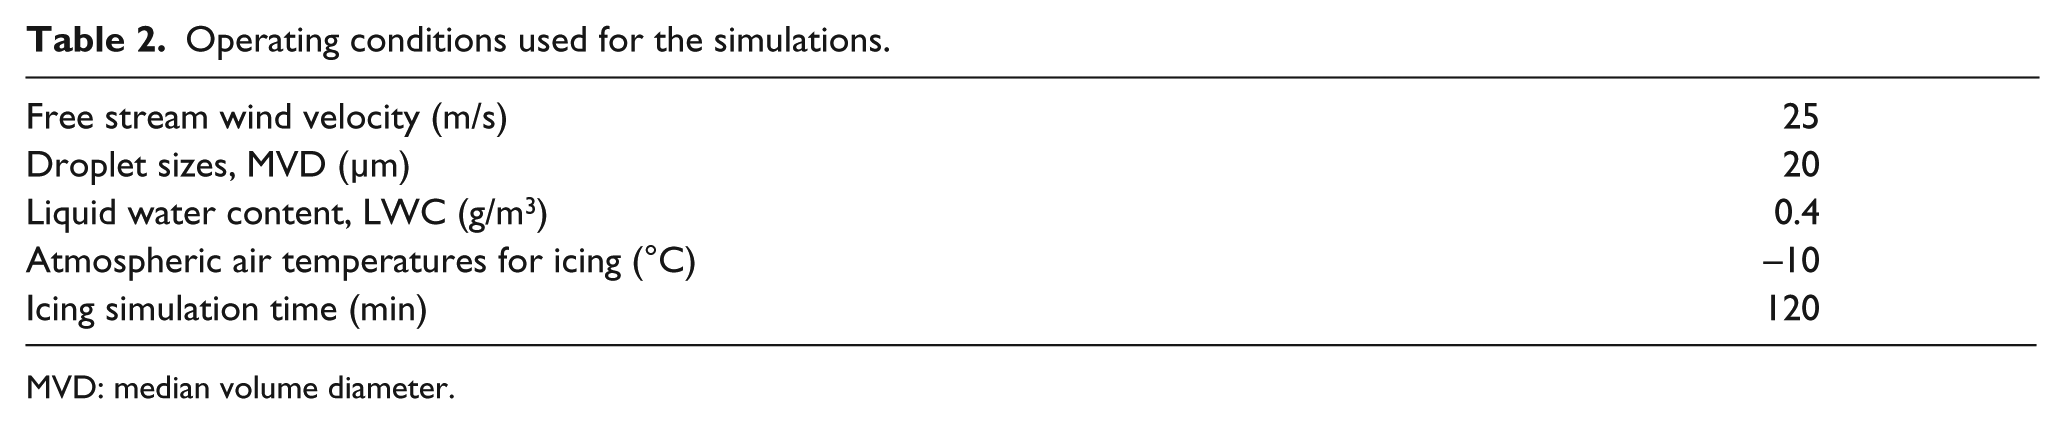
MVD: median volume diameter.
Same boundary conditions are used for normal and iced profiles (Figure 1). The interactive pressure implicit split operator (PISO) algorithm is used for the transient simulations, with the momentum and pressure equations solved using order central differencing scheme. Green-Gauss node-based method is used to evaluate the pressure gradient (Batinat et al., 1991). The time step is set to 1 × 10⁻⁶ in the simulations. This time step is found with a temporal resolution study. Acoustic tests are performed with seven 1.27-cm diameter microphones located in the plane perpendicular to the airfoil model mid span as shown in Figure 2. One additional microphone is located outside this plane. An ID number identified microphones, as M1 and M2, are perpendicular to the chord line at the trailing edge for geometric angle of attack equal to 0°, at a distance of 122 cm (100-cm chords lengths). Moreover, the pairs of microphones M3–M5 and M4–M6 are located at the same distance from the trailing edge, respectively, 30° forward and backward the pair of M1–M2. This is the same setup as used during experimentation by NASA as described in NASA report no 1218 (Brooks et al., 1989). Ffowcs Williams–Hawkings (FW-H) acoustic model is used in ANSYS FLUENT for this study.
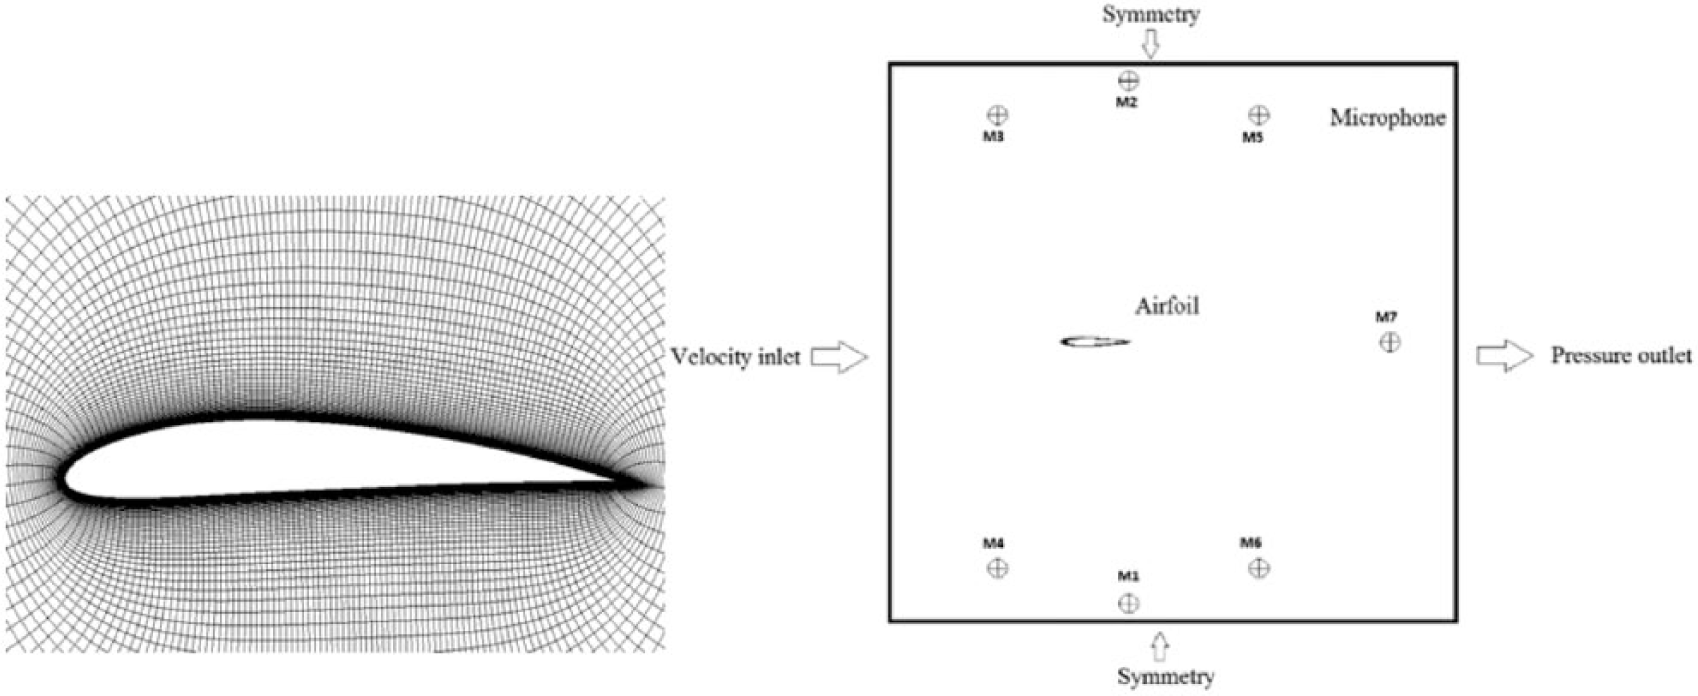
Structured mesh, boundary conditions, and microphones locations used for this study.
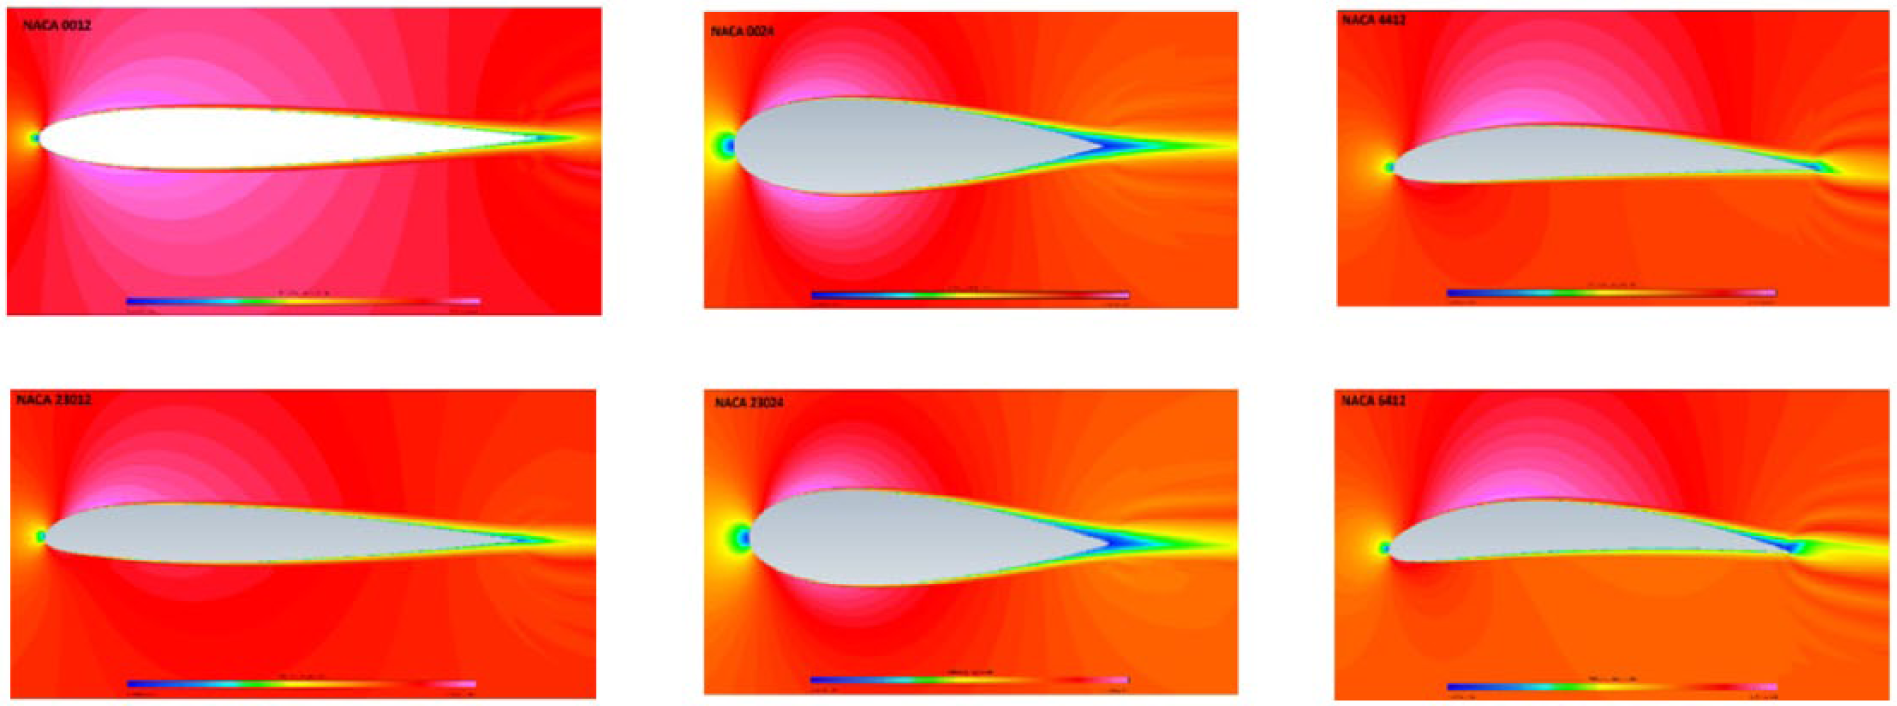
Velocity distribution along clean profiles.
Results and discussion
Numerical study of flow behavior around airfoils shows a significant change for iced and normal (un-iced) conditions, particularly in terms of flow separation and boundary layer turbulence structure. For normal conditions, the flow behavior over airfoils is more streamlined, and no significant flow separation is observed at 0° angle of attack for most of the profiles simulated. For iced profiles, numerical simulations for 120-min ice growth are carried out using FENSAP-ICE. During this study, seven different airfoils were used to better understand the aeroacoustics response in normal and icing conditions.
Airflow behavior
In this research work, study of airflow behavior shows a change for each airfoil. Normal pressure forces and tangential shear forces act on the surface of the airfoil due to airflow. Results show a higher air velocity along top surface of the asymmetric airfoils as compared to symmetrical airfoils. Figure 2 shows that velocity magnitude is same on upper and lower surface of symmetric airfoils, whereas in case of non-symmetrical airfoils velocity, magnitude is higher along cambered upper surface as compared to lower surface, particularly in case of N-22 airfoil, where lower surface of airfoil is almost flat.
Change in the airflow velocity along top and bottom surface of airfoil also affects the heat flux and shear stress distribution. Analysis show that in case of symmetric airfoils, total heat flux is equal on both sides of airfoil, whereas in case of non-symmetric airfoils more heat flux change is observed along upper surface of the airfoil, as compared to the lower surface. In case of N-22 airfoil, where maximum camber is at 49% of chord length, highest heat flux is observed as compared to NACA23012. Similar phenomenon is observed in case of surface shear stress distribution. Although NACA23012 showed the highest magnitude, largest upper surface area covered is observed in case of N-22 airfoil. This shows that airfoil camber influences the heat flux and shear stress distribution along the airfoil surface. Results from icing simulations show that ice is mainly accumulated at leading edge of the airfoils, which affects the stagnation point location and flow separation along pressure and suction sides. Thicker boundary layer profile is found in case of iced blade profiles, which also causes a significant change in the aerodynamic characteristics of the blade profiles for most of the airfoils used in this study.
Droplet behavior
Higher air speeds along upper surfaces of blade profile also affects the droplet behavior as increase in air speed increases the possibility of droplets collision with the airfoil surface because of domination of droplet drag over inertia. This results in more droplet collision along top surface of the airfoil as compared to the lower surface. Therefore, an increase in airfoil camber also increases the possibility of droplet collision along the airfoil surface, which can lead to an increase in resultant ice accretion. Figure 3 shows the droplet collision efficiency for each clean blade profile used in this study.
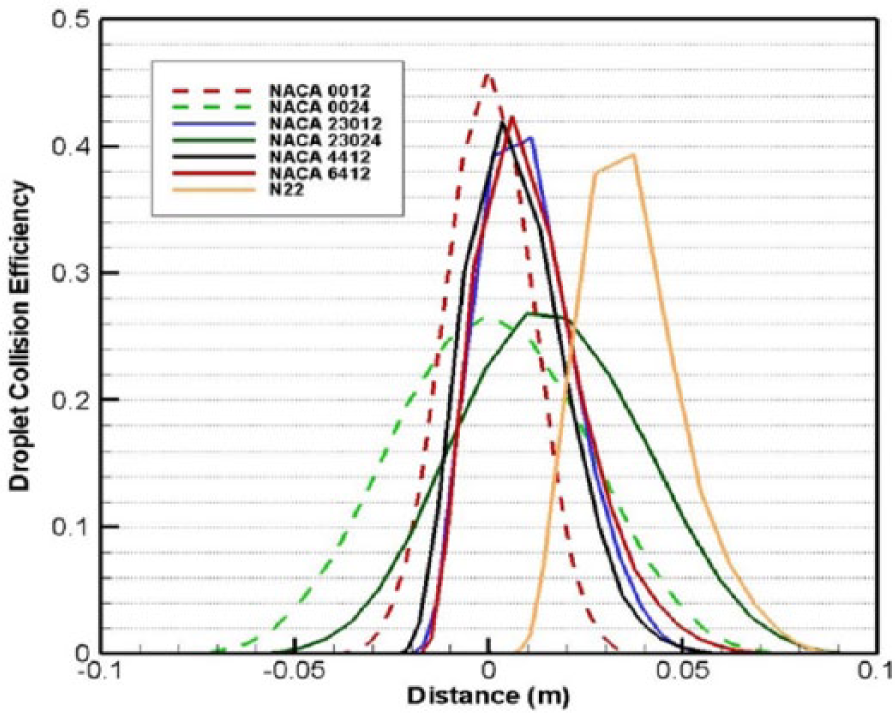
Droplet collision efficiency for clean profiles.
Ice accretion
Analysis about resultant ice accretion on each blade profile shows that in case of symmetric airfoil, more streamlined ice shapes are observed at Leading Edge (LE), which is mainly due to symmetric airflow and droplet distribution, whereas in case of non- symmetric airfoils, a non-symmetric distribution of ice is observed (Figure 4). More surface area is covered with ice along top surface of airfoil as compared to the lower surface of the asymmetric airfoils, whereas in case of symmetric airfoils, the distribution of ice along airfoil upper and lower surface is symmetrical. This change in the accreted ice shape is mainly due to change in airflow and droplet behavior. The distribution of ice along airfoil surface and resultant accreted ice shape is influenced by the camber and maximum thickness location along the airfoil surface, such as N-22 airfoil, where the maximum camber is 4% and located at 49% of chord length, and the resultant ice shape is different from the ice shape in case of NACA 23012 airfoil. This increase in airfoil camber and location of maximum thickness has resulted ice shape more tilted toward upper surface of the N-22 airfoil.
Ice accretion on blade profile.
Acoustic validation
The change in boundary layer flow behavior of blade profile affects the turbulence structure. More turbulent flow behavior and strong flow separation is observed in case of flow over iced blade profiles. Three different turbulence models (RANS, DES, and LES) are used to do a parametric study and select the suitable turbulence model for this study. Aeroacoustics response from each turbulence model for a wide range of acoustic frequency (200–20,000 Hz) is analyzed in comparison to NASA experimental data as described in NASA report no. 1218 (Brooks et al., 1989). Comparison with experimental data shows that DES and LES look good mainly for mid-range frequencies, whereas RANS with k-epsilon (re-normalisation group (RNG)) did not show a good agreement. Overall, DES turbulence model provided the best results in this regard. Figure 5 shows a comparison of these three turbulence models for NACA 0012.

Comparison of different turbulence models for clean NACA 0012.
From the clean NACA 0012 numerical study, DES turbulence model is selected for further iced airfoils aeroacoustics analysis and comparison. Results show a significant change in aeroacoustics behavior and resultant noise level for iced airfoil, when compared with clean profiles. This change in noise level is mainly because of change in boundary layer flow behavior and shear stresses due to ice. Figure 6 shows a comparison of acoustic response of iced and un-iced blades profiles. A significant increase in noise level is recorded after accumulation of ice.
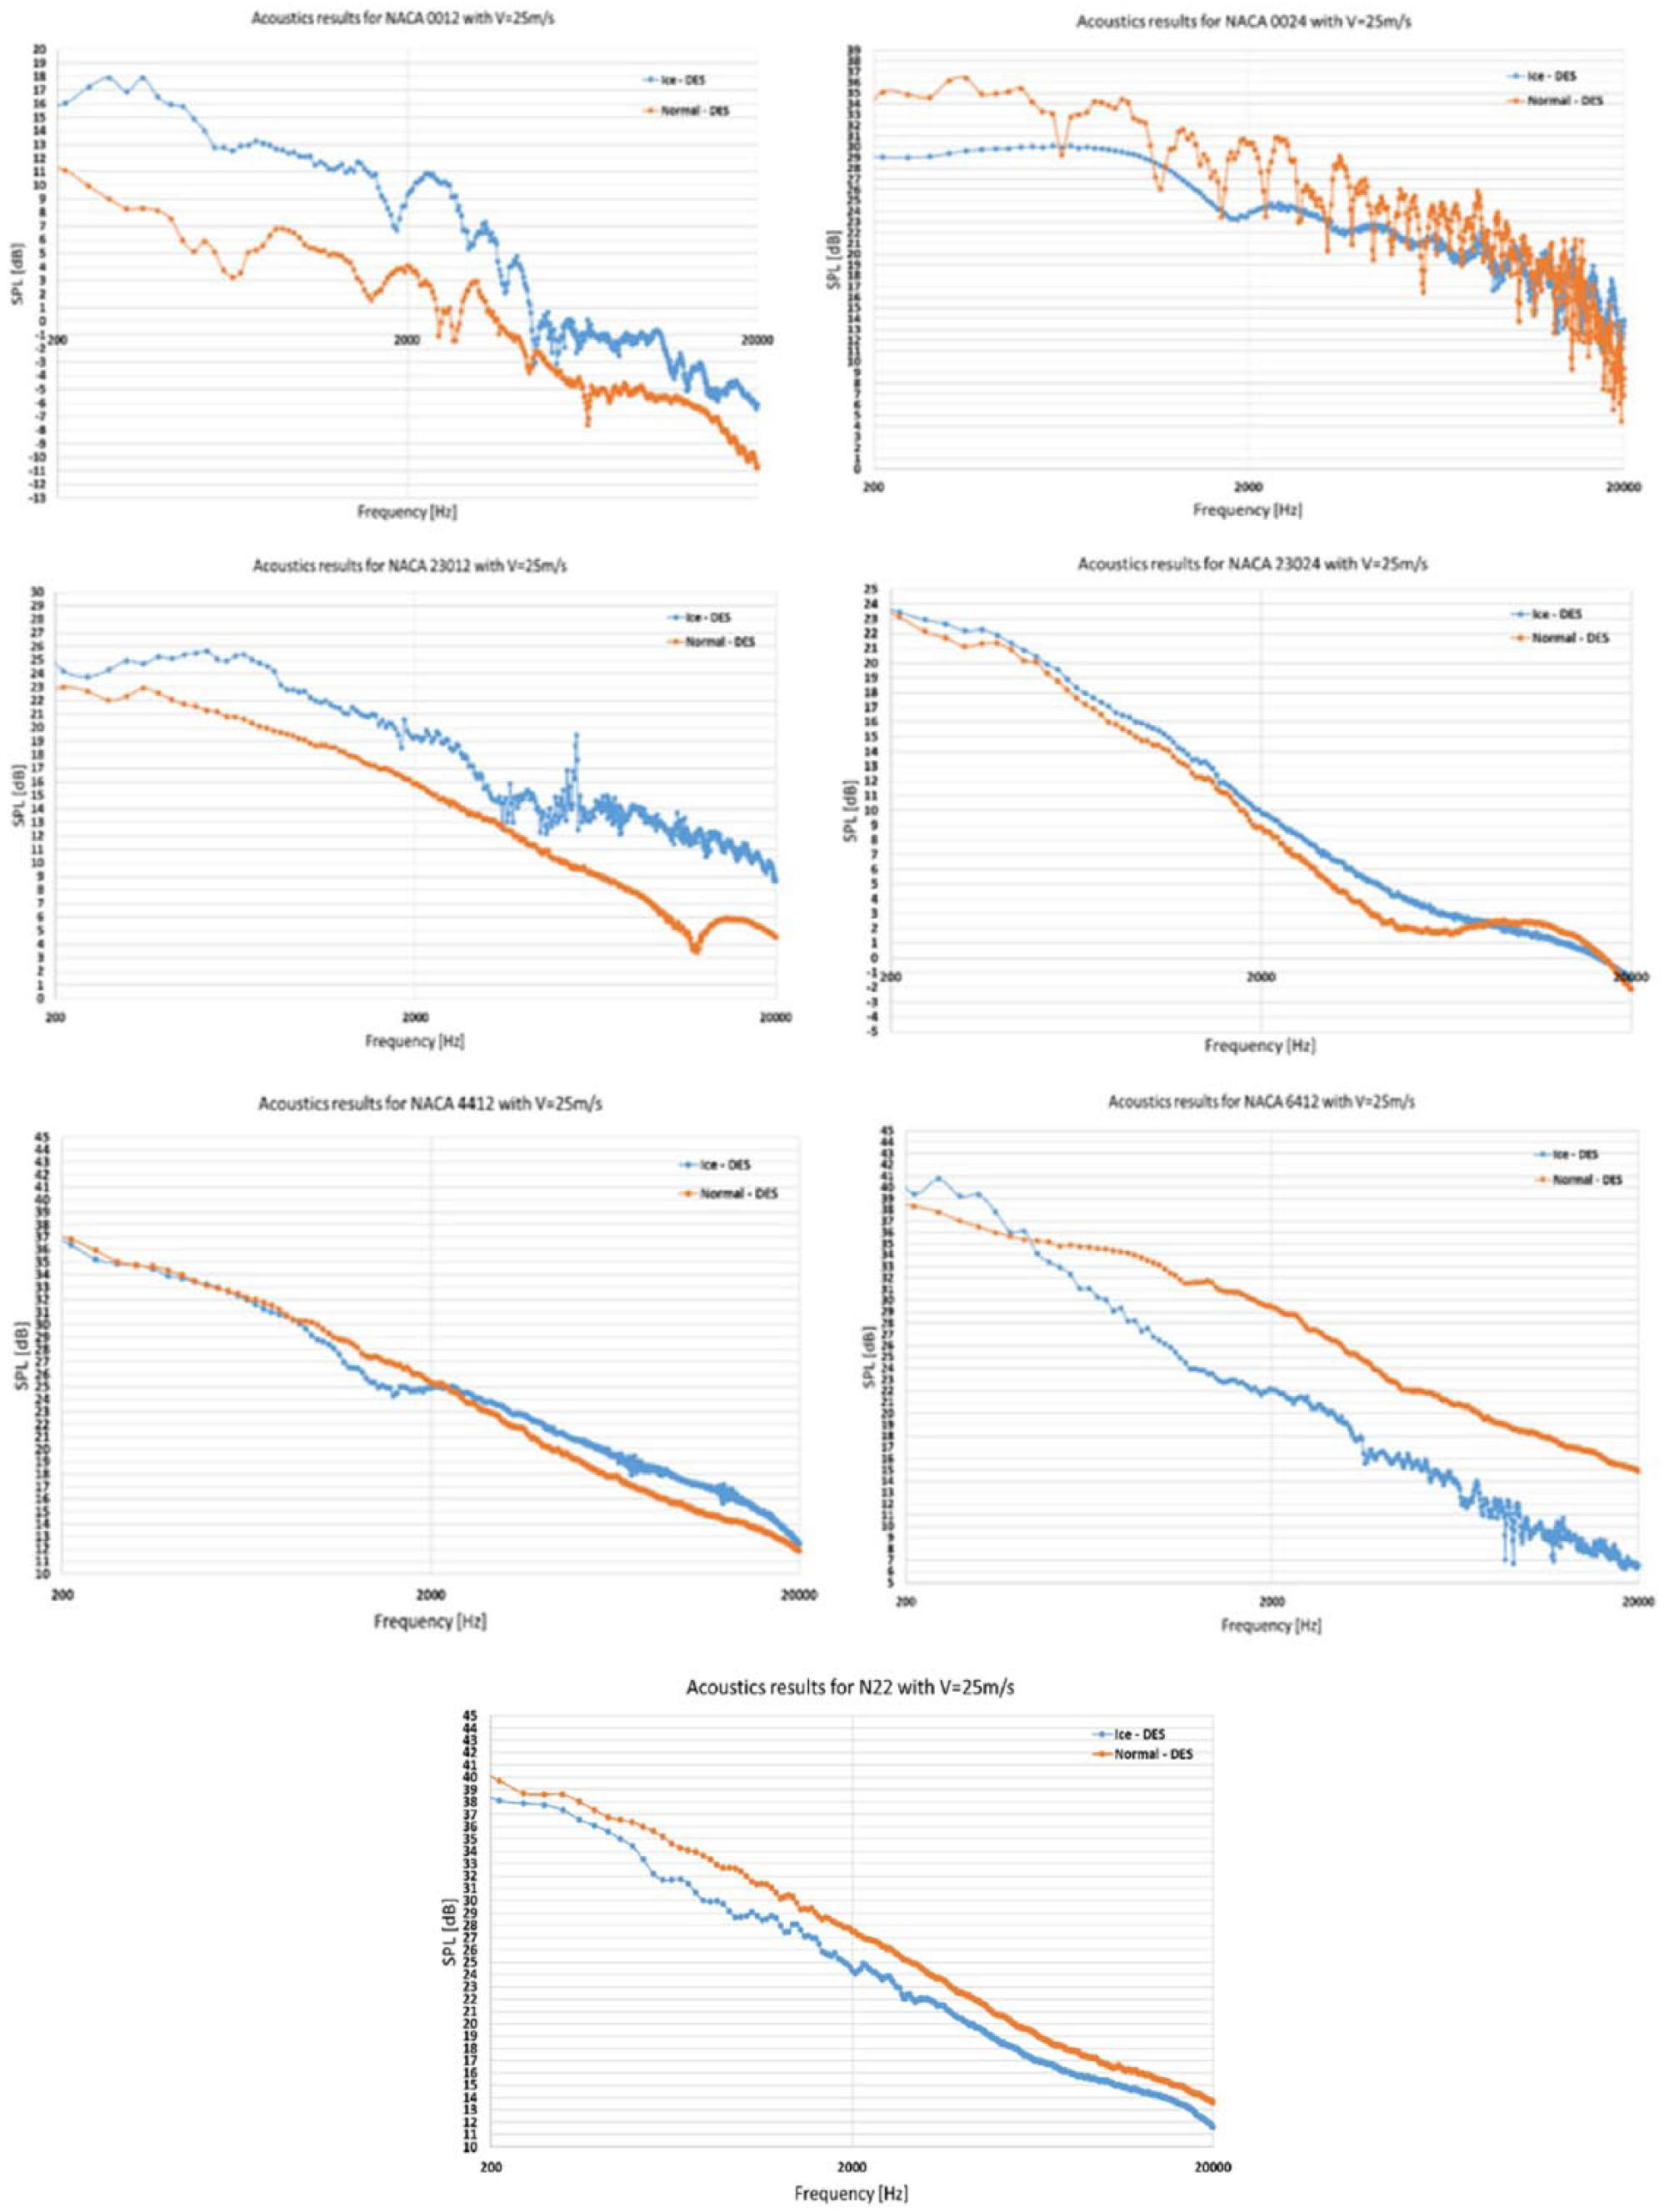
Comparison of acoustics response of iced and un-iced blade profiles.
Parametric aeroacoustics study
A detailed parametric CFD-based numerical study has been carried out using seven different blade profiles to better understand the aeroacoustics response of clean and iced blade profiles for a range of frequency. Figure 6 shows the comparison of iced and clean blade profiles used in this study.
Blade profiles with ice have more fluctuations in velocity that create more noise along most of the profiles. However, for the airfoils N-22, NACA0024, and NACA 6412, the results were the opposite to expect, where iced profiles had lower noise level as compared to clean airfoil. To better understand the aeroacoustics behavior, sound levels at individual microphones have been analyzed for both iced and clean airfoils. Figure 7 shows the change in acoustic level due to ice accretion for each microphone.
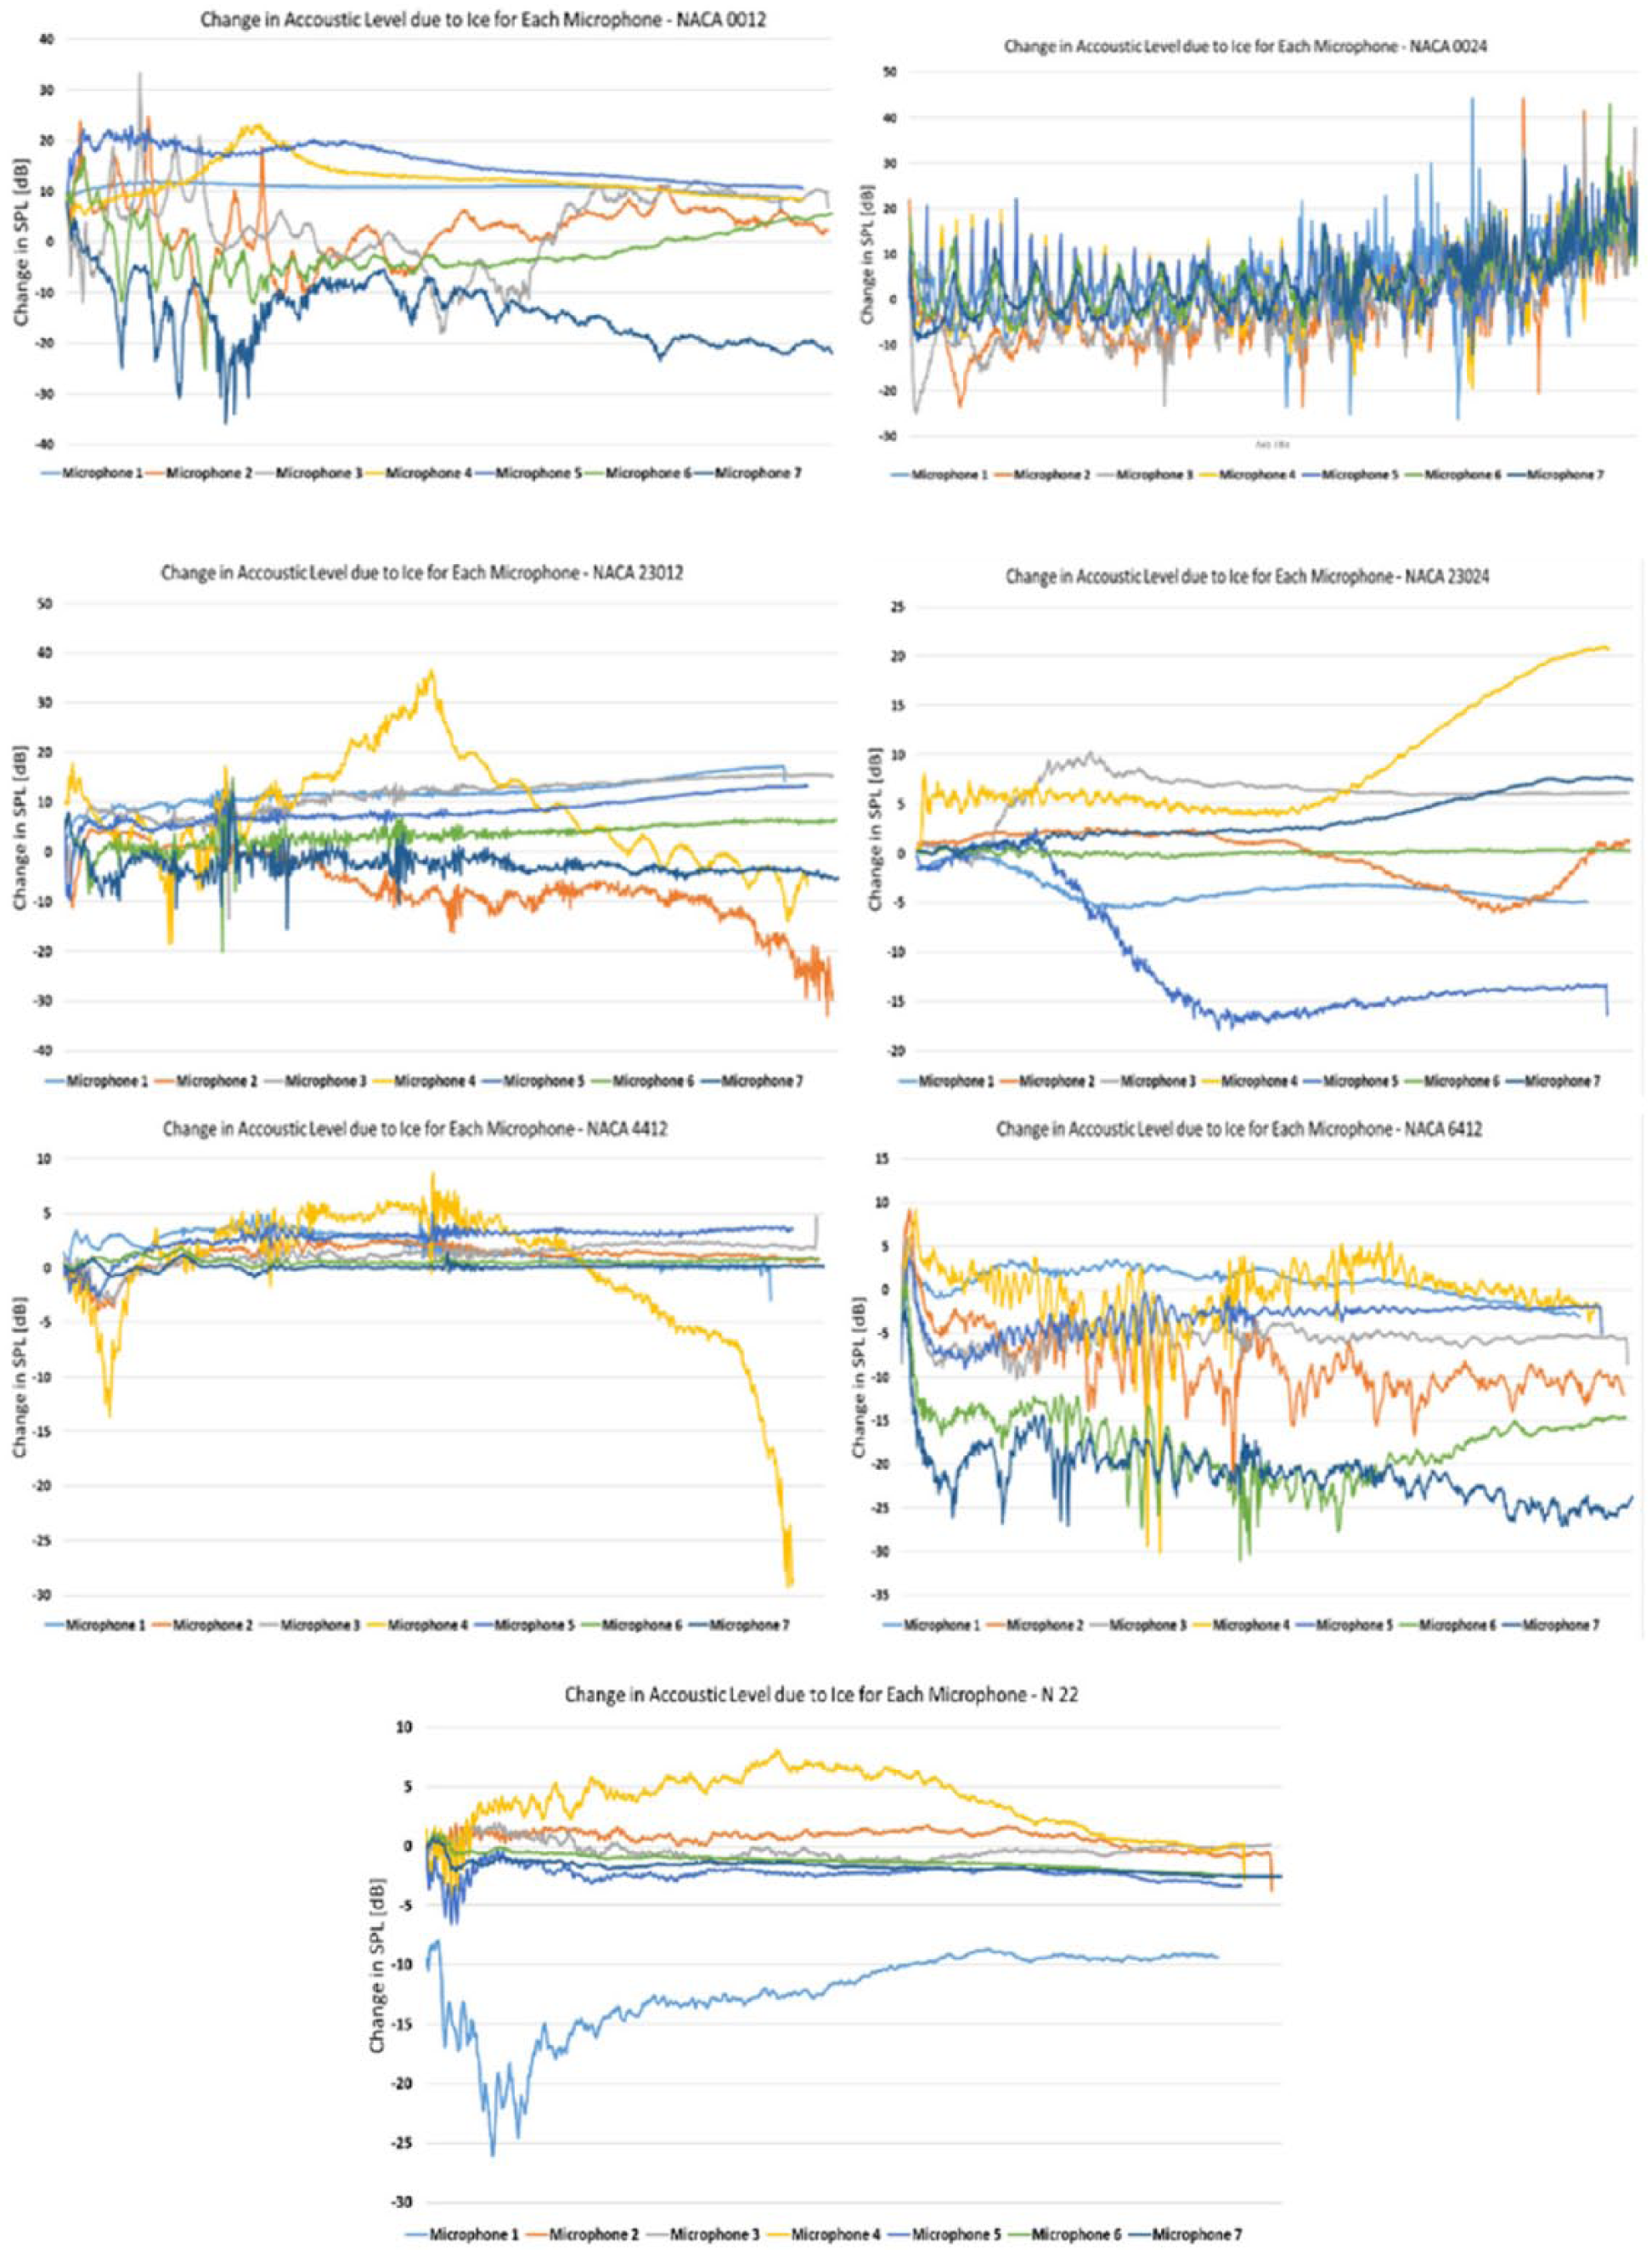
Comparison of acoustics level due to ice for each microphone.
Results show a higher sound in the microphones 1, 4, and 5 than the others because most of the noise is generated at the trailing edge of the profiles, and these microphones are located near the trailing edge. These variations in acoustic level due to ice for each microphones appear because the change in boundary layer flow behavior, particularly in terms of flow separation, is a significant change for iced and normal conditions. However, for the profiles N-22, NACA0024, and NACA 6412, the results were significant opposite await.
Conclusion
This preliminary multiphase numerical study to analyze the aeroacoustics response of symmetric and asymmetric profiles for normal and iced conditions has provided a base to further understand the basics of this topic, as not much work has been published on this topic by previous researchers. Analysis showed a significant change in aerodynamic characteristics of profiles after ice accumulation, which resulted in a change in noise generation. The summary of aeroacoustics results for normal and iced profiles is as follows: N-22 from 18.88 dB normal conditions to 17.06 dB iced conditions, NACA0012 from −4.63 dB normal conditions to −0.59 dB iced conditions, NACA0024 from 20.10 dB normal conditions to 19.33 dB iced conditions, NACA4412 from 17.15 dB normal conditions to 18.49 dB iced conditions, NACA6412 from 20.12 dB normal conditions to 12.44 dB iced conditions, NACA23012 from 8.37 dB normal conditions to 13.48 dB iced conditions, and NACA23024 from 2.90 dB normal conditions to 3.20 dB iced conditions. CFD-based analysis also provided a good insight of boundary layer flow behavior for both iced and un-iced profiles. Overall, this study shows a significant change in aeroacoustics response of iced airfoils when compared with the clean profiles. This knowledge will be further used to better understand the aeroacoustics of iced wind turbines.
Footnotes
Declaration of conflicting interests
The author(s) declared no potential conflicts of interest with respect to the research, authorship, and/or publication of this article.
Funding
The work reported in this research paper is funded by the WindCoE (Nordic Wind Energy Center) project, funded within Interreg IVA Botnia-Atlantica, as part of European Territorial Cooperation (ETC).