



Abstract
An efficient ice detection system is an important tool to optimize the de-icing processes in wind turbines operating in cold climate regions. The aim of this work is to study the application of guided wave for ice detection on wind turbine blades. Computational model is developed to simulate guided wave propagation on composite structures. The model has been validated with experimental data obtained in cold climate laboratory. Effect of ice accretion on composite structures is studied in the time, frequency and wavenumber domains. In each case, post-processing algorithms as well as icing index are introduced which are sensitive to accumulated ice on the composite structure. The algorithms and icing index are applied to both simulation results and experimental data. Analysis of the obtained results has shown that the guided wave–based approach can be used for developing ice detection systems for wind turbine blades.
Introduction
Ice accumulation is a well-known problem on wind turbines operating in cold climate regions. The accumulated ice on the blades causes various problems such as mechanical failure due to higher loads, aerodynamic change of blades behaviour, increasing drags, undesired vibrations and turbulences (Alsabagh et al., 2013; Homola et al., 2006; Parent and Ilinca, 2011; Rissanen et al., 2016; Virk et al., 2010). These problems cause up to 35% power loss in wind turbines (Etemaddar et al., 2014). Reduction in production, however, is not the only issue due to ice accumulation. Ice throwing is a problem that prevents the turbines to be installed close to residential areas or roads (Parent and Ilinca, 2011).
Methods of ice detection have been investigated before by different authors. An approach introduced by Davis et al. (2015) is based on power threshold curves used to distinguish an ice production period. Ghani and Virk (2013) developed an ice detection technique based on passive thermal infrared measurement and image processing. Liu et al. (2015) investigated the feasibility of characterization of ice types by measuring attenuation of ultrasonic waves. Furthermore, a detection method based on vibration measurement and analysis of power curve is introduced by Skrimpas et al. (2016). Other methods of detection are reviewed by Parent and Ilinca (2011) and Homola et al. (2006), and use of guided waves (GW) is introduced as one of the most promising methods.
The special characteristics of GW and their ability to propagate along long distances make them a suitable choice when it comes to non-destructive testing (NDT) and structural health monitoring (SHM) in elongated structures. Application of GW propagation for ice detection on isotropic plates has been previously introduced (Rose, 2004). Gao and Rose (2009) proposed a new model based on the analysis of GW propagation in multilayered structures to detect the ice. Using the model, they detected thickness and type of ice accumulated on an aluminium plate. In a more recent work, Zhao and Rose (2016) performed an experimental study on three different types of plates in order to detect the ice on them applying a tomography method. The method could identify ice spots on the plates.
Detection of ice on wind turbines blades, however, makes a different problem than in metals due to the blade’s anisotropy and high damping properties. Patches of ice, which are of interest to detect, can be larger than looked for in aircraft industry. Moreover, due to the large size of wind turbine blades, which in some cases can be up to 80 m long, and high damping properties, the frequency of excitation should be lower than in classical NDT methods. The method should be able to give as much information as possible about the accumulated ice. This can be thickness, location, amount and preferably type of ice. An accurate detection system which can measure these parameters can be used together with an optimized de-icing technique that requires them (Shajiee et al., 2013).
Processing the signal in GW propagation applications can be done in different domains. In the time domain, drop in the amplitude, mode conversion due to reflections, time of flight (ToF) and phase shift are parameters which can be investigated in order to detect damage on structures (Ng and Veidt, 2009; Ramadas et al., 2010). In the frequency domain, the Fourier transform (FT) of the signal is used to analyse the wave response (Alleyne and Cawley, 1992), and the wavenumber–frequency domain gives information about dispersion of waves and the relationship between wavenumber and frequency (Alleyne and Cawley, 1991; Ryden et al., 2004). Moreover, based on any of these domains, damage indices can be defined which give true or false information if there is any damage on the structure. The indices can be based on amplitude of the signal or ToF (Alleyne and Cawley, 1992; Yuan et al., 2008), signal energy (Michaels and Michaels, 2007; Qing et al., 2006; Wu et al., 2008), signal attenuation (Pierce et al., 2000) or statistical methods (Tibaduiza et al., 2015).
This article presents the results of continuation of study of GW propagation on composite structures with application to ice detection on wind turbine blades initiated in Shoja et al. (2015) and Berbyuk et al. (2014). The developed computational model to study GW propagation in the composite structure is presented in section ‘Computational model’. Experimental set-up and ice manufacturing technique which are used at the cold climate laboratory are described in section ‘Experimental study’. Results of simulations, experimental data, ice detection criteria, icing index (II) and model validation are subjected to section ‘Ice detection criteria’. This article ends with conclusion and outlook of future work.
Computational model
The numerical model is created by a finite element (FE) method to simulate the propagation of GW in a composite medium combined with an analytical method to handle the effects of temperature variations. To be able to use the developed model for various scenarios of ice accretion with reasonable solution time, it is simplified in several steps. In the following, the principles of the model and simplification procedures are explained.
Model principles
The importance of the FE-based model is to provide a method with reasonable accuracy to predict the results for several number of scenarios with low cost compared to experimental work. The model is time dependent, and the excitation is performed by a transient force applied to one node. The displacement field is the displacement of the nodes in each element, and the assumptions of linear elasticity are assumed. Next, the equation of motion is solved taking into account the material characteristics

where
Material properties of the glass fibre lamina.

The main challenge of solving a wave propagation problem using the FE method is to choose the right temporal and spatial resolutions in such a way that convergence is reached. The temporal resolution is the precision of a measurement with respect to time and is decided by the time step, ∆

where
The geometry which is used in this study is a
The plate is discretized with rectangular elements with four nodes and 6 degrees of freedom for each node. The elements are distributed uniformly along the plate. Similar to temporal resolution, the size of elements should be small enough so that the propagation of waves is spatially resolved. Previously, it was recommended to have 10–20 nodes per smallest wavelength (Alleyne and Cawley, 1991; Moser et al., 1999). The smallest wavelength is calculated by dividing the group velocity of the slowest wave mode by highest excitation frequency. In this study, 20 nodes per smallest wavelength is considered

where
The excitation signal is applied to the model as a tone-burst signal with five peaks. This kind of signal is widely used in GW applications due to its good signal strength and less dispersion over long propagation distances. Moreover, using this kind of excitation signal, it is possible to ensure that a limited part of the frequency spectrum is always excited (Lowe et al., 1998).
As mentioned previously, the aim is to propagate the waves through elongated structures with high damping. Therefore, the excitation should be applied with low frequencies and large wavelengths. However, the wavelength should be small enough to be able to detect a patch of ice on the structure. The excitation is applied to the middle of one side of the plate with
The received signal is collected from equally spaced 24 points which are located from 2 to 6 m from the excitation side and are called ‘measurement nodes’. The reason for collecting the signal at several points is to make it possible to process the signal more accurately.
Material homogenization
In order to reduce the complexity of the model, one way is to approximate the multilayered composite plate with a single-layer material with equivalent characteristics.
Assuming [Q] to be the stiffness matrix of a unidirectional lamina, it is possible to apply the fibre direction with respect to the global coordinate system by multiplying it with two rotational matrices

where

Here,
Effects of temperature
Since one of the aims of this study is to investigate propagation of waves in composite structure in cold climate conditions, the effect of temperature has to be taken into account. Previous studies have shown that a change in temperature is one of the main sources of fluctuations in the received signal (Mazzeranghi and Vangi, 1999). This effect is due to various parameters from thermal expansion of the material, change in stiffness of the material together with the effect of temperature change on piezoelectric materials including transducers and sensors and their bonds (Croxford et al., 2007).
The baseline signal stretch (BSS) method is a method to compensate the effects of temperature on the signal which is developed based on signal processing fundamentals (Croxford et al., 2007; Lu and Michaels, 2005). In this method, a signal in the time domain is stretched or compressed in such a way that it matches to another signal. Although BSS is a simple method with reasonable accuracy, it is previously shown (Shoja et al., 2016) that the method needs to be modified when it comes to composite materials.
Due to anisotropic characteristics of composite materials, the effects of temperature on symmetric and asymmetric propagating waves are different. In order to handle this effect, the recorded time signal is decomposed into sum of several wave packets with different wave forms and amplitude for symmetric and asymmetric modes

where

where
Previous work by the authors described BSS with mode decomposition in detail (Shoja et al., 2016). The method is applied to the results obtained by the FE model in this study in order to handle the effects of temperature on GW propagating in composite structures.
Modelling ice
The simplest way to model the ice geometry is to add an extra layer on top of the shell elements of the plate. The layer of ice can be modelled as solid or shell elements and the characteristics of contact should be defined between the layers. Previous work (Petrovic, 2003) has shown that ice structure has isotropic properties. Using a layer of isotropic ice on top of the anisotropic composite layer creates a multilayered plate and consequently leads to more computations. Since in this study the aim is to simplify the model, ice is defined by changing the characteristics of a number of elements where ice is placed.
Here, the stiffness matrix of the selected elements is defined as a combination of characteristics of the plate and ice

where

Here,
Material properties of ice.

Together with changing the characteristics of the selected elements, their shell thickness is also changed to a summation of plate and ice thickness. Figure 1 shows a schematic view of the shell model. Since different thickness, density and stiffness are applied to the icing region of the elements, equilibrium equations of plate theory are written with different characteristics and a reflected wave is created at the boundary to the composite plate. Moreover, by changing the characteristics of part of the elements, the stiffness and mass of the plate would be changed and group (and phase) velocity would be changed. These two changes are those which are expected to be seen when ice is accumulated on a plate. In order to verify the method, a comparison is made between the described shell model and a solid model with ice created as an individual solid layer. The solid model is discretized using hexahedral elements with four elements through the thickness of the plate and 6 degrees of freedom in each element. Thickness, location, length and other characteristics of ice are kept the same for both models. Comparison shows a reasonable agreement in the phase of the signal, and it can be used for further calculations; however, the damping has a larger effect in the solid model, and the change in amplitude is more significant (Figure 2).

Schematic top view of ice accumulation on a plate in the shell model.
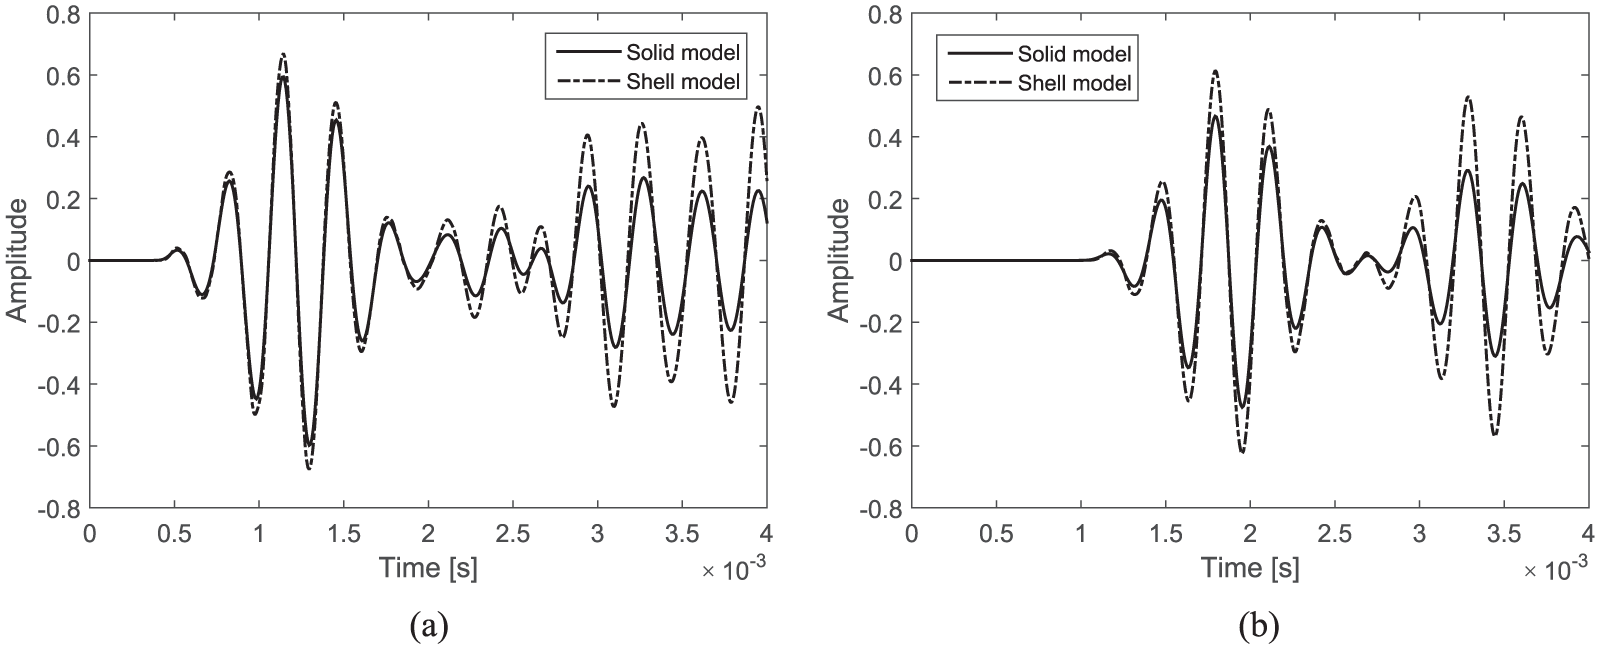
Comparison between the system response based on shell and solid model with ice accumulation recorded at (a) a node before the location of ice and (b) a node after location of ice at the room temperature.
Experimental study
Experimental set-up
An experimental study is done in a cold climate laboratory with the ability to change the temperature down to −25°C. The used plate is a rectangular glass fibre composite plate with Vinylester resin which is a type of a material which is used in the wind turbine industry.
The dimensions of the plate are the same as the geometry used in simulations, and it is excited by means of a magnetostrictive actuator using Terfenol-D with 5° angle of inclination (Figure 3).
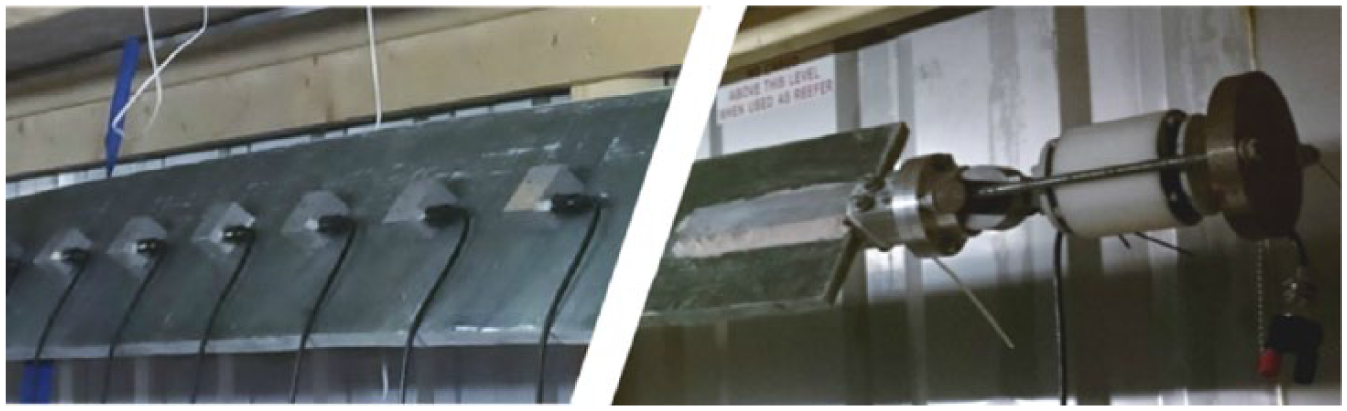
Transducer and accelerometers mounted on the plate.
Details about the design of the transducer are fully described in previous work (Berbyuk, 2007). The excitation signal is a tone-burst signal as explained above in section ‘Computational model’. The centre frequency of the excitation is changed between 3 and 7 kHz.
Measurements are done using piezoelectric accelerometers mounted inside aluminium cubes and glued equally spaced on the surface of the plate between 2 and 6 m from the excitation side. The accelerometers are mounted inside the aluminium cubes in such a way that they mostly measure the signal in the longitudinal direction (Figure 3). However, it is still possible to detect some portion of acceleration in other directions as well. The output of the accelerometers is an electric signal that is sent to a National Instruments data acquisition system for post-processing. Figure 4 illustrates a schematic view of the test set-up.

Schematic view of the test set-up.
Filtering the raw measurements in this experiment is challenging due to the fact that the noise frequency is close to the excitation frequency. In order to reduce the noise, each experiment is run 9 times, and the average value of all the time signals is calculated and considered as the received signal. The noise amplitude is decreased about

where
The data obtained by the measurements are used to calculate the dispersion curves. In order to minimize the effects of noise and reflections, a 2D fast Fourier transform (FFT) method(Alleyne and Cawley, 1991; Ryden et al., 2004) is applied on the time signal using all the accelerometers. A comparison between the dispersion data obtained by experimental measurements with the numerical model and analytical calculations at room temperature shows a good agreement (Figure 5). Methods to calculate the dispersion curves analytically is explained in previous work (Shoja et al., 2015).
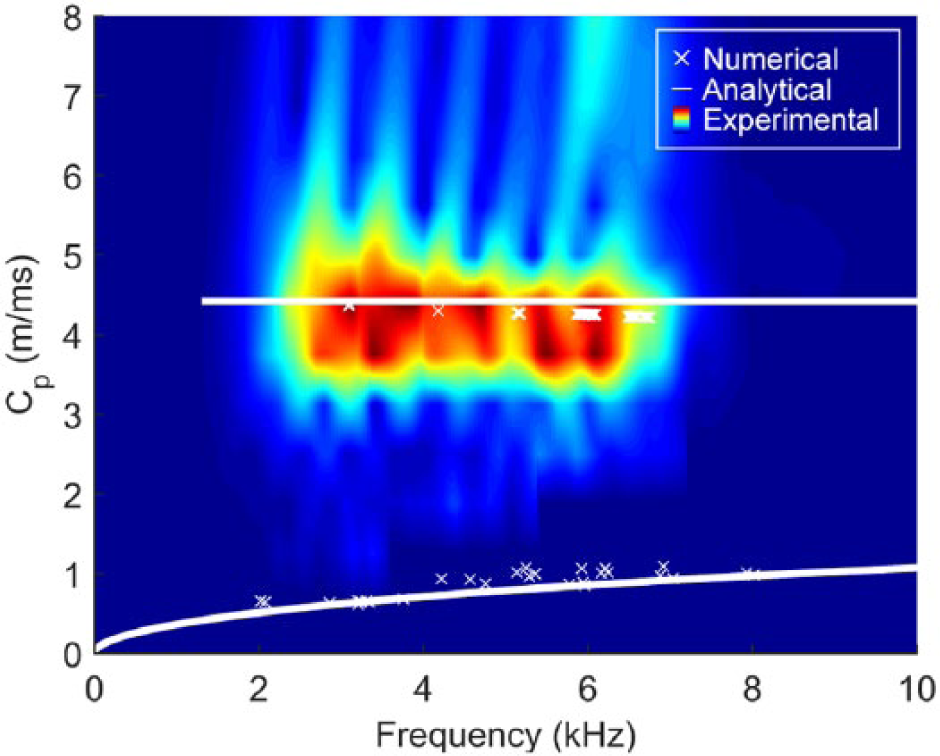
Comparison between the dispersion curves obtained using experimental data and numerical and analytical results at room temperature.
Ice manufacturing
Composite structures operating at low temperatures usually face three types of ice accretion. Clear glaze ice which is a transparent and homogeneous ice occurs when freezing water droplets hit the surface or water droplets freeze on the surface. White rime ice accumulates on the surfaces when droplets are frozen in the air and then hit the surface. It is also common that a mixture of both types of ice accumulate on the surface. Rime and glaze ice have different material characteristics. In general, it is possible to say that rime ice has lower density compared to glaze ice due its porosity.
Ice is manufactured by spraying water on the surface under low temperature in the cold climate laboratory. In order to manufacture rime ice, temperature should be lower than needed for glaze ice so the droplets freeze in the air. Moreover, the distance from the spraying device to the surface of test object is important. On one hand, larger distance helps the droplets to have more time to freeze before hitting the surface and create rime ice. On the other hand, the droplets remain liquid while hitting the surface for smaller distances from the test object, and they freeze on the surface which makes glaze ice (Figure 6).
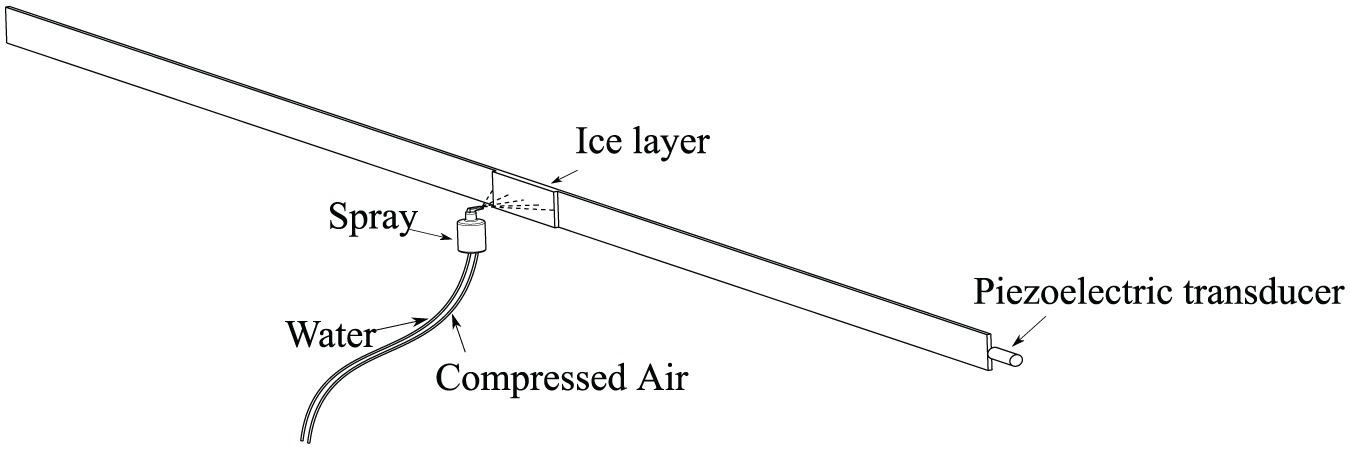
Schematic view of ice manufacturing set-up.
Since in this study, ice manufacturing is performed manually, the manufactured ice is a mixture of glaze and rime ice. A wind tunnel can be used in the future in order to control the process and manufacture two types of ice separately.
To validate the simulation results, ice is manufactured on the test object at the distance of 3.5 m from the excitation side. The length of the icing area is 0.5 m with 10 mm thickness (Figure 7).

Mixed glaze and rime ice manufactured on the plate.
Ice detection criteria
The aim is not only to confirm the existence of ice on the plate but also to obtain information about its thickness, length and location. Some methods which have been introduced previously for fault detection on composite structures are studied in this work. However, due to different physics of the problem, they need to be modified, and new algorithms of signal processing should be introduced. In this part, first, the characteristics of fluctuation in the signal due to icing conditions are studied by investigating the numerical results in the time, frequency and wavenumber domains. Moreover, an II is introduced in order to detect a patch of ice on the plate. The algorithms are applied on experimental data later for validation.
Wave reflection characteristics
Adding a layer of ice on top of the composite plate causes reflection of an incident wave when it reaches the edges of the ice layer. Figure 8 compares the received signal on all the measurement nodes before and after icing. The 10-mm-thick ice layer is situated between 3.5 to 4 m from the excitation side on the plate. Results show that the reflections are created from both edges of the ice layer. Reflection causes mode conversion from symmetric to asymmetric modes. The reflected asymmetric waves can be detected on the measurement nodes before and after the location of the ice patch. Moreover, the amplitude of the signal is fluctuating at the measurement nodes located under the ice layer.

Waterfall plot of the first symmetric mode in the time domain at 24 measurement nodes (a) without and (b) with ice accumulation at −25° C temperature and 5 kHz excitation frequency.
The location of the ice patch can be measured by detecting the reflected waves and calculating ToF. As shown in Figure 9, ToF has a linear relationship with location of ice on the plate at lower frequencies. Simulations are done by applying the excitation force with different centre frequencies.

Correlation between location of ice on the plate and ToF of reflected wave recorded at the first measurement node with excitation signals varying between 3 and 7 kHz at −25°C temperature.
Frequency domain
A comparison between the magnitude of the signal in the frequency domain for two cases of no ice and a layer of ice on the plate shows that it does not make a considerable change in the measurement nodes before and after location of ice. However, it decreases in the location of ice layer due to the change in the thickness. In order to magnify the difference between the baseline and current signals in the frequency domain, the frequency factor index (FFI) is introduced in equation (11)

where
Figure 10 illustrates contour plots of the FFI obtained by simulations using equation (11), and it shows a sudden raise at the location of ice accretion. However, it is important to know that reflections from the far end side of the plate can affect the results, and the current results are obtained before any creation of reflections from the plate’s far end.

Frequency factor index with respect to location on the plate when 5-mm-thick ice is accumulated between (a) 3 and 3.5 m and (b) 4 and 4.5 m on the plate at −25°C temperature and 5 kHz excitation frequency.
Wave velocity
Above it is shown that by adding an isotropic layer on top of an anisotropic one and calculating the dispersion curves, the wave velocity of the symmetric mode decreases. The reduction in wave velocity has a direct relationship with the thickness of the top layer, and a larger thickness causes more reduction in wave velocity of the propagating wave (Shoja et al., 2015). This characteristic of GW can be used for ice detection.
A parametric study is done by modelling a 0.5-m-long ice layer located at 3.5 m from the excitation side. The thickness of the ice layer is changed, and group velocity is measured using the detected signal in the first and last measurement nodes. Group velocity is calculated using a spectrum decomposition technique (Draudviliene and Mazeika, 2009). Figure 11 shows the variation of group velocity of the symmetric mode by changing the thickness of the ice layer. Reduction of group velocity is presented in the simulation results for all the excitation frequencies. Approximately, the same results are predicted for phase velocity due to the linear relationship of phase velocity versus frequency in the examined frequency range.

Variation of group velocity with respect to thickness of ice at −25°C temperature.
Icing index (II)
In this part, an index is introduced as II in order to detect the ice using only one measurement node on the plate. Assuming
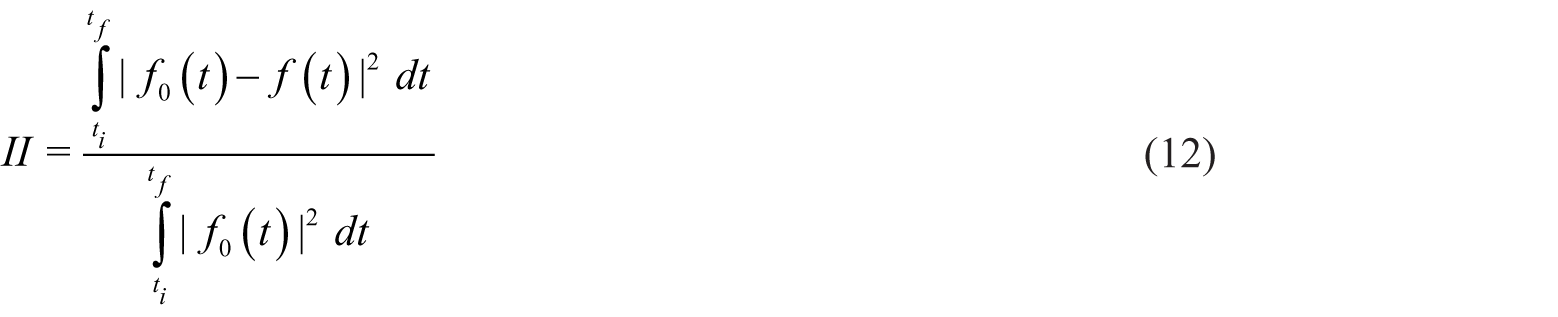
Here,
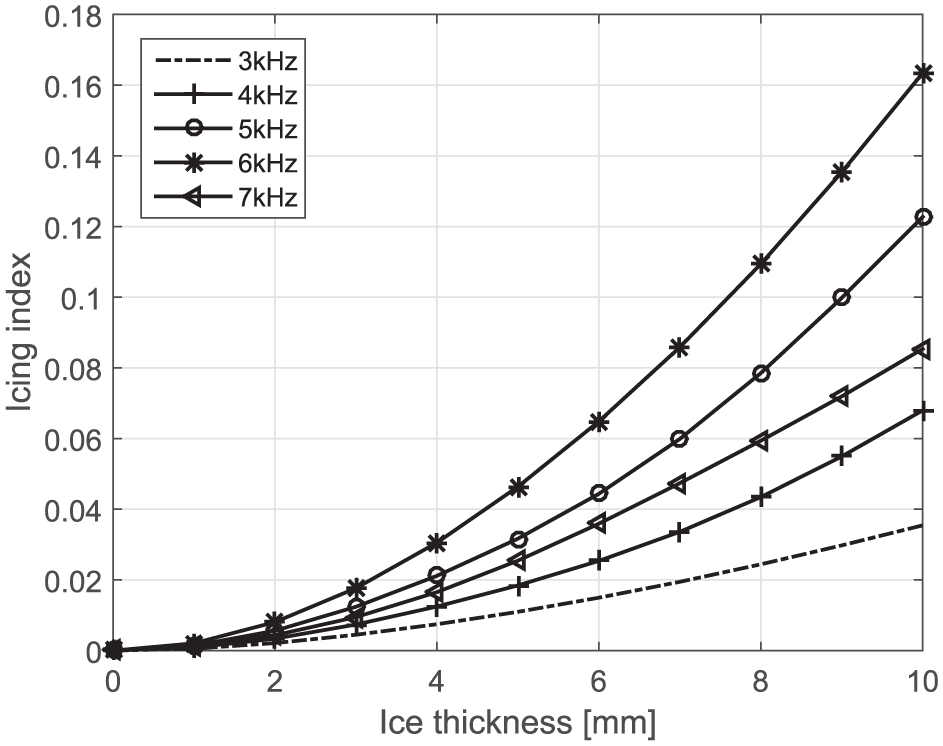
Variation of II with respect to thickness of ice at −25°C temperature.
Analysis of the obtained results gives evidence that the
Experimental results and validation
In order to validate the developed computational model and icing criteria introduced in previous sections, they have been applied on experimental data in the cold climate laboratory. Results show that the time-domain reflections due to the ice layer are not detectable in experimental data. Since the noise frequency is in the range of the excitation frequency, it is difficult to distinguish the reflected waves from noise. Low sampling frequency in the experimental work is also a reason which prevents the detection of the reflected waves in the time domain.
In the frequency domain, however, results show the location of ice with reasonable accuracy. Figure 13 shows a contour plot of the FFI obtained using equation (11) under icing conditions. The results show that the ice location can be detected accurately using this criterion.

Frequency factor index versus location of plate when ice is accumulated between 3.5 and 4 m at −25°C temperature and 5 kHz excitation frequency.
Dispersion plots are obtained by applying 2D FFT to the experimental data. Comparison is made between the no-icing and icing conditions at the temperature of −25°C. The results show reduction of phase velocity due to icing conditions, especially at the frequencies higher than 5 kHz (Figure 14). The reduction in phase/group velocity due to icing conditions is also observed in the simulation results and previously published works (Gao and Rose, 2009; Shoja et al., 2015).

Contour plot of dispersion relation when (a) no ice and (b) 10-mm ice is accumulated on the plate at −25°C temperature. White curves are fitted on points with magnitudes higher than 95% of the highest magnitude for better understanding.
A better resolution can be reached by increasing the number of accelerometers.
Conclusion and outlook
Application of GW propagation for ice detection on a composite structure is studied both by a computer simulations and experimental work in a cold climate laboratory.
The computational model is developed to study GW propagating in a composite structure when ice is accreted on a composite material. Shell elements are used, and the composite plate is homogenized to one orthotropic layer material. Ice is modelled on the plate by combining ice and laminate characteristics, and the effects of temperature variation on GW are applied to the model using BSS method with mode decomposition. The developed model is computationally efficient and went successfully through validation using experimental data.
The effects of ice accretion on propagation of GW are studied in the time, frequency and wavenumber domains, and several criteria are considered. Simulation results show the following:
Accretion of ice creates reflections which are detectable in all the measurement nodes distributed on the composite plate. The reflections are due to mode conversion from symmetric to asymmetric modes. The amplitude of reflected waves increase by increasing the thickness of ice, and the location of the ice layer is detectable by calculating ToF of reflected waves.
Magnitude of the signal in the frequency domain decreases at measurement nodes which are located at the place of ice because of thickness change. The FFI is proposed as an index to magnify the changes in magnitude of the signal in the frequency domain which makes it possible to detect the location of ice on the plate.
Group (and phase) velocity of incident symmetric wave reduces when ice is created on the plate. The attenuation is higher when the thickness of ice is increased and results are repeated for all excitation frequencies.
An II is also introduced for ice detection giving an output about the existence of ice on the composite plate using the signal of only one measurement node.
Finally, all the criteria are examined on experimental measurements when ice is manufactured on the plate. Results show that it is more difficult to detect small reflections due to ice accretion in the time domain because of noise and low sampling frequency. However, it is possible to locate the location of ice using FFI. Moreover, significant reduction in phase velocity is obtained when ice is manufactured on the plate, especially at frequencies higher than 5 kHz.
The results obtained show that application of GW is a promising method to obtain details about accretion of ice on a composite plate. The developed computational model, proposed criteria and introduced II can be used to create novel ice detection systems for wind turbines operating in cold climate regions.
GW is an efficient tool in inspection, detection and non-destructive evaluation, and the current approach can be developed in future for a multifunctional ice detection, de-icing and SHM system for wind turbine blades.
Footnotes
Acknowledgements
DIAB International AB is acknowledged for composite test samples supplied for the experimental study of ice detection in cold climate laboratory. The simulations were performed on resources at Chalmers Centre for Computational Science and Engineering (C3SE) provided by the Swedish National Infrastructure for Computing (SNIC). Mr Jan Möller is acknowledged for all the technical support in the experimental tests.

Declaration of conflicting interests
The author(s) declared no potential conflicts of interest with respect to the research, authorship and/or publication of this article.
Funding
This research is part of the project ‘Ice detection for smart de-icing of wind turbines’ which is funded by the Swedish Energy Agency.