



Abstract
Understanding the atmospheric stability conditions is important in order to obtain accurate estimates of the vertical wind speed profile. This work compares and evaluates common methods for estimation of atmospheric stability using standard meteorological mast observations. Atmospheric stability distributions from three different met-masts located at two coastal sites are calculated and compared. The atmospheric stability parameter, L is estimated using the bulk Richardson number, the surface-layer Richardson number, and calculated directly from eddy covariance flux measurements. The resulting distributions vary depending on which method is used. The atmospheric stability measurements from two masts located 3 km apart in similar terrain are compared directly. The highest correlation is found for the surface-layer Richardson number method. This method it also less sensitive to variation of measurement heights than the bulk Richardson number method.
Introduction
The stability of the atmosphere is known to influence the wind profile and turbulence conditions in the atmospheric boundary layer (ABL) (Lange et al., 2003; Pea and Hahmann, 2012). In wind power applications, accounting for the stability conditions is important for obtaining an increased accuracy of mean wind profile predictions (Barthelmie, 1999), wind turbine loads, and wake effects inside and between wind farms (Abkar and Port-Agel 2015; Jimnez et al., 2015; Sathe et al., 2013; Westerhellweg et al., 2014). Atmospheric stability also has a general geophysical significance (Monin and Obukhov, 1954).
In an unstable atmosphere, there is a large generation rate of turbulence caused by a positive vertical heat flux due to the ground or water surface being warmer than the air above. This leads to a convective, well-mixed surface layer with small vertical gradients. When the surface is colder than the air above, a stable boundary layer is formed near the ground, with a negative vertical heat flux which tends to reduce turbulence. The surface layer becomes stratified with large vertical gradients. During very stable conditions, mechanical shear stress is often the only significant source of turbulence production. If the vertical heat flux is near zero, or much smaller than the mechanical shear stress, the atmosphere is neutral. In the neutral boundary layer, buoyancy forces do not influence vertical mixing in the atmosphere (Emeis, 2013).
Different methods and parameters are used to describe atmospheric stability. The vertical virtual potential temperature lapse rate can be used as a description of static stability if the vertical temperature profile is known. Static stability, however, only indicates if buoyant forces will enhance or suppress convective circulation and does not depend on the vertical wind shear. Atmospheric turbulence is also mechanically generated by wind shear and inertial effects near the ground and the ABL may still be turbulent even if it is statically stable (Stull, 1988). Therefore, the ratio of the buoyant production to mechanical production of turbulence is expressed as a measure for dynamic stability through the Richardson number. Several formulations exist for the Richardson number, the most common being flux-, gradient-, bulk-, and surface-layer Richardson number. The flux Richardson number requires both heat and momentum flux and vertical wind speed gradient, and therefore, its application requires extensive instrumentation. The gradient Richardson number uses the vertical gradients of temperature and wind speed which could be estimated from profile measurements, while in practice, a finite difference approximation is used for the gradients. This formulation would sometimes be referred to as a bulk Richardson number since it represents a larger vertical extent rather than a point (Stull, 1988). The finite difference approximation could be made either linear or logarithmic, and Arya (1991) showed that while the former is better for stable conditions, the latter is superior for near-neutral and unstable conditions. A formulation of the Richardson number can also be based on only one wind speed measurement and the temperature difference between the air at one height and the ground or water surface. Arya (1988) and Grachev and Fairall (1997) call this the bulk Richardson number, while Zoumakis and Kelessis (1991) call it the surface-layer Richardson number. The inconsistent use of names and formulations in the literature can be confusing and makes comparisons difficult.
Another widely used method for estimating stability in atmospheric boundary layer research is based on measurement of vertical fluxes of heat and momentum using the eddy covariance method. We call this the sonic method and it requires accurate high-frequency measurements of vertical wind speed and temperature, usually using a sonic anemometer. For routine measurements, this method can, however, be both costly, more complex and less reliable. Previous comparisons of various methods can be found in the literature (Caadillas et al., 2011; Essa, 1999; Sanz Rodrigo et al., 2015).
For site assessment, it is often desirable to estimate bulk atmospheric stability from available routine met-mast measurements at a site where flux measurements are not available. The location of sensors may differ from mast to mast, and the choice of measurement heights and formulations may influence the resulting stability distributions. This study presents atmospheric stability measurements from two coastal sites obtained using the three methods presented above. Different measurement heights are compared for the Richardson number formulations in order to evaluate the influence of sensor location.
The two sites used in this study are both representative of a coastal climate. Especially interesting is the correlation of stability obtained using different methods between two masts at the Roan site. The masts are located 3 km apart and with similar surface roughness and terrain conditions. In the literature, no general guidelines for experimental setups are found for calculation of the Richardson number in the atmospheric surface layer, and measurement heights will vary between campaigns depending on available instrumentation. At the sites included in this study, data from 100-m-high masts with both two-dimensional (2D) and three-dimensional (3D) sonic anemometers at several heights were available, enabling the comparison of different expressions for the Richardson number and the sonic method to evaluate atmospheric stability.
Measurement sites
The sites Frøya and Roan are located on the coast of mid-Norway as indicated in Figure 1. The mast at Frøya is located approximately 110 km south-west of the two masts at Roan which are 3 km apart. In Table 1, the instrumentation of each mast is given with their respective accuracies and instrument heights. The two masts at Roan are equally instrumented. The mean wind and temperature conditions at each site during the measurement campaigns are given in Table 2.
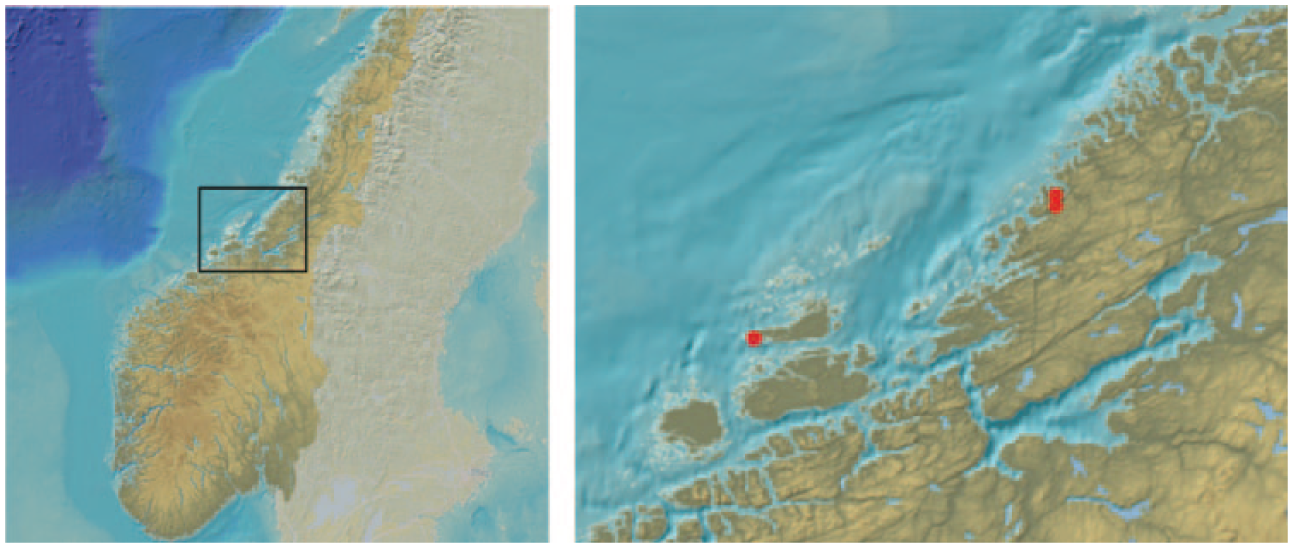
Maps showing the location of the meteorological masts at Frøya and Roan on the Norwegian coast.
Mast instrumentation.
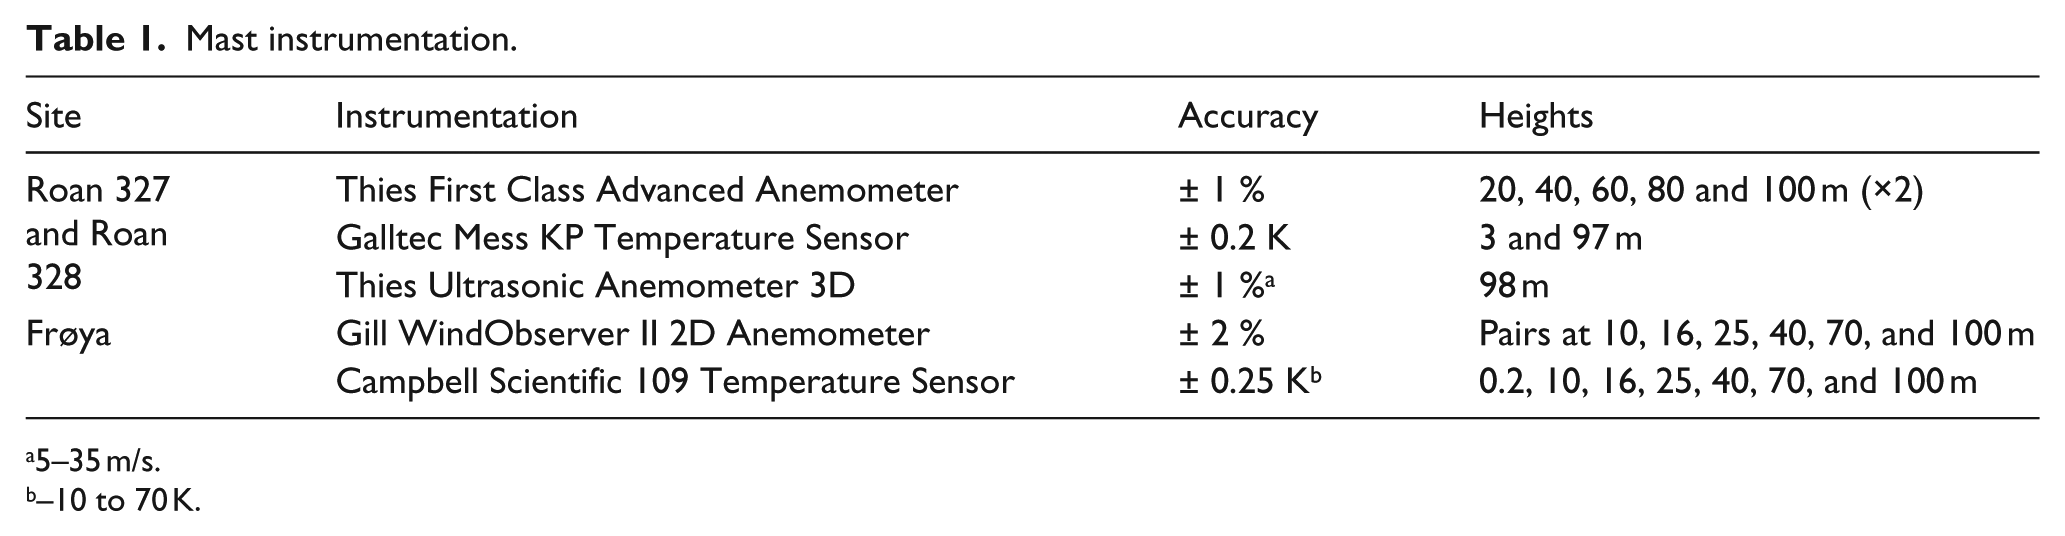
5–35 m/s.
–10 to 70 K.
The measured mean wind speeds, turbulence intensities, and temperatures at the sites.

Frøya measurement site
The met-mast is located on the south-west tip of the Frøya Island, which is exposed to winds both from the Norwegian sea and the mainland. The mast is located approximately 20 m above sea level and is 100 m high. Pressure and humidity are not measured at this site, so data from the nearby meteorological station Sula are used for this. The station at Sula is located 5 m above sea level on an island approximately 20 km north-east of Frøya and is assumed to be representative for the mesoscale meteorological variations at Frøya.
Nearly 2 years of data, measured between November 2009 and October 2011, are available from Frøya. The data availability during this period is 93%. Figure 2 shows the wind rose at the site with a majority of the wind coming either from SW or NE, parallel to the coast line. The distance to the sea is different in each direction sector and is between 500 m and 3 km in the prevailing wind direction with the strongest wind speeds, SE. The landscape at the site is relatively flat and dominated by marsh and heather. Except for a small wind turbine in the 22.5° direction, there are no nearby obstacles that influence the wind measurements. The roughness length is divided into eight sectors and calculated from the mean and standard deviation of wind speed at 10 m (Beljaars and Holtslag, 1991). The mean roughness length at the site is 0.01. A more thorough description and assessment of this site are offered by Øistad (2014).

Wind rose from Frøya at 100 m height (642 days).
Roan measurement site
At Roan, measurements from two 100-m-high masts are available. They are located approximately 3 km apart in a mountainous complex terrain. The Norwegian Mapping Authority has classified most of the area surrounding the masts as “open area,” commonly given a roughness length of 0.03 (e.g. Weir, 2014), which is the value applied in all direction sectors for the two masts at Roan. The topography around the masts is shown in Figure 3.
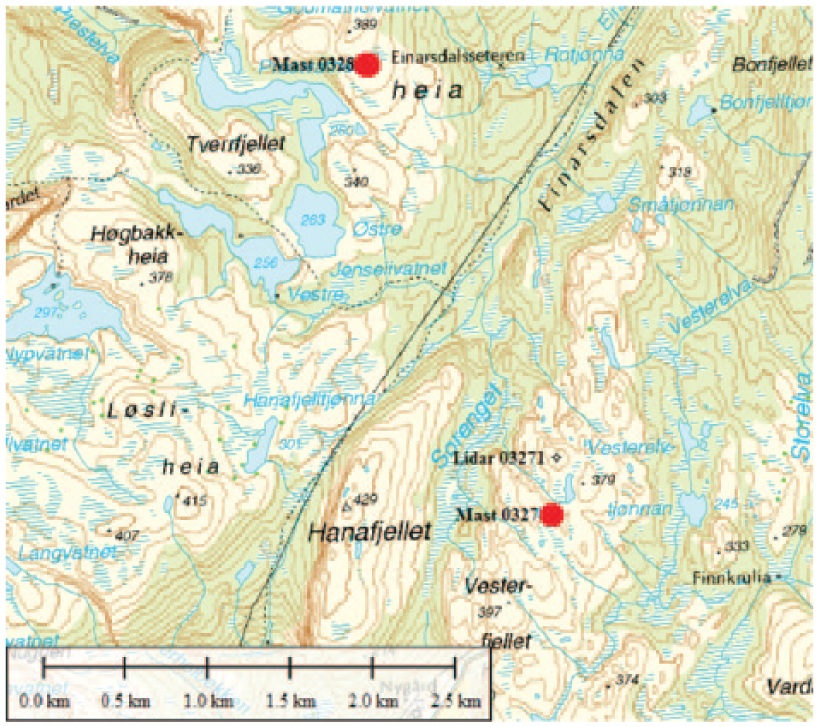
Map showing the topography around the Roan masts, marked with red dots (image reproduced with permission of Meventus).
Roan 327
This mast is located on a peak in a mountainous area at an elevation of 365 m, and Figure 4 shows the wind rose at 100 m. There are two predominant wind directions, W and SSE. In the western direction, the distance to the sea is 7.5–9.5 km, while winds from SSE are coming from the inland. Approximately 1 year of data, measured between December 2014 and December 2015, is available from Roan 327, and the sonic anemometer was operational between March 2015 and December 2015.

Wind rose from Roan 327 at 100 m height (320 days).
Roan 328
This mast is located at an elevation of 365 m, near the peak of a mountainous area. The wind rose in Figure 5 shows that winds from SE are less frequent here than at Roan 327. The distance to the sea in the dominating wind direction, west, is around 6 km, when sea is defined as being outside two small peninsulas. Winds from SE are coming from the inland. Approximately 1 year of data, measured between November 2014 and December 2015, is available from Roan 328, while the sonic anemometer was operational only for 1.5 months, from 15 April 2015 to 31 May 2015, before it was struck by lightning.
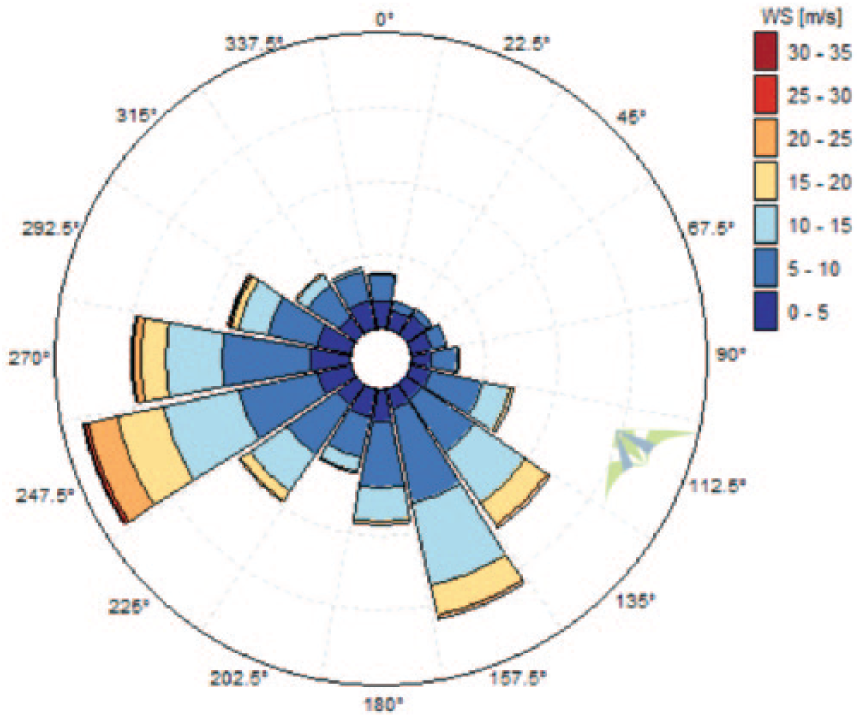
Wind rose from Roan 328 at 100 m height. (348 days).
Methodology
Atmospheric stability is described in Monin–Obukhov similarity theory (Monin and Obukhov, 1954) with the length scale L as the stability parameter. This length scale was first introduced by Obukhov (1946) and is a measure of the relative importance of buoyant and mechanical effects on atmospheric turbulence

The bulk Richardson number
L is estimated from the bulk Richardson number

which is applicable at the geometric mean height

where
The surface-layer Richardson number
Using only the wind speed at one height and the mean temperature gradient between this height and the ground, we obtain a formulation here called surface-layer Richardson number

which is applicable at the arithmetic mean height
Relating Richardson number to the Monin–Obukhov stability parameter
From the Monin–Obukhov similarity theory, the dimensionless wind shear and potential temperature gradients can be expressed by


where

The general empirical relations for

and from Arya (1988)

The non-dimensional gradient formulations of Businger and Dyer are considered accurate only for limited range of Ri (Högström, 1988). In stable conditions, the relations are only valid for
Sonic method

where the friction velocity is calculated as
Stability classification
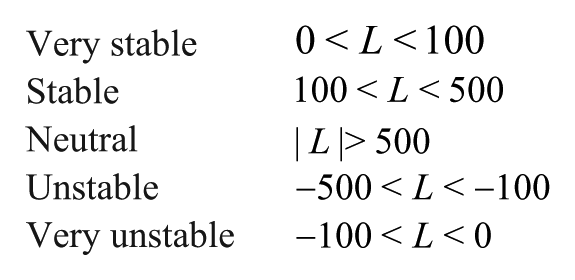
The sorting of Obukhov length into stability classes will affect the stability distribution of a site. Also here, there is no common approach in the literature. Golder (1972) created nomograms for classification of stability depending on roughness length. Many authors make the division into stability classes without any reference or discussion. In this study the symmetrical stability classification of Obukhov length used by Gryning et al. (2007) is adopted and combined into five symmetrical bins.
Data processing
The pressure at all sites is corrected for height according to ISO 2533 (International Organization for Standardization, 1975). At the Roan sites, the temperature was only measured at 3 and 97 m above ground level. Therefore, the temperature at the lower heights has been linearly extrapolated/interpolated to 0 and 20 m for the surface Richardson and bulk Richardson methods, respectively. The temperature gradient is often largest close to ground (Larsen, 1993; Stull, 1988), and assuming a linear variation with height is a rough estimate that leads to large uncertainties, especially because the Richardson number is dependent on accurate temperature values, as discussed above. The comparison between the bulk and the surface-layer Richardson method at Roan 327 thus becomes a comparison of formulations where the physical ground effects are not included. An alternative to this could be to extrapolate the wind speed down to 3 m height where the temperature is measured, but this will also involve large uncertainties with no prior knowledge of stability.
The Richardson number is very sensitive to small variations in temperature, requiring calibrated temperature sensors. Golder (1972) comments that the errors in the measurement of the wind at two levels can cause great errors in the Richardson number as well, resulting in a larger scatter for the inaccurately measured data. In order to reduce the impact of measurement uncertainty, temperature sensors should be mounted so far apart that the atmospheric temperature gradient will be dominating over the uncertainty. In addition, the use of several sensors to determine the temperature profile is also helpful to identify and sort out potential measurement errors.
Monin–Obukhov theory is only strictly valid for uniform horizontal flow within the surface layer (Monin and Obukhov, 1954). A rough method for filtering out the measurements where the surface boundary layer height was below 100 m has been considered, but would result in a biased stability distribution. In order to assess the influence of surface layer height on the stability distributions, the Richardson number was calculated based on four different upper levels (25, 40, 70, and 100 m). Furthermore, the assumption of a horizontally homogeneous surface layer is not fulfilled in complex terrain. This means that the theory is not strictly valid for the complex sites at Roan where the topography creates local variations of wind speed near the ground.
All data from the masts are 10-min mean values except for the pressure and relative humidity data from Sula which are 6-h sample values. At the top height of all three masts, there are two boom-mounted anemometers mounted in opposite directions allowing measurements from an upstream anemometer to be used at all times. For the lower heights at Roan where only one anemometer is available, a 45° sector has been filtered out in order to avoid any flow distortion caused by the mast.
Results and discussion
Comparing the normalized distributions of atmospheric stability obtained using different methods over a reasonably long time period will show how one method is biased compared to another. Since the methods are based on different measurements, there are both methodological and physical causes of the differences found. Figure 6 shows the atmospheric stability distribution at Frøya for the surface-layer Richardson method, and Figure 7 shows the distribution for the bulk Richardson method. The upper measurement level is varied between 25 and 100 m, so the effective height of the calculated Richardson number is also different. The black curve in the plots shows the distribution of data in the bins. The distributions are taken from concurrent measurements and consist of 144,829 data points.
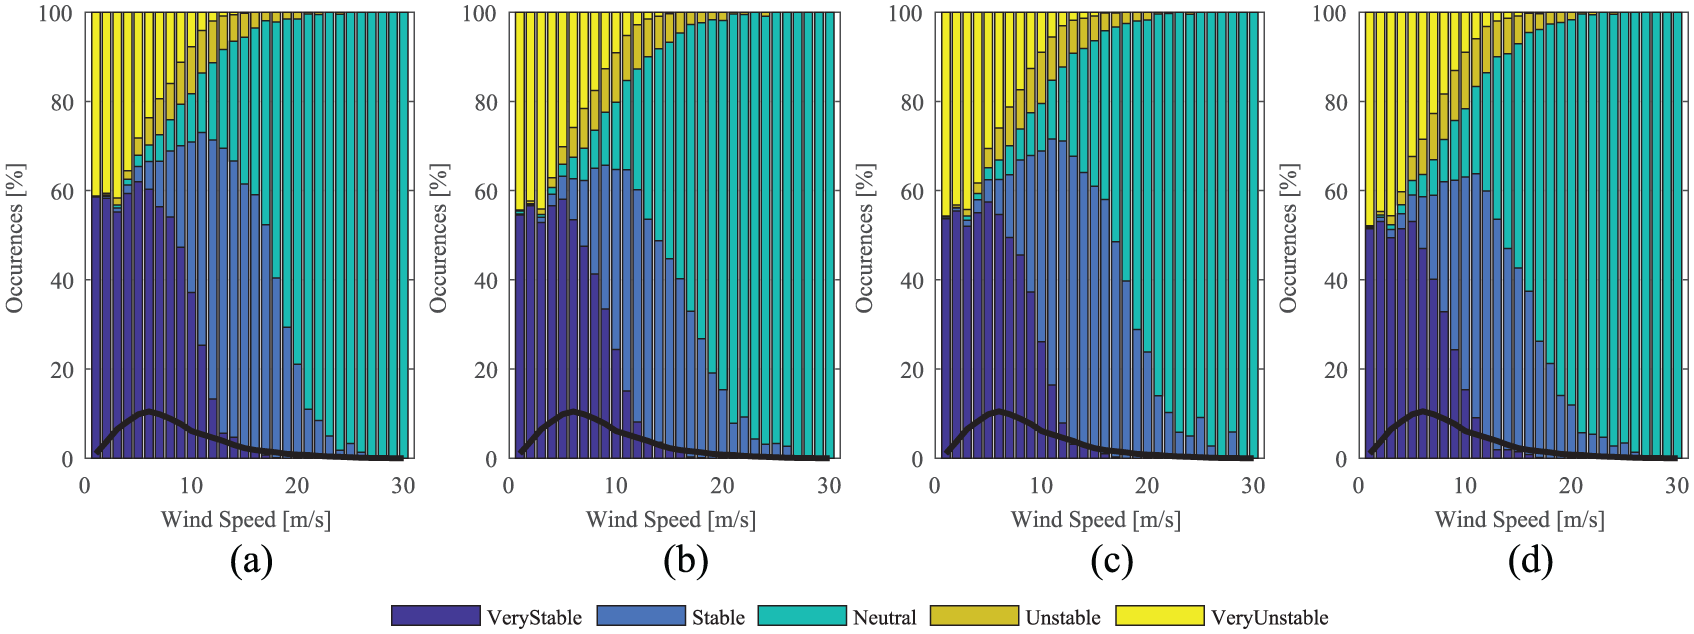
Stability distributions based on the surface-layer Richardson number measured between ground and (a) 25 m, (b) 40 m, (c) 70 m, and (d) 100 m at Frøya.
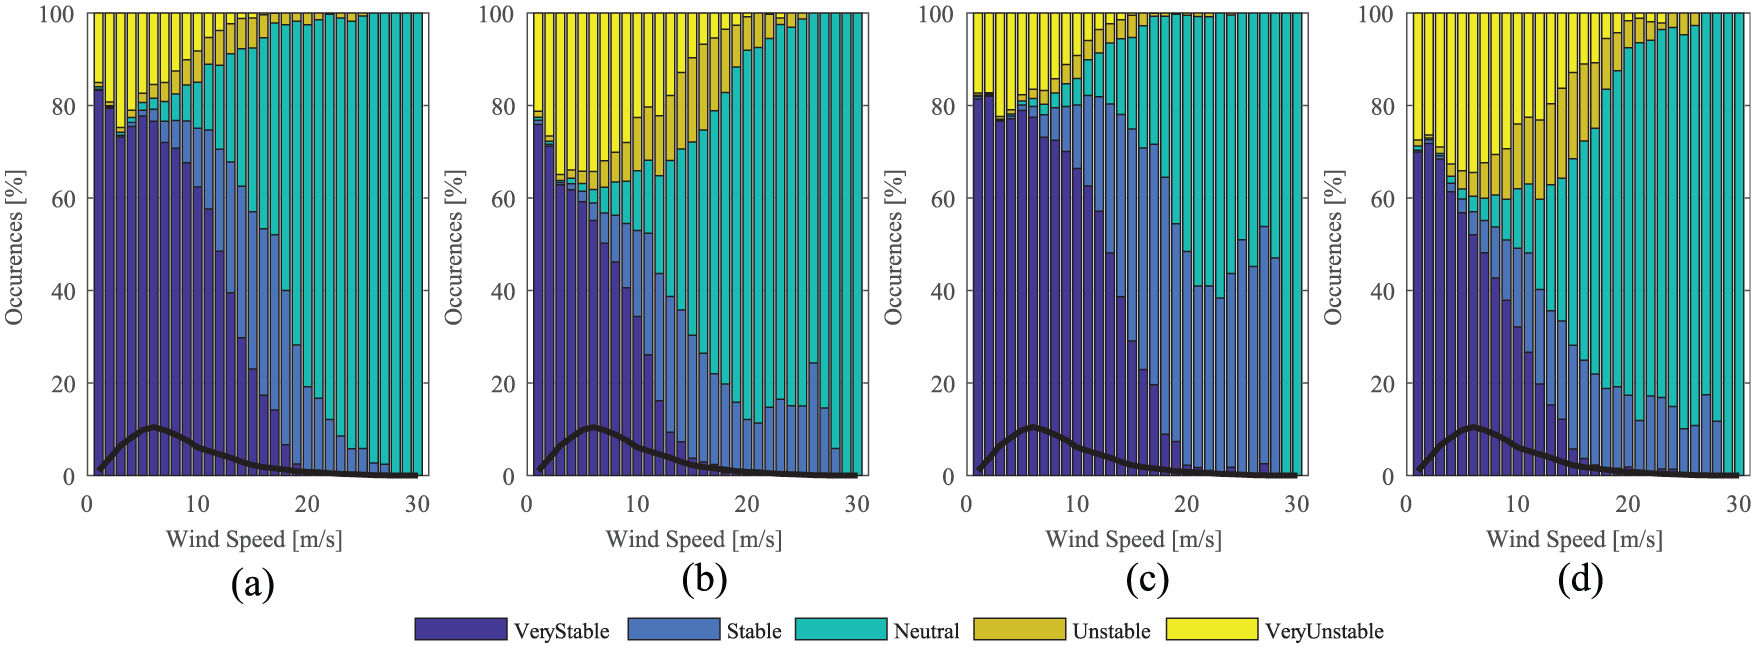
Stability distributions based on the bulk Richardson number measured between 10 m and (a) 25 m, (b) 40 m, (c) 70 m, and (d) 100 m at Frøya.
The bulk and surface-layer formulations produce qualitative similar results. However, the bulk Richardson number is more sensitive to variations in the measurement heights used. This formulation relies on smaller wind and temperature differences for estimation of the mean gradients and is therefore more prone to errors in the measurement of these variables. No clear trend can be observed in the variation of stability with measurement heights, so the variation is assumed to be related to measurement uncertainties. The surface-layer Richardson method is more robust and only small variations are observed. Comparing the methods directly is difficult because of the variation in the distributions calculated from the bulk formulation, but in general, the surface-layer Richardson formulation results in more unstable conditions at low wind speeds. This could be related to local ground heating effects. It must be noted that the ground temperature sensor does not measure the ground temperature, but the air temperature approximately 20 cm above ground. When the wind speed (and vertical wind gradient) is low, there is little shear production of turbulence, the denominator of the Richardson number becomes small, and the Richardson number becomes polarized toward either very stable or very unstable conditions, depending on the sign of the virtual potential temperature gradient. For the formulations and stability classification used here, very few occurrences of neutral conditions are found below 5 m/s.
The atmospheric stability distributions at Roan 327 are shown in Figure 8 based on the surface-layer Richardson method, bulk Richardson method, and sonic methods, respectively. Only concurrent time steps are included, resulting in 31,508 data points, between 14 April and 04 December 2015. The distributions are shown for the comparison between the different methods and are not representative for the long-term conditions in the area, as the winter months when stable conditions often dominate are not present.

Stability distributions based on the surface-layer Richardson number between 0 and 100 m (left), bulk Richardson number between 20 and 100 m (middle), and sonic flux measurements at 98 m (right) at Roan 327.
The sonic method shows a similar distribution to the Richardson methods, keeping in mind the curves showing data distribution. The representation of unstable conditions agrees best with the
In contrast to the distributions from Frøya, where stable conditions are indicated even at quite high wind speeds by both methods, the surface-layer Richardson method at Roan 327 is more dominated by neutral conditions at moderate to high wind speeds compared to the other methods. It can be assumed that this is related to the extrapolation of temperature from 3 m to ground for the Roan mast.
The sonic method is based on vertical heat and momentum flux measurements using covariance of turbulent quantities. This requires accurate high-frequency measurements of vertical wind speed and temperature. The sonic wind components were rotated to align the coordinate system to the mean wind vector, which is reported to be a flawed method in complex terrain (Chow et al., 2013; Weber, 1999). The measurement height for the sonic anemometer is 98 m, while the definitions of surface Richardson number and bulk Richardson number used here are valid at the arithmetic mean (48.5 m) and the geometric mean (45 m) heights, respectively (Arya, 1991). The sonic method may therefore not capture local stability effects occurring near the ground like a growing nocturnal inversion layer or surface heating in a shallow surface layer. This might explain the cases of neutral conditions at very low wind speeds which are not apparent from the Richardson methods. Similar to the observations from Frøya, the bulk Richardson formulation results in less neutral conditions at high wind speeds compared to the surface-layer Richardson formulation.
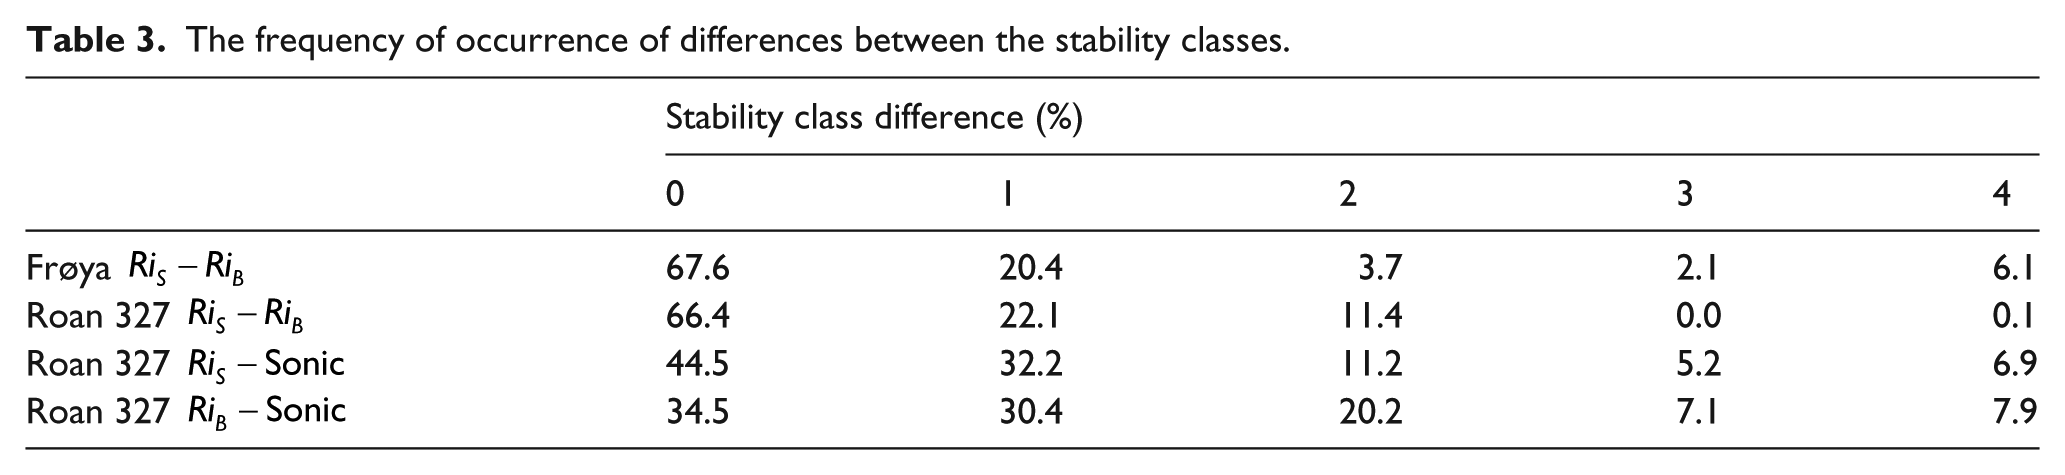
The results from Frøya shown in Figures 6 and 7 and from Roan 327 shown in Figure 8 clearly show that the stability distribution for a site varies, depending on which method is chosen to obtain it. A direct comparison of concurrent stability classification using different methods is shown in Table 3. The comparison is conducted by assigning each stability class a number from 1 (very unstable) to 5 (very stable). If the difference is zero, the stability conditions at the two masts are equal, while the difference can maximum be four, meaning the conditions are completely opposite at the two masts (very unstable and very stable). The quantitative comparison reveals that a generally higher correlation is found between the two Richardson number formulations than between the Richardson number method and the sonic method. The surface-layer Richardson method gives the best correlation with the sonic method, where 76.7% of the measurements fall within the same or the neighboring stability class. Using more advanced methods for relating the Richardson number to the Monin–Obukhov stability parameter might improve the correlation. For all comparisons, except Roan
The frequency of occurrence of differences between the stability classes.
Direct measurements of heat and momentum flux are costly and often not available at meteorological stations. The Richardson number methods can be considered more robust for routine measurements if properly calibrated sensors are used, even though it represents a bulk average stability value rather than a point measurement. More advanced empirical relations or iterative procedures for finding the Obukhov length should however be used when calculating stability corrected wind profiles. When calculating the Richardson number, the measurements heights should also be carefully selected for the individual applications of the data, in order to capture the relevant physics while still considering uncertainties related to measurement of small gradients.
The atmospheric stability distributions at the measurement sites are now further compared in two ways. First, all three masts are compared qualitatively based on representative distributions from each site. This is done because the measurements at Frøya ended before the measuring campaign at Roan started, and it also gives a larger amount of data points for each distribution. The surface-layer Richardson method is chosen for this comparison since it correlates reasonably well with the sonic method and is less sensitive to uncertainties in wind speed measurement (Sanz Rodrigo et al., 2015; Sathe, 2010; Zoumakis and Kelessis, 1991). Second, the correlation of atmospheric stability is investigated between the two masts at Roan for concurrent measurements only.
Coastal winds from open sea sectors are generally less turbulent and have less vertical shear than winds from onshore sectors because of the low roughness length of the sea surface. Stability conditions offshore are therefore mainly governed by the sea–air temperature difference and experiences an annual cycle. Cold air advected over a warmer sea surface leads to an unstable stratification and warmer air advected over cold water leads to a stable stratification (Emeis, 2013). Coelingh et al. (1996) found unstable to neutral conditions to dominate in the North sea with exception of the spring, when 50% were stable. At the onshore sites at Frøya and Roan, however, stable conditions are dominating as seen in Figure 9, especially in the winter months as indicated in Figure 10. This can be related to the results of Heggem (1997), who found that over a land fetch of 3 km from the shoreline to the Frøya met-mast, the stability during the winter months would transition from unstable to stable. Seasonal variations are important at these sites. The static stability which is related to solar insolation, radiative cooling, and convection changes with the seasons as the angle of incoming sunlight, air–sea temperature difference and ground cover changes. This can be clearly seen in the vertical gradient of virtual potential temperature in Figure 10 where the summer months (June, July, and August) are predominantly neutral–unstable and the winter months (December, January, and February) are predominantly stable.

The atmospheric stability distribution at Frøya (left), Roan 327 (middle), and Roan 328 (right) based on wind speed and temperature at 100 m.

Seasonal variation of vertical virtual potential temperature gradient at Frøya (left) and Roan 327 (right).
At Frøya, stable conditions dominate at up to gale force wind speed. Heggem (1997) also found stable conditions to dominate during the winter time and similar results were found for a coastal site in Denmark (Barthelmie, 1999). Compared to the flat site at Frøya, more neutral conditions are found at Roan where the terrain is more complex. Enhanced mixing caused by mechanically generated turbulence might be a reason for this. This is supported by the higher turbulence intensity at this site. Coelingh et al. (1998) found that in the North Sea, the conditions at coastal sites and at offshore platforms compare well for higher wind speeds, above 7 m/s at 10 m height.
At both sites, a directional dependency of stability can be seen (Figures 11 and 12). In order to remove the influence of wind speed variations between the different sectors, only cases of mean wind speed between 8 and 12 m/s are included. These results can be related to fetch and wind rose by comparison with, Figures 1 to 4. For the Roan site, data are missing between 23° and 68° because of mast shading. For both sites, more neutral and unstable conditions are found in the northern and western sectors. This would agree with advection of cold polar air masses over the warmer sea surface. At Frøya, the highest portion of very unstable conditions is found in the north-east sector, which corresponds to the sector with the longest land fetch. Winds from south are largely dominated by stable conditions. At Frøya, this is related to warmer air masses that have been passing over open sea for a few kilometers. At the Roan sites, this is a pure land fetch. From this, we might assume that the atmospheric stability in the coastal zone, while influenced by the air–sea temperature difference offshore, is modified by the land fetch already a few kilometers inland.
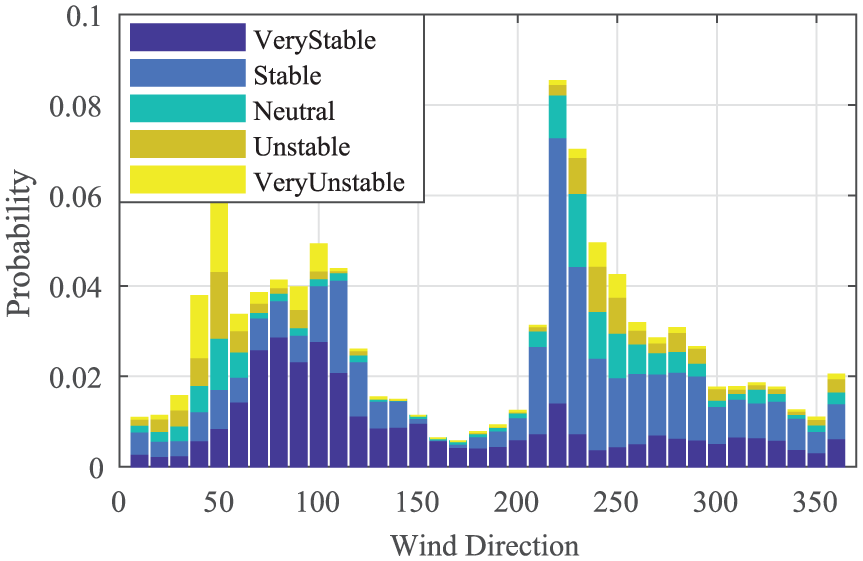
Atmospheric stability versus wind direction at Frøya for 8 < WS < 12 m/s.

Atmospheric stability versus wind direction at Roan 327 for 8 < WS < 12 m/s.
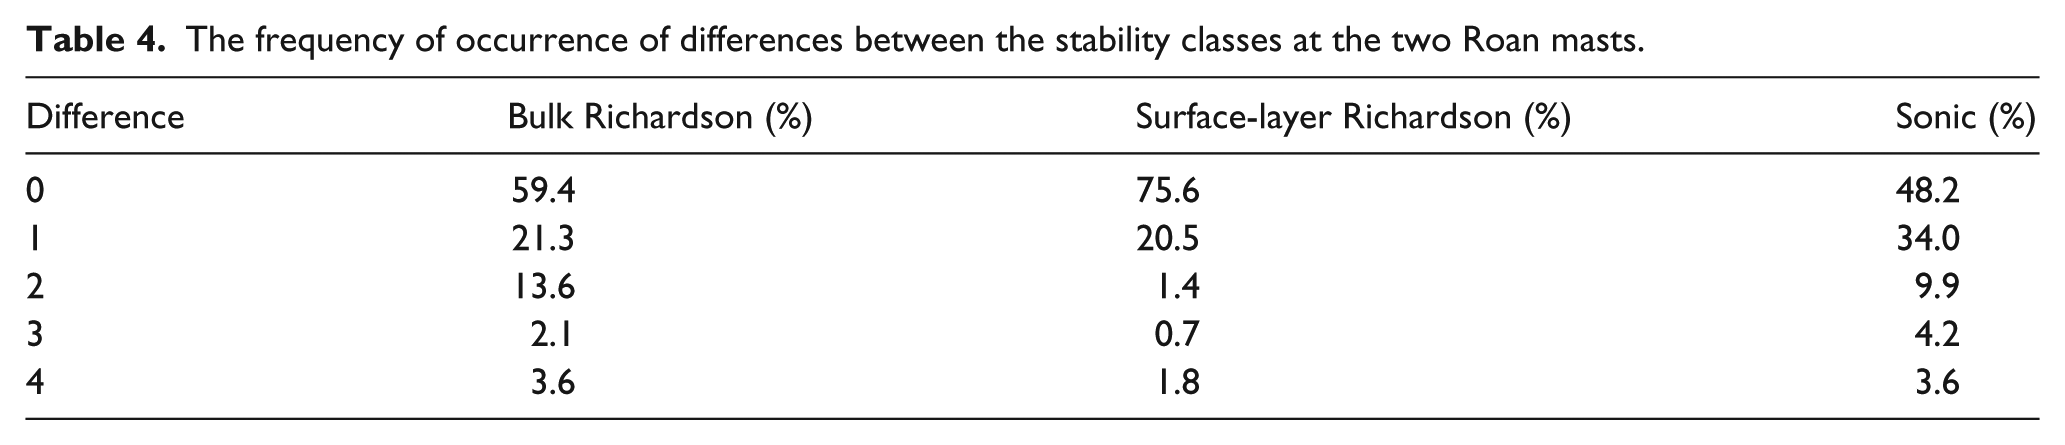
The stability distributions at Roan 327 and Roan 328 as presented in Figure 9 are as expected very similar, considering the short distance between the sites. The two masts were both measuring in the period from 10 December 2014 until 29 November 2015, almost one full year. The atmospheric stability at the two masts during this period is further quantitatively compared in Tables 4 and 5, with only concurrent time steps being considered. The following results are thus shown to give a first discussion of the correlation between the two nearby sites, not to be representative for the long-term site conditions. Data presented for the Richardson number methods consists of 8 months of measurements, while the sonic dataset consists of 1 month of measurements. The comparison of concurrent stability classification at the two masts was conducted using the same approach as in Table 3 for the three different methods presented earlier. A difference of 0 indicates coinciding stability classes at the two sites while a difference of 4 indicates that the stability conditions at the two sites are completely opposite. It could be assumed that the stability conditions at the two masts are correlated considering the short distance and similar surrounding terrain and fetch, and a difference of 4 is therefore unlikely to be experienced. The highest correlation is found using the surface Richardson method where 96.1% of the observations lie within a difference of one stability class or less. The lowest correlation is found for the sonic method.
The frequency of occurrence of differences between the stability classes at the two Roan masts.
The frequency of stability conditions at one mast compared to the other.
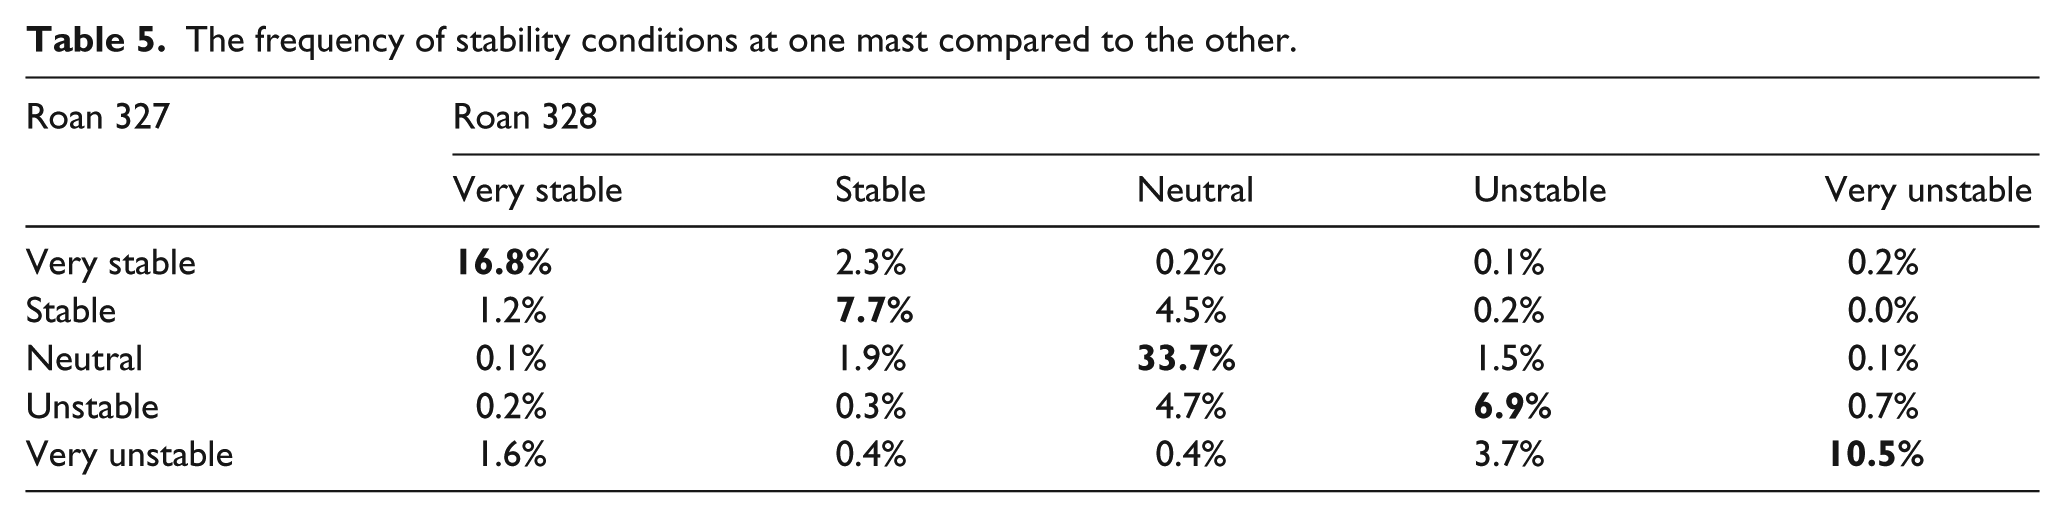
Table 5 elaborates the findings from Table 4 for the surface-layer Richardson method by specifying the frequency of stability conditions co-occurring at both masts. The conditions at the two masts are most often either both in the stable–neutral or unstable–neutral range, indicating that the stability conditions at the two sites are well correlated. Cases of co-occuring stability classification at both masts are indicated by bold values on the diagonal of the table. The co-occurring cases of very stable and very unstable conditions are again assumed to be mainly related to very low wind speeds (and shear) when the Richardson number becomes polarized for a near-neutral lapse rate. The lower percentage of occurrences in the stable and unstable classes could indicate an unfortunate choice of classes for the Obukhov length.
Conclusion
Reliable estimates of the atmospheric stability are important for prediction of the vertical wind profile and the development of wind turbine wakes in a wind farm. Many methods exist for estimating stability based on meteorological measurements. In this article, two Richardson number formulations have been compared to an eddy covariance method. It is shown that the resulting stability distributions vary depending on which method is chosen, but that they are qualitatively similar. For the Richardson number methods, the choice of measurement heights could influence both the accuracy and the applicability of the measured data. The measurements should be made with a sufficient vertical separation in order to reduce the influence of inaccuracies in the wind speed and temperature measurements. The surface-layer Richardson formulation shows less variation with measurement height than the bulk Richardson formulation and could be considered more robust.
The Monin–Obukhov theory is strictly valid only in the surface layer which is often confined to lower heights than the upper measurement point. However, applying a filter for surface layer height would lead to large amounts of data being filtered out (Fechner, 2015; Lange et al., 2003). In order to produce representative atmospheric stability distributions for the different sites and to compare them, filtering for the surface boundary layer height was discarded as the filtering lead to a biased distribution with a loss of very unstable conditions.
The representative atmospheric stability distributions at three coastal sites calculated using a surface-layer Richardson method were also compared. The flat coastal site at Frøya shows more stable conditions than the mountainous sites at Roan which could be related to increased mechanical turbulence production from the more complex terrain. Both sites experience similar, both seasonal and directional, variations. In the winter months, more stable conditions are observed, while in the summer months, unstable conditions are found to be more frequent. This is more related to typical onshore seasonal variations. However, winds from the northern and western sectors (from the open sea) produce more neutral conditions at both sites than the sectors with longer land fetch.
Data from the two nearby masts at Roan were collected during the same time period, and the concurrent stability measurements have been directly compared. The surface-layer Richardson method gives the highest correlation between the sites with 96% of the measurements being in the same or the neighboring stability class. For the sonic method, this number is 82% and this method also results in 3.6% of the measurements being in the opposite end of the stability scale.
Based on a comprehensive literature study, no standard methodology for measuring atmospheric stability using the Richardson number is found, and many different formulations are used. Furthermore, different empirical relations are used to relate Richardson number to Obukhov length for use in stability correction terms. Still, relating stability to gradients of wind speed and temperature is convenient since it only requires routine meteorological measurements, and while not perfectly correlated with the sonic method, the distributions are qualitatively similar. The sonic method is more complex and requires high-accuracy instrumentation and post-processing while the surface-layer Richardson method can be considered more robust for long-term routine measurements.
Footnotes
Acknowledgements
The authors thank Statkraft and Meventus for providing data for the Roan masts, as well as the Norwegian Research Council that provided funding for installation of the sonic anemometers under the research project “Lidars in Complex Flow.”
Declaration of conflicting interests
The author(s) declared no potential conflicts of interest with respect to the research, authorship, and/or publication of this article.
Funding
The author(s) received no financial support for the research, authorship, and/or publication of this article.