
Abstract
Wind turbines are widely exploited throughout the world. The availability and reliability of offshore wind turbines are asking to impose a constant maintenance strategy. In this work, we propose a method that allows filtering the signal of the frequency inverter that feeds the yaw drive used in wind turbine. The redundant information is eliminated via discrete wavelet transform and empirical modal decomposition. The two types of faults are detected from the envelope of the Hilbert transform. The magnitude imbalance detection is carried out in the time domain. The root mean square values of the envelopes of the three-phase system have a good indicator for the fuzzy system to evaluate the severity of the defect. In the frequency domain, the signature of the broken bar fault is located in the low-frequency bandwidth. The harmonics appeared in the spectrum sensitive in amplitude and frequency to the variation of load. Experimental results have demonstrated the accuracy of the proposed method.
Keywords
Introduction
Currently, the environment-related problems which do threaten life on the earth planet are the emissions of greenhouse gases that come from resources of fossil energy which has caused the increase in the average temperature at the surface of the earth. Indeed, this real issue imposes on us the search for other diversifications of energy sources.In this context, renewable energies offer a very good solution (Munshi and Sampath, 2016). The wind turbines among renewable sources is a new electricity production source which has a stronger growth (Lin et al., 2016).
The major encountered problem which faces the efforts of making the production of wind energy competitive, compared with other conventional sources, is the cost of the maintenance. In onshore wind turbines, the cost is estimated to 10% of the total price of wind energy and to 35% for the offshore wind turbines (Gray and Watson, 2010). The wind farm site presents a fragile maintenance that makes it not possible to guarantee a good constant power availability rate. In the case of unexpected failures and due to the difficulty of access to distant sites where offshore wind turbines are installed, the maintenance cost becomes very heavy (Sarker and Faiz, 2016).
The problems of offshore wind turbines are resolved by installing monitoring and diagnosis equipments on the system; they play a great role in ensuring the continuity of the production with the decrease of the costly maintenance interventions (Faulstich et al., 2010).
The failures of the wind turbine can affect all the different parts of the entire system. The identification of defective elements presents a major importance because the wind system operates on the basis of solidarity between all its parts. In this context, the online self-monitoring systems offer the possibilities to increase the reliability as well as the availability. The detection algorithms of mechanical and electrical faults allow us to obtain an early warning to avoid any negative impact. Several research studies have been conducted to monitor the condition of the wind system. Several approaches have been used for fault detection especially for bearing and gearbox faults (Teng et al., 2016).
Wind turbines with horizontal axis rely very much on the yaw motor, in view of the contribution to the energy conversion chain of the wind into electricity in order to capture the maximum of energy, because the direction of the wind varies from time to time. The unexpected failures in induction motors make the system suffer from long breakdown times. This is due to the distant sites of the offshore wind turbine implantations.
The quantitative and statistical study in Hyers et al. (2006), presenting the failure rate of the wind system (offshore wind turbine (>l.5 MW)), reports that 8% of faults are caused by the “yaw mechanism” (Figure 1). The yaw mechanism is used to turn the turbine blades to face the wind. Almost all horizontal axis wind turbines use “yaw mechanisms” to maintain the turbine in the direction of wind. Two configurations are employed in these mechanisms: hydraulic and electric (Figure 2); yet the electrical configuration is being more and more used.
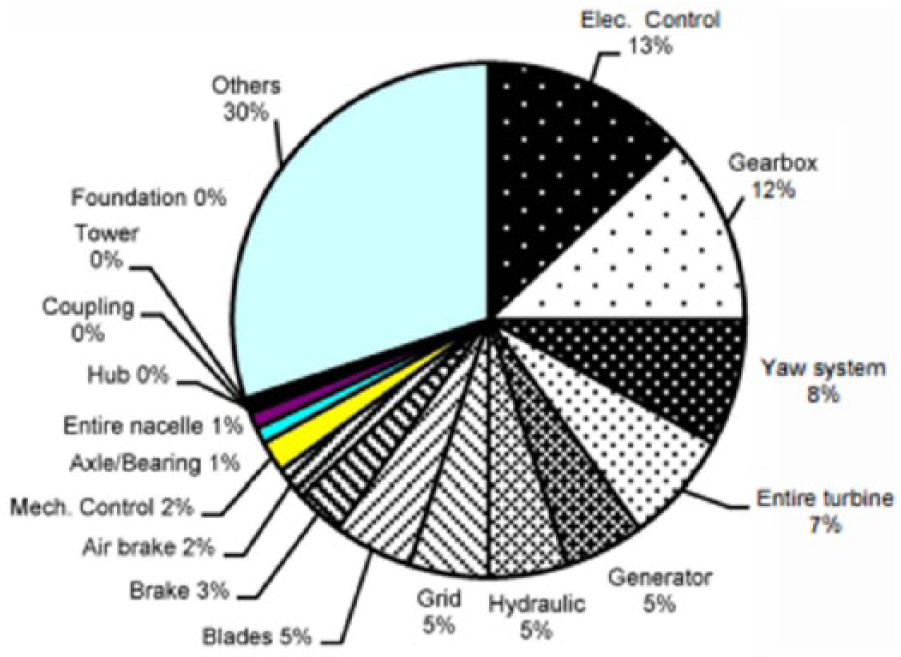
Failure rate of offshore wind turbine components (Hyers et al., 2006).
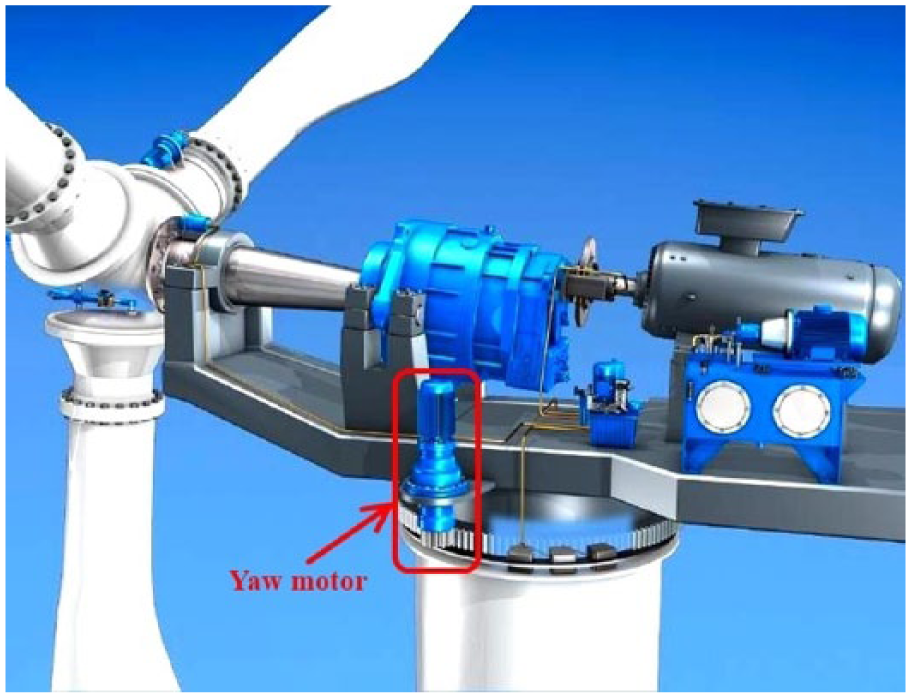
Electric yaw system.
The induction motors powered by a frequency inverter are the main components of the yaw system. It is essential to monitor the faults which may affect the stator and the rotor such as phase imbalance, broken bars faults, eccentricity faults, and bearing faults. The distribution of the percentages of faults in the induction motor is generally (Panadero et al., 2009):
Stator faults (38%);
Rotor faults (10%);
Bearing faults (40%);
Other faults (12%).
In the litterature, various methods are used for fault diagnosis of the induction motors, among them, we can cite: Motor Current Signature Analysis (MCSA) (Lebaroud and Medoued, 2013; Medoued et al., 2010), signal processing–based methods, wavelet analysis (Ordaz-Moreno et al., 2008), time–frequency representations (Lebaroud and Clerc, 2008; Medoued et al., 2014; Medoued et al., 2016).
The phases imbalance can occur in all three-phase systems. It causes negative effects on the induction motor such as loss increase, vibrations, acoustic noise, overheat (Lee, 1999), degradation of the electrical insulation, and the expected lifetime reduction. The monitoring of the imbalance level applied on the motor ends is essential. According to the guidelines stated by the National Electrical Manufactures Association (NEMA) (NEMA Standard MG1, 2002), the motor operation for a duration higher than 5% of a voltage imbalance is not recommended. The evaluation of the phase imbalance degree is based on the NEMA standard (Voltage Unbalanced Percentage (VUP)) or the International Electrotechnical Commission (IEC) definition (Voltage Unbalanced Factor (VUF)) (Cummings et al., 1985; Kersting and Philips, 1997; Lee et al., 1997; Pillay et al., 2002; Woll, 1975). The IEC definition depends on the relationship between the amplitude of the direct and opposite sequences to determine the degree of imbalance. The analysis of this fault type was dominated by the symmetrical components method. The equivalent diagram of the opposite and direct sequences of the induction motor is used in Anwari and Hiendro (2010) and Wang (2001). It requires a long calculation procedure. Imbalance is also characterized by the appearance of an opposite frequency component at −50 Hz in the current vector spectrum and stator voltage (Moussa et al., 2014) or at the fundamental frequency. This imbalance produces a spinning field opposite to the field produced by the direct sequence which affect the developped torque by the induction motor. Lashkari et al. (2015) present a technique based on the evaluation of the negative sequence magnitude to detect the voltage imbalance fault. Another method in Bacha et al. (2012) introduced Hilbert and Park transform for detecting the voltage imbalance fault and even the broken bar fault from the spectrum of Hilbert Modulus Current Space Vector (HMCSV) and Hilbert Phase Current Space Vector (HPCSV). On the other hand, the analysis was carried out in a broad frequency band to extract the indicators which characterize the appearance of the considered faults. In our approach, the detection of the two types of faults (the stator currents imbalance and broken bar faults) is carried out only by the calculation of the envelope (the instantaneous amplitude) using the Hilbert transform. It can thus give the instantaneous phase and the instantaneous frequency.
The imbalance fault detection is carried out in the temporal domain using the envelopes Root Mean Square (RMS) values. The variance and the mean of these values enable the estimation of the fault severity by the artificial intelligence application. The most frequent fault in the rotor is the broken bar fault that causes oscillations in the rotation speed causing mechanical vibrations.
The spectral analysis of the instantaneous amplitude of the current signal detects the broken bar fault in a low waveband. The corresponding fault sensitive components are obtained using the 2kfs expression (Kia et al., 2009).
Before applying the proposed method on the current signal of the machine supplied with a frequency inverter, the analysis must be carried out in order to eliminate redundant information. The signal decomposition in certain frequency bands using the wavelet multiresolution (Discrete Wavelet Transform (DWT)), shows that only one frequency band gives more information about the studied failures (broken bar, unbalance fault). In the second step, the selected band must be treated using the empirical modal decomposition (EMD) gives an (intrinsic mode function (IMF) signal that contains the temporal and frequency fault signatures. The principal objective of this analysis is to let the chosen indicators very sensitive to the considered faults.
The artificial intelligence exhibits a very important application potential in various areas. This is due to the good obtained results thanks to its simplicity and effectiveness. The neuron network, for example, is used to remove noises from defected image (Sagiroglu and Besdok, 2012); the trajectory control application in robot manipulators is carried out using fuzzy (Sliding Mode Control) SMC with radial basis function neural network (Ayça Gokhan et al., 2015). And in Boiocchi et al. (2015), the authors performed the diagnosis and control using fuzzy logic.
In this work, the main objective of the application of artificial intelligence as fuzzy logic integrated in a graphical interface developed under MATLAB is to offer an online diagnosis of phase unbalance fault; the state of yaw drive can be monitored at any time.
This article is organized as follows. Section “Theory of detection algorithm” presents a brief summary on the theoretical bases which constitute the algorithm for the faults detection, section “Experimental results” deals with the experimental results obtained by the application of the developed algorithm, and section “Classification of imbalance in phase fault” is dedicated to the classification of phase imbalance faults.
Theory of detection algorithm
Wavelet transform (DWT)
The wavelet transform is widely used in the field of diagnosis. It gives a better description of the non-stationary signals compared to other classic tools such as the short-time Fourier transform (STFT) (Coppola, 2008). The continuous wavelet and discrete wavelet transforms are the two main categories of wavelet transforms.
A very powerful implementation well adapted to the non-stationary signals is introduced by Mallat (1989). Thanks to the process of the dyadic band-pass filtering, the signal can be represented as a series of successive approximations and details, as shown in Figure 3. The decomposition is carried out by a repetitive process using a filter system (Ponci et al., 2007). The input signal X(t) undergoes a filtering: a low-pass filter (LPF) and a high-pass filter (HPF). On each level of decomposition, the coefficients of the HPF are called coefficients of detail (D) and the coefficients of the LPF are called approximate coefficients (A). The result of the decomposition gives the signal X(t) in the form of the approximations

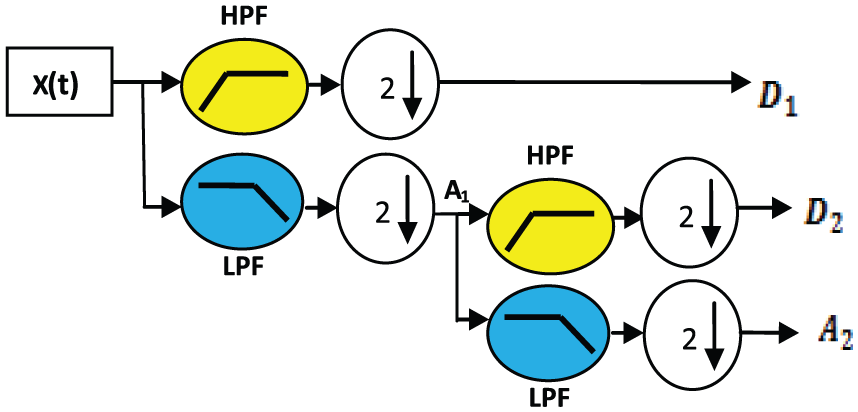
Principle of DWT decomposition.
The approximation signal

The sum of the details and the approximation allows us to reconstruct the signal X(t)

The result obtained by the Discrete Wavelet Transform gives a better frequency resolution for low frequencies band and a high temporal resolution for high frequencies band by suppressing the redundant information of signal.
Hilbert–Huang transform
The Hilbert–Huang transform (HHT) is a new method of time–frequency analysis, introduced for the first time in Huang et al. (1998). This method exhibits certain flexibility in the processing of the non-stationary signals. It breaks down a complex signal in several modes called IMF. The extraction of the IMFs is non-linear, whereas their recombination is quite linear. This method has shown its capabilities as a powerful tool of multiscales adaptive analysis of non-stationary signals.
Empirical mode decomposition
The empirical mode decomposition (EMD) has no analytical formulation; it is an algorithmic method which is defined by the sifting algorithm. The sifting process follows the algorithm in Figure 4. The IMF extraction process is completed when the residue contains no more extrema. This means that the residue becomes a monotonic function.
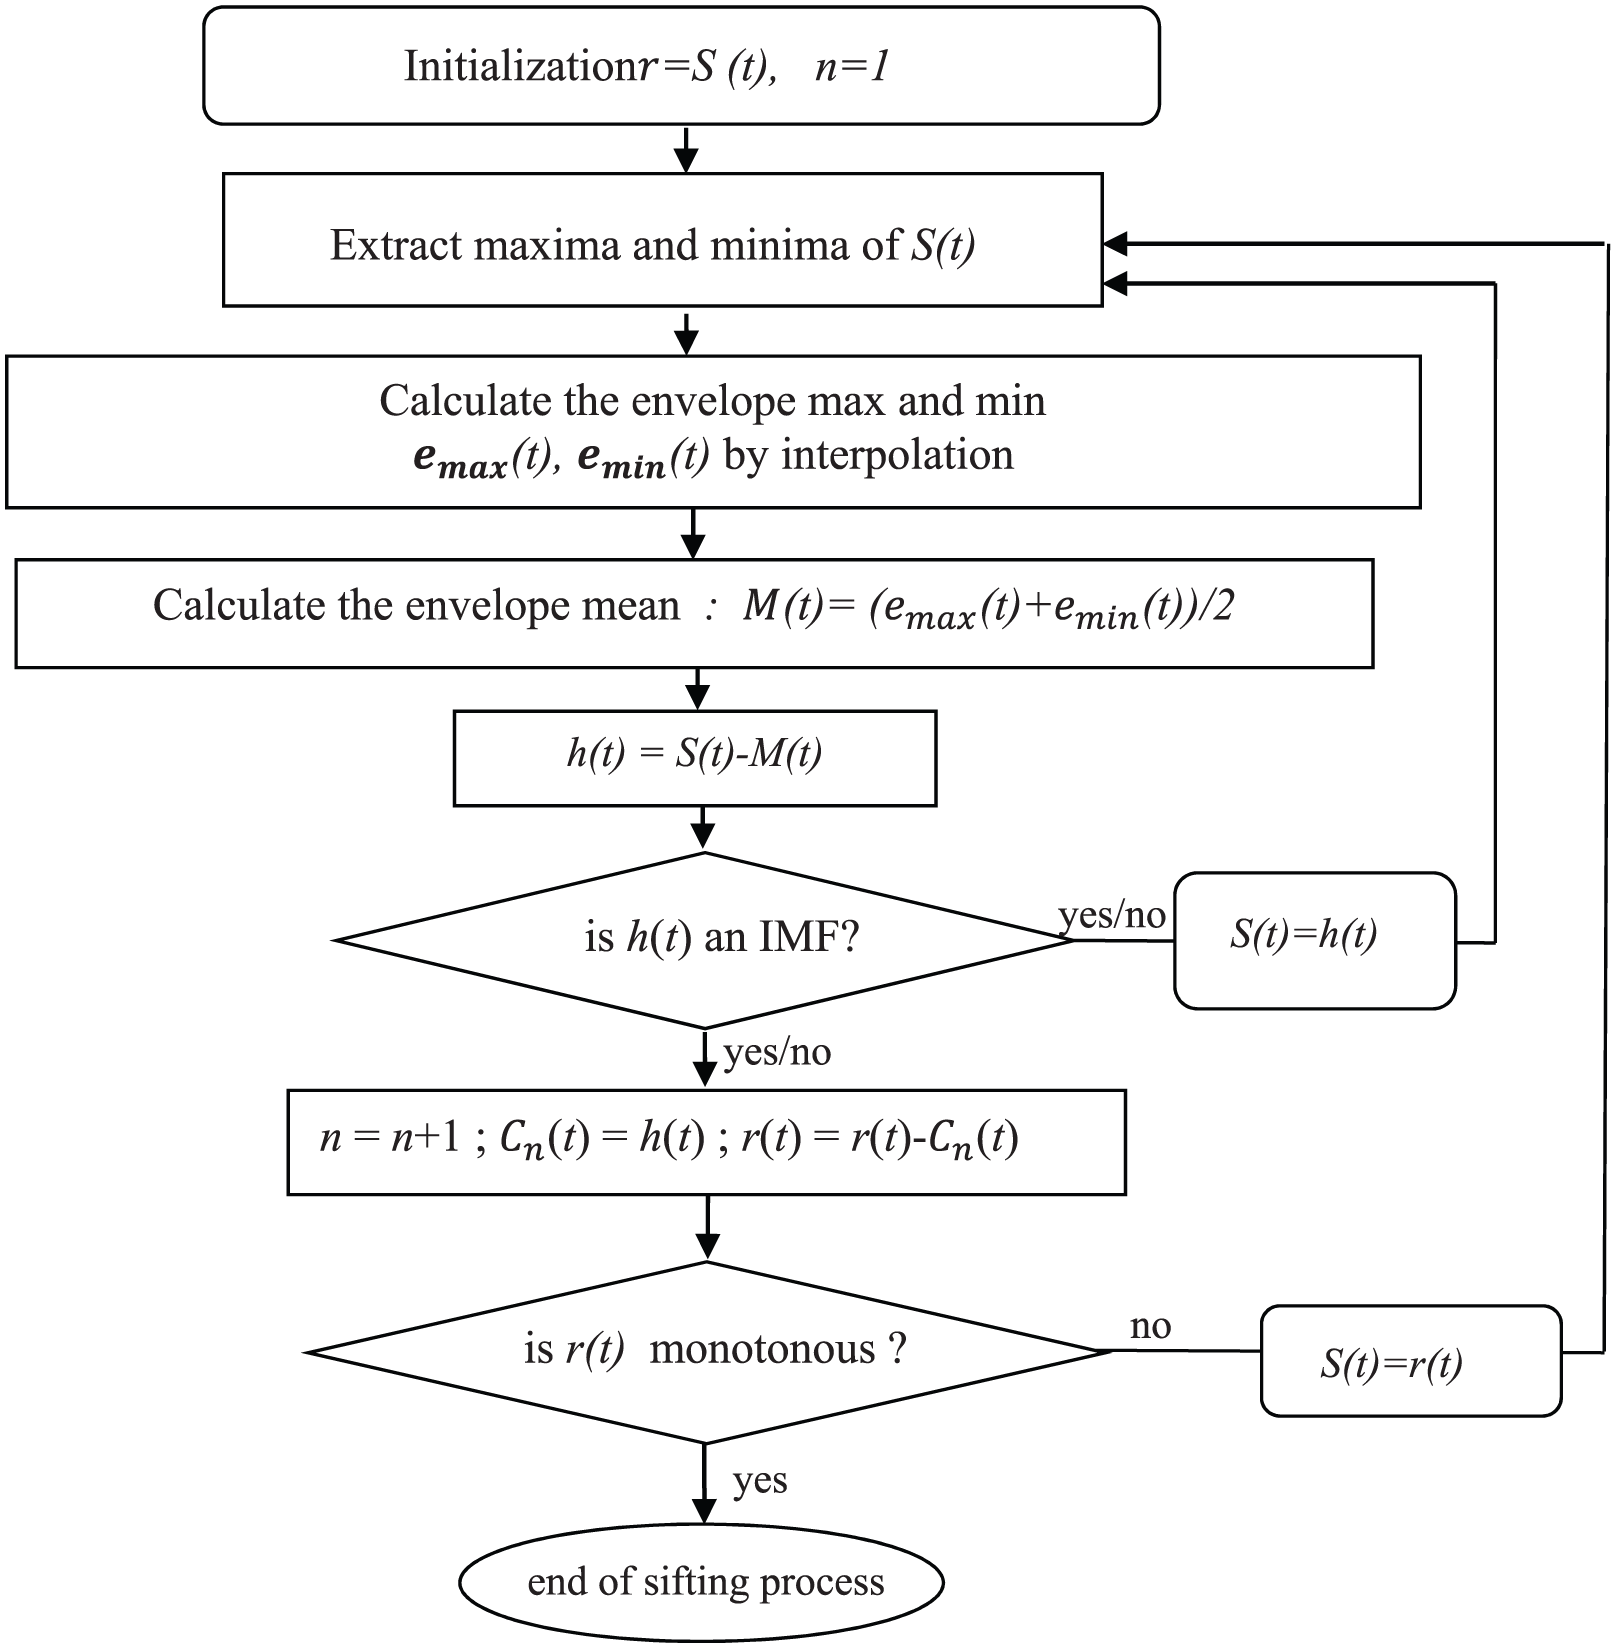
Flowchart of the EMD algorithm.
Experimental results
The experimental bench consists of a three-phase asynchronous motor squirrel cage type (Leroy Somer LS 132S, IP 55, Class F). The motor is loaded by a powder brake. Its maximum torque (100 N m) is reached at rated speed. This brake is sized to dissipate a maximum power of 5 kW. Figure 5 shows the motor bench (Lebaroud and Medoued, 2013; Medoued et al., 2013). For the rotor fault, the bar has been broken by drilling a whole in the bar of the squirrel cage (Figure 6). The 5% and 10% of power imbalance for simulating the fault of unbalanced stator is obtained with a variable autotransformer placed on a phase of the network.
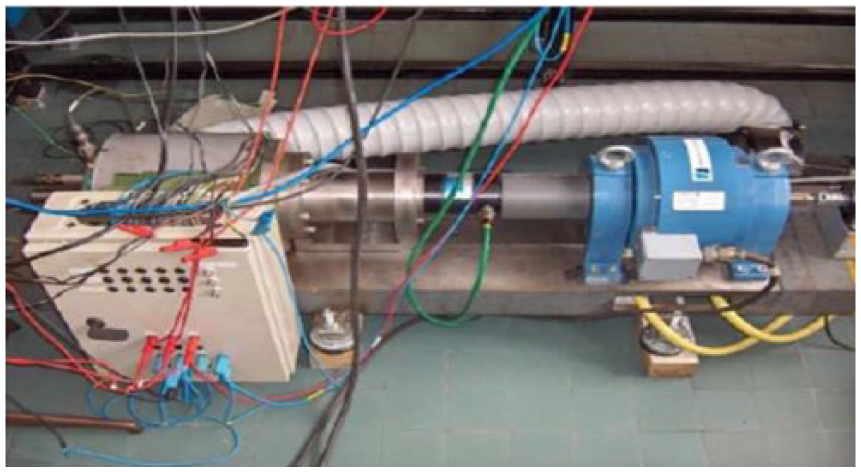
Test bench.
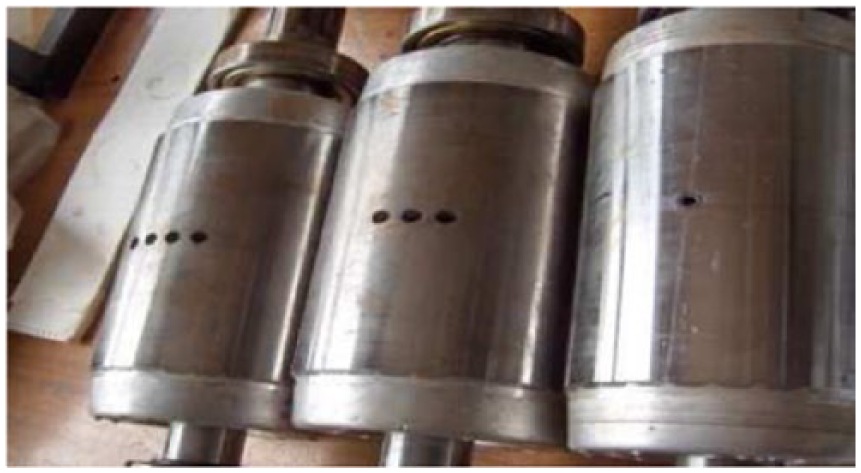
Breaking of the rotor bars.
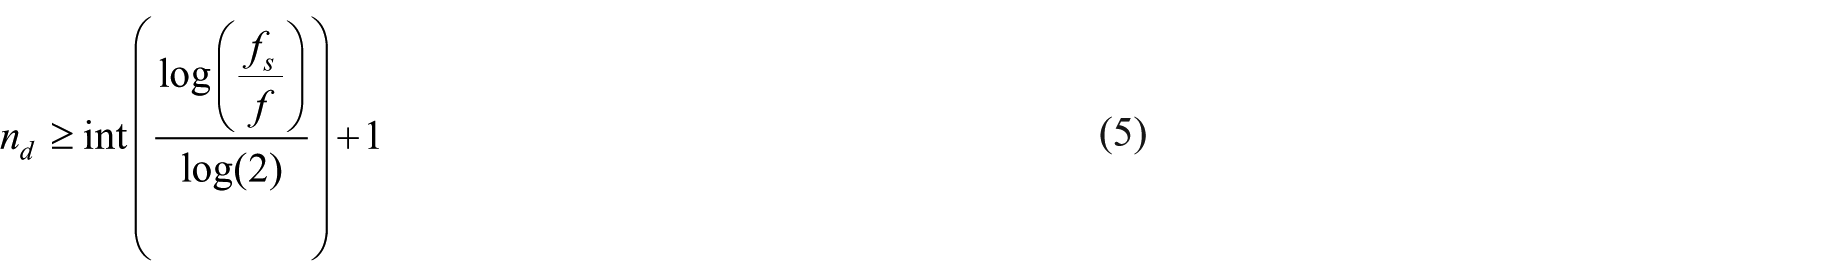
The appropriate number of composition levels (nd) is based on the sampling frequency (fs) of the signal being analyzed (Table 1). This parameter must be chosen in such a way that the minimum level number of decomposition is necessary to obtain a signal of approximation (

From this condition, the levels of decomposition of the signal are given by the following integral
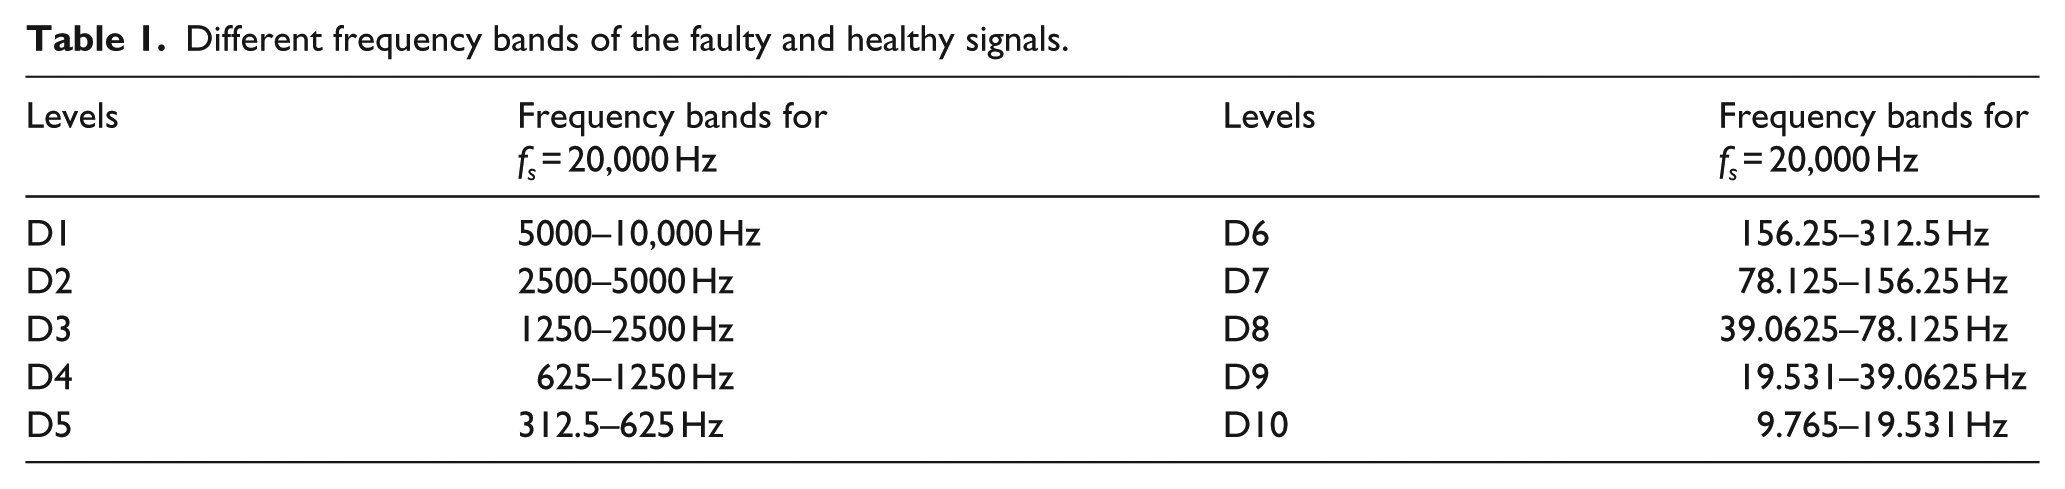
Different frequency bands of the faulty and healthy signals.
After selecting the appropriate number of decomposition level (nd), the selection of the mother wavelet presents a very important step, there exist several types of mother wavelets (Daubechies, coiflet, simlet, biorthogonal, etc.) with different properties summarizes in (Daviu et al., 2006). In our case, the Daubechies wavelet family has been used for multiresolution analysis and precisely the (db44). According to the results in Daviu et al. (2006), the orthogonal wavelet of higher order Daubechies (db44) has been used in diagnosis of broken bar fault because it gives a more ideal filtering and minimizes the overlapping between the frequency bands; this is due to filter length of (db44), as shown in Figure 7.

Decomposition of the faulty current signal for three broken bars supplied by a frequency inverter.
The frequency band D8 (Table 1) may provide information on the existence of the broken bar and phase unbalance fault. In this frequency band, the search for the fault signature after the application of the EMD algorithm.
EMD of faulty signals
The frequency band D8 obtained from DWT is decomposed into a sum of mono-component signals called IMFs. Figure 8 presents the first four IMFs after the application of the Empirical Modal Decomposition (EMD) (Figure 4). The component with the shortest period (high frequency) is identified and decomposed in the first IMF. The components of long periods (low frequencies) are then identified and decomposed by order (Figure 8).
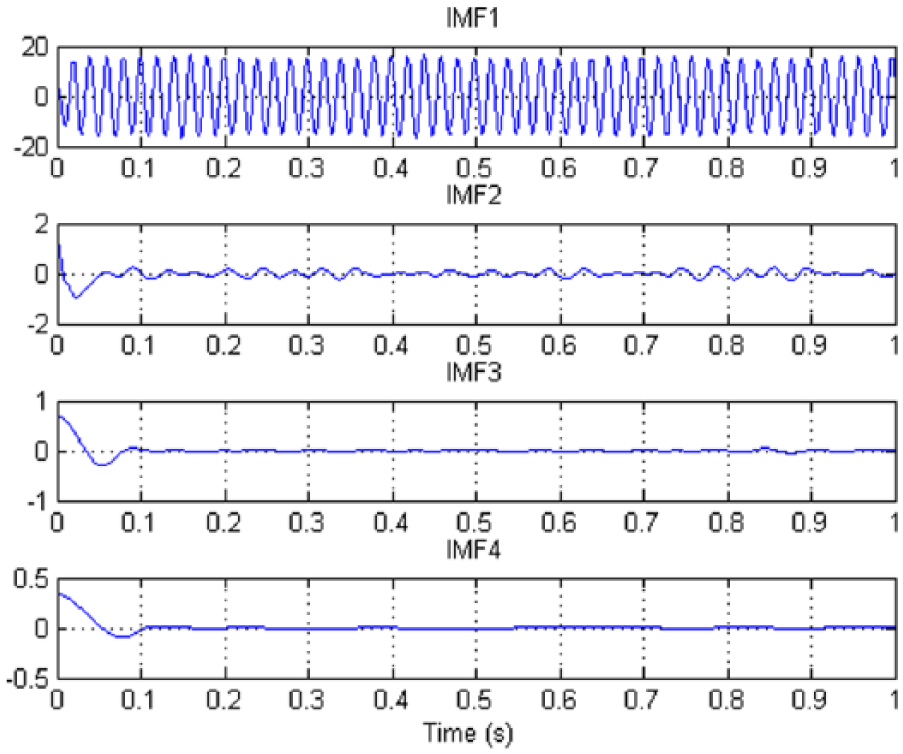
IMF of faulty D8 for three broken bars supplied by frequency inverter.
Fault detection flowchart
The different steps of the filtering and detection algorithm for the broken bar fault and phase imbalance are schematized in Figure 9.
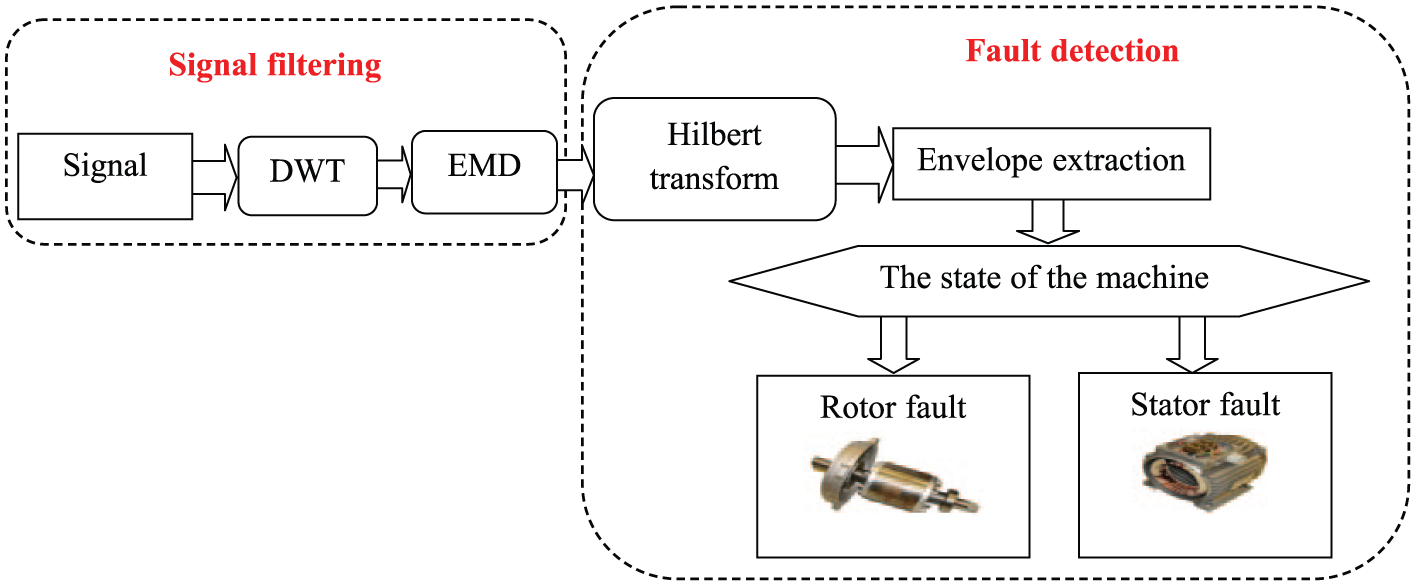
Detection algorithm for the broken bar fault and phase imbalance.
Figure 10 shows the current frequency inverter signal (blue) and the filtered current signal analyzed using DWT and EMD (red). As a result, all the redundant information of the current frequency inverter signal has been totally removed.
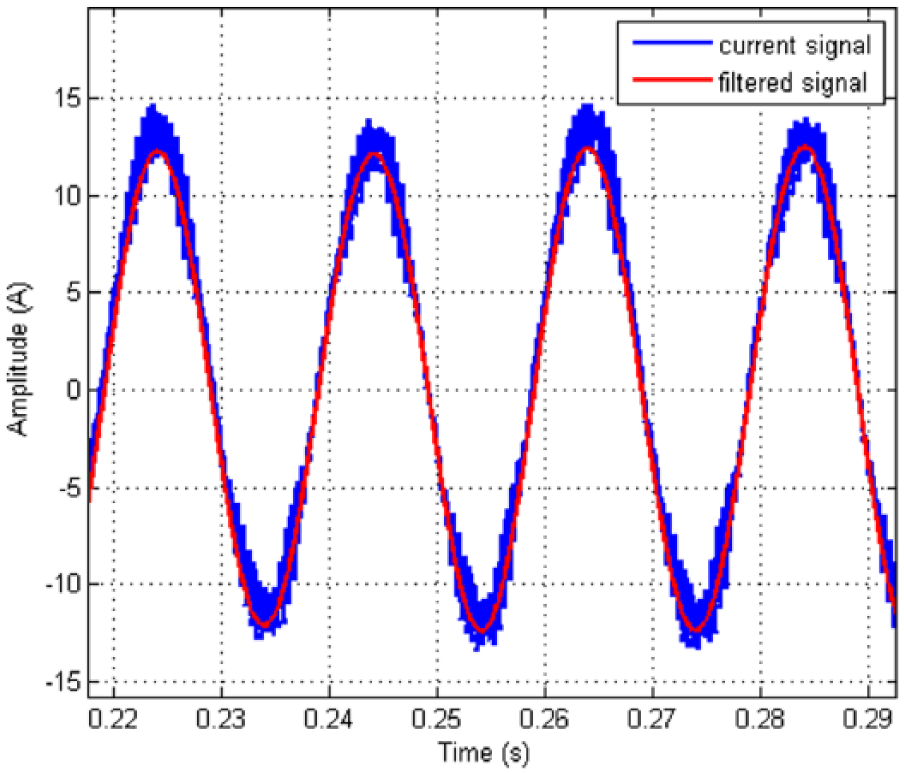
Three-broken bar fault current signal powered by a converter (blue), the signal filtered by the algorithm (red).
Under different levels of load, the fault detection algorithm (Figure 9) has been tested on the signals of the stator and the rotor which are powered by a frequency inverter.
The instantaneous magnitude current of broken bar fault
Theoretically, when the broken bar fault occurs in the induction motor, the frequency signatures of the sidebands appear in the stator current signal are expressed as (Kia et al., 2009)

where
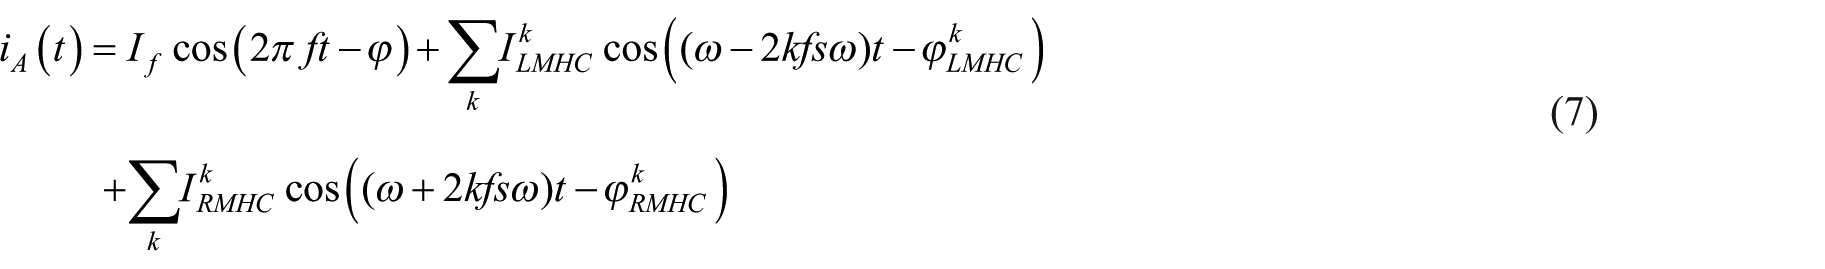
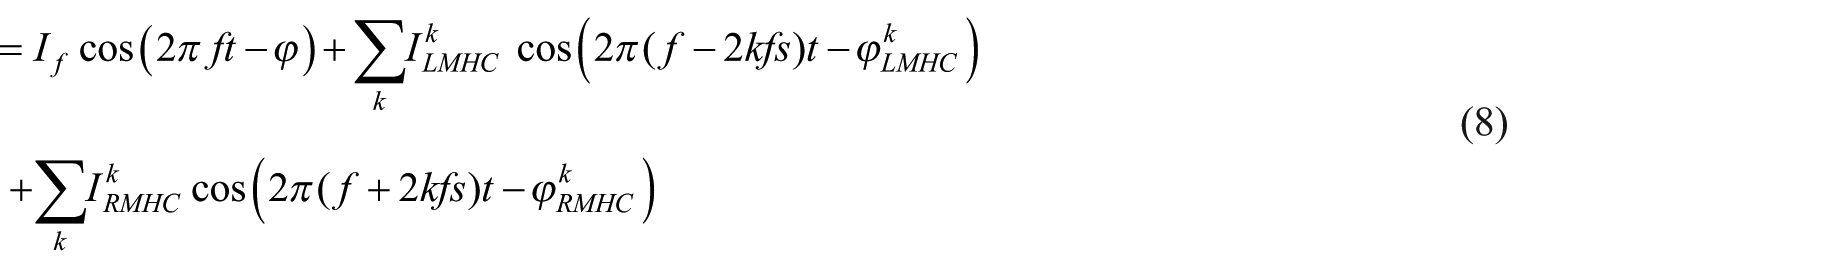
Expression (8) can be rewritten as


with


with


Note that, 2kfs is the most important component of the equation (16). It’s determined by computing the instantaneous amplitude of the Hilbert transform.
Hilbert transform
After getting the IMF using the EMD method (Figure 8), the Hilbert transform is applied to IMF1 component to obtain the instantaneous amplitude. Hilbert transform

The analytical signal

The exponential form of the analytical signal is

and the instantaneous amplitude is given by

The instantaneous phase is expressed by

The instantaneous frequency

Envelope extraction
Figure 11 displays the difference between the filtered and non-filtered envelopes of the current signal containing a fault of three broken bars. The analysis of the signal by the algorithm of Figure 7 enables us to eliminate redundant information and gives us an envelope which clearly presents the fluctuations produced by the broken bar fault (Da Silva et al., 2008).
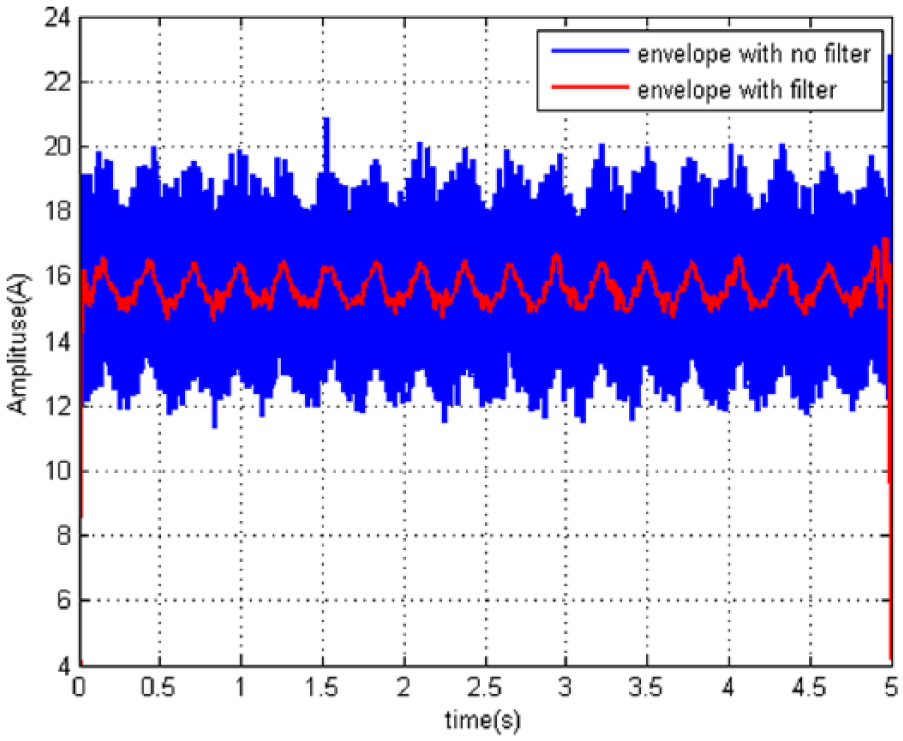
The envelope of three-broken bar fault powered by a converter (blue), the envelope of the same fault filtered by the algorithm (red).
Figure 12 presents the envelope extracted by the algorithm (Figure 9) for a load level of 100%. It shows a fluctuation period equals to (1/2fs) for the 3- broken bar fault compared with the healthy case.
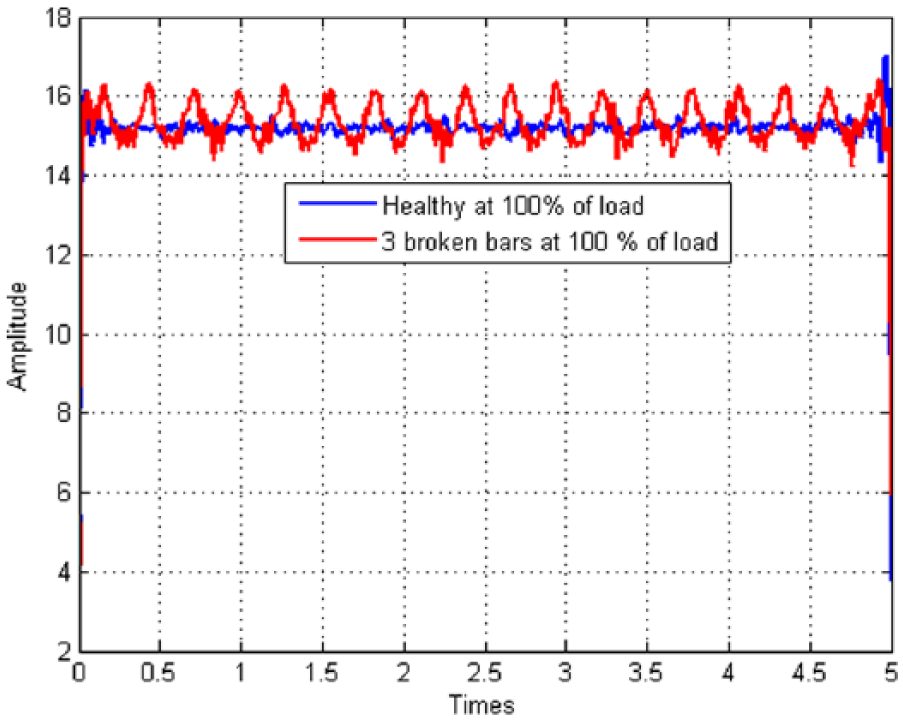
Instantaneous amplitude of IMF with three-broken bar (red) and healthy (blue) at 100% of load supplied by a frequency inverter.
Figure 13 shows the spectrum of the instantaneous amplitude processed using fast Fourier transform (FFT) which presents the frequency component (2fs), where (f) is the fundamental frequency and (s) is the slip. The amplitude and frequency of these components (2fs) are directly proportional to the increase of load level (25%, 50%, 75%, and 100%).

Overlay spectra of four envelopes for the load levels (100%, 75%, 50%, and 25%), for a three-broken bar (3BB) rotor supplied by a frequency inverter.
Imbalance fault
Figure 14 defines the 5% unbalanced three-phase power system. The extraction of the envelope of the three phases of the current signal allows us to identify in a precise way the faulty phase compared with the healthy case (Figure 15).
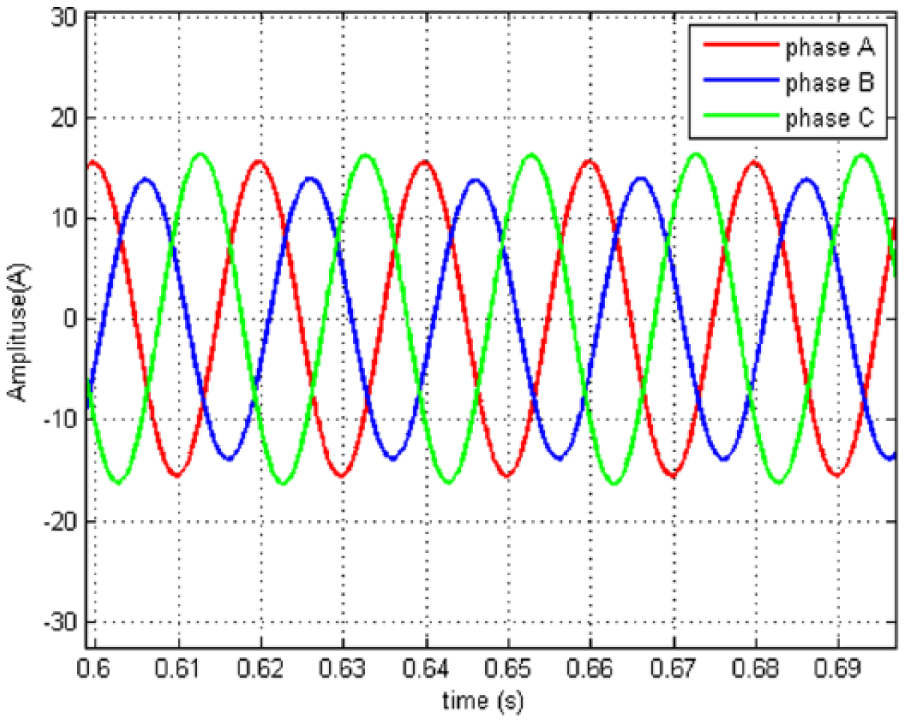
5% Unbalanced three-phase power system.
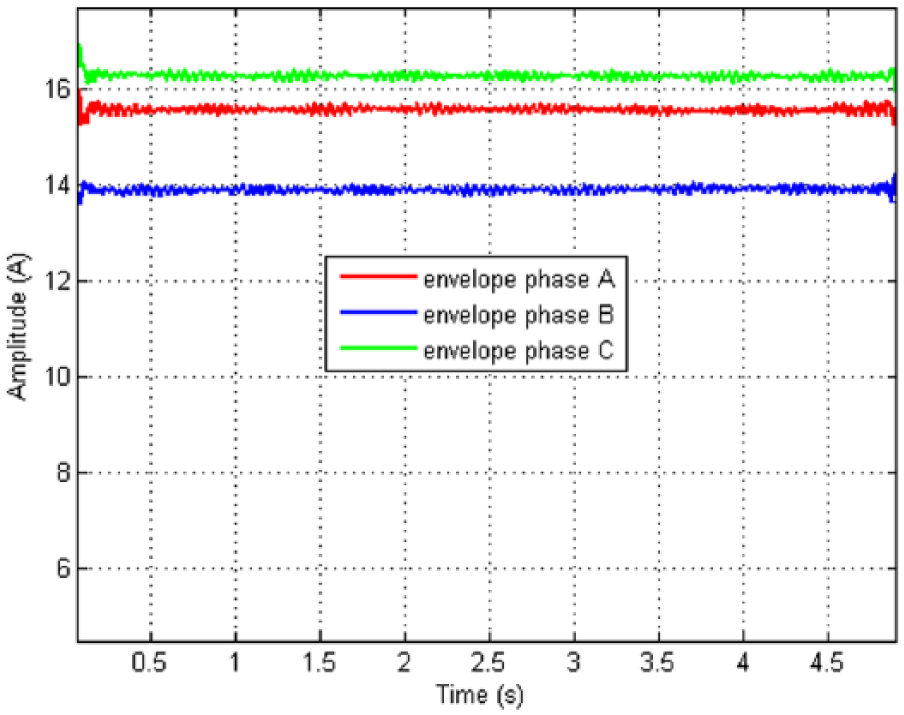
5% Imbalance in phase B.
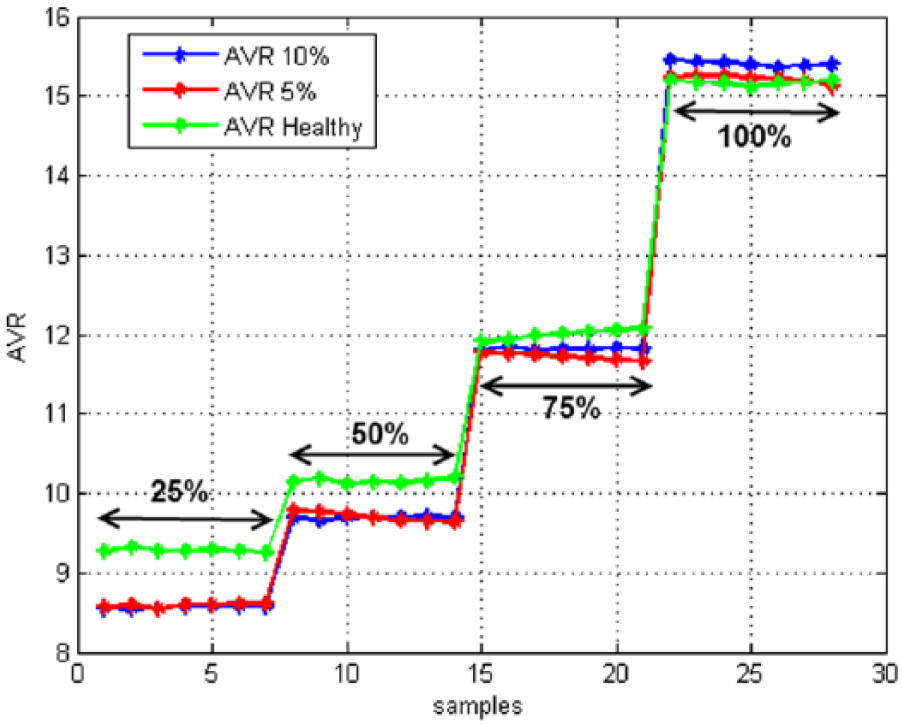
Figures 16 to 18 show the variations of the RMS value of the extracted envelope depending on the variation of the load level (25%, 50%, 75%, and 100%). It is extremely sensitive; we offer well infer the state of the three-phase system; the value of the RMS presents a good indicator of unbalanced phase fault.
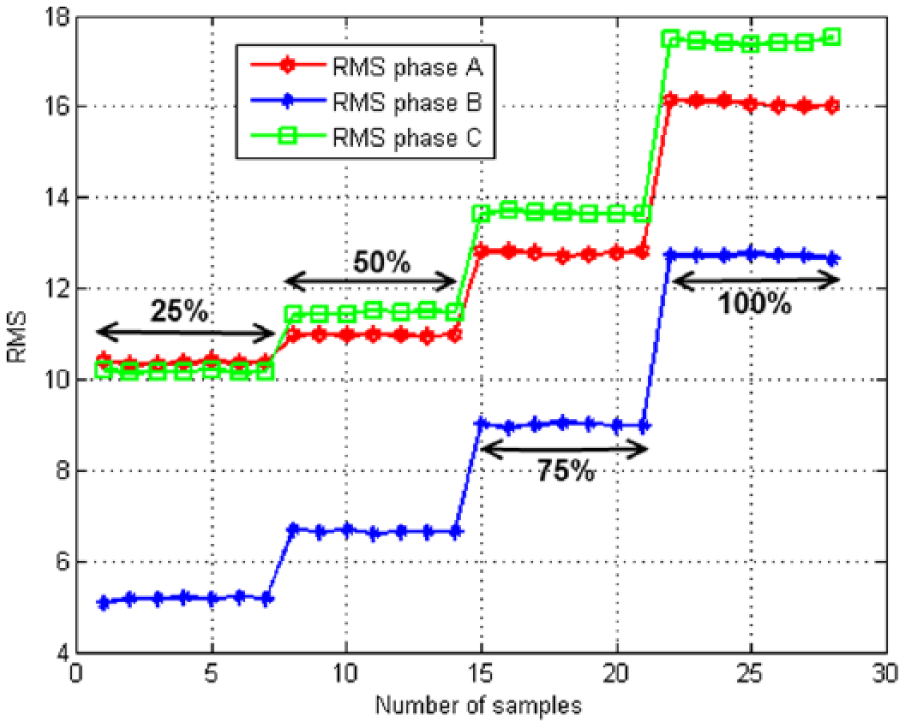
Values of the RMS of the envelope for an imbalance of 10% in phase B.
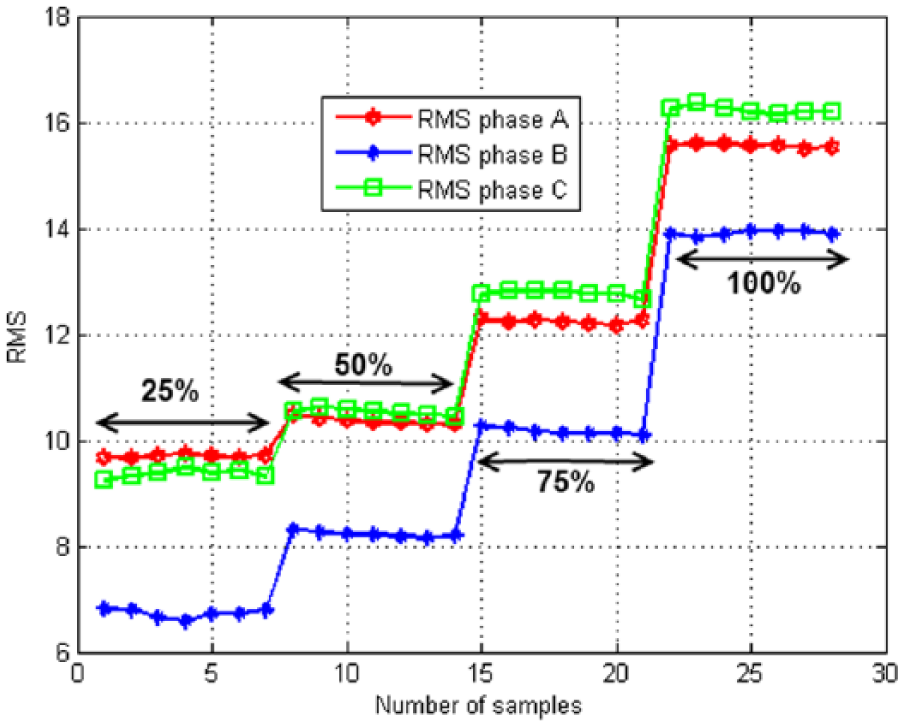
Values of the RMS of the envelope for an imbalance of 5% in phase B.
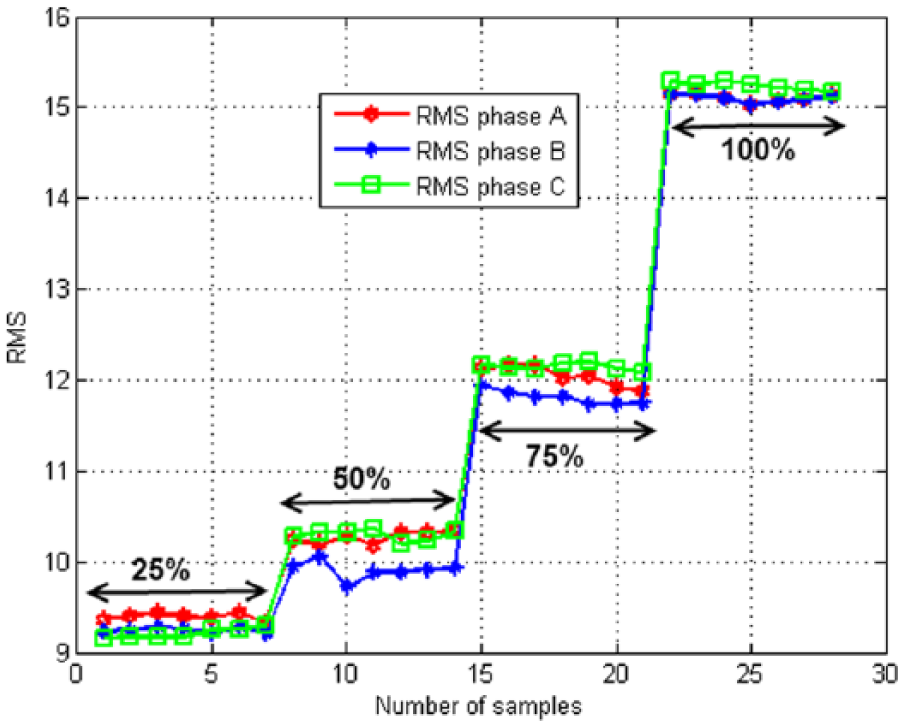
Values of the RMS of the envelope of balanced case.
Classification of imbalance in phase fault
The main objective of this section is to classify the phase unbalance fault using an expert system integrated in a Graphical User Interface (GUI) using MATLAB software to achieve an online monitoring. The experimental results showed that the RMS values have a very sensitive and effective indicator in all load levels to classify the fault. On the other hand, the analysis of the RMS values of the three phases shows interferences between the healthy phase and the phase which underwent an imbalance, for example, Figure 17. The RMS values of the 5% imbalance phase at 75% of load level interfere with the healthy RMS values at 50% of load level. The same thing with the 100% load level faulty case and 75% load level healthy one. However, if one counts on these values as input of the fuzzy system, each input must be represented in linguistic variables and membership functions, which complicates the classification task, since rules have to be put to determine the state of the machine precisely. In addition, to avoid any error of classification between healthy and faulty RMS, the number of these rules should be important.
The variance (VAR) and the average (AVR) between the three RMS envelopes values give the best solution to reduce the numbers of inputs and rules of the fuzzy system. The variance and mean are defined as follows:
The mean (AVR) of the RMS value

The variance is given by

N = 3 is the RMS values of the three-phase power system envelopes.
According to the variance and the average values close to zero shown in Figures 19 and 20, the system is balanced (symmetrical). And when there is an increase in variance between the RMS values, this is equivalent to the presence of a phase unbalance fault. The average between the RMS values of the three envelopes is evaluated with the variation of the load level. On the other hand, the value of the variance is evaluated with the gravity of the phase imbalance defect. The two inputs, (VAR) and (AVR), allow us to clearly identify the degree of failure.
Mean (AVR) of the RMS values of the three phase envelopes.
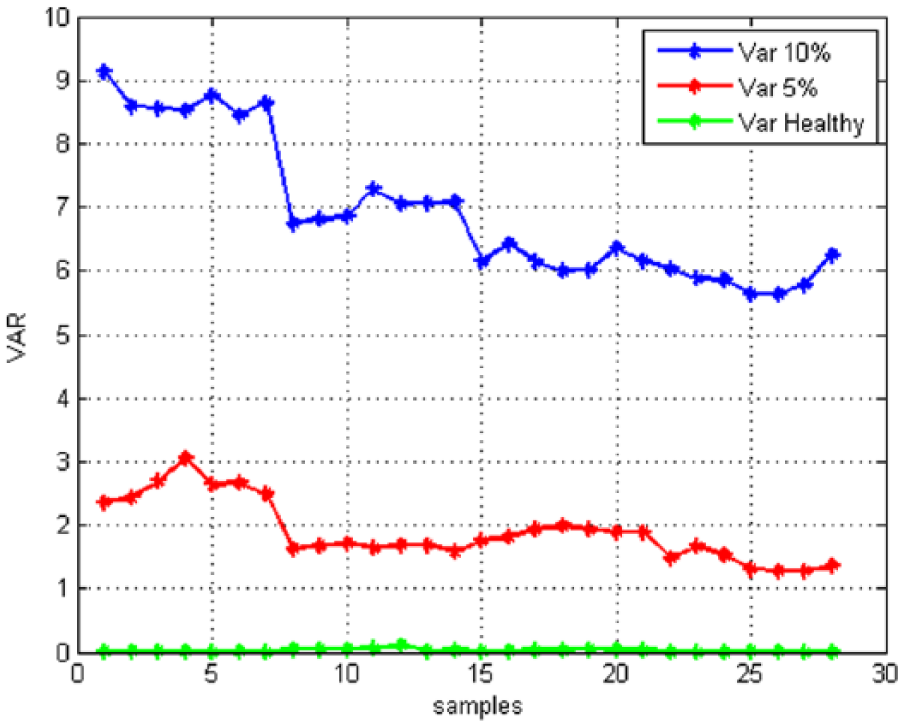
The variance (VAR) of RMS value between three phase envelopes.
Linguistic variables
The observation of the data set is used to build fuzzy rule and membership function. The motor state can be determined by the two inputs (VAR) and (AVR). Thus, the numerical data are represented by linguistic information.
The membership functions of the two inputs are built from the analysis of the variance and the mean of the RMS values. Thus, the input (AVR) varies from 8 to 16 according to the load level. We define the four membership functions which correspond to the linguistic variables. They are categorized by AVR25%, AVR50%, AVR75%, and AVR100% (Figure 21). The input (VAR) varies between 0 and 10 with respect to the fault severity. Similar process is repeated to determine the three membership functions which correspond to the linguistic variables. They are categorized by small (S), medium (M), and large (L) (Figure 22).
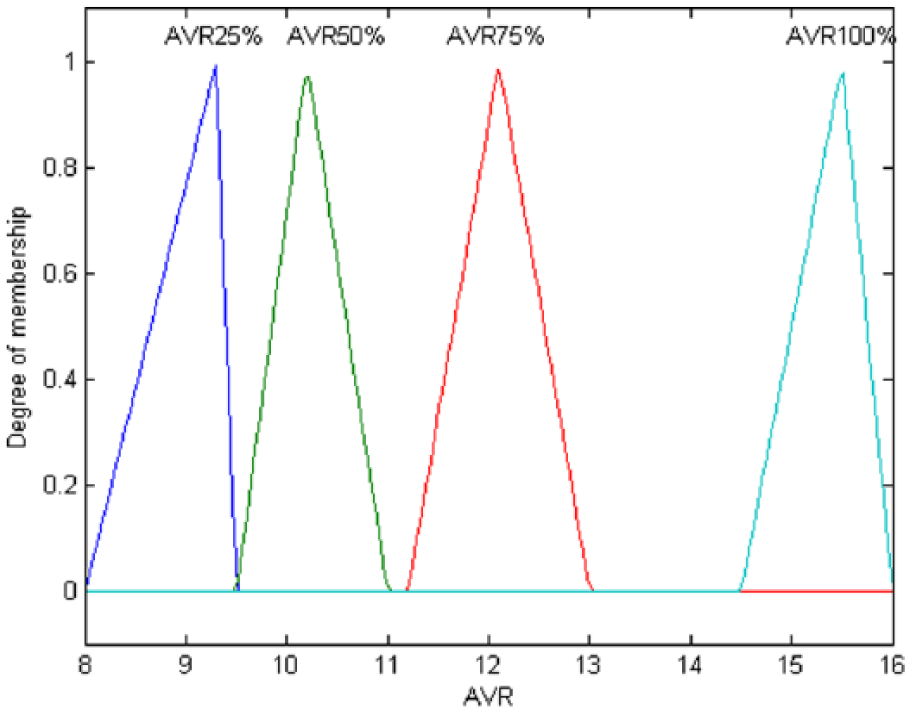
Mean of input membership functions.

Variance of input membership functions.
The membership functions like triangular, trapezoidal, and Gaussian are used to test the system. It has been found that triangular and trapezoidal functions are the most appropriate to distinguish the state of the induction motors. The shape of the input membership functions of the average and variance is illustrated in Figures 20 and 21.
Output fuzzy logic
The linguistic variables of the output fuzzy system (SC) and their values ranges of the membership function are presented in Table 2 for different kinds of the unbalanced phase faults.
Fuzzy logic output.

Rules: All the rules which include the state of the machine are set as follows:
Rule 1: If (AVR) is (AVR25%) and (VAR) is (S) then (SC) is (B).
Rule 2: If (AVR) is (AVR 50%) and (VAR) is (S) then (SC) is (B).
Rule 3: If (AVR) is (AVR 75%) and (VAR) is (S) then (SC) is (B).
Rule 4: If (AVR) is (AVR 00%) and (VAR) is (S) then (SC) is (B).
Rule 5: If (AVR) is (AVR 25%) and (VAR) is (M) then (SC) is (I).
Rule 6: If (AVR) is (AVR 50%) and (VAR) is (M) then (SC) is (I).
Rule 7: If (AVR) is (AVR 75%) and (VAR) is (M) then (SC) is (I).
Rule 8: If (AVR) is (AVR 100%) and (VAR) is (M) then (SC) is (I).
Rule 9: If (AVR) is (AVR 25%) and (VAR) is (L) then (SC) is (SI).
Rule 10: If (AVR) is (AVR 50%) and (VAR) is (L) then (SC) is (SI).
Rule 11: If (AVR) is (AVR 75%) and (VAR) is (L) then (SC) is (SI).
Rule 12: If (AVR) is (AVR 100%) and (VAR) is (L) then (SC) is (SI).
The implementation of inference system is of Mamdani type and the method of centroid was used for defuzzification.
Fault online detection using graphical system interface
The online diagnosis is the crucial task in fault monitoring in offshore wind turbines, it represents the property of classification by the fuzzy system. The current impact of the imbalance phase is the overheating of the equipment and in particular on the induction motor. The temperature increases as a function of motor load levels.
During long periods of operation in full load, the temperature value reaches the maximum threshold (Fantidis et al., 2015). In the case of an imbalance phase in the load (Lashkari et al., 2015), we get the degradation of the electrical isolation which reduces the lifespan of the motor. To solve this problem, we developed a human–machine interface (HMI) with a primary objective to detect this fault and give us the information on the state of the motor. The detection algorithm is integrated into the GUI.
The use of the developed software (Figure 22) is very simple. Once the signal is obtained in the (GUI), the button (Diagnostic) executes the detection algorithm; the two other buttons (envelope signal and (RMS, AVR, VAR)) plot and display the (RMS) value of the three envelopes A, B, and C phases and two inputs (VAR and AVR) of the fuzzy system.
The classification task is performed using Fuzzy button. The data assessment results are presented to an operator by a text message with a clear indication.
To verify the effectiveness of the GUI, several tests (24 tests) were performed under different cases and load levels (Figure 23). The (GUI) is tested by eight signals: two signals of load level for each case (healthy, 5%- unbalance and 10%-unbalance). The obtained results are presented in Tables 3 to 5.
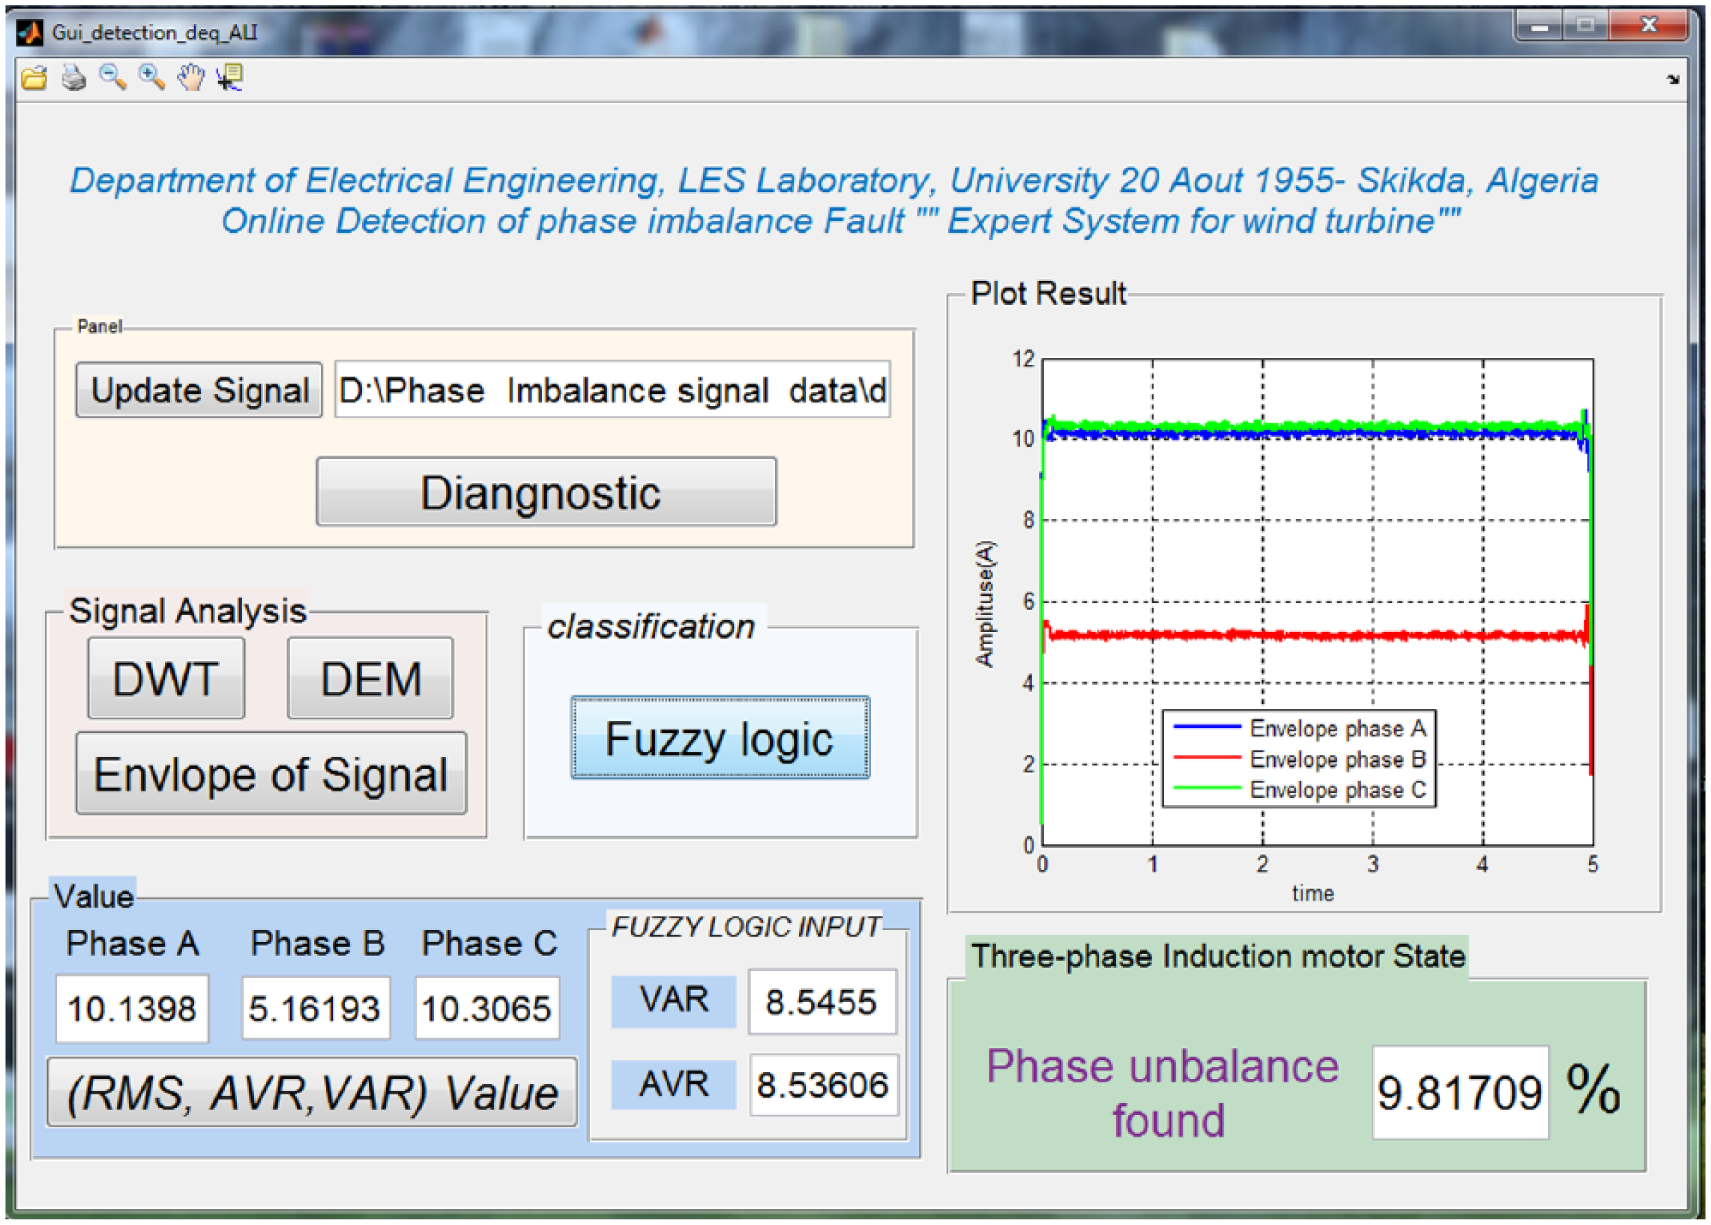
The developed GUI for the phase imbalance monitoring.
Results of healthy case.
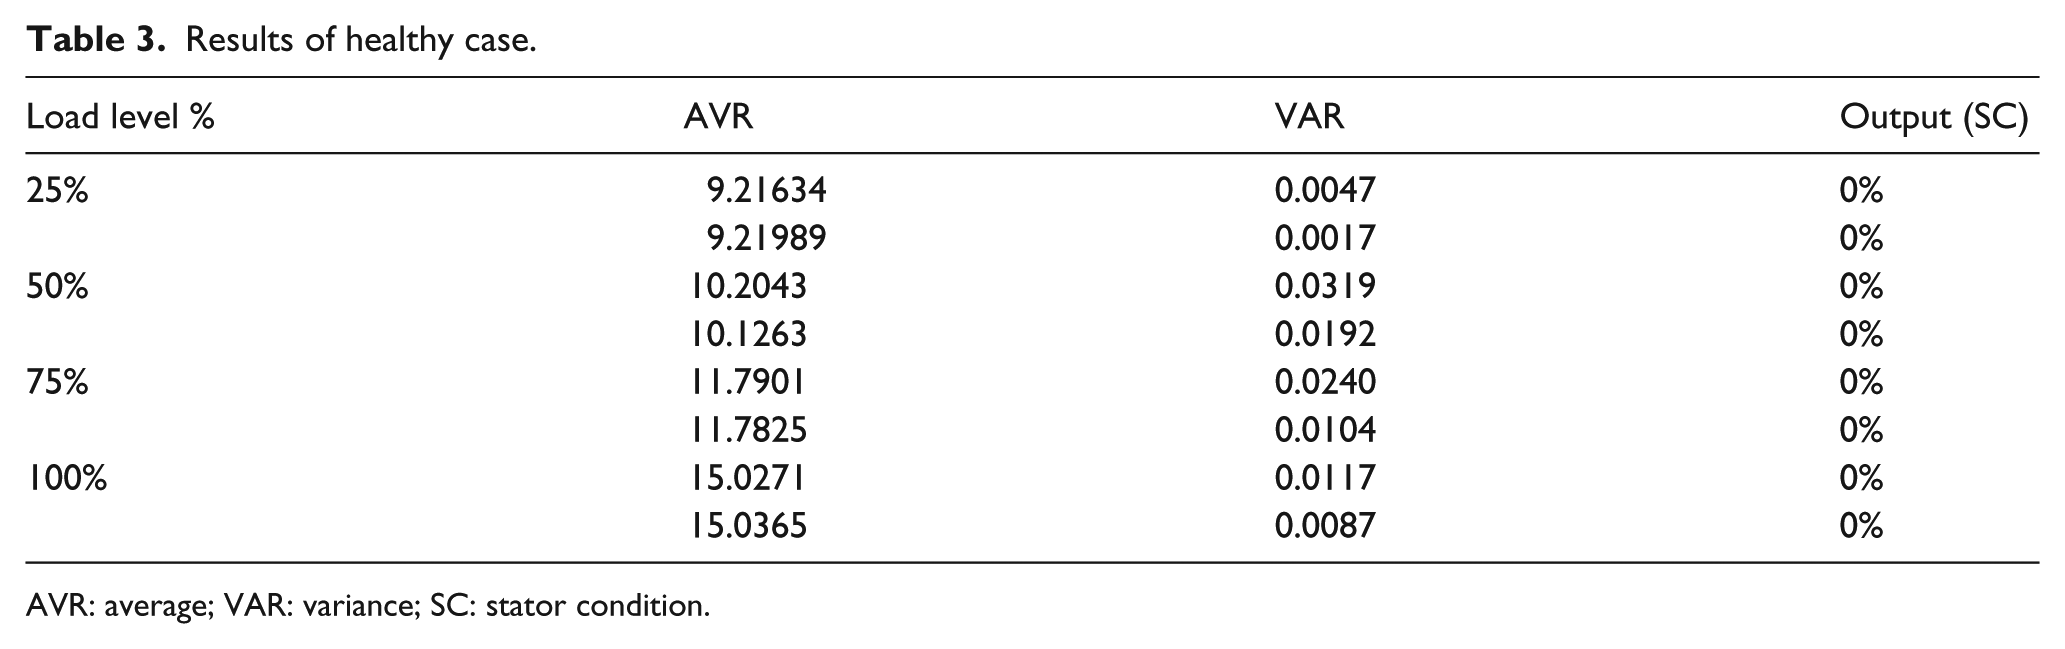
AVR: average; VAR: variance; SC: stator condition.
Results of 5% imbalance.
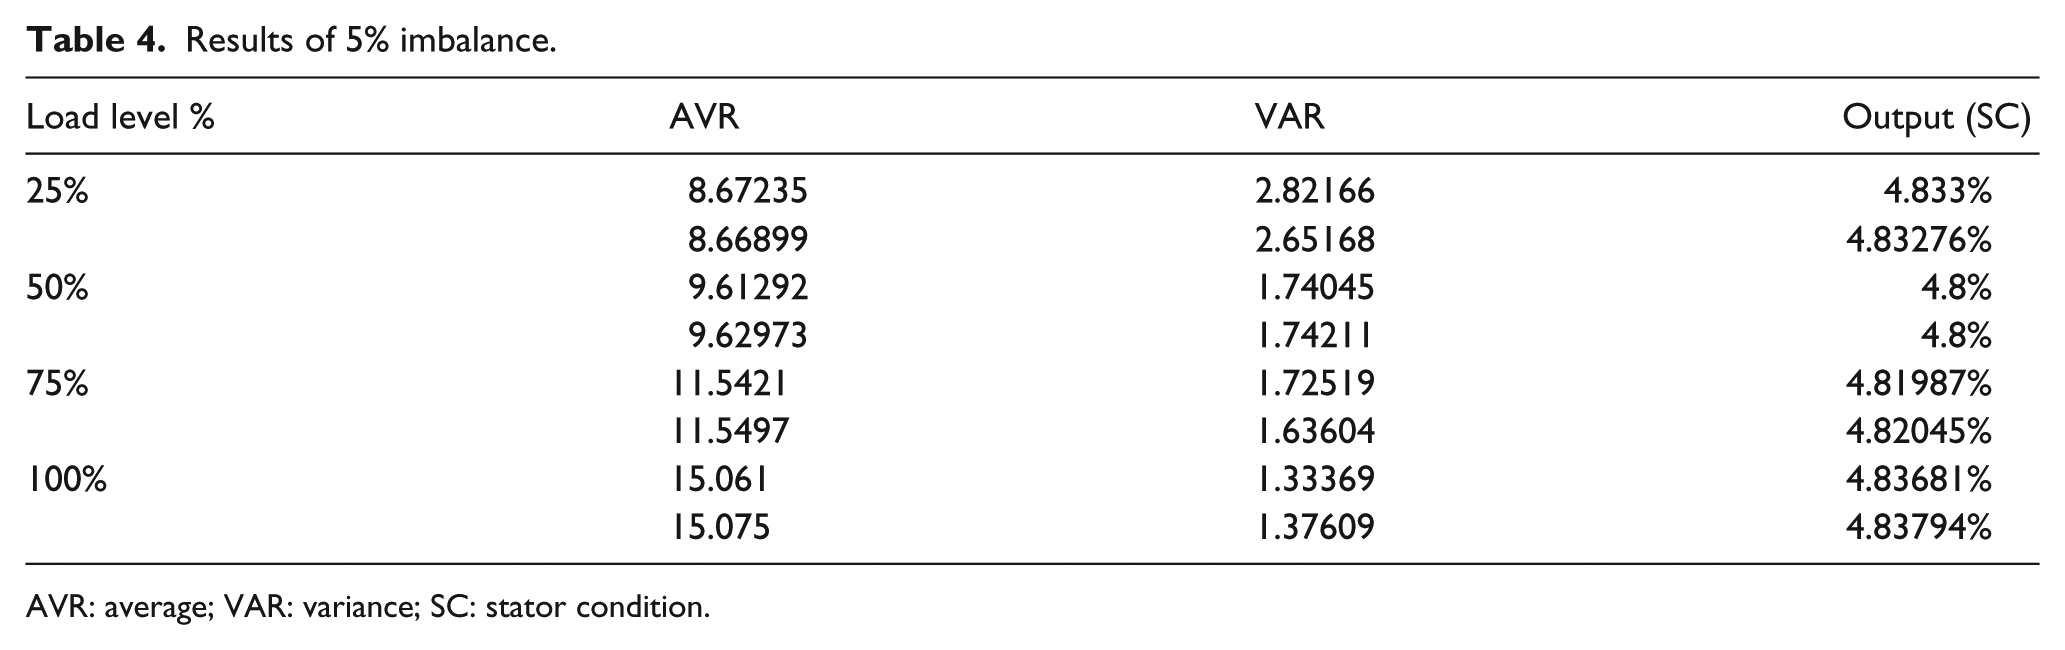
AVR: average; VAR: variance; SC: stator condition.
Results of 10% imbalance.
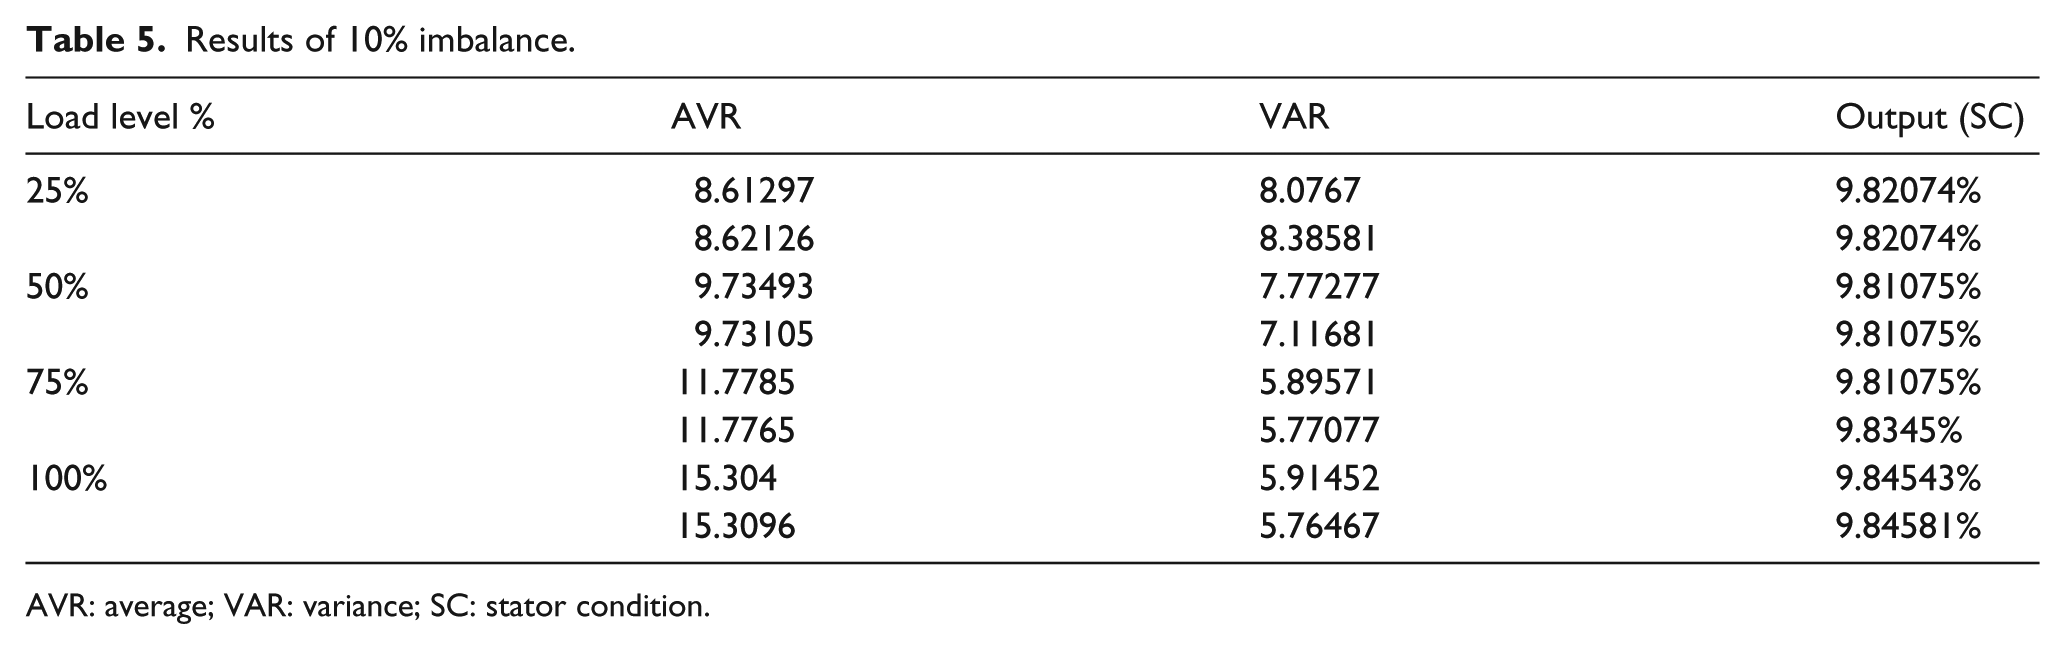
AVR: average; VAR: variance; SC: stator condition.
Conclusion
In this article, we propose a diagnosis algorithm that can detect the fault in the stator and rotor in the wind turbine yaw mechanism. This algorithm allows the online detection of the stator and rotor faults in wind turbines systems. In fact, the electrical configuration of yaw pitch uses induction motor powered by a frequency inverter, which makes the proposed algorithm suitable for online monitoring of the two systems yaw pitch and yaw drive. The algorithm used herein also allows us to integrate artificial intelligence methods, such as fuzzy logic in order to carry out a classification task of stator faults.
The proposed GUI software successfully detects phase’s imbalance in various operational conditions. The proposed method is sufficiently accurate, fast, and robust to variations in load, which makes it suitable for use in online applications in real time in the diagnosis and monitoring of distant offshore wind turbine.
Footnotes
Declaration of conflicting interests
The author(s) declared no potential conflicts of interest with respect to the research, authorship, and/or publication of this article.
Funding
The author(s) received no financial support for the research, authorship, and/or publication of this article.