
Abstract
Wind turbines have to be designed against extreme load during power production with the recurrence period of 50 years. This extreme load is usually calculated through statistical extrapolation. However, large uncertainties exist in the estimation of the extreme load. This study aims to reduce these uncertainties in the statistical extrapolation by using systematic simulations. First, a new criterion is proposed for the data sets to be used for the statistical extrapolation and the resulting uncertainty satisfies the requirement in the standard for prediction of wind load. Then, a new extrapolation factor for load extrapolation is proposed and the predicted maximum tower bending moments at all the heights show favorable agreement with measurement. Finally, empirical formulae are proposed to estimate the expected value of the maximum tower bending moment and the predicted values show good agreement with the numerical simulations.
Keywords
Introduction
Wind turbines have to be designed against extreme load during power production with the recurrence period of 50 years as specified in IEC61400-1:2005+AMD1:2010 (2010) for design load case 1.1 (DLC 1.1). This extreme load is usually calculated through statistical extrapolation in which the 50 years load is estimated from limited number of 10-min simulations.
The statistical extrapolation may result in uncertainties in the estimation of the extreme load. As shown by Moriarty (2008), different packs of the simulations can result in different estimations. These uncertainties can be controlled by the convergence criteria developed by Fogle et al. (2008). However, it is not clear whether these criteria are enough or not to satisfy the level of the uncertainty assumed in the partial safety factor for extreme load (Tarp-Johansen et al., 2002).
As an alternative to the load extrapolation, IEC61400-1 also provides a simple method for the extreme load estimation, which is to multiply a constant extrapolation coefficient of 1.5 to the expected value of the 10-min maximum load. However, the use of the constant coefficient may underestimate or overestimate the extreme load. In order to improve this overestimation, Ishii and Ishihara (2010) developed an empirical extrapolation coefficient as a function of turbulence intensity and annual mean wind speed based on the numerically simulated fore-aft tower base moment. The applicability of this factor to the other component of tower is questionable because the factor can be different depending on the components as shown by Moriarty (2008).
Ishii and Ishihara (2010) also developed empirical formulae to estimate the expected value of the 10-min maximum load to avoid complex simulation of the wind turbine assuming that the tower base moment is caused by the thrust force on the rotor, and the drag force on the nacelle and the tower. However, at the tower top, the effect of rotor moment on the tower bending moment is not negligible and it might underestimate the extreme load at the tower top.
Numerical model used in this study and its validation by the field test are described in “Numerical model and validation” section. A new criterion and a new extrapolation factor are then proposed to reduce the uncertainty in the statistical extrapolation in “A new convergence criterion” and “A new extrapolation factor” sections. Finally, empirical formulae are proposed to estimate the expected value of the maximum moment at all the positions of the tower and are validated by the numerical simulations in “Empirical formulae for the expected maximum tower load estimation” section.
Numerical model and validation
In this study, an offshore wind turbine at Choshi Offshore Demonstration Project (Fukumoto et al., 2013) is used to validate the numerical model. This wind turbine is installed on a gravity foundation, and wave load on the tower is negligible since wave hardly reaches the tower. “Field measurement at Choshi demonstration site” section describes the field measurement at Choshi demonstration site. Wind turbine model and its validation are presented in “Wind turbine model and validation” section.
Field measurement at Choshi demonstration site
Figure 1 shows the 2.4 MW wind turbine at Choshi demonstration site. Strain gauges are installed on the tower shell at 73.1 and 10.9 m above sea level as shown in Figure 1. Four strain gauges are installed at each height to measure the vertical strain. The initial offset of the strain gauges are calibrated by using the measured strain data during nacelle rotation test in which the nacelle-yaw angle is rotated 360° while wind turbine is in parked condition. The data were sampled at 50 Hz frequency and statistics are calculated for each 10 min. The supervisory control and data acquisition (SCADA) data of the wind turbine are also stored to record the operation status, pitch angle, rotor speed, and generated power at 1-s sampling frequency (Okubo et al., 2016).

Wind turbine of 2.4 MW at Choshi demonstration site.
To the east of the turbine, a met mast is installed to measure the wind characteristics. These data are used to model the wind for the validation. To investigate the characteristic of the turbulence, the bin average of the turbulence intensity for the whole range of wind speed from cut-in to cut-out was calculated in an increment of 1 m/s. Then, an approximation of the turbulence intensity distribution with wind speed was attempted by using the equation proposed in IEC 61400-1

Here,
Four months of the strain data are used to estimate the fore-aft tower bending moment. The data are divided into sets of 10-min data, and mean, maximum, and standard deviation are calculated for all the 10 min. Only such data where the wind turbine is in operation for all the 10 min are used for the validation.
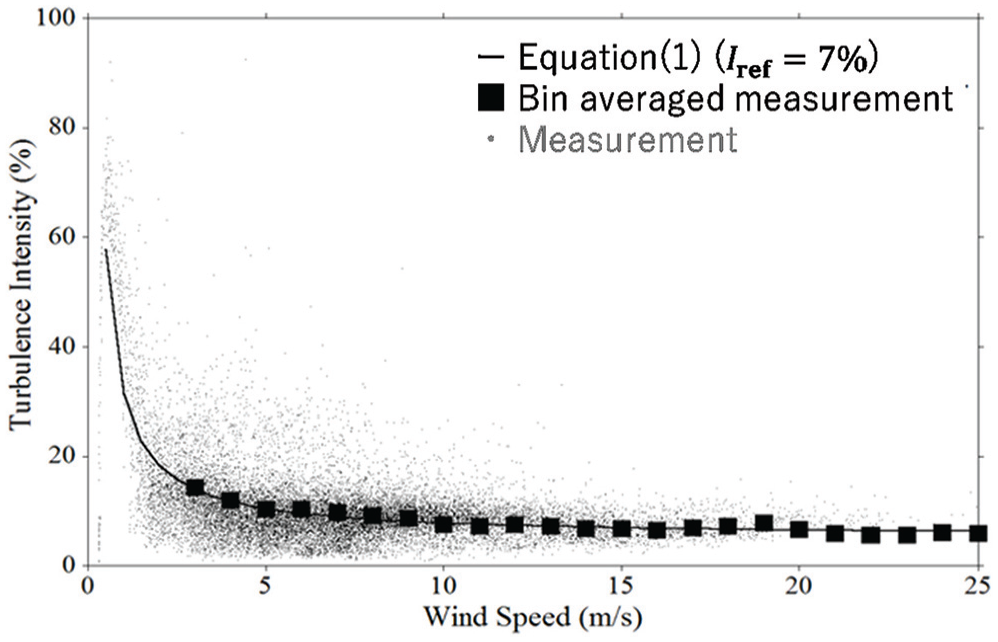
Measured turbulence intensity at the hub height at the observation mast.
Wind turbine model and validation
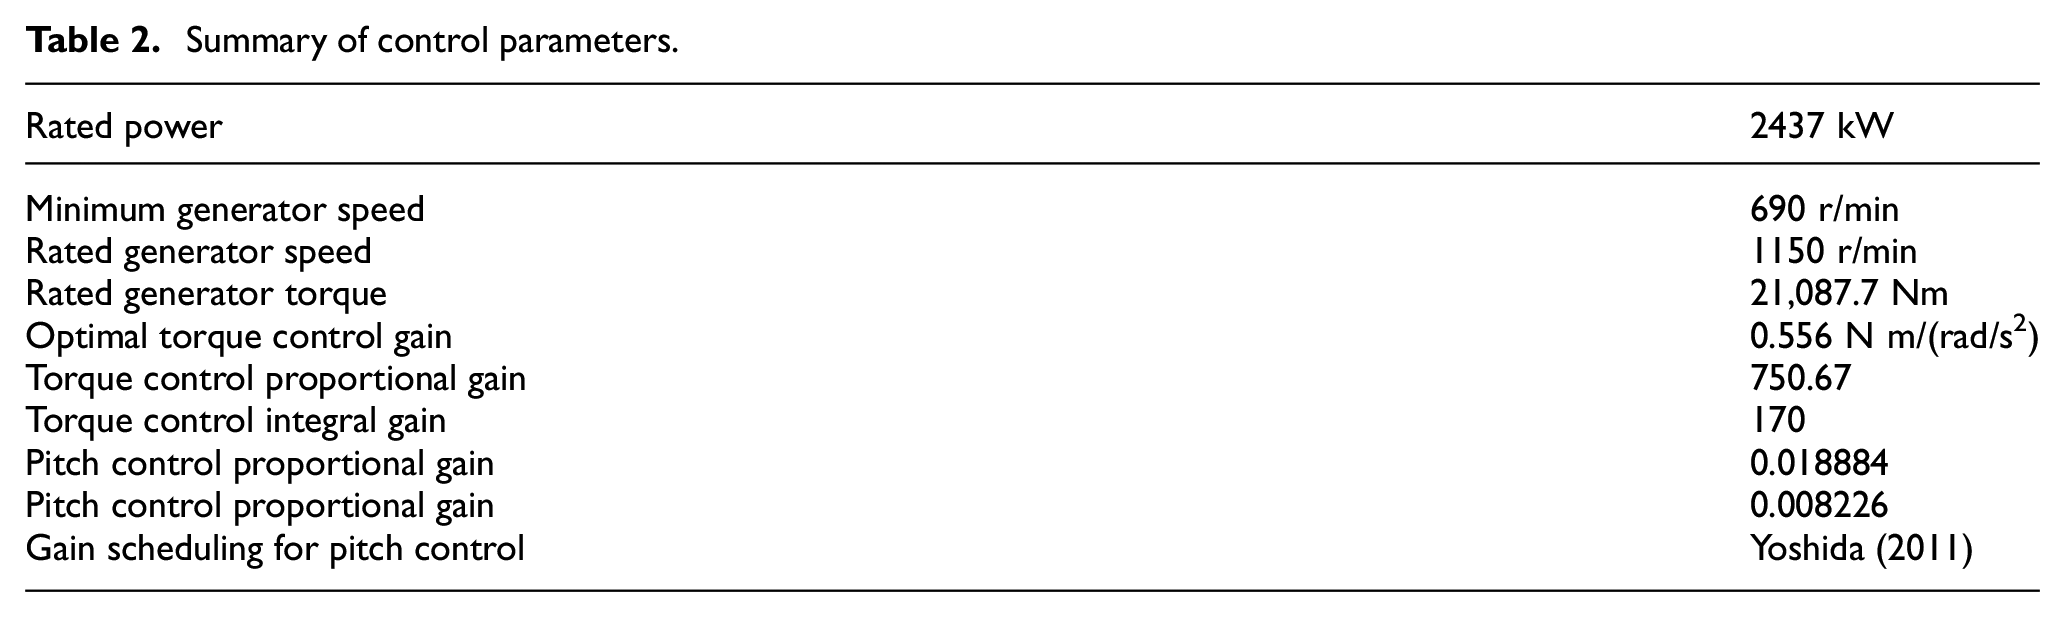
A wind turbine model was built by using GH Bladed 4.4 (DNV-GL, 2010) to simulate the wind loads during power production. The dimension and weight of the nacelle, hub, and the tower are shown in Table 1. The wind turbine has a conventional variable speed and a variable blade-pith-to-feather configuration, and the control parameters are based on the model proposed by Yoshida (2011), which are shown in Table 2. The nacelle-yaw angle control is not activated, and no yaw misalignment is assumed. The aerodynamic properties of the blade are based on the Japan Society of Civil Engineers (JSCE) guideline (Ishihara, 2010). The modal damping ratios of the first and second tower modes are based on the measurement carried out by Oh and Ishihara (2018).
The dimensions and weight of the nacelle, hub, rotor, and the tower.

Summary of control parameters.
To investigate the response of the wind turbine to different wind speeds, simulations are run from the cut-in wind speed of 4 m/s to the cut-out wind speed of 24 m/s with an increment of 1 m/s. At each wind speed, 35 different random turbulence seeds are used to generate different wind fields. Wind shear is set to 0.14 based on IEC 61400-1, whereas the Mann model was used to generate the turbulence (DNV-GL, 2010).
Power and thrust coefficient for different wind speed are calculated by using the described model and compared with the bin average value of the measurements as shown in Figure 3. The simulations show good agreements with the measurements. Figure 4 shows the comparison of mean, standard deviation, and maximum of the fore-aft tower bending moment at two different heights. The measurement data are the bin average of 10 min mean, standard deviation, and maximum for 4 months while the simulation results are the average of 10 min mean, standard deviation, and maximum for 35 different simulations with different turbulent wind field with different random seeds. The simulation results give good agreements with the measurements.
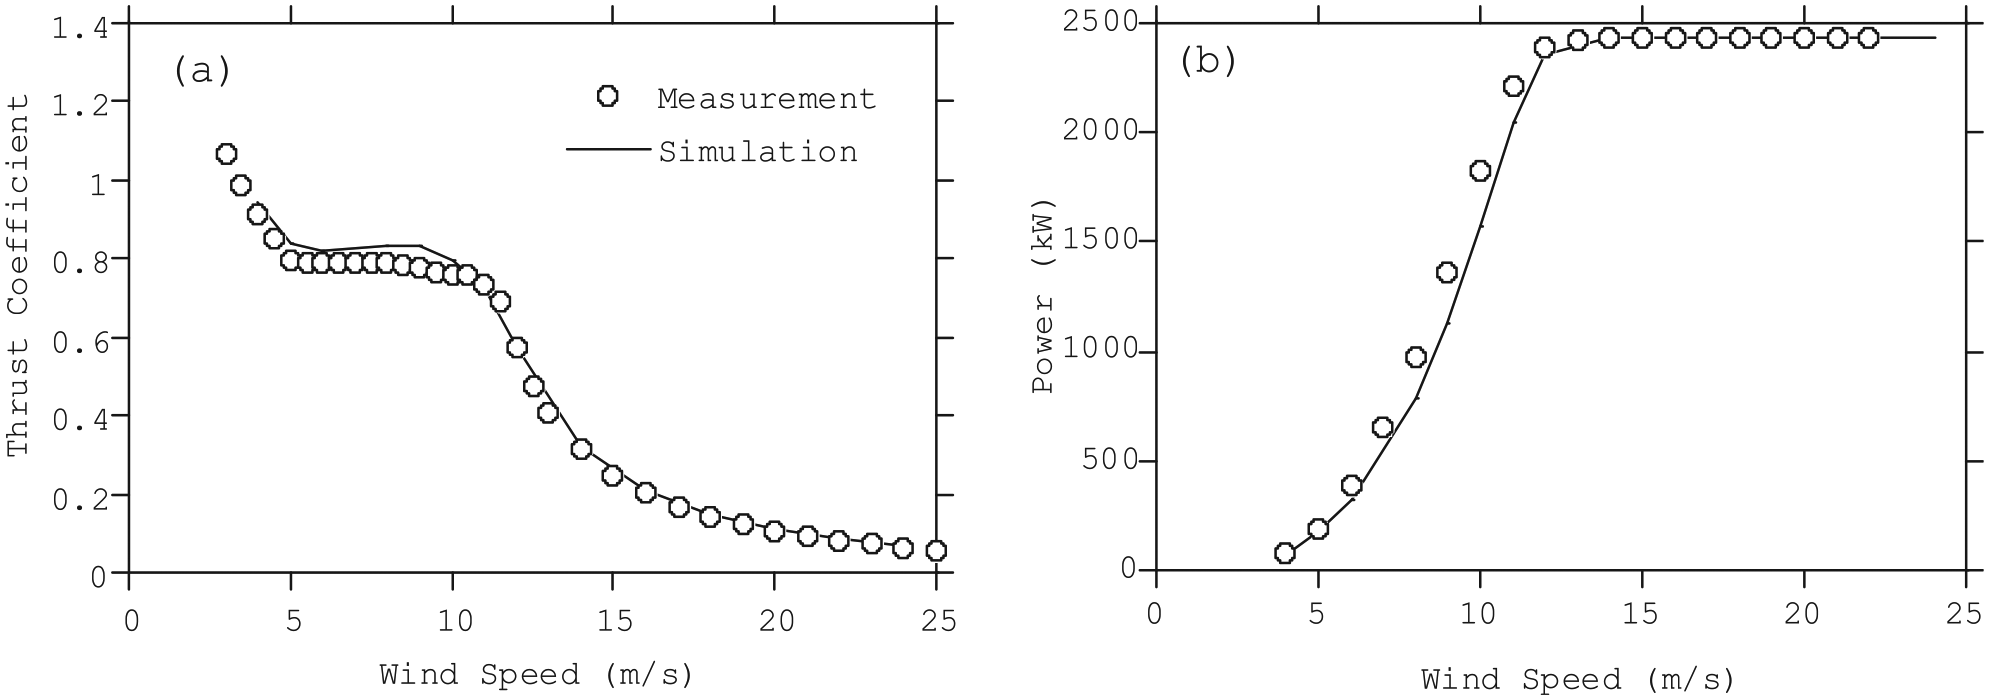
(a) Thrust curve and (b) power curve of the wind turbine.

Fore-aft tower bending moment: (a) mean at 73.1 m, (b) mean at 10.9 m, (c) standard deviation at 73.1 m, (d) standard deviation at 10.9 m, (e) maximum at 73.1 m, and (f) maximum at 10.9 m.
Extreme load estimation
The extreme load during power production is investigated by using the numerical model validated in “Numerical model and validation” section. Two different turbulence intensity levels (Iref = 12% and 16%) and four different annual mean wind speeds (
First, the uncertainty of the extrapolated extreme load based on the numeral simulations is discussed and a new convergence criterion is proposed in “A new convergence criterion” section. A new extrapolation factor is then proposed to predict maximum tower bending moments in “A new convergence criterion” section. Finally, empirical formulae to estimate the expected value of maximum tower moment are proposed in “Empirical formulae for the expected maximum tower load estimation” section.
A new convergence criterion
As specified in IEC61400-1, the extreme load is usually extrapolated from maximum loads of limited number of simulations by fitting the simulated maximum loads to three-parameter Weibull distribution. To reduce the uncertainty of the extrapolation, a criterion proposed by Fogle et al. (2008) is typically used. Figure 5(a) shows the example of the simulated maximum fore-aft tower base bending moment that satisfies the criteria and the fitted distribution for
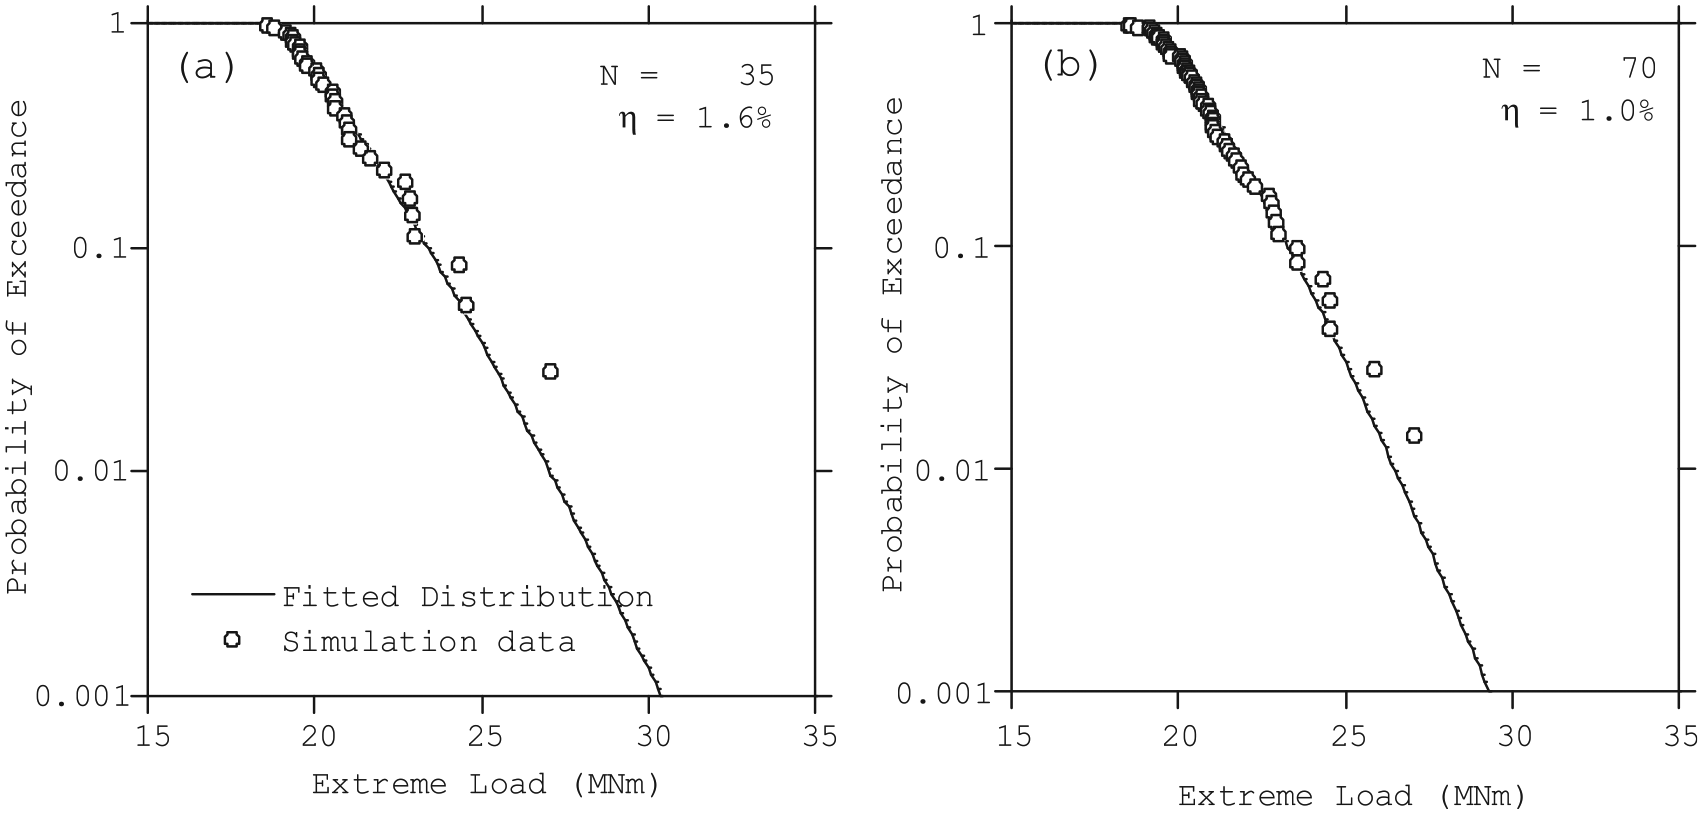
Probability distribution of maximum fore-aft tower base bending moment: (a) conventional criteria and (b) proposed criteria for

Estimated extreme tower base fore-aft bending moment during power production by using different data sets that satisfy the conventional and proposed criteria.
In addition to these criteria, more strict criteria are proposed to reduce the uncertainty in this study. Proposed convergence criteria are expressed in terms of relative error


In the proposed criteria, the relative error is limited depending on the turbulence intensity as shown in equation (5)

Figure 5(b) shows the probability distribution of the estimated extreme load from set of simulations, which satisfies the proposed criteria. The outliers of the data decrease by using the proposed criteria. Figure 6 presents the set of the estimated extreme load. The COV of the extreme value estimated from set of simulated maximum load that satisfies the proposed criteria decreases to 5.6%, which is closer to the assumed COV in IEC61400-1 for the partial safety factor of extreme load in the study by Tarp-Johansen et al. (2002).
A new extrapolation factor

where
In this study, a new extrapolation factor,

where
The extreme fore-aft moment at the top and bottom of the tower is calculated for different annual mean wind speed and different turbulence intensity by using the extrapolation with the criteria proposed in the previous section, and the ratio between

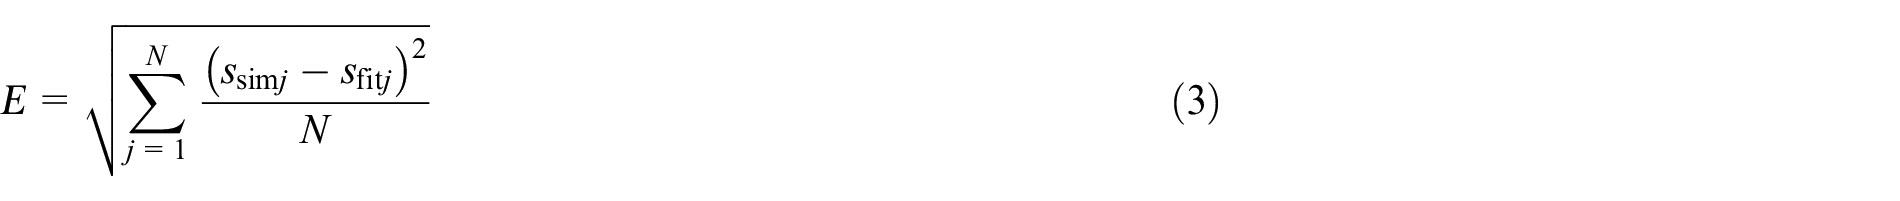
The extrapolation coefficient

Proposed new extrapolation factor
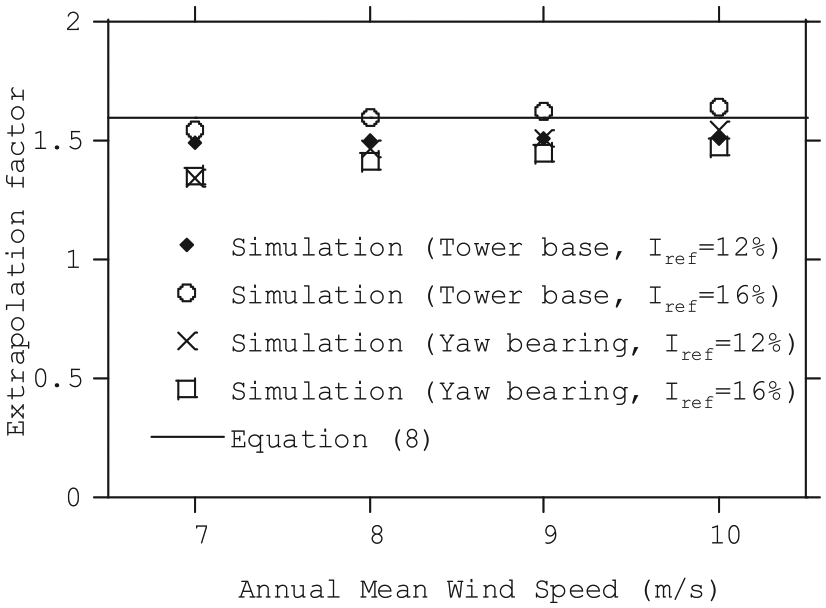
Figure 8 shows the ratio of the extreme value of the fore-aft bending moment and the maximum of the expected maximum fore-aft bending moment together with the proposed extrapolation coefficient as shown in equation (9). The extrapolation coefficient differs considerably depending on the turbulence intensity and the position of the tower. Clearly, the extrapolation coefficient for the yaw bearing fore-aft moment exceeds 1.5, while the extrapolation coefficient for the tower bottom fore-aft moment is about 1.2. The extrapolation coefficient at the tower bottom decreases since the mean value increases, and this change is well estimated by equation (9).
Proposed and simulated extrapolation coefficients for (a) yaw bearing fore-aft moment and (b) tower bottom fore-aft moment.
Empirical formulae for the expected maximum tower load estimation
In Japan, the actual wind conditions at site are quite different from those specified in IEC class. For this reason, the owner has to complete the assessment of structural integrity based on the site wind condition. The extreme wind event with a 50-year return period in the idling and standing still conditions can be accurately estimated by using an equivalent static wind load evaluation considering non-Gaussian assumption (Binh et al., 2009). However, the wind loads is affected by the pitch control under operating condition. Therefore, the wind load cannot be explained by the conventional quasi-static theory.
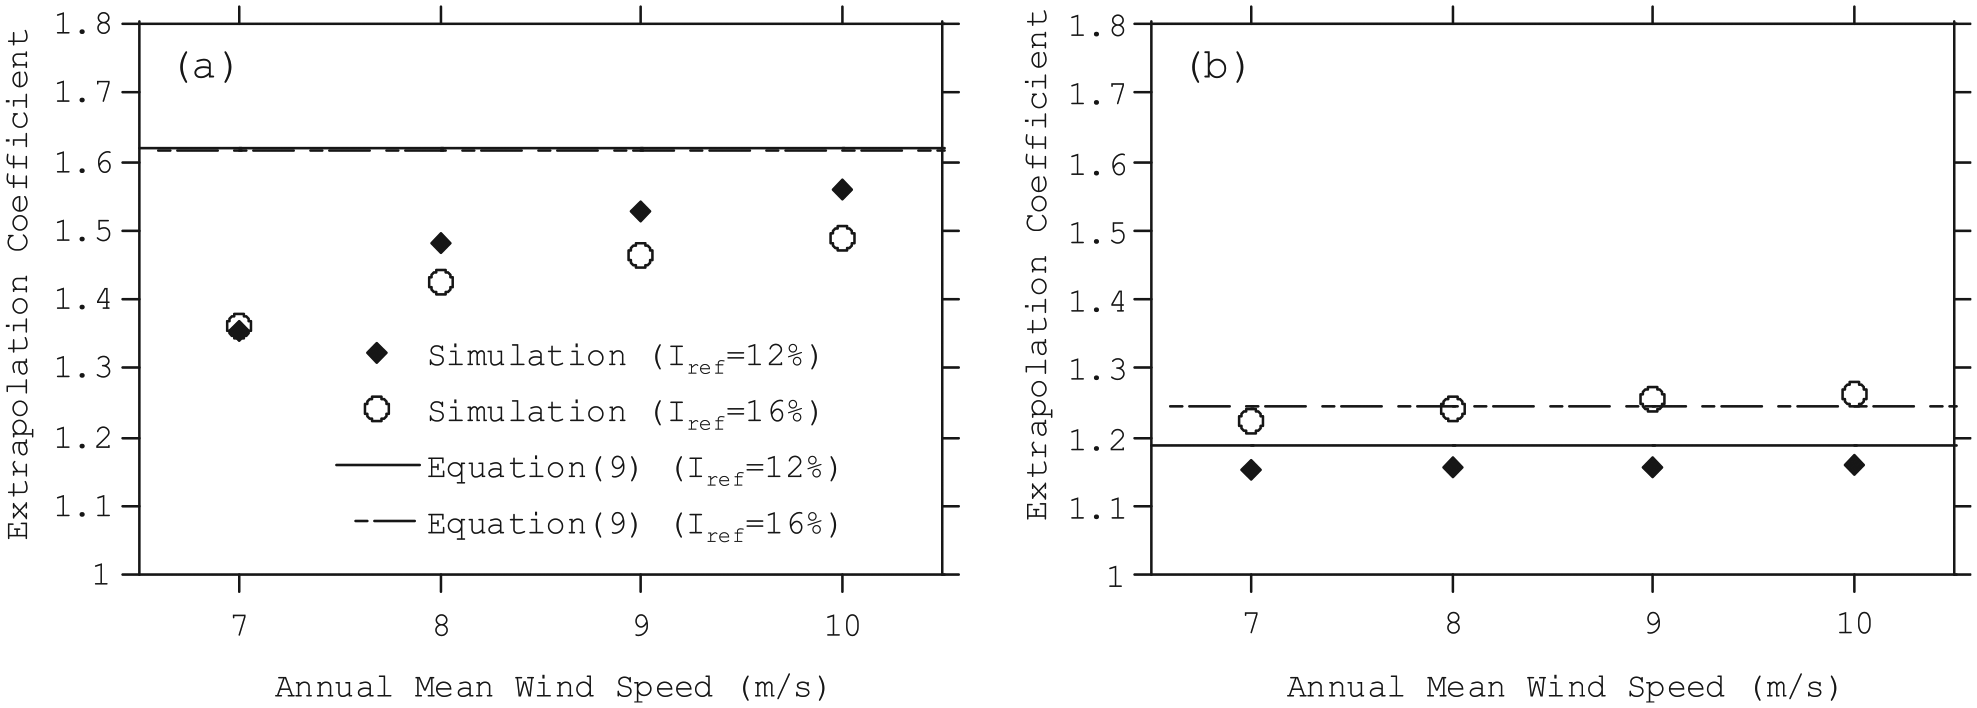
Ishii and Ishihara (2010) proposed an empirical model for the estimation of the expected value of the fore-aft tower bending moment assuming that fore-aft bending moment on a wind turbine tower is caused by the thrust force acting on the rotor and the drag forces acting on the tower and the nacelle only. However, the moment on the rotor plane and the gravity force of nacelle also leads to the fore-aft bending moment on the wind turbine tower as shown in Figure 9. The offset of the center of gravity of the nacelle causes tower bending moment. The rotor moment is caused by the weight of the rotor itself and wind shear, that is, the difference in the wind speed at the upper tip and the lower tip of the rotor.
Scheme of the forces acting on the wind turbine rotor, nacelle, and tower in the fore-aft direction.
Figure 10 shows the cause of the fore-aft tower bending moment for two different wind speeds at all the heights of tower. It is clear that at the tower base, the main cause of the fore-aft moment is the thrust force. However, at the tower top, this is not the case. In summary, the tower bending moment during power production


Cause of tower bending moment at different heights of the tower: (a) u = 13 m/s and (b) u = 18 m/s.
Each term in equation (10) is separated into mean component and fluctuating component. In this study, the fluctuating component of the tower moment caused by thrust and drag (


Here,
First,
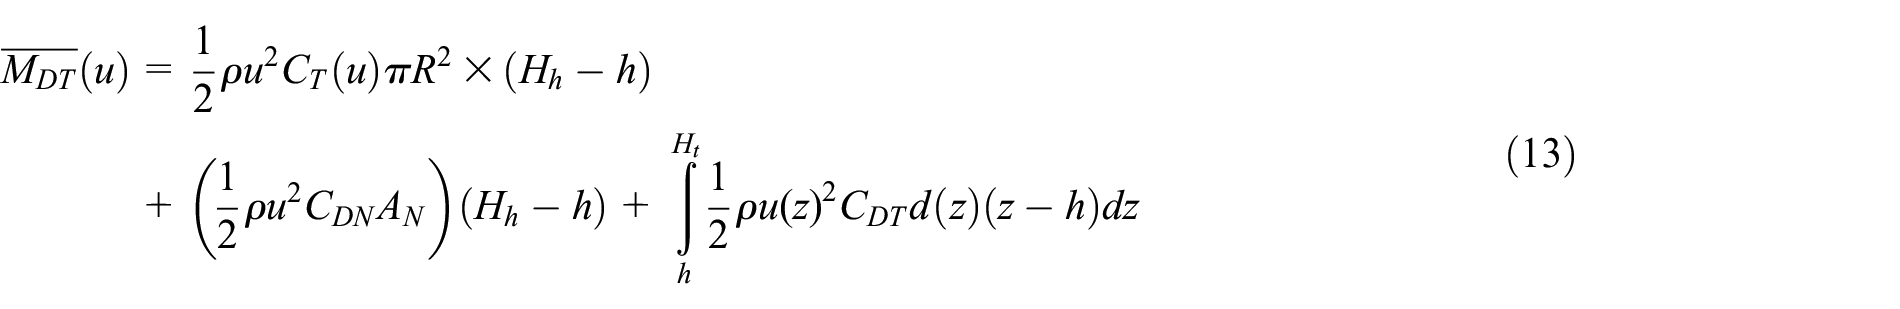
Here,
The standard deviation of thrust and drag

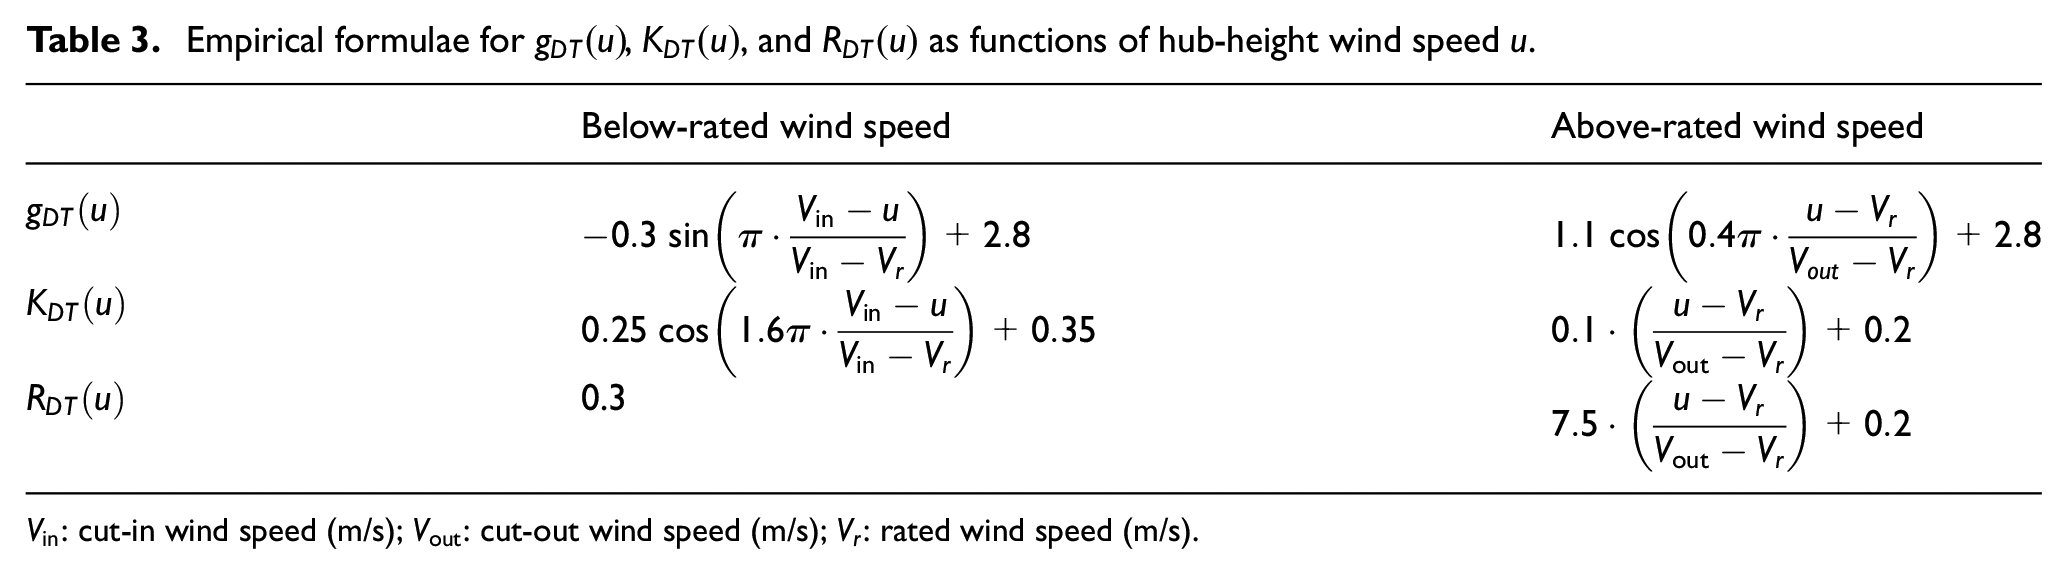
In this study, empirical formulae for these parameters are proposed as shown in Table 3. The proposed formulae are derived empirically as to fit the values based on simulations. Figure 11 shows the comparison of the simulation and the proposed empirical formulae for peak factor, size reduction factor and the ratio of the resonance to the background response variance. Proposed models show good agreements with the simulations.
Empirical formulae for
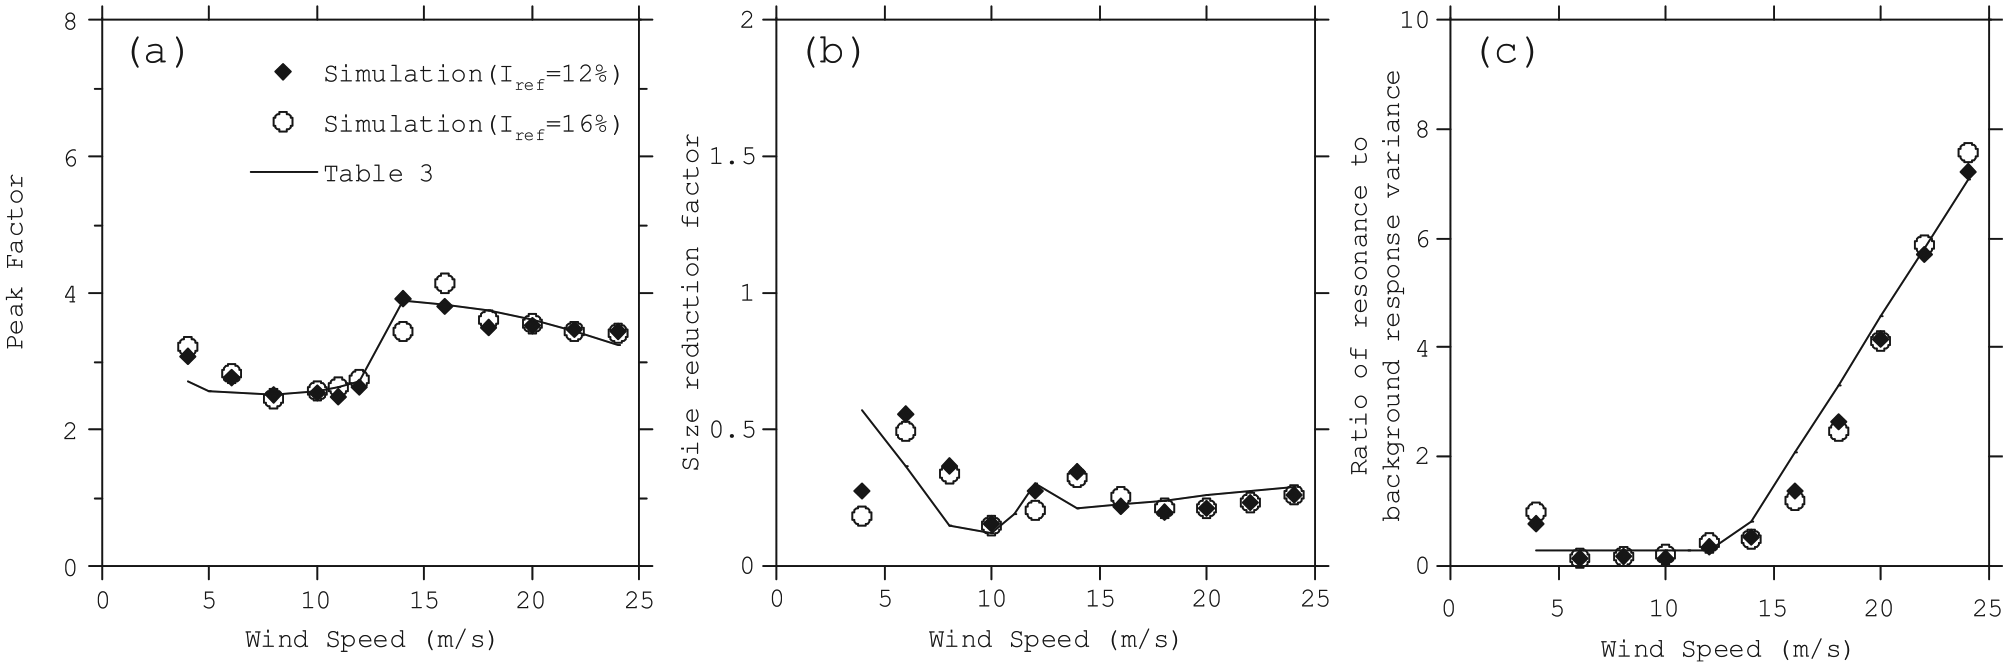
Parameters to estimate the fore-aft tower bending moment caused by thrust and drag forces: (a) peak factor
Then, the parameters related to the rotor moment,

Here,
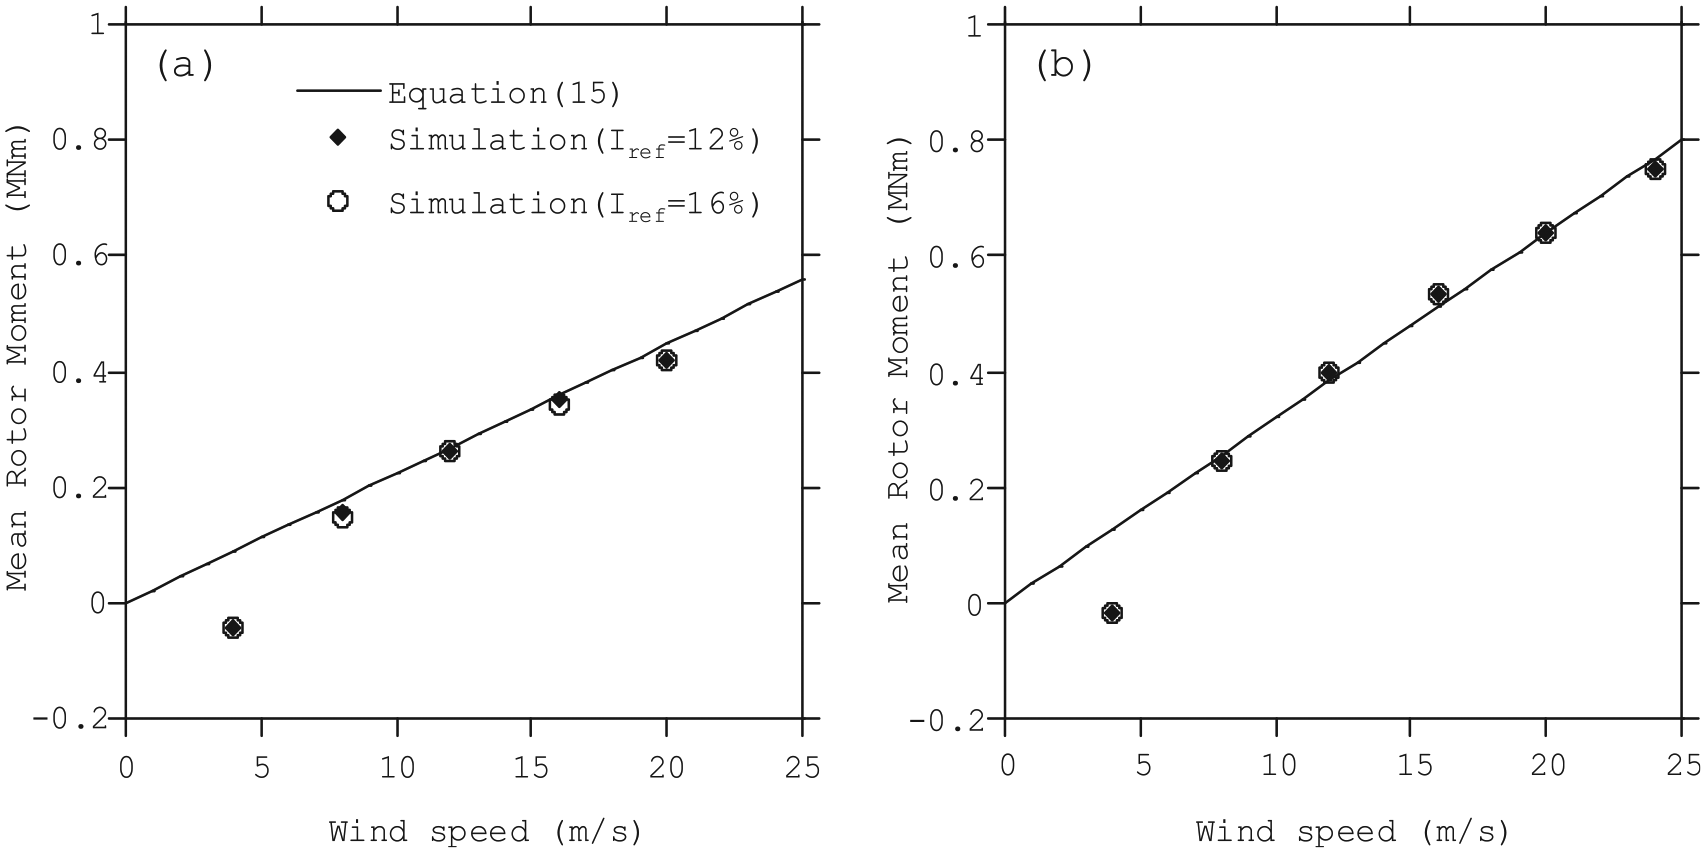
Mean rotor moment: (a)
The fluctuating component (standard deviation) of the rotor bending moment

The root mean square of the rotor moment for different wind shear, different turbulence intensity, and different wind speed is plotted in Figure 13. It is clear that unlike its mean, the fluctuating component is not only the function of wind shear and wind speed, but also the function of turbulence intensity. In this study, the

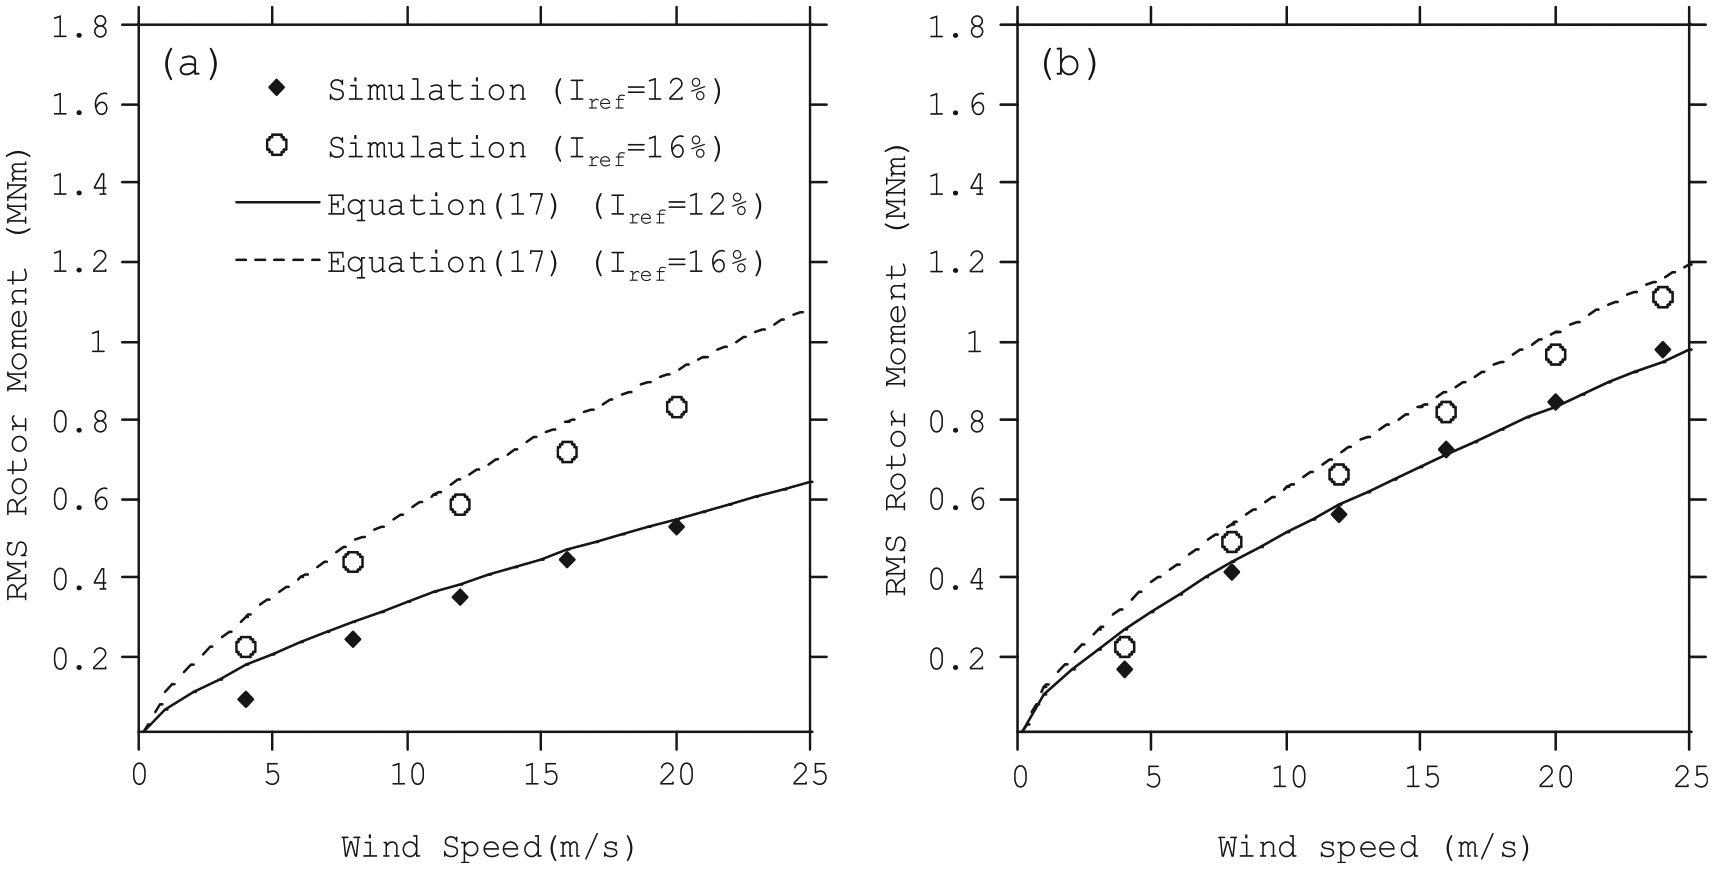
RMS of rotor moment: (a) α = 0.14 and (b) α = 0.20.
The peak factor is defined as the ratio of maximum value subtracted by mean value, and standard deviation

The peak factors are calculated for all the cases and plotted in Figure 14, which indicates that an uniform peak factor can be used for all the cases. Therefore, the peak factor is assumed to be 3.5 for all the hub-height wind speeds

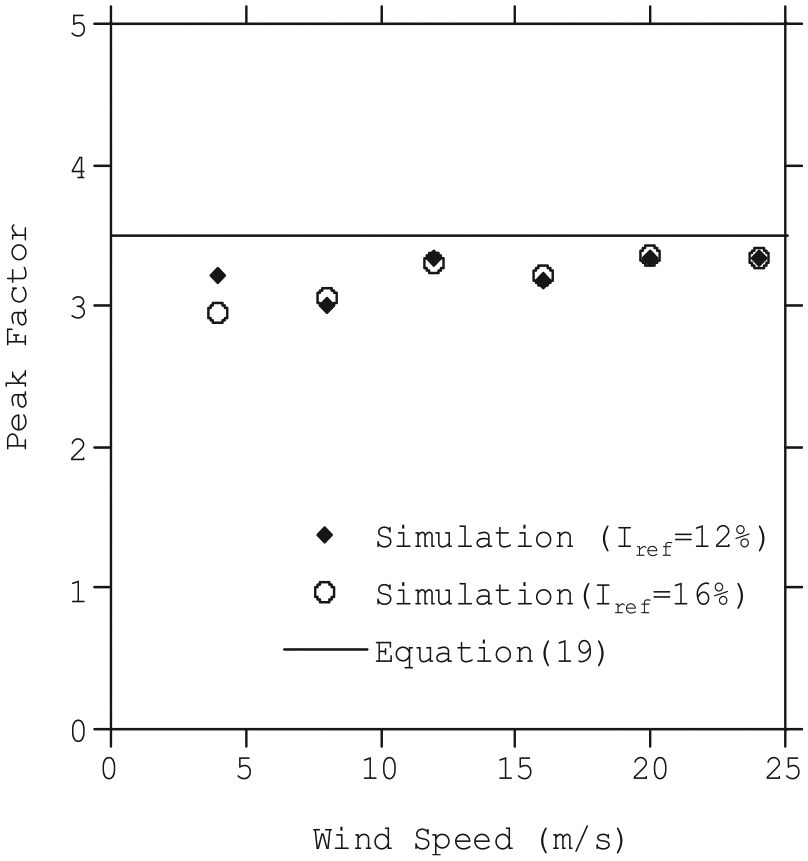
Peak factor for rotor moment.
Finally, numerically simulated fore-aft tower moment and estimated value by using the proposed equations (11) and (12) are compared and shown in Figure 15. The proposed model shows good agreement with the simulations for all the cases.

Fore-aft bending moment: (a) mean at yaw bearing, (b) expected maximum at yaw bearing, (c) mean at tower bottom, and (d) expected maximum at tower base.
Conclusion
In this study, a numerical model of a wind turbine is developed and dynamic simulations are carried out to investigate the extreme wind load on the wind turbine tower during power production. Following conclusions were obtained.
A new criterion is proposed for the data sets to be used for the statistical extrapolation. The resulting uncertainty satisfies the requirement in the standard for prediction of wind load.
A new extrapolation factor is proposed by subtracting the mean value. The predicted extreme loads during power production at all the heights of the tower show good agreement with the measurement.
The expected value of 10-min maximum tower bending moment by the proposed empirical formulae, which includes the effect of drag forces on the tower and the nacelle, thrust force, rotor moment and gravity force, shows good agreement with the simulation results.
Footnotes
Acknowledgements
The on-site measurement was carried out in cooperation with Tokyo Electric Power Company (TEPCO) and Kajima Corporation. The authors wish to express their deepest gratitude to the concerned parties for their assistance during this study.
Declaration of conflicting interests
The author(s) declared no potential conflicts of interest with respect to the research, authorship, and/or publication of this article.
Funding
The author(s) disclosed receipt of the following financial support for the research, authorship, and/or publication of this article: This study is carried out as a part of “Offshore Wind Power Generation System Proving Research” funded by New Energy and Industrial Technology Development Organization (NEDO) Japan and Tokyo Electric Power Company (TEPCO).