




Abstract
With the continuous growth of wind power access capacity, the impact of intermittent and volatile wind power generation on the grid is becoming more and more obvious, so the research of wind power prediction method has been widely concerned. Accurate wind power prediction can provide necessary support for the power grid dispatching, combined operation of generating units, operation, and maintenance of wind farms. According to the existing wind power prediction methods, the wind power prediction methods are systematically classified according to the time scale, model object, and model principle of prediction. The physical methods, statistical methods include single and ensemble prediction methods related to wind power prediction are introduced in detail. The error evaluation indicator of the prediction method is analyzed, and the advantages and disadvantages of each prediction method and its applicable occasions are given. At the same time, in view of the existing problems in the wind power prediction method, the corresponding improvement plan is put forward. Finally, this article points out that the research is needed for wind power prediction in the future.
Keywords
Introduction
With the rapid development of the world economy, the corresponding energy demand has increased dramatically. Traditional fossil energy is facing the threat of energy exhaustion. At the same time, the climate warming caused by the large-scale consumption of traditional fossil energy and the increasingly serious environmental pollution problems are becoming increasingly prominent, seriously threatening the ecosystem, social economy, and human health (Tian et al., 2020a). In order to cope with the shortage of traditional fossil energy and the environmental pollution caused by traditional fossil energy, green energy has become the development direction of governments in various countries around the world (Hao et al., 2020). As a green and renewable energy, wind power generation has been widely applied and developed all over the world (Liu et al., 2016). According to the World Wind Energy Association, the total installed capacity of wind power reached 597 GW by the end of 2018. In 2019, the new installed capacity of wind power reached 50.1 GW. The wind power data of 2019 have not been released, but the estimated new installed capacity is 61.8 GW.
With the rapid development, wind energy is also facing many serious problems. Because of the instability of wind itself, wind power generation is volatile and intermittent, which will cause serious difficulties in wind power dispatch (Wang et al., 2020). Therefore, accurate prediction of wind power can effectively alleviate the strong uncertainty brought by large-scale wind power grid connection to power system operation, which has important theoretical and practical application value (Li et al., 2020a; Tian, 2019; Tian et al., 2019). According to the characteristics of time scale, research object, dependent data, prediction model, and different implementation methods, wind power prediction methods can have many classification systems, but no matter what classification system is divided, there is no unified standard in academia and industry.
Classification based on time scale
In terms of time scale, wind power prediction includes short-term, medium-term, and long-term (Colak et al., 2012). The time scale of short-term prediction is to predict in advance of several hours to several days. The results of short-term wind power prediction can help the power grid to carry out reasonable economic dispatch, unit combination operation, and choose the right time to maintain the wind turbine. The time scale of medium-term prediction is to predict in advance of several days to several months. The medium-term wind power prediction results help wind farms to formulate quarterly generation plans and arrange large-scale maintenance activities. The time scale of long-term prediction is to predict in advance of several months to several years. The long-term wind power prediction can assess the potential annual average power generation in a region, and it is mainly used for site selection of wind farms. Due to the uncertainty of the wind power system, the time scale of the current wind power prediction results mostly focuses on the short-term.
Classification based on prediction model
According to the characteristics of the prediction model, the prediction method can be divided into physical method, statistical learning method, and ensemble method (Scher and Molinder, 2019). The physical method is based on a series of detailed physical equations to calculate the evolution rule of meteorological variables including wind speed and direction in the future, and then converts wind speed into wind power prediction value. It does not need to rely on a large number of historical data. For the newly built wind farm, because there is not enough historical data accumulated, the physical method is a more appropriate choice. Statistical learning prediction method refers to the use of probability, statistics, machine learning, and other theories and methods to find hidden patterns and rules in a large number of historical meteorological forecast data, historical meteorological measured data, historical wind farm operation data, and other possible influencing factors to predict future wind power. The ensemble method is to combine different methods to improve the stability and accuracy of wind power prediction by virtue of their advantages (Liu et al., 2020).
Classification based on spatial scale
According to the difference of wind power development scale, the predicted spatial scale can be divided into wind turbines, wind farms, and wind power clusters (Shaheen and Abdallah, 2017). In the early stage of wind power development and wind power prediction research, due to the small scale of wind farms and the small number of wind turbines, the wind power prediction method is for a single wind turbine. However, with the increase in the scale of wind farms and the rapid increase in the number of wind turbines, the prediction of wind power for each fan is not realistic and has no practical significance. Moreover, from the perspective of power system operation, system dispatchers are more concerned about the wind power of wind farms or even a region, so most of the wind power prediction methods are for wind farms and wind power clusters.
Classification based on prediction results
The classification of wind power prediction based on prediction results includes deterministic prediction and probabilistic prediction (Yang et al., 2019a). Deterministic prediction means that only a certain value is given for each future time point as the prediction result. In the statistical sense, the determined value is the expected value of the possible wind power prediction result at that time point. The result form of deterministic prediction is simple, intuitive, easy to understand, and its error evaluation is relatively direct. It only needs to compare with the measured value in the same period to get the error value, but its disadvantage is that the prediction information provided is insufficient, which cannot provide enough decision information support for the dispatching operation and market transactions of the power system (Liu et al., 2019). In fact, due to the uncertainty of wind power, the prediction results of wind power should also include additional uncertainty information. Probabilistic prediction provides the range of the possible fluctuation of the prediction value under a certain confidence level, namely, the range of the prediction error (Khorramdel et al., 2018). Probabilistic prediction should ensure that the fluctuation range of prediction results is as small as possible. But at the same time, the range can cover the real value.
Classification based on actual prediction system
According to the difference of the implementation subject and operation mode of the final prediction system, wind power prediction can be divided into decentralized prediction and centralized prediction (Quan et al., 2014). Each wind power provider should be responsible for providing as accurate prediction results as possible for the wind power it produces. This form of wind power prediction, in which each wind power provider or even each wind farm independently and only undertakes its own wind power, is called decentralized prediction (Rosato et al., 2019). Centralized prediction refers to the development of a set of wind power forecasting system at the dispatching end of the power grid, which is independently predicted by the dispatcher. Centralized prediction can avoid the risk caused by too much power prediction error provided by individual wind power providers or wind farms (Yang et al., 2019b). On the other hand, it can evaluate and check the overall forecasting level of each wind power provider or wind farms.
The relationship of different wind power prediction methods can be shown in Figure 1. In recent years, many scholars have studied and summarized the wind power prediction methods, and summarized the classification of wind power prediction methods (Ellahi et al., 2019; Giebel and Kariniotakis, 2017; Wang et al., 2019b). Based on the previous work, this article makes a more systematic classification and summary of wind power deterministic prediction methods.

The relationship between the classification systems of different wind power prediction methods.
The main contents of other parts of this article are as follows. Section “Wind power prediction tools and systems” introduces some typical wind power prediction tools and systems. Section “The deterministic prediction of wind power” introduces the deterministic prediction of wind power. Section “Discussions” discusses the future work of wind power prediction. The summary and prospects of this article are summarized in section “Conclusion and future work.”
Wind power prediction tools and systems
With the continuous deepening of research on wind power forecasting methods, the rapid development of relevant supporting mathematical theory and computer technology, as well as the accumulation of operation data, some countries, especially Denmark, Spain, Germany, the United States, and other countries, have already had basically mature wind power forecasting systems as early as the 1990s, and developed and improved multiple sets of practical business using wind power forecasting system. These systems have achieved good prediction results.
In 1990, Landberg developed a wind power prediction system, named Prediktor, in Denmark Risø National Laboratory using the physical method (Agarwal et al., 2018). The main idea of Prediktor is to convert the wind speed and wind direction prediction values of numerical weather prediction (NWP) to the wind speed and wind direction at the height of the wind turbine hub through certain methods, and then get the power prediction values of the wind farm according to the power curve. Finally, combined with the actual situation of the wind farm, the predicted value is modified according to the situation and the operation efficiency of the wind farm. The system uses high-resolution limited area model (HIRLAM) as the input of NWP, and combines the wind atlas analysis and application program (WAsP) model to convert the wind speed and direction to the wind speed and direction of fan height. The framework of the Prediktor system is shown in Figure 2. Prediktor system can provide the expected production of wind farms up to typically 48 h every 6 h. Prediktor was applied to 15 wind farms connected to the Electricity Supply Board (ESB) system in Ireland from February 2001 through to June 2002. The 15 wind farms have a total capacity of 106.45 MW, representing most of the installed wind power capacity in the country at the time. The only measured power data available were the metered 15-min time resolution energy data from each of the wind farms. In the applications, the Prediktor forecasting system performed better than persistence model for all look-ahead times except those less than 6 h. The results of practical system show that the standard deviation of errors of Prediktor system lie in the range 18%–33%, whereas the corresponding standard deviation of errors for persistence can be up to 52%.
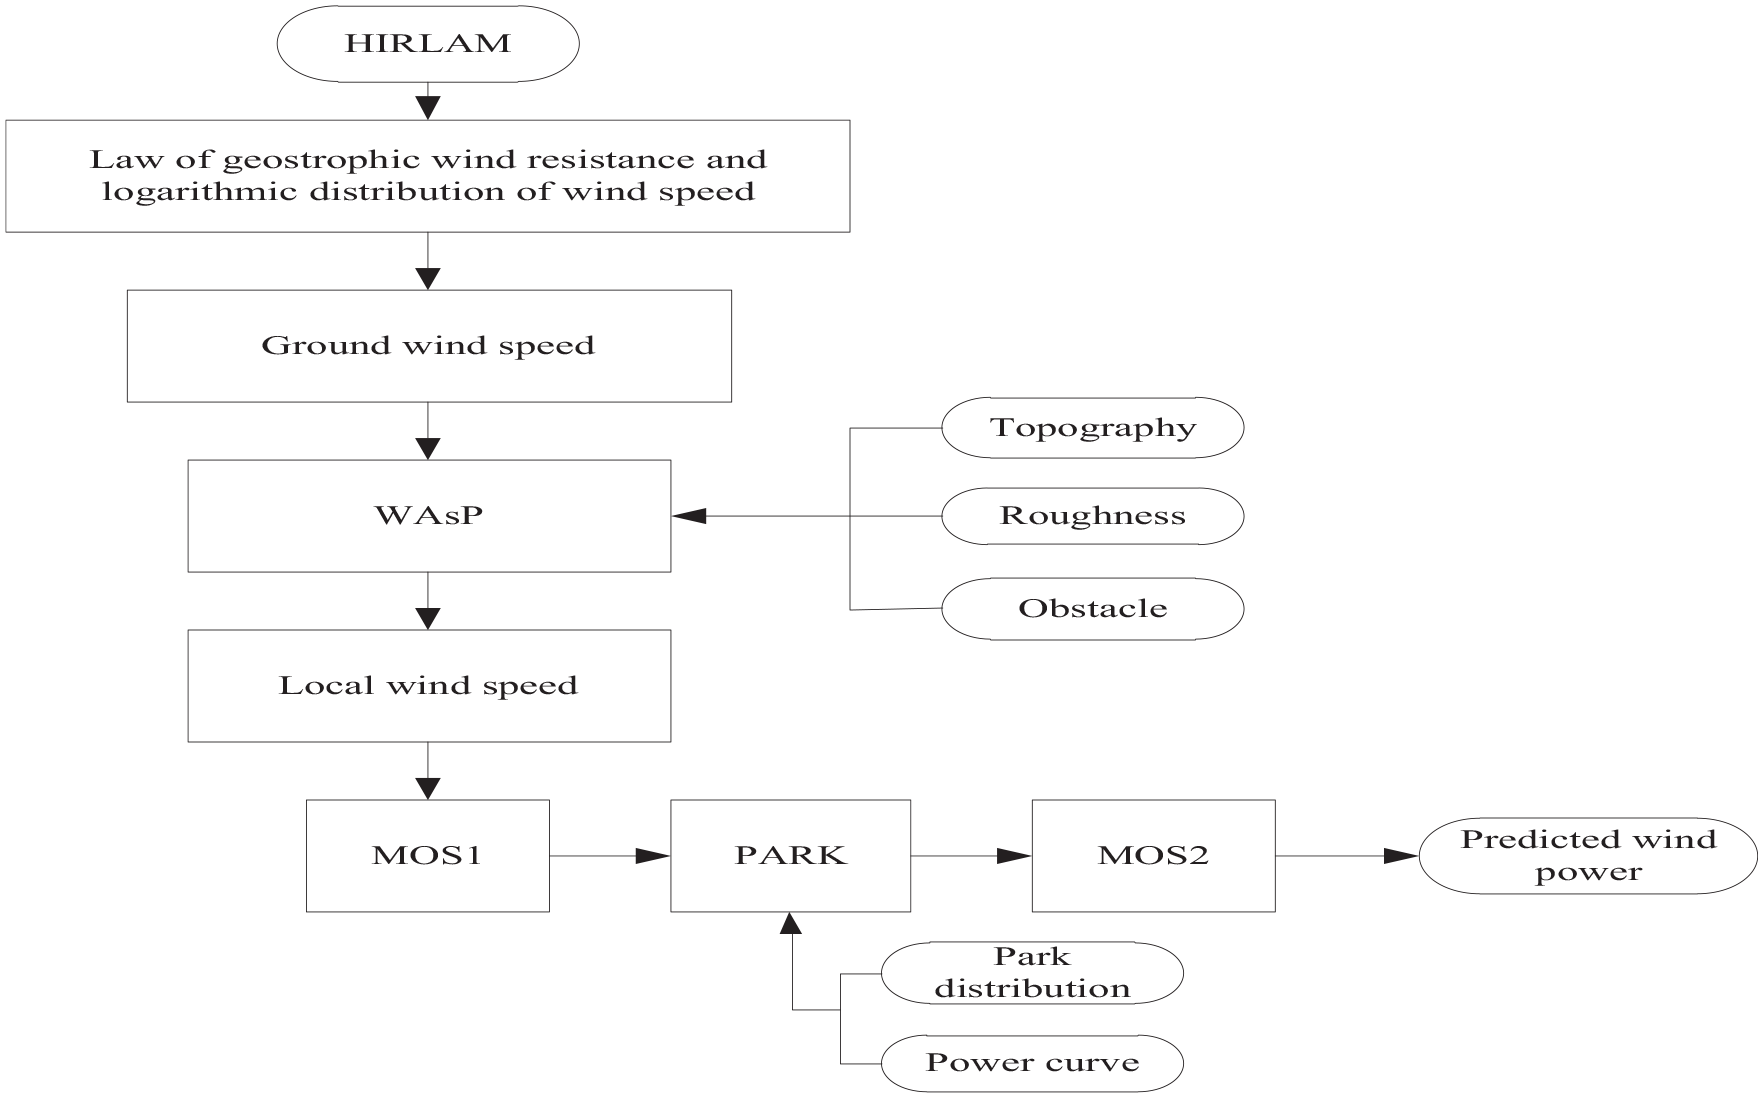
The framework of the Prediktor system.
Wind power prediction tool (WPPT) was developed by Danish University of Science and Technology. Since 1994, WPPT has been operating in the western power system of Denmark. Since 1999, WPPT has been operating in the eastern power system of Denmark (Cutler et al., 2007). The WPPT system combines the adaptive regression minimum square root with the exponential forgetting algorithm, and gives the wind power prediction results in the next 0.5–36 h. The core of WPPT is that it provides a rich statistical model for the power prediction of a single wind farm or a regional wind farm. A typical result for the application of WPPT to the western part of Denmark, showing a comparison between the standard deviation of errors for WPPT system and persistence method for the period June 2002 to May 2003. The results show that the WPPT system performs much better than persistence model, with the exception of the first few hours. The standard deviation of errors of the WPPT rises rather slowly with increasing look-ahead time in the range 5%–10%.
Zephyr is a new generation of short-term wind power prediction program jointly developed by Risø and the School of Information and Mathematical Modeling (IMM) of Danish University of Science and Technology (Smith et al., 2014). Zephyr integrates the functions of Prediktor and WPPT, and can carry out ultra-short-term prediction (0–9 h) and short-term prediction (36–48 h). Zephyr uses the on-line measured data and advanced statistical methods, which can give good short-term prediction results. Zephyr also uses meteorological models such as HIRLAM, which greatly improves the accuracy of short-term prediction. The latest research on this system includes the analysis of stability parameters, mesoscale modeling, and ensemble prediction. The system framework of Zephyr is shown in Figure 3. Zephyr system was applied to Danish wind farms in the past years. Although on-line data improve forecasting, particularly for short-term horizons (2–3 h), it is balanced against the additional costs involved. In Ireland, from 11 geographically dispersed wind farms, Zephyr system were then used to create a countrywide, 48-h forecast in 1-h steps.
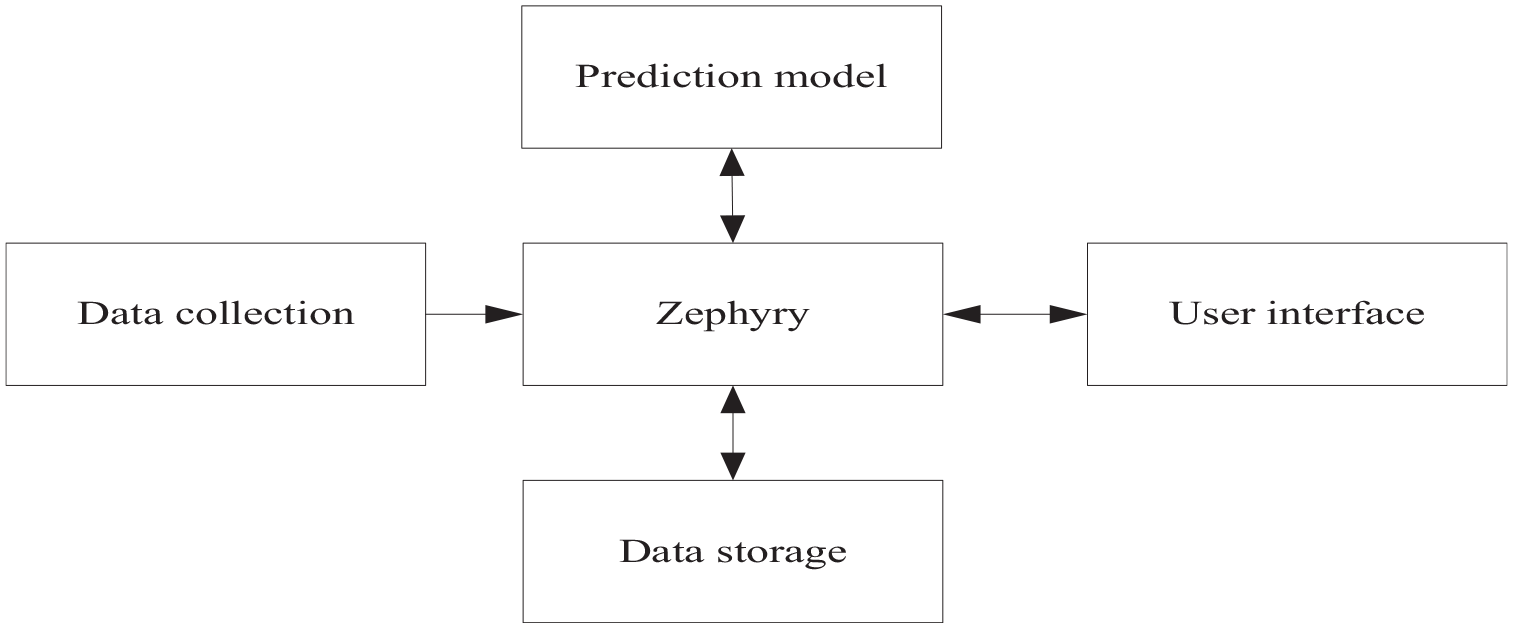
The system framework of Zephyr.
Previento is a wind power prediction system developed by the University of Oldenburg in Germany. It can give the power prediction results within 2 days for a large area. Its prediction method is similar to Prediktor. The main functions and features of the system are as follows: first, it can forecast the wind power of a single wind farm, a wind farm area, or even the whole country; second, it can forecast the time scale from 0 to 240 h (ultra-short-term forecast 0–6 h), and the time resolution is 15 min to 1 h; It can update the forecast value many times a day; finally, it can optimize the forecast result using the on-line measured data. The accuracy of the wind power predictions based on Previento system is constantly evaluated by the transmission system operators (TSO) in Germany (Lange and Focken, 2008). The investigated period comprises November 2004 to July 2006, that is, several months including the stormy periods in winter and spring. The accuracy is expressed in terms of the root mean square error (RMSE) normalized to the installed capacity. The results of the evaluation for the Previento prediction show that the RMSE increases from 3.1% intraday (0–23 h), to 4.4% day-ahead (24–47 h) up to 5.8% 2 days ahead (48–71 h).
Wind power management system (WPMS) developed by German Solar Energy Research Institute provides short-term wind power prediction function (Lange et al., 2006). The NWP forecast variables, such as wind speed, wind direction, temperature, air pressure, humidity, and cloud coverage, are used as input in the system, and the wind speed forecast value is obtained by the mesoscale meteorological model refined downscaling. The characteristics of the model are as follows: forecast according to the precise NWP provided by German Meteorological Bureau; calculate the power output of wind farm with artificial neural network. The predicted time scale is 48 h, and the time resolution is 15 min. In Germany, three different NWP models have been used for a day-ahead wind power forecasting. All three models have been used with the WPMS based on the artificial neural network (ANN) method. The training of the networks has been performed with data of more than 1 year. A concurrent data set of 7 months (April–October 2004) has been used for the comparison. The experimental results show that the differences between the different models are small.
The LocalPred prediction system developed by the Spanish National New Energy Center is based on the wind speed, wind direction, and other meteorological prediction data, and uses the statistical module to modify the wind speed prediction value (Sanz et al., 2013). Finally, the output model of the wind power is established through the historical measured power data and the wind speed, wind direction, and other meteorological data in the same time period. The LocalPred can realize ultra-short-term wind speed or power prediction with 6–8 h in advance using real-time data collected by time series method. In practice, the LocalPred system is applied in two wind farms in Spain, one in the North and one in the South. The available data correspond to a year-long period in both the planning and the operational phase. LocalPred wind power forecasting model is run on the real and virtual time series of wind power production data to evaluate predictability. The model is trained using the first 6 months of data, and then the evaluation is performed using the remaining 6 months of each period. The results show that the differences between the predicted and the real mean absolute error (MAE)/normalized root mean square error (NRMSE) in the first two days of prediction are within 1.3% and 1.3% from the planning and operational phases, respectively.
The prediction system Sipreólico developed by Carlos III of Madrid University is based on the HIRLAM weather prediction model of Spain, and takes into account the supervisory control and data acquisition (SCADA) data uploaded by 80% of the fans in Spain every hour (Lobo and Sanchez, 2012). The main feature of the prediction system is that it can adapt to the changes of wind farm operation and NWP prediction model; second, it can adapt to different wind farms simply and quickly, that is, it does not need to calibrate the model in advance. The prediction scale of the system is 36 h, and the time resolution is 1 h. In April 2007, Sipreólico is used as the prediction system from HIRLAM model H0.16 (resolution 0.16°) supplied by the Spanish National Meteorological Service-models H0.2 and H0.5. The experimental results show that the prediction system can effectively predict the future wind speed and wind power.
The eWind is a wind power prediction system developed by AWS Truewind Company. It mainly includes a set of high-precision three-dimensional atmospheric physical mathematical model, adaptive statistical model, wind farm output model, and prediction distribution system (Jose et al., 2010). The predicted time scale is 48 h. The structure diagram of the eWind system is shown in Figure 4. Some experiments at Oklahoma wind farms in the United States show that the prediction relative error of eWind system is within 15%. The eWind system basically meets the requirements of large-scale grid connection of wind farms.
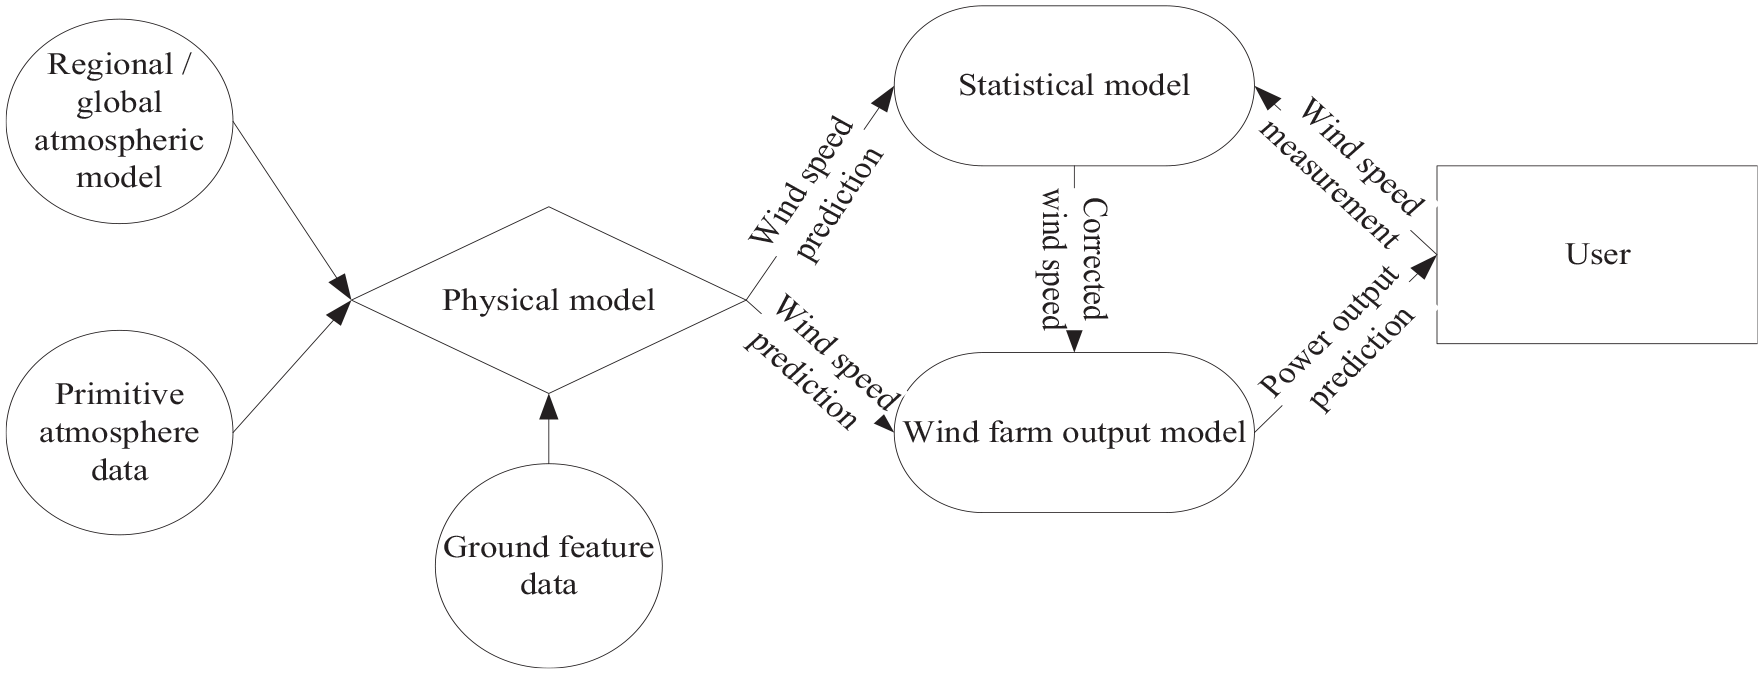
The structure diagram of the eWind system.
NSF3100 wind power prediction system designed by China Electric Power Research Institute has been widely used. The system can realize short-term and ultra-short-term prediction functions (Lu et al., 2016). For the short-term prediction, NSF3100 can realize the prediction of the future 0- to 72-h power change curve of the wind farm, with a time resolution of 15 min. The monthly RMSE rate of short-term forecast is less than 20%. For the ultra-short-term prediction, the prediction of the future 0- to 4-h power curve of the wind farm can be realized, with a time resolution of 15 min. The prediction is performed every 15 min. The monthly RMSE rate of the fourth hour forecast value of ultra-short-term forecast is less than 15%. The structure diagram of the NSF3100 prediction system is shown in Figure 5. In China, NSF3100 system has been established and is ready to be established covering nearly 100 wind farms. The system has been widely used in more than 10 provinces such as Shandong. Many experimental results show that the NSF3100 system can achieve the prediction of the future 0- to 72-h power curve of the wind farm, with a time resolution of 15 min. For short-term power prediction, the monthly RMSE rate is less than 20%, and the average absolute error is less than 20%. For ultra-short-term power prediction, the monthly RMS error rate is less than 15%, and the average absolute error is less than 15%.
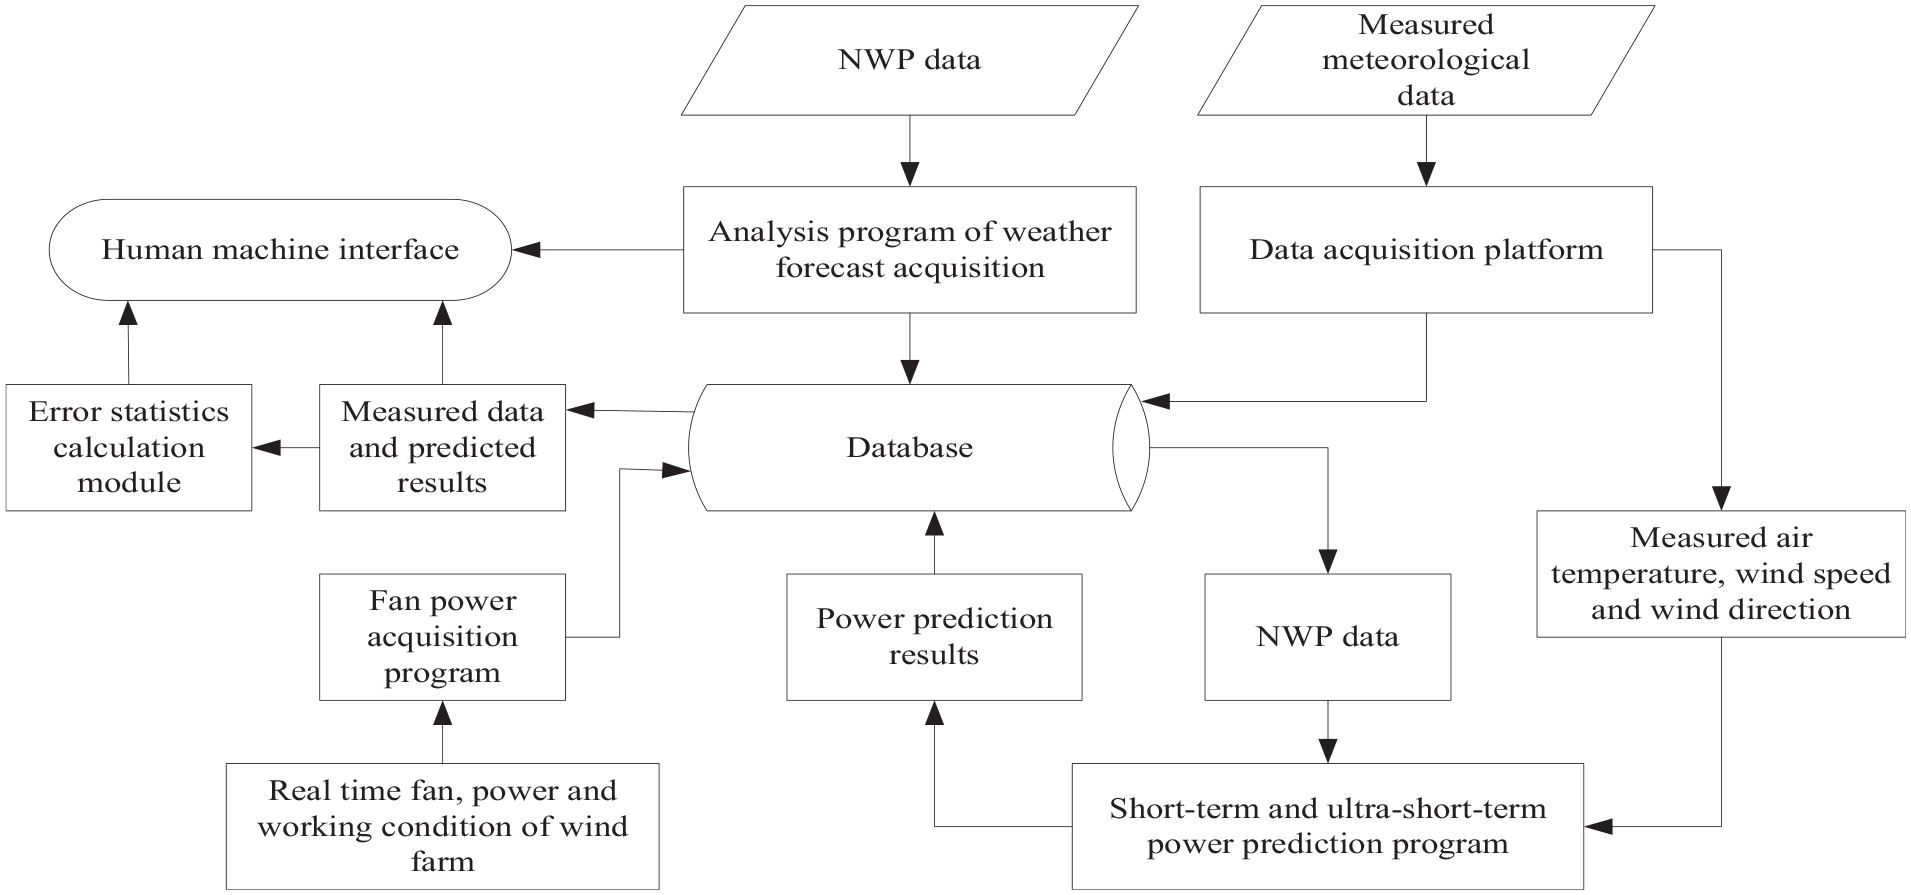
The structure diagram of the NSF3100 prediction system.
Although these commercial wind power forecasting systems have been applied in a certain range, there are still many problems to be studied in depth. For example, many areas cannot get detailed meteorological data, prediction accuracy of the forecasting system is low, and the adaptability is poor. At the same time, most of the prediction algorithms used in these prediction systems are based on time series model. Many advanced intelligent algorithms and in-depth learning model in recent years have not been applied to these systems (Deng et al., 2020; Dorado-Moreno et al., 2020).
The deterministic prediction of wind power
The purpose of deterministic prediction is to give the specific prediction value of wind power at a certain time in the future. It can be expressed as

where i is the sampling time;
The deterministic prediction of wind power can be divided into two categories, statistical learning model and NWP.
The evaluation indicators
In the field of wind power generation prediction, the commonly used evaluation indicators are as follows (Tian et al., 2017, 2020b):
RMSE

2. MAE

3. Mean absolute percentile error (MAPE)

4. Relative root mean square error (RRMSE)

5. Square sum error (SSE)

6.

7. Theil inequality coefficient (TIC)

8. The index of agreement (IA)

where
Some analysis and discussion are made on these performance indicators are as follows:
RMSE: RMSE can reflect the degree of dispersion of a data set. RMSE is very sensitive to large or small errors in a set of measurement data, so it can well reflect the precision of sample data. The smaller the RMSE is, the closer the sample value is to the average value, that is to say, the less discrete the predicted values of the prediction model is.
MAE: MAE can avoid the problem of mutual cancelation of errors, so it can accurately reflect the actual prediction error. The smaller the MAE, the smaller the prediction error of prediction model is.
MAPE: MAPE represents the percentage of the prediction error to the actual value. Therefore, the greater the MAPE value is, the greater the difference between the predicted value and the actual value, that is, the worse the prediction effect. A perfect prediction model is represented by 0% of the MAPE, while a very poor prediction model is represented by a MAPE greater than 100%.
RRMSE: RRMSE represents the relative difference between the predicted value and the actual value, and is a dimensionless statistic, which can be used to compare different variables. The smaller the RRMSE is, the higher the prediction accuracy of the prediction model is.
SSE: SSE calculates the sum of the error squares of the corresponding points between the fitting data and the actual data. The closer the SSE is to 0, the better the prediction model fits the actual data and the better the prediction effect.
TIC: Its value range is 0–1, the closer it is to 0, the smaller the root mean square of unit error, that is, the closer the predicted value is to the actual value, the better the fitting effect of the prediction model is.
IA: Its physical meaning is that the ratio of the mean square error and potential error of the predicted values to the actual value is subtracted by 1, and its range is 0–1. The larger the IA value, the higher the consistency between the actual value and the predicted values of the prediction model.
The statistical learning model
Statistical learning prediction is to establish a certain mapping relationship between historical data and wind power using certain mathematical statistical methods, so as to predict wind power. Statistical methods can be divided into three categories: time series model (Wang et al., 2018a), artificial intelligence model (Cevik et al., 2019), and ensemble prediction model (Ouyang et al., 2017).
Time series model
The most classical prediction method in the field of wind power is the persistence method. In the persistence method, the current wind speed or wind power value is taken as the future wind speed or wind power prediction value. The expression is as follows

Although the principle of the persistence method is simple, the prediction accuracy is acceptable, especially in the case of short prediction steps; the accuracy of the persistence method may even exceed that of other machine learning methods with complex principles. Therefore, the persistence method is often used as a benchmark method to verify the prediction performance of other methods in the field of wind power prediction (Cancino-Solórzano et al., 2010). Other time series methods include Kalman filter (Che et al., 2016; Ishikawa et al., 2017), autoregressive moving average (ARMA) (Liu and Zhang, 2017; Liu et al., 2017), autoregressive integrated moving average (ARIMA) (Rajeevan et al., 2016; Shi et al., 2011), and fractional autoregressive integration moving average (FARIMA) (Yuan et al., 2017).
The Kalman filter prediction method has the advantage of dynamically modifying the weight, and it can obtain higher accuracy by relying on the prediction recurrence equation. However, it is also difficult to establish the Kalman state equation and the measurement equation. Based on the above considerations, some scholars use the time series model to establish a low-order model which can reflect the change rule of wind power series. Starting from the prediction equation of the low-order model, the state and measurement equation of Kalman filter are directly derived. The wind power prediction can be realized by the Kalman prediction iteration equation, which just avoids the problems of establishing high-order time series model, and deriving Kalman state and measurement equation. ARMA method only needs to know the wind speed or power time series of wind farm to establish prediction model, but it needs a lot of historical data; ARIMA is an extension of ARMA. If the initial data do not have stationarity, it is necessary to differential the historical data to obtain the required stable data. Compared with ARMA and ARIMA, FARIMA model is more direct in implementation and can reflect the long correlation characteristics in the real wind power generation process, so it is more suitable for the prediction of wind power with autocorrelation characteristics.
Artificial intelligence model
The commonly used wind power prediction methods based on artificial intelligence mainly include artificial neural network, support vector machine, least squares support vector machine, Gaussian process regression, fuzzy logic, and so on.
Artificial neural network is widely used in wind power prediction. The types of these neural networks include back propagation neural network (Hu and Zhang, 2018; Li et al., 2020b; Wang et al., 2015a), radial basis function neural network (Chang, 2013; Ter Borg and Rothkrantz, 2006; Zhang et al., 2016), echo state network (Dorado-Moreno et al., 2017; Gouveia et al., 2018; Wang et al., 2019a; Xu et al., 2015), and extreme learning machine (Mahmoud et al., 2018ba, 2018b; Mohammadi et al., 2015). The artificial neural network has the characteristics of self-adaptive and self-learning, which can deal with complex systems, but it has the problems of slow training speed, difficult to determine the network structure and parameters, and easy to fall into local optimum. In recent years, with the development of deep learning theory, many scholars also apply some deep learning models to the prediction of wind power (Liu et al., 2019; Yin et al., 2019). These models include long short-term memory (Han et al., 2019; Son et al., 2019; Sun et al., 2020), deep belief network (Sun et al., 2018; Wang et al., 2016b; Wang et al., 2019c), convolution neural network (Huang and Kuo, 2019; Ju et al., 2019), recurrent neural network (Olaofe, 2014; Shi et al., 2018; Yona et al., 2009), and so on. Compared with other machine learning methods, the model generated by deep learning is very difficult to explain. These models may have many layers and thousands of nodes; it is impossible to explain each one separately. At the same time, deep learning model is very complex; they need a lot of computing performance to build. Although the cost of computing has dropped dramatically, it is still not free. For the simple problem of small data sets, deep learning may not produce enough additional effect than other traditional neural networks under the same computing cost and time. For short-term, especially ultra-short-term wind power prediction, the real-time performance of deep learning model must be considered (Mu and Zeng, 2019).
On the basis of statistical learning theory, support vector machine and least squares support vector machine are new machine learning algorithm; they can improve the generalization ability of the algorithm, effectively solves the high dimension problems with small sample and nonlinear characteristic, and provides a new solution for pattern recognition, fault diagnosis, time series prediction. Many scholars apply support vector machine (Li et al., 2018; Tian et al., 2018) or least squares support vector machine (Zhang et al., 2012) model to the prediction of wind power, and obtain some excellent research results. However, the prediction accuracy of support vector machine and least squares support vector machine is affected by the selection of type and parameters of the kernel function. At present, there is no clear theory to support the selection of the type and the parameters of the kernel function. Meanwhile, when the sample data are large, it will bring dimension disaster to support vector machine or least squares support vector machine, resulting in the sharp increase in calculation and the decline of prediction accuracy.
As a traditional modeling algorithm, Gaussian process regression model is used in the prediction of wind power (Liu et al., 2018a; Huang et al., 2019). The disadvantages of Gaussian process regression are mainly manifested in two aspects: first, the covariance matrix of the training set needs to be calculated in the Gaussian process, which means that the more training data is, the larger the dimension of the covariance matrix will be, which undoubtedly increases the difficulty of calculation, and the calculation process will take more time; second, the Gaussian process is based on the observation that the noise of sample data conforms to the Gaussian distribution. If the noise in the actual data does not conform to the Gaussian distribution, then the previous derivation is not valid, and the posterior calculation of the Gaussian process will be very difficult.
The fuzzy model is based on expert knowledge, so the research object does not need accurate mathematical model. Some wind power prediction models based on fuzzy model are also proposed (Damousis et al., 2004; Fujimura et al., 2009; Morshedizadeh et al., 2017). However, in fuzzy logic method, data and language are formed into fuzzy rule base by fuzzy logic, and then a linear model is selected to approach the nonlinear dynamic wind power. However, the effect of simple fuzzy method on wind speed prediction is often poor. The main reason is that the learning ability of fuzzy prediction is weak, and the identification of fuzzy system has not formed a perfect theory, so it needs further research to choose the structure of fuzzy system in the prediction system. Generally, the fuzzy prediction method should be used in combination with other methods, such as genetic algorithm (Zheng et al., 2018), particle swarm optimization algorithm (Chakraborty et al., 2012), and so on.
Ensemble prediction model
Each prediction model applied in the field of wind power generation has its own advantages and disadvantages (Qian et al., 2019). The prediction performance of a single prediction model is often difficult to achieve the best. It is an important research direction of wind power prediction to build an ensemble prediction model to improve the prediction performance. At present, there are four kinds of ensemble forecasting models (Hajirahimi and Khashei, 2019). The structure diagram of the four ensemble models is shown in Figure 6. What this article needs to explain here is that for the word ensemble, the current research results still use combined, combination, and hybrid. They express the same meaning.
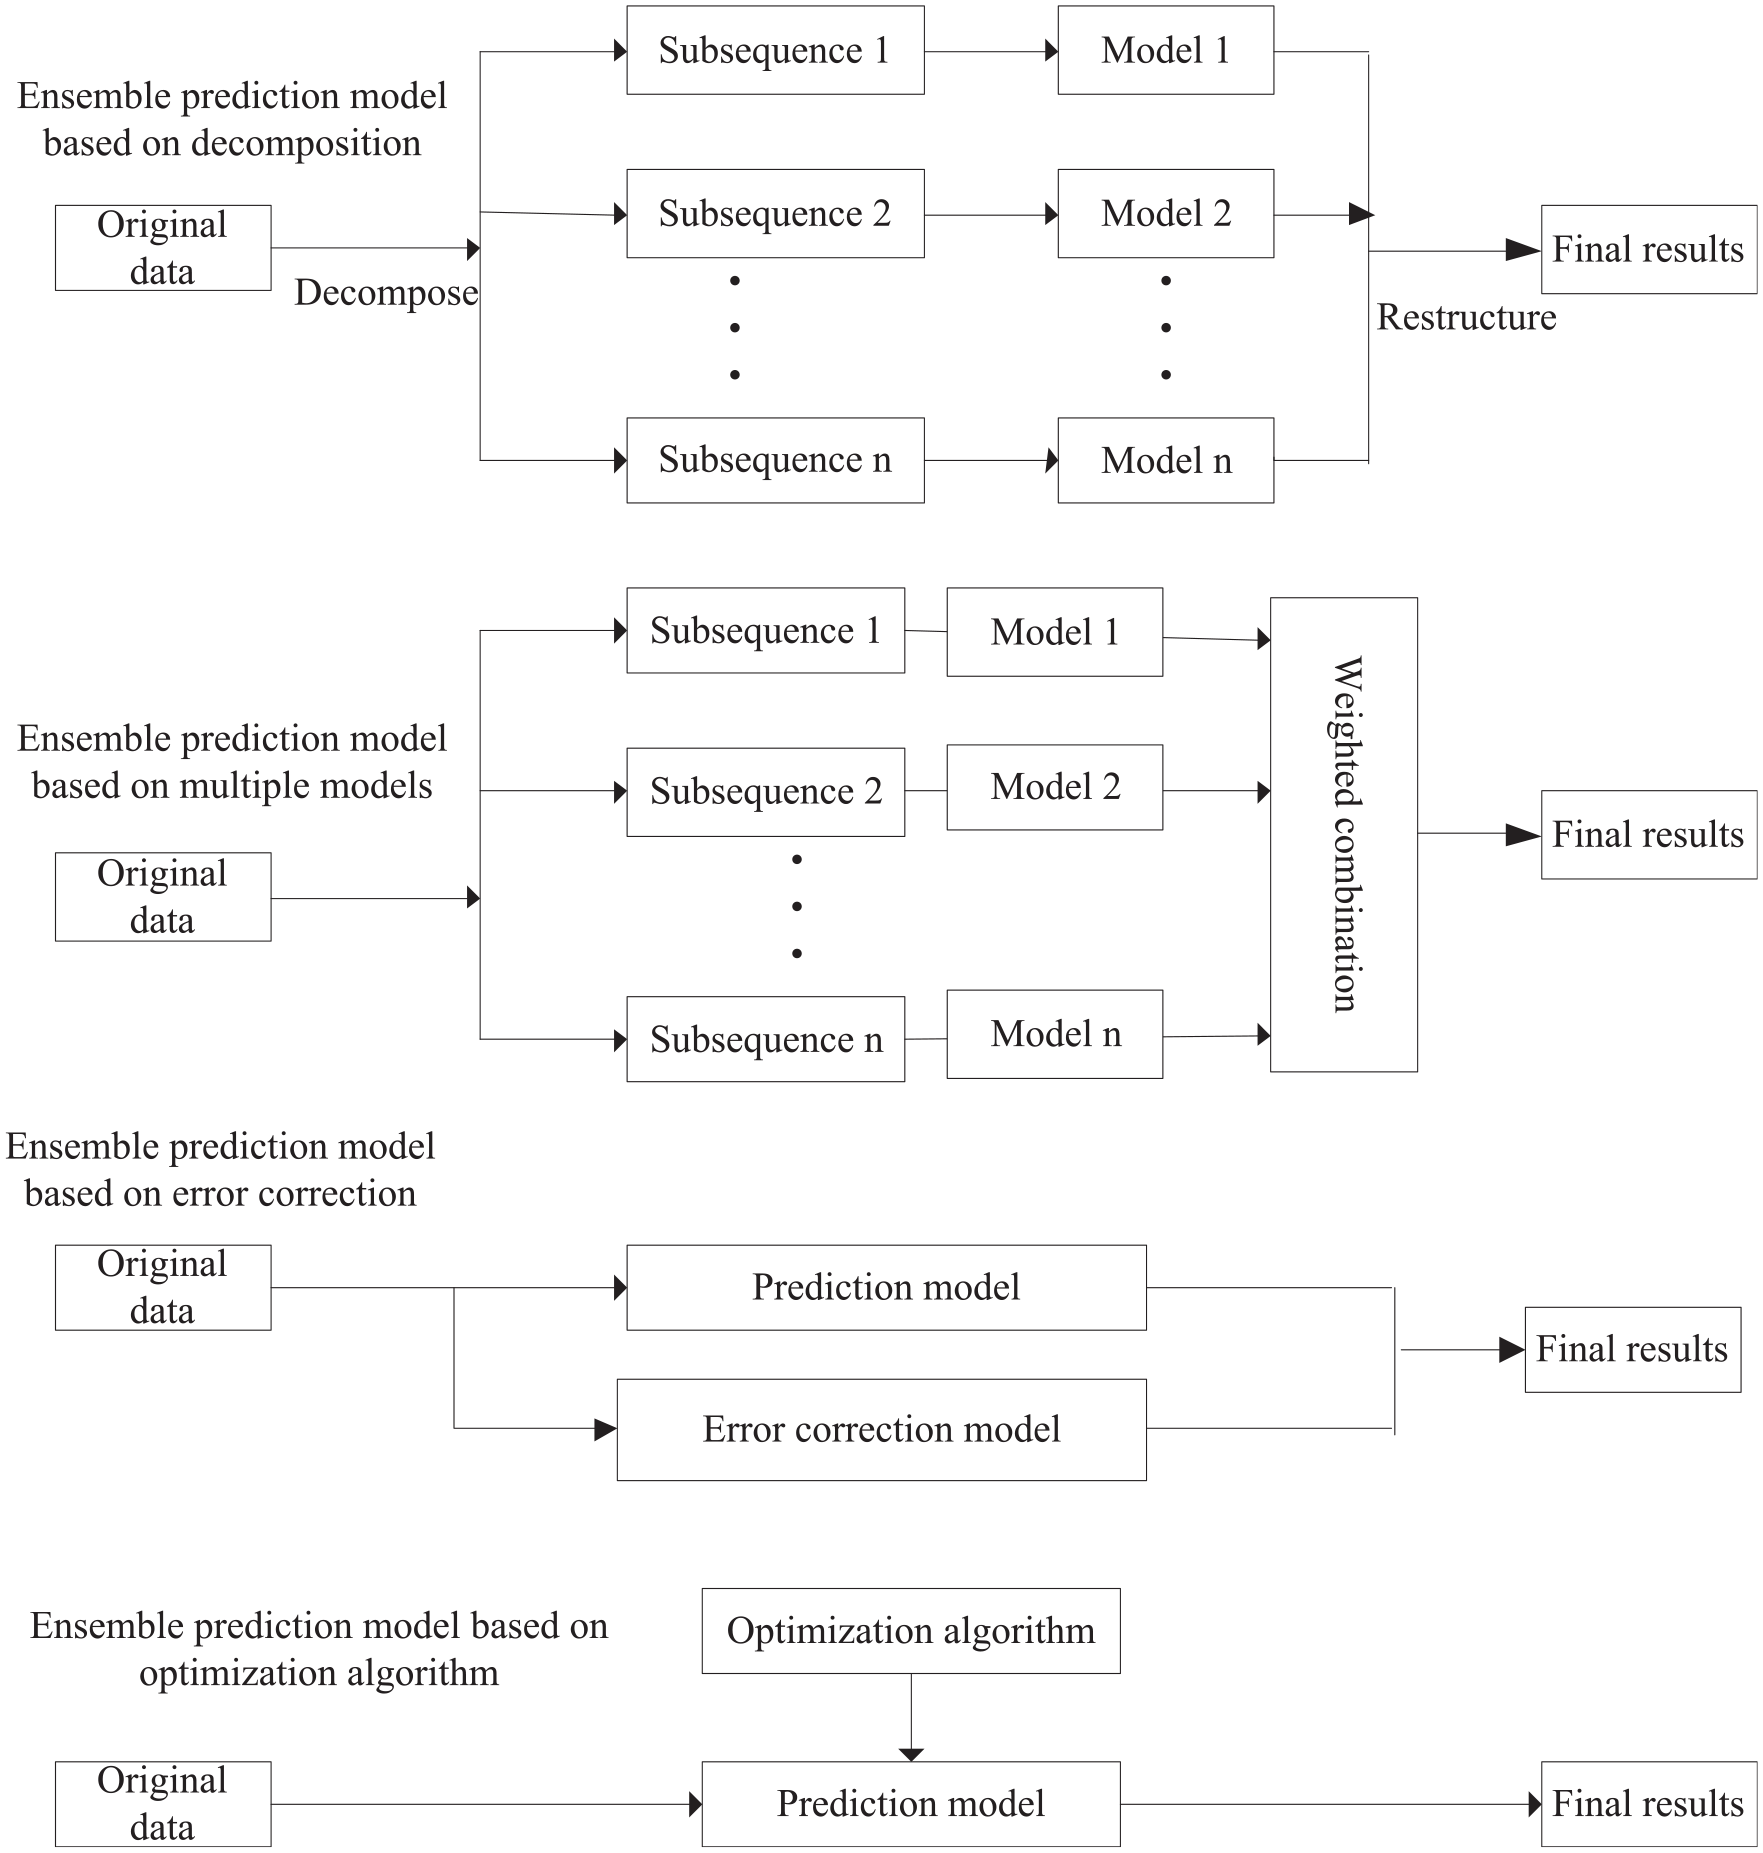
The structure diagram of the four ensemble models.
Ensemble prediction model based on decomposition
The original wind power series is decomposed into subsequences, each subsequence is predicted separately, and then the predicted values of each prediction model are combined. These research results include empirical mode decomposition (EMD), artificial neural network, and support vector regression (Cevik et al., 2019), variational mode decomposition (VMD), back propagation neural network (BPNN), ARMA, and least squares support vector machine (LSSVM) (Zhang et al., 2019a), EMD and kernel ridge regression (Naik et al., 2018a), wavelet packet decomposition (WPD), EMD, and extreme learning machine (ELM) (Liu et al., 2018b), VMD and kernel ridge pseudo inverse neural network (KRPINN) (Naik et al., 2018b), VMD, principal radial basis function (PRBF), and ARMA-E (Zhang et al., 2020), wavelet transform and echo state network (ESN) (Wang et al., 2019a), variational mode decomposition-wavelet transform (VMD-WT) and principal component analysis-back propagation-radial basis function (PCA-BP-RBF) (Zhang et al., 2019c), and so on.
Ensemble prediction model based on multiple model
Several models are used to predict the original wind power series, and the weighted method is used to combine the prediction results of each model to get the prediction results. These models include particle swarm optimization-support vector regression (PSO-SVR) and Grey model (Zhang et al., 2019b), SCADA and deep learning neural networks (Lin et al., 2020), long short-term memory (LSTM) networks and nonparametric kernel density (Zhou et al., 2019), multi-Layer perceptron (MLP) and adaptive-network-based fuzzy inference system (ANFIS) (Morshedizadeh et al., 2018), Gaussian processes and neural network (Lee and Baldick, 2014), chaotic theory and Bernstein neural network (Wang et al., 2016), ARIMA, ELM, SVM, LSSVM, and Gaussian process regression (GPR) (Wang et al., 2015b), and so on.
Ensemble prediction model based on error correction
The wind power prediction model and the corresponding error correction model are established (Li et al., 2019; Wang et al., 2018b). The final prediction value is obtained by combining the prediction value of the original model and the error model. These achievements include forecasting model with stacked sparse autoencoder and adaptive decomposition-based error correction (Liu and Chen, 2019), two-stage forecasting model based on error factor and ensemble method (Hao and Tian, 2019), LSSVM model with error correction (Zhang et al., 2017), gated recurrent unit neural networks–based wind speed error correction (Ding et al., 2019), and so on.
Ensemble prediction model based on optimization algorithm
The optimization algorithm is used to optimize the parameters of the standard wind power prediction model to improve the prediction accuracy. These models include particle swarm optimization algorithm optimized ANN (Nazare et al., 2019), particle swarm optimization algorithm optimized ELM (Zhou et al., 2018), ant colony optimization algorithm optimized ELM (Carrillo et al., 2018), Gaussian mixture model by Riemann limited-memory Broyden Fletcher Goldfarb Shanno (L-BFGS) optimization (Ge et al., 2018), and so on. How to choose the appropriate optimization algorithm and its parameters is an important problem. If the selection is not reasonable, it will greatly affect the accuracy of wind power prediction.
The NWP model
The prediction model based on NWP mainly uses some physical parameters, such as meteorological data (wind speed, wind direction, air pressure, etc.), information around the wind farm (contour, roughness, obstacles, etc.), and technical parameters of wind turbine (hub height, penetration coefficient, etc.) to obtain the optimal estimation of wind speed corresponding to the wind turbine hub height (Olson et al., 2019). In NWP model, under certain initial value and boundary value conditions, numerical calculation is carried out by many computers. Then, the model output statistics module is used to reduce the error. Finally, the output power of the wind farm is calculated according to the power curve of the wind farm. In the past, the weather prediction data are updated only a few times a day, this model is usually suitable for relatively long-term wind power prediction (Allen et al., 2017). In the recent years, the High-Resolution Rapid Refresh (HRRR) system (Blaylock and Horel, 2020) and IBM global high-resolution atmospheric forecasting system (IBM GRAF) models are developed. HRRR v4 will be released in June 2020. These two models can provide hourly updated NWP data. Therefore, the NWP-based model can also be applied to short-term and ultra-short-term wind power prediction. Under different wind direction and temperature conditions, even if the wind speed is the same, the output power of the wind farm is not equal, so the power curve of the wind farm is a family of curves, and the failure and maintenance of the wind turbine should also be considered. Therefore, the output of NWP model is usually meteorological information for a period of time in the future, not just wind information. At present, many NWP models for global or regional weather forecast have been developed in the world. The structure of wind power forecast based on NWP is shown in Figure 7.
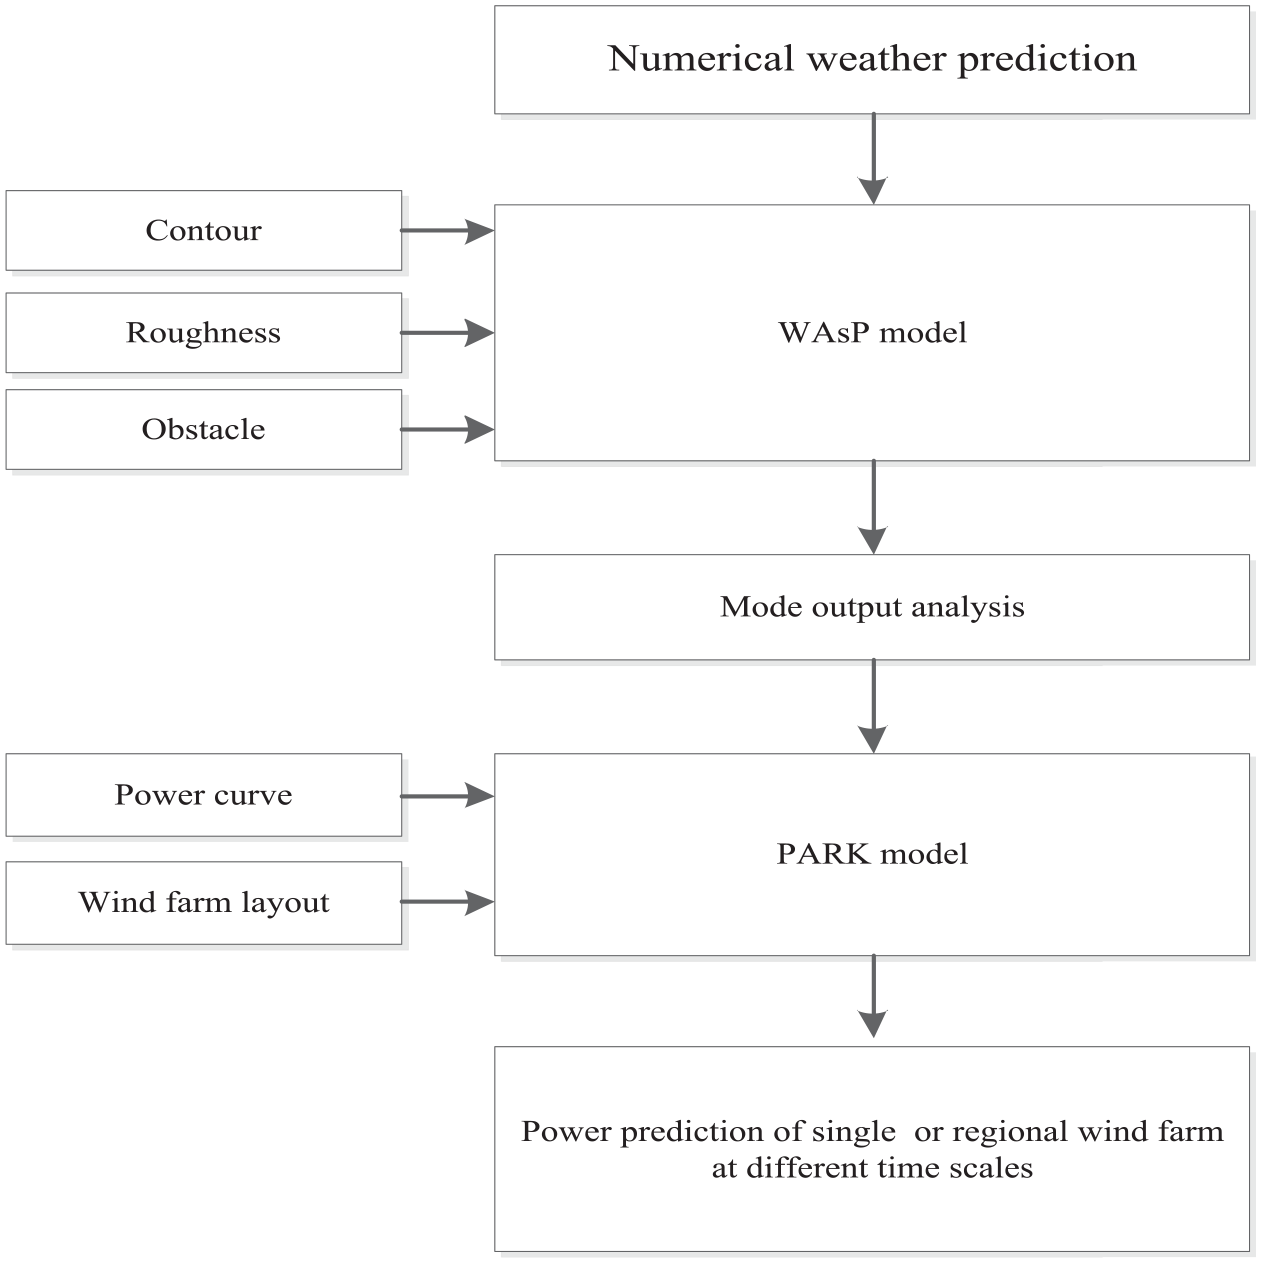
The structure of wind power prediction based on NWP.
When using NWP model to forecast wind power, it is necessary to select a suitable NWP system according to the demand. The main factors to be considered include the location area of the wind farm to be predicted, the resolution of time and space, the prediction step, prediction accuracy, and calculation complexity requirements. The NWP model is very sensitive to the initial conditions, and the small change of the initial conditions may lead to a large deviation of the output results (Wang et al., 2012).
At present, the solution is to use the ensemble prediction model. There are two ways for the ensemble model of NWP. The first way is to run the prediction model repeatedly by fine tuning the initial conditions to get a group of prediction results under different initial conditions, and then get the final prediction results by weighting. The authors use this method to forecast the weather in the next 1–10 days. The results show that the ensemble model can effectively improve the prediction accuracy (James and Roberto, 2003). Another way is to use a variety of NWP models to get multiple prediction results, and then use weighted method to get the ensemble prediction results. Through the study of the output results of three NWP models, the authors found that the output accuracy of a single model is similar, but the errors between each model are uncorrelated. After weighting the results of each model, the prediction accuracy can be significantly improved (Nielsen et al., 2007). For different models with three spatial scales and four different boundary conditions, the authors used fuzzy theory to judge the uncertainty of the output of each model. Finally, the output of each model is weighted by artificial neural network to get the final prediction results. The results show that the accuracy of this ensemble model is about 35% higher than that of a single model (Zhao et al., 2016).
Although global forecast system (GFS), for example, can provide NWP data to the public for free, the sensitivity of the initial conditions leads to many limitations in the practical application of the NWP model. Therefore, many research studies combine the NWP model with other statistical learning models to improve the prediction accuracy. These results include NWP model with deep neural network (Kim and Lee, 2019), NWP model with Gaussian process regression (Hoolohan et al., 2018), integrating artificial intelligence and NWP model (Kosovic et al., 2020), NWP model and Fuzzy clustering (Yang et al., 2015), and so on. In recent years, some scholars have proposed to combine NWP model with analog ensemble method (Delle Monache et al., 2013; Junk et al., 2015; Yang et al., 2018). The introduction of analog ensemble method and its improvements greatly improves the prediction accuracy of wind power of a single NWP model.
Discussions
With the continuous growth of wind power access capacity, the impact of wind power fluctuation and intermittence on the grid is more and more serious. In order to reduce the impact of wind power on the grid, it is necessary to predict the future wind power. In practical application, the accuracy of wind power prediction model is not very ideal. Many wind farms still use the simplest continuous method model, and even rely on the experience of wind farms and dispatchers. In practical application, how to improve the prediction accuracy of wind power prediction model is still a major challenge in the field of wind power prediction. The author thinks that the following problems need to be solved to improve the prediction accuracy.
Selection of prediction model
In the practical application of wind power prediction methods, it is difficult to find a model that can be applied to the wind power forecasting of multiple wind farms, whether it is deterministic or probabilistic. Due to the influence of climate conditions, geographical characteristics, wind farm layout, and other factors, the data characteristics of each wind farm may be different. The prediction model corresponding to different data characteristics and even the selection of the input variables of the prediction model may be different. Therefore, when forecasting the wind power of a wind farm, it is an important way to analyze the data characteristics of the wind farm, select the prediction model and input variables reasonably, and improve the prediction power.
Effective NWP model
The NWP uses the mathematical model to express the meteorological evolution process, which belongs to the white box model. The accuracy of NWP results can greatly improve the accuracy of wind power prediction model. The accuracy of NWP model mainly depends on the spatial and temporal resolution of the selected model. Generally, the higher the resolution is, the higher the prediction accuracy is. In practical application, due to the complexity of model calculation, it takes a long time to get high-resolution NWP results. Therefore, the accuracy of the selected NWP model is usually not high, which affects the final prediction results. Therefore, the development of a more effective NWP model will reduce the complexity of the model, reduce the calculation time, make the high-precision NWP results easier to obtain for the wind farm, and can help the current wind power prediction model to significantly improve the prediction accuracy.
Reasonable use of surrounding wind farm data
The meteorological evolution process has the continuity of time and space, and is closely related to the surrounding environment through the evolution of a wind farm. If there are multiple wind farms in a region, the meteorological measurement data of these wind farms are related, which is equivalent to that these wind farms form a sensor network, and the current wind can be improved by effectively using the measurement data of the surrounding wind farms accuracy of electric power prediction model. When using the data of surrounding wind farms, we need to consider the influence of terrain, air flow, and environment, especially the influence of wind direction. Otherwise, the introduction of variables unrelated to the wind farm may reduce the prediction accuracy of the prediction model.
Conclusion and future work
The research of wind power prediction method is a hot spot in the field of wind power generation. This article summarizes the current deterministic prediction methods of wind power. Deterministic prediction aims to provide the specific wind speed or wind power value at a certain time in the future. It is the most traditional method used in wind power prediction mode, which is divided into statistical learning method and physical method based on NWP. In this article, the mature wind power prediction software and tools are introduced in detail. At the same time, various statistical learning models and physical models for wind power prediction in the current literature, as well as the effect of various models in practical application are discussed in detail. In practical application, how to improve the prediction accuracy of wind power prediction model is still a major challenge in the field of wind power generation. Based on the introduction and comparison of existing wind power prediction methods, this article puts forward several factors that need to be considered to improve the prediction accuracy.
This article mainly reviewed the deterministic prediction methods and models of wind power. The prediction results provided by the wind power deterministic prediction model have different degrees of prediction errors, which will bring certain impact on the operation of the power system. In order to maintain the power system more effectively, the prediction model should also provide the probability distribution characteristics of the prediction results, which is called the probability prediction model. In the future, this article will study the probability prediction model of wind power.
Footnotes
Declaration of conflicting interests
The author(s) declared no potential conflicts of interest with respect to the research, authorship, and/or publication of this article.
Funding
The author(s) disclosed receipt of the following financial support for the research, authorship, and/or publication of this article: This work is partially supported by the Science Research Project of Liaoning Education Department (Grant No. LGD2016009) and Natural Science Foundation of Liaoning Province (Grant No. 2020-MS-210).
