



Abstract
This study seeks to scrutinize the economic aspects of establishing the proposed system for producing electricity and hydrogen in the nominated city. For this, levelized cost of wind-generated electricity, levelized cost of seawater desalinated using wind energy, levelized cost of wind-powered hydrogen, payback period of investing on electricity, and hydrogen production are predicted. The results indicated that levelized cost of wind-generated electricity would vary from 0.0208 to 0.053 US$/kWh under different cases and scenarios. This range regarding levelized cost of seawater desalinated using wind energy was between 0.0147 and 0.0404 US$/m3 and also the amount of levelized cost of wind-powered hydrogen was guessed to be from 7.0074 to 10.5667 US$/kg. All values of payback period calculated as to wind electricity were less than half of the project lifetime. In addition, payback period of generating hydrogen was arguable only for the turbine with a rated power of 900 kW.
Keywords
Introduction
Global warming, climate change, ozone layer depletion, and environmental pollution as severe consequences of using fossil fuels have been conspicuous signs of neglecting clean energy carriers and pollution-free means of generating energy, mostly in non-developed countries (Rezaei et al., 2019b). To tackle these issues, all nations should embark on utilizing renewable and ecological methods of producing energy. Of the few ways, hydrogen has constituted a clean energy carrier which can brighten the future of energy sector.
Since pure hydrogen, H2, is not significantly available in the environment, it should be gained via electrolyzing water (Rezaei et al., 2018a). To turn the process of producing hydrogen via water electrolyzer into an environment-friendly one, the required energy should be obtained by renewable energies like wind energy. In some developed countries, there are wind-powered hydrogen generation plants, but in developing ones like Iran, this has not been put into practice. One major reason is that policy makers, private investors, and government figures need thorough economic results. In this regard, levelized cost of wind-generated electricity (LCOE), levelized cost of seawater desalinated using wind energy (LCOW), levelized cost of wind-powered hydrogen (LCOH), and payback period (PBP) are the most decisive factors determining whether or not the project is lucrative and plausible.
The price of obtaining hydrogen plays a vital role from the investors’ point of view and other key decision makers. This cost is affected by the way via which hydrogen is being generated. The figures related to the year 2018 implied that hydrogen production using coal imposed the least cost, in the range of 1.2–2.2 US$/kg, among other means (International Energy Agency (IEA), 2019). However, this method of generating hydrogen can cause irreversible damages to the environment. Hence, hydrogen generation using renewable energies has grabbed attention of the most developed countries.
Iran, as a developing country located in the Middle East, possesses great sources of renewable energy like wind and solar. Statistics indicate that the country has reached approximately 2.2% of its total capacity of available wind energy by the end of 2018 (International Renewable Energy Agency (IREA), 2019). This very low number suggests that Iran has a long way ahead to exploit its full capacity of wind energy. Thus, further studies and research works seem to be imperative to provide necessary information for Iranian officials and researchers.
In the previous work (Rezaei et al., 2018a), the available wind energy in seven coastal cities lain in the north and south of Iran was evaluated using the Weibull distribution function. Therein a system consisting of a wind turbine with AC output, an AC-to-DC inverter, an electrolyzer, a seawater desalination system, and an auxiliary supply was investigated in each city. The system under investigation is illustrated in Figure 1. Afterwards, these cities were ranked by multi-criteria decision-making approaches using criteria of wind power density, land cost, topography situation, natural disasters, and population. Finally, the results showed that Anzali, situated in the north of Iran near the Caspian Sea, was the best alternative as to the construction of the wind-powered hydrogen production system via desalinated seawater. Having conducted technical assessment, economic analysis would be essential for practically implementing the system.
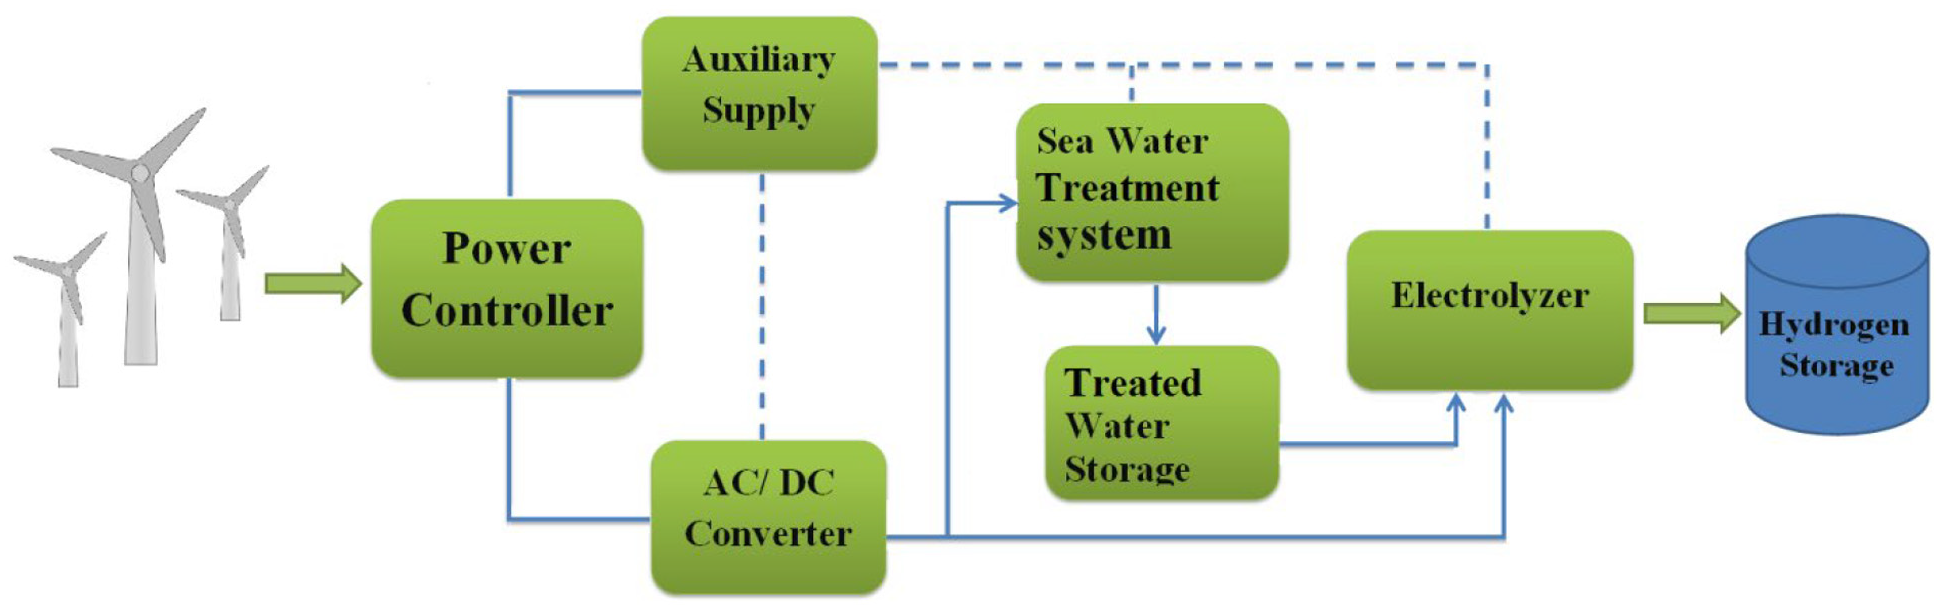
Schematic diagram of the hydrogen generation system using desalinated seawater (Rezaei et al., 2018a).
To the best of the authors’ knowledge, no work in Iran has economically assessed a wind-powered hydrogen production system which requires water to be constantly supported by a seawater desalination system. By virtue of this, the study seeks to fill the existing research gap for the first time in Iran.
The methodology of this research is based on Engineering Economics, because it is a subject in which some applicable and trustworthy techniques have been introduced (Mostafaeipour et al., 2020). As a result, to obtain reliable and precise results, these methods are employed in this research. Figure 2 provides the roadmap of this study to follow it better.
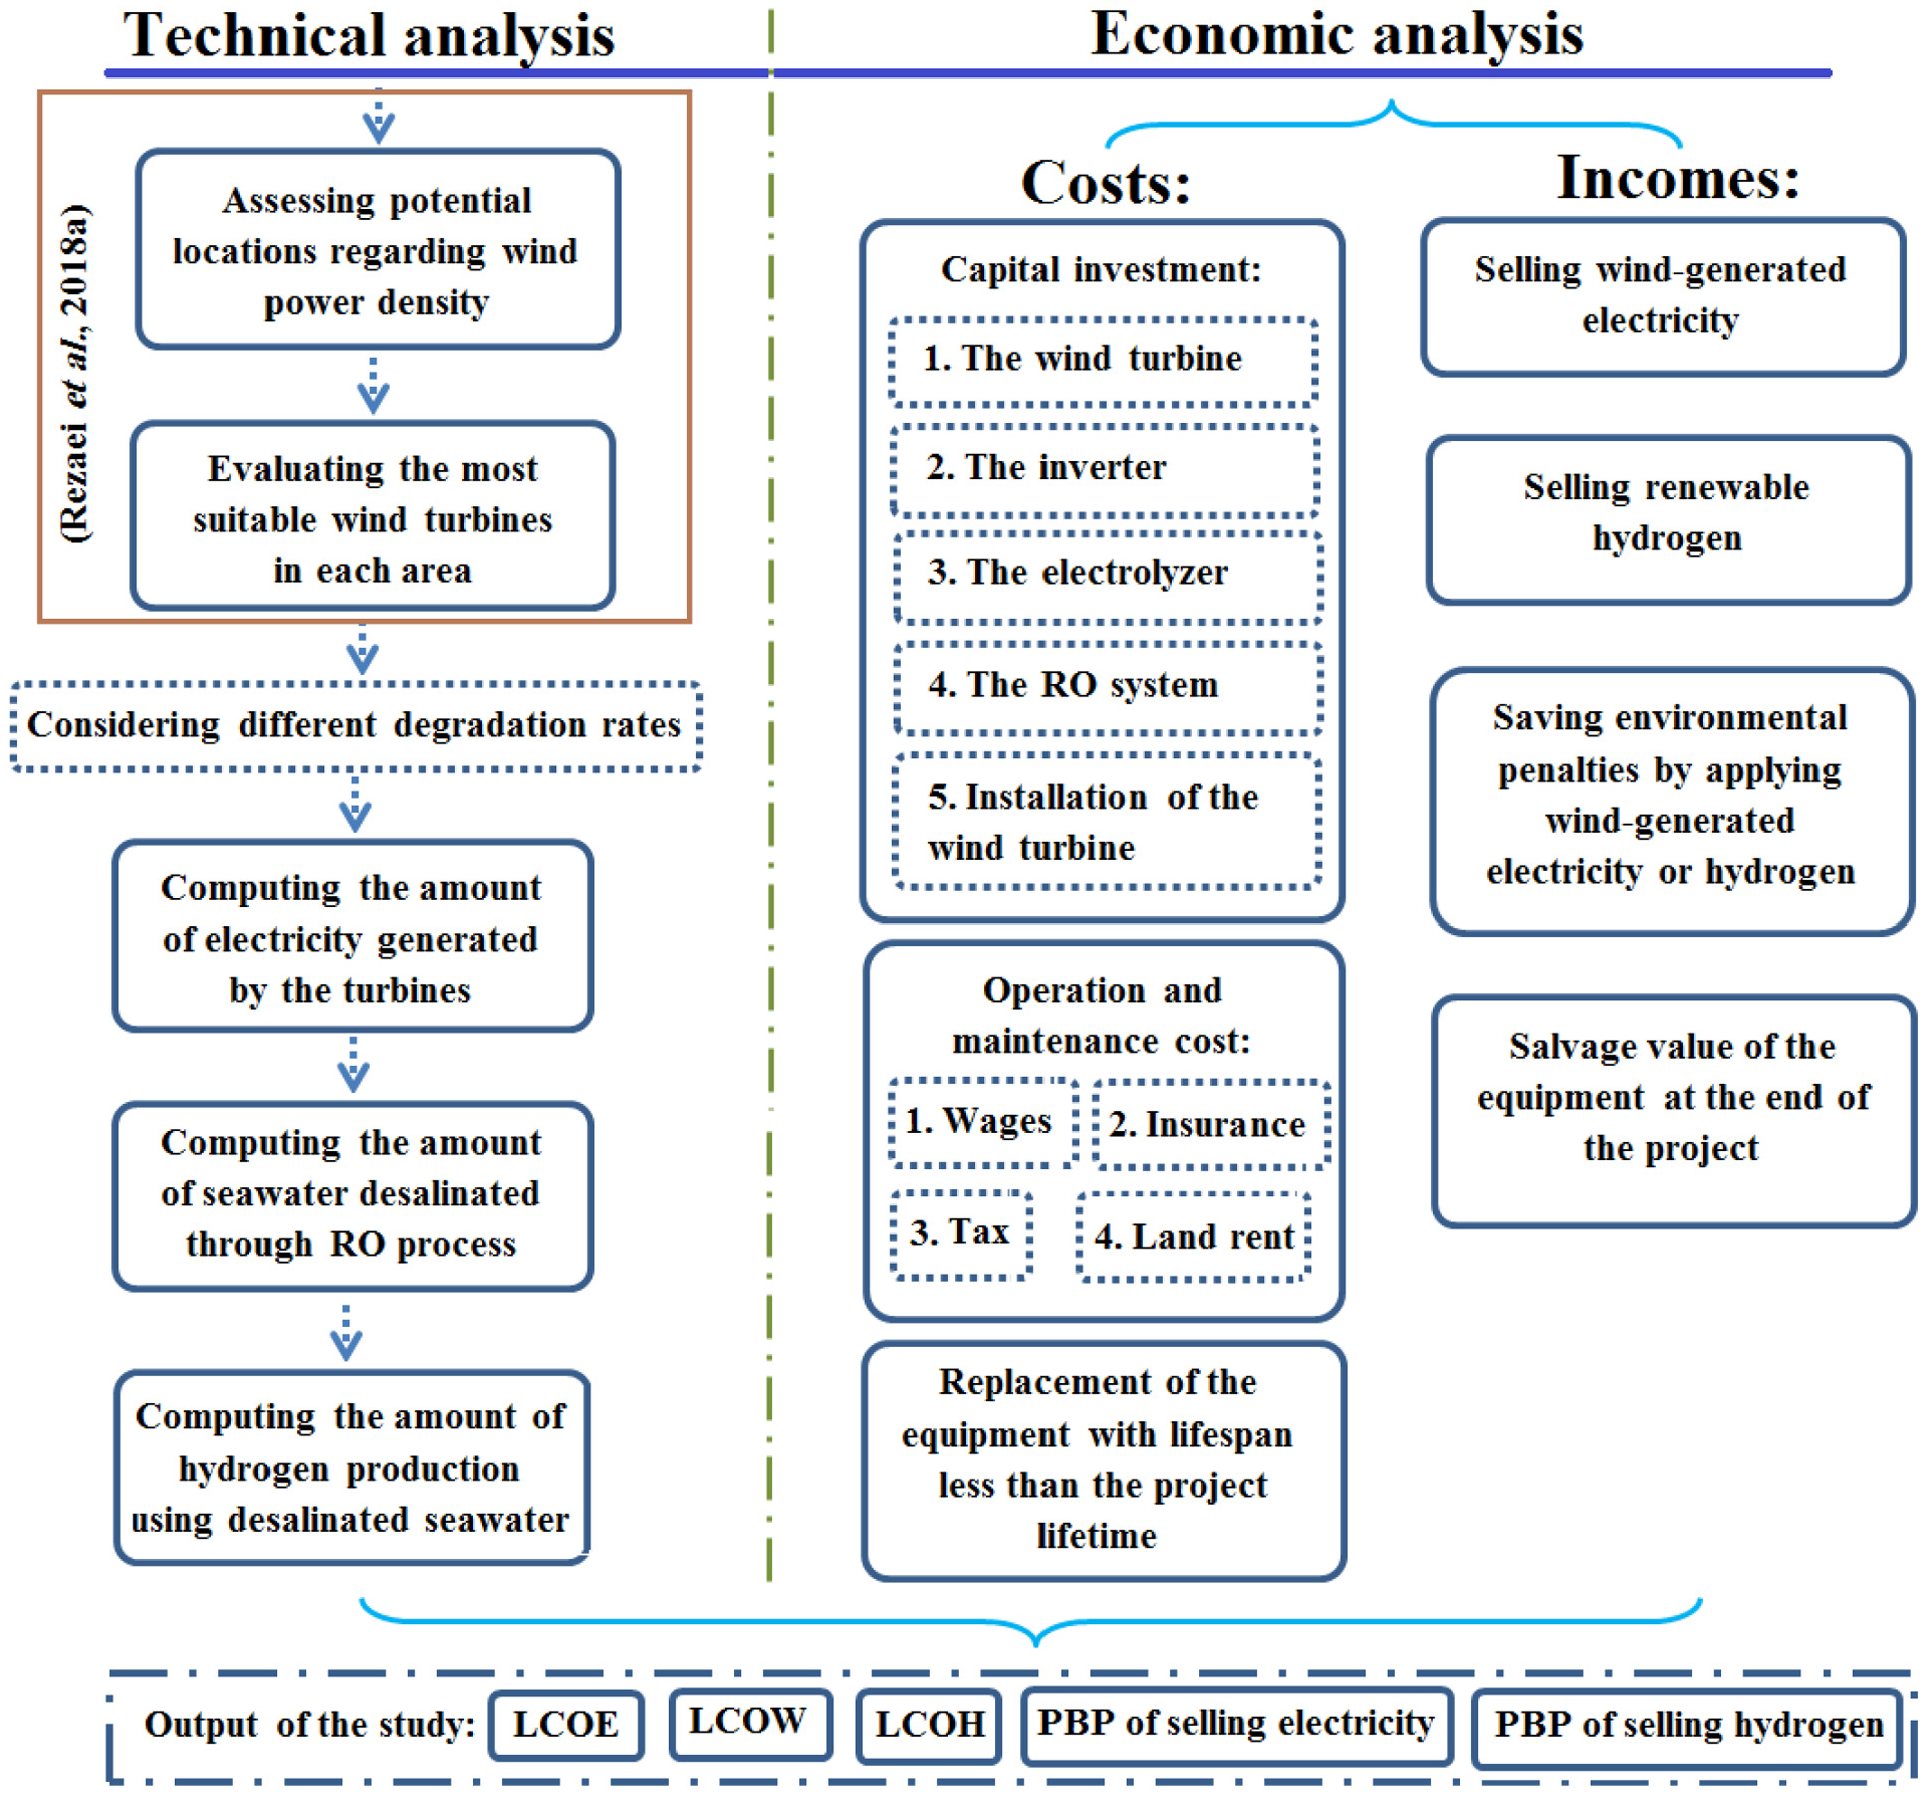
The roadmap of this study.
Literature review
Number of studies have been conducted regarding hydrogen and electricity production for different purposes using renewable energies. Menanteau et al. (2011) performed an economic assessment of hydrogen production using wind-generated electricity. Furthermore, Genç et al. (2012) carried out a research to project the cost of hydrogen generation using wind energy. For this, three wind turbines with hub heights of 50, 80, and 100 m and two electrolyzers with rated powers of 40 and 120 kW were studied. The results showed that the minimum LCOH would occur when the turbine with tower height of 100 m and the electrolyzer with rated power of 40 kW were applied together. Morgan et al. (2014) assessed the techno-economic feasibility of harnessing wind energy for the purpose of ammonia production using hydrogen, in which hydrogen was generated by electrolyzing water using wind-generated electricity, in Monhegan Island. For this, 14 wind turbines with rated powers ranging from 50 kW to 1.25 MW were investigated. Wu et al. (2015) performed a techno-economic assessment for an off-grid photovoltaic/fuel cell/battery hybrid power system to treat wastewater for making hydrogen. Olateju et al. (2016) carried out a research on an integrated wind to hydrogen energy conversion system to compare the cost of hydrogen generation via this method and the means of steam methane reforming. The results showed that utilizing wind energy to gain hydrogen using electrolyzer systems was not competitive with the conventional methods. To project LCOE, Abdelhady et al. (2017) evaluated a large-scale wind turbine at seven sites along the Mediterranean Sea in Egypt. The calculations showed that the minimum and the maximum produced energy belonged to the sites with capacity factors of 55% and 63%, respectively. Moreover, LCOE was computed between 0.075 and 0.079 US$/kWh which was determined to be very competitive in contrast to other renewable means. Morgan et al. (2017) proposed a framework for techno-economic evaluation of wind farm establishment for the purposes of hydrogen generation via water electrolysis process and ammonia production. Li et al. (2017) carried out a study to assess the life-cycle cost of hydrogen systems using low-price electricity in China. For serving the purpose of the study, three different paths for hydrogen were assumed, including (1) hydrogen as a chemical material, (2) hydrogen as fuel for polymer electrolyte membrane fuel cells to be used in the transport sector, and (3) hydrogen would be burned in an engine to output power. The results indicated that the first path was more economically viable. Al-Sharafi et al. (2017) studied the techno-economic feasibility of solar and wind energy systems for the purpose of power generation and hydrogen production in Saudi Arabia. For the scenario of electricity production, the system comprising 2 kW photovoltaic arrays, three wind turbines, 2 kW converter, and seven batteries storage bank would gain the least LCOE of 0.609 US$/kWh. Adding electrolyzer, fuel cell, and hydrogen tank to produce hydrogen would result in hydrogen with LCOH of 43.1 US$/kg. For enhancing the transportation sector via the utilization of fuel cell vehicles, Ajanovic and Haas (2018) sought to analyze the economic prospects of generating hydrogen for applying in passenger cars. Touili et al. (2018) performed a techno-economic analysis of electricity and hydrogen production using solar energy for 76 locations in Morocco. Finally, the results implied that LCOE and LCOH would vary from 0.099 to 0.77 US$/kWh and 4.64 to 5.79 US$/kg, respectively. Mohsin et al. (2018) evaluated the economic point of a hydrogen production system using wind energy in Pakistan and found that wind-generated electricity would cost between 0.0844 and 0.0864 US$/kWh. This range of LCOE resulted in the cost of renewable hydrogen varying from 5.3 to 5.8 US$/kg. Babarit et al. (2018) conducted a techno-economic viability study about hydrogen generation via wind energy on fleets far offshore. The delivered cost of wind-generated hydrogen was computed in the range of 7.1–9.4 €/kg which was dependent on different scenarios and distances. Yadav and Banerjee (2018) investigated the economic aspects of hydrogen generation from solar-driven high-temperature steam electrolysis process. Their finding showed that LCOH would range from 12.1 to 22 US$/kg based on different cases examined. Ayodele and Munda (2019) analyzed 15 likely sites in 5 provinces of South Africa to assess their suitability for launching a wind-powered hydrogen production system. Taking different types of wind turbines into consideration, their findings indicated that LCOH would vary between 1.4 and 39.55 US$/kg. Akhtari and Baneshi (2019) deployed HOMER software to assess the techno-economic feasibility of hybrid renewable energy systems to co-produce electricity, heat, and hydrogen simultaneously. For five locations in Canada, the United States, and Australia, Abdin and Mérida (2019) scrutinized the techno-economic viability of utilizing hybrid energy systems for electricity and hydrogen generation using HOMER software. The findings implied that hydrogen had economic advantages compared to batteries in long-time schemes. For New Zealand, Mohseni and Brent (2020) attempted to assess the performances of 20 meta-heuristic algorithms in solving the optimal design problems, by which economic feasibility of sustainable electricity and hydrogen production was evaluated. The results revealed that LCOE would wary from 0.12 to 0.18 NZD/kWh and LCOH would range between 6.17 and 7.82 NZD/kg, under different scenarios. In Brazil, Micena et al. (2020) carried out a techno-economic feasibility study to investigate hydrogen production using solar energy to serve the purpose of hydrogen refueling stations. The findings showed that LCOH would be between 8.96 and 13.55 US$/kg. In another research performed in Brazil, Nadaleti et al. (2020) sought to ascertain economic feasibility of hydrogen production from hydroelectric and wind farm energy surplus. Marino et al. (2019) used HOMER software to examine the economic viability of a stand-alone photovoltaic system to generate hydrogen for the purpose of feeding fuel cells. Rezaei et al. (2020b) scrutinized all capital cities of Afghanistan with regard to wind energy potential and tested 15 different cases to obtain the most likely results. They established that Fayzabad was the best city with the least amount of LCOE that the cost of hydrogen generation in which would vary from 2.118 to 2.346 US$/kg under different cases. For Qatar, Jahangiri et al. (2020) conducted a study to evaluate five potential sites considering four scenarios for generating electricity and hydrogen. To calculate LCOE and LCOH, HOMER software was utilized. More studies looking into economic analysis of hydrogen production can be found for Japan, Morocco, Norway, Austria, Algeria, and Kuwait (Boudries, 2016; Ennassiri et al., 2019; Meier, 2014; Sedaghat et al., 2020; Shibata, 2015; Yao et al., 2017).
Similarly, several studies have been performed in Iran assessing the economic aspects of utilizing renewable energies in none of which a seawater desalination system is included. Rezaei et al. (2018b) analyzed the socio-economic aspect of utilizing wind energy for the purpose of hydrogen production in three cities of Iran. Their findings indicated that the amount of LCOH would significantly decline from a short-term period scenario to a long-term period one. Mostafaeipour et al. (2019b) investigated the economic feasibility of hydrogen production via wind energy for using in industrial and agricultural sectors. They evaluated four cities of Ardebil province in Iran to obtain PBP of investing on this project. The results indicated that the city of Ardebil possessed the most promising economic outcomes among the others. Nematollahi et al. (2019) carried out a research to analyze the techno-economic feasibility of a solar–wind hybrid system to generate electricity and hydrogen in Sistan & Baluchistan province in Iran. Rezaei-Shouroki et al. (2017) studied several areas in the province of Fars in Iran to ascertain the best location for harnessing wind energy as the power source of a hydrogen production system. Moreover, Rezaei et al. (2020a) just technically examined three types of wind turbines and three different photovoltaic systems for the purpose of sea water desalination as well as hydrogen production using wind and solar energy in three ports of Mahshahr, Jask, and Chabahar and two Islands of Kish and Hormoz, Iran.
Methodology
LCOH
LCOH is of vital value, as it provides crucial information for the investors and policy makers. In crude terms, LCOH implies how much a kilogram of hydrogen would cost to be gained. To calculate the value of LCOH, equation (1) is used (Rezaei et al., 2020b)

in which



where

where

in which
PBP
From this factor, it can be inferred that how much time it takes to recover capital investment. As a result, PBP plays a crucial role from the investors’ point of view and other key policy makers. To guess the required time to reach the break-even point, that is, the profitability time, equation (7) is utilized (Oskoueinejad, 1996)

in which



where
Summary of findings of the previous work (Rezaei et al., 2018a)
Since Iran has been suffering from a severe water shortage, a wind-powered hydrogen production system was proposed, in which seawater was desalinated to supply water for the electrolysis system. The results of the research with regard to the best alternative, Anzali, are as follows:
The highest wind power density with the value of 327.23 W/m2/year belonged to Anzali among the cities under study;
Capacity factor of deploying Gamesa G47/660 turbine in Anzali would be 19.70%. Furthermore, this factor for AWE 52/750 and EWT 52/900 wind turbines was calculated as 21.43% and 29.37%, respectively;
Utilizing one set of Gamesa G47/660, AWE 52/750, and EWT 52/900 wind turbines would result in generating 1138.97, 1407.95, and 2315.53 MWh of electricity in the first year, respectively;
Within 1 year operation of the aforementioned wind turbines, 216,404.3, 267,510.5, and 439,950.7 m3 of treated and desalinated water could be gained, respectively;
Over year 1, the amount of hydrogen which can be generated by the use of the abovementioned wind turbines from the process of water electrolysis would equate to 17,695, 21,873, and 35,973 kg, respectively.
Analysis
To obtain precise results, the following assumptions have been taken into account:
Purchasing wind turbine with high rated power would cost approximately 500 US$/kW of its nominal power;
Major costs related to installing the wind turbine which consists of shipping cost, customs fees, and grid integration would equal 40% of the price of wind turbine (Fazelpour et al., 2015);
KACO Inverter, Powador 60.0TL3 Version XL model, which costs around US$6364 and a 10-year lifespan, is used (Alma Solar Shop, 2019);
The likely cost of operating and maintaining wind turbine including the wages, tax, insurance, and land rent would be 6% of the price of wind turbine (Fazelpour et al., 2015);
Releasing a ton of CO2 incurs the expenditure of US$36.3 as a penalty (Ortega-Izquierdo and Del Río, 2016). Thus, avoiding this from happening would lead to saving environmental penalty. Therefore,
Using electric power gained from fuel-oil and natural gas power plants would emit some 0.277 and 0.20 kCO2 per kW, respectively (Ortega-Izquierdo and Del Río, 2016). By virtue of this, two scenarios should be assessed: (1) replacing wind electricity instead of fuel-oil electricity and (2) replacing wind electricity instead of natural gas electricity;
Discount rate, the difference between inflation rate and interest rate, is almost 5% as
Unpredictability is an inherent nature of any project so that some unforeseen circumstances might occur during the lifetime of the proposed system degrading wind turbine performance. For this, five values of 0, 0.01, 0.02, 0.03, and 0.04 would be factored into the calculations as
BWRO-2S-130/75 seawater desalination system requiring 5 kWh/m3 of electricity would impose US$81,000 as its initial cost (Mostafaeipour et al., 2019a);
Reverse osmosis (RO) seawater desalination system is assumed to be used because it is conventional and mature, but it might not provide the electrolyzer with the pure, distilled water required. Hence, it is also presumed that the desalinated water at the output of the under-study RO seawater desalination is sent to a mechanical vapor compression (MVP) water purification plant to acquire the most possible pure water (Morgan et al., 2014);
The unit cost of electrolyzer is considered to be 1500 US$/kW;
The electrolyzer under investigation is an alkaline type with efficiency of 75% (Douak and Settou, 2015). This type was chosen due to its positive points like cost-effectiveness, relatively low cost, requiring non-noble catalyst, and long-term stability (Carmo et al., 2013);
The price of purchasing wind-generated electricity by the government is 0.12 US$/kWh (Rezaei et al., 2019a);
The price of purchasing renewable hydrogen would equate to US$10 in the years to come (California Fuel Cell Partnership, 2019);
In order to calculate PBP related to hydrogen generation, since the lifetime of the electrolyzer is 7 years, 65% of the initial price of the turbine would constitute as salvage value and must be shifted to year 0. This 65% is selected because the turbine will work for another 13 years after the electrolyzer terminates, so almost 65% of the turbine lifetime remains.
LCOH calculations
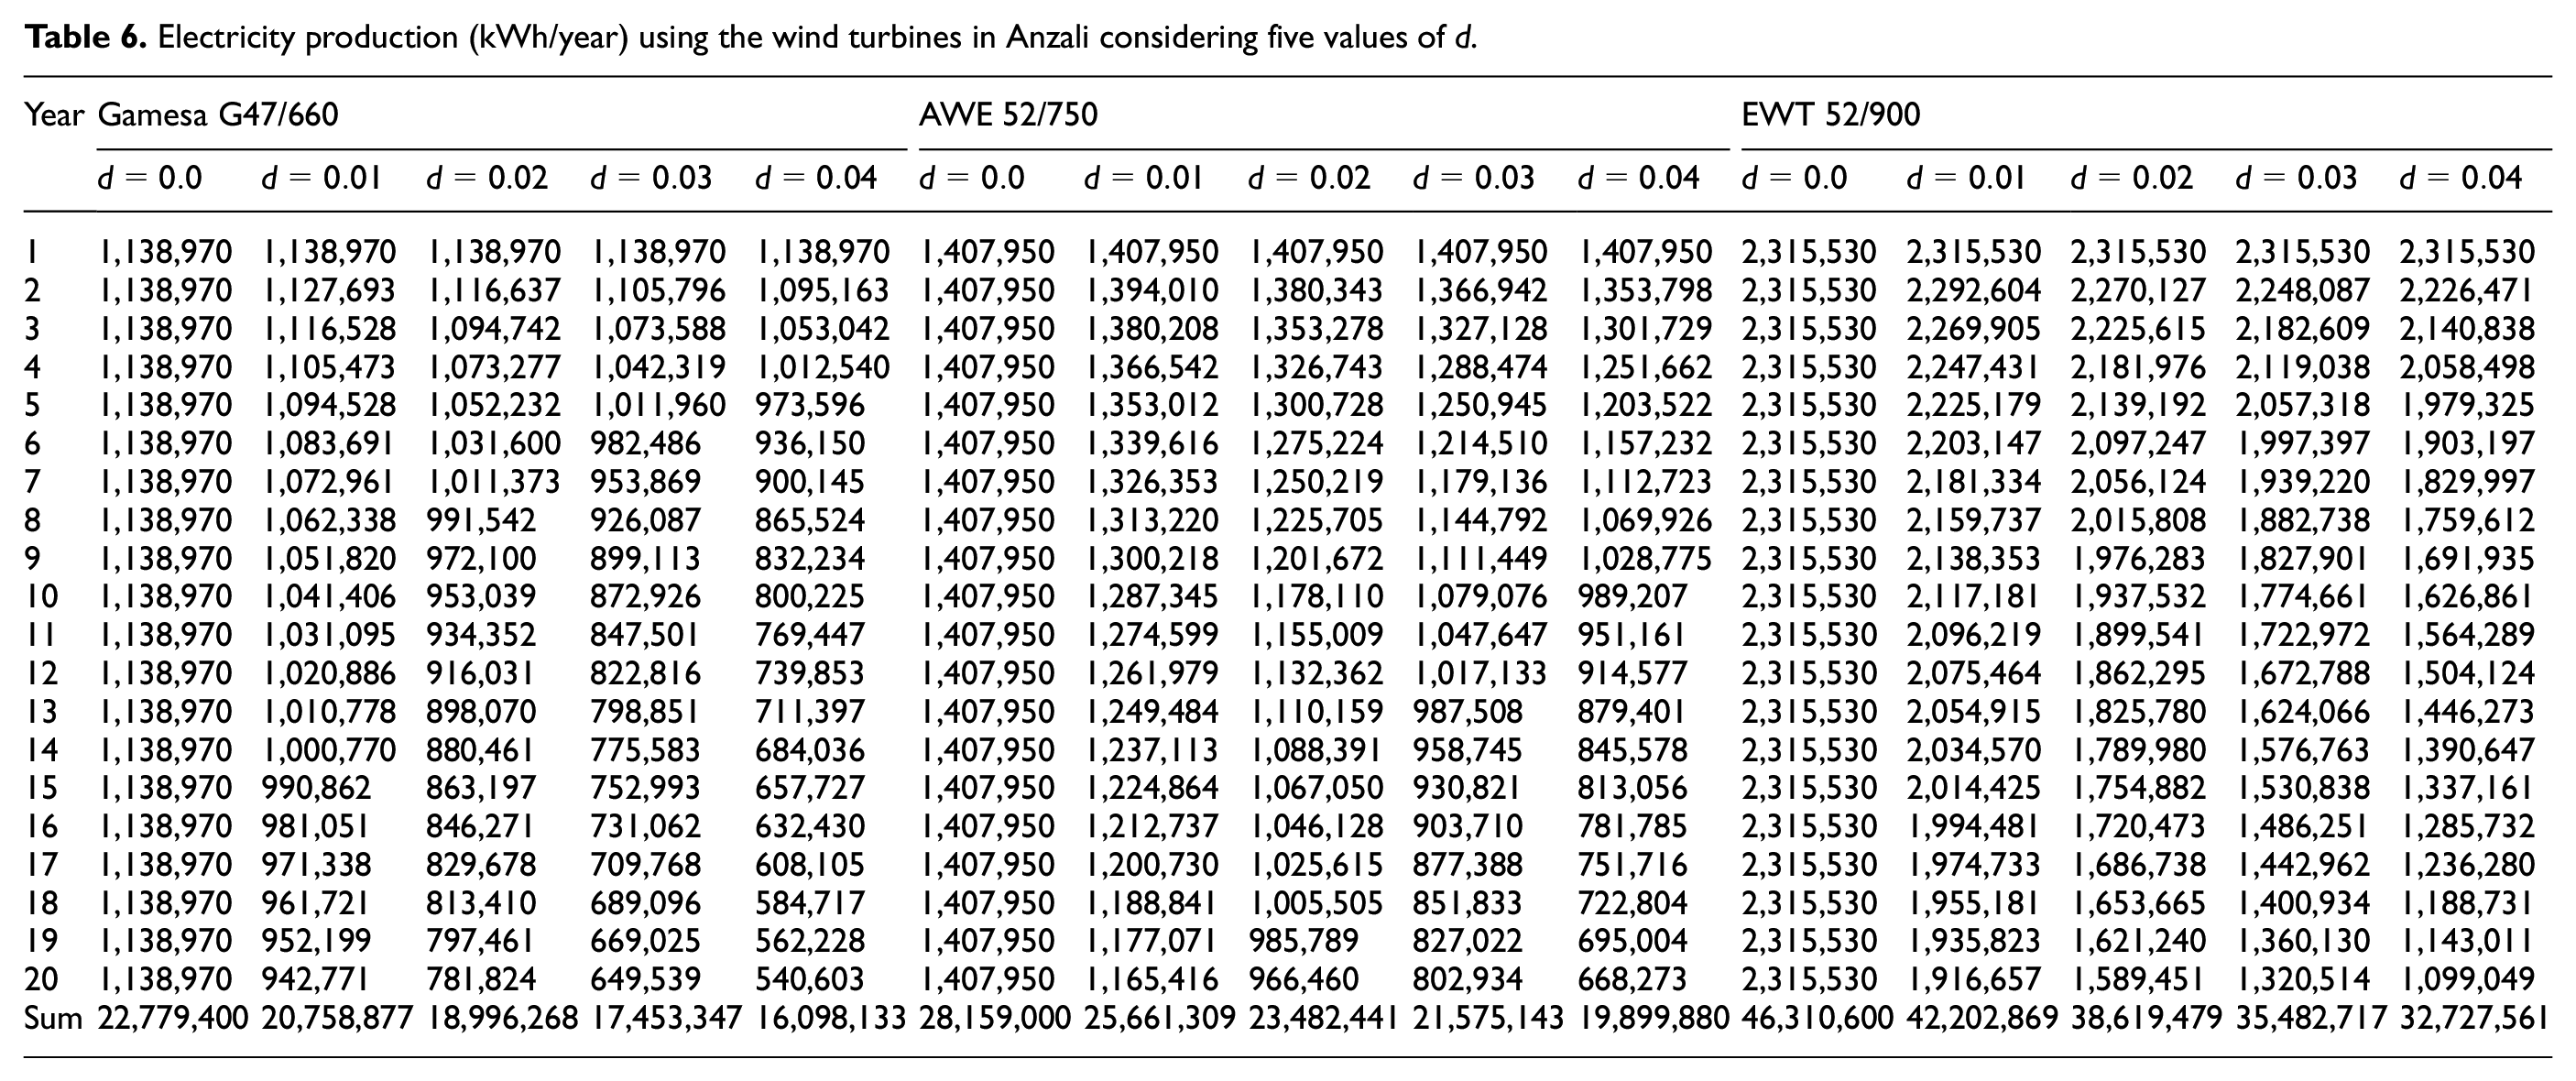
Having taken these postulations into consideration, the results suggested that utilizing one set of the turbine with rated power of 660 kW would provide almost 22,779,400 kWh of electricity within the lifetime of the project when
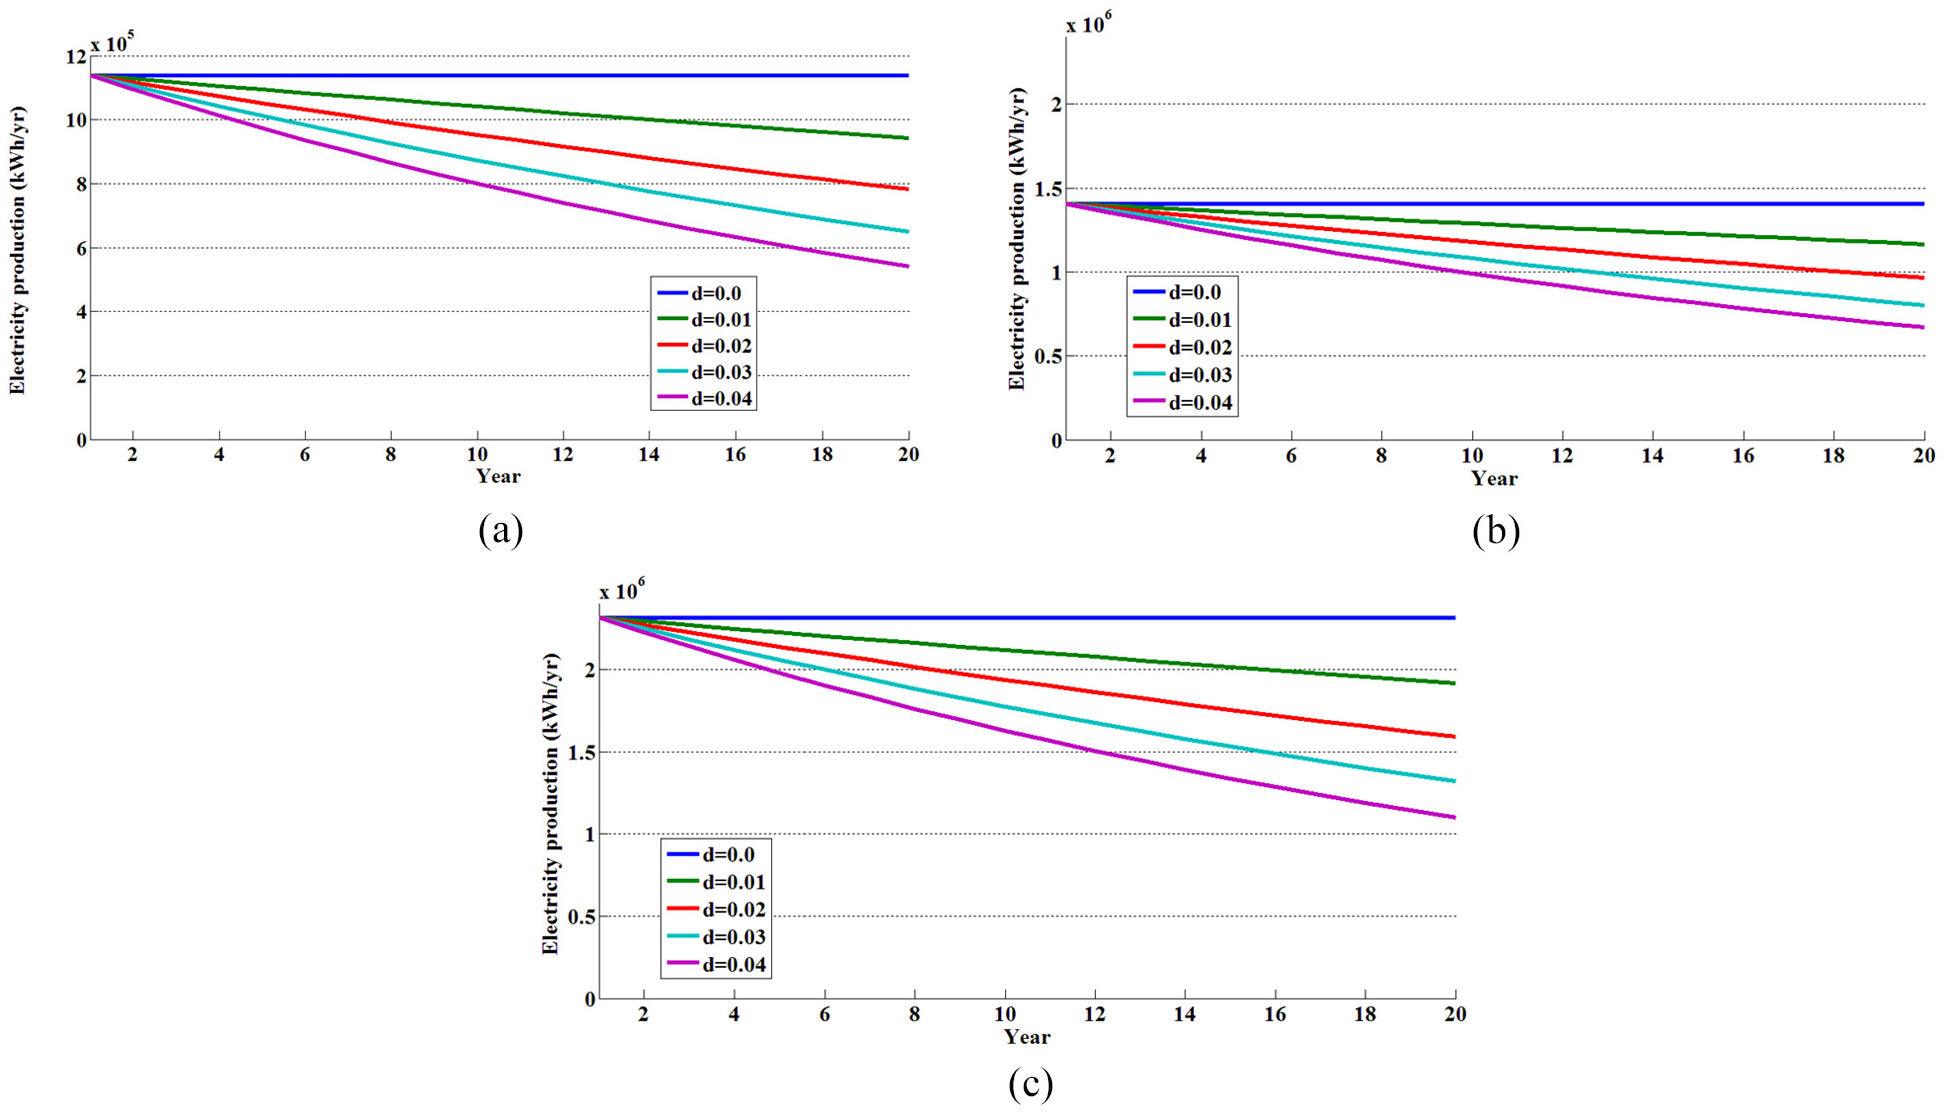
Electricity production (kWh/year) using (a) Gamesa G47/660, (b) AWE 52/750, and (c) EWT 52/900 wind turbines for five values of
Then, costs pertaining to the establishment of the wind site and incomes of selling renewable electricity were projected as shown in Figure 4. It should be noted that if we had to pay US$6364 for the inverter in year 11, then the present worth of this amount of money in year 0 would be US$3721. This means that, the value of money is decreasing year after year.
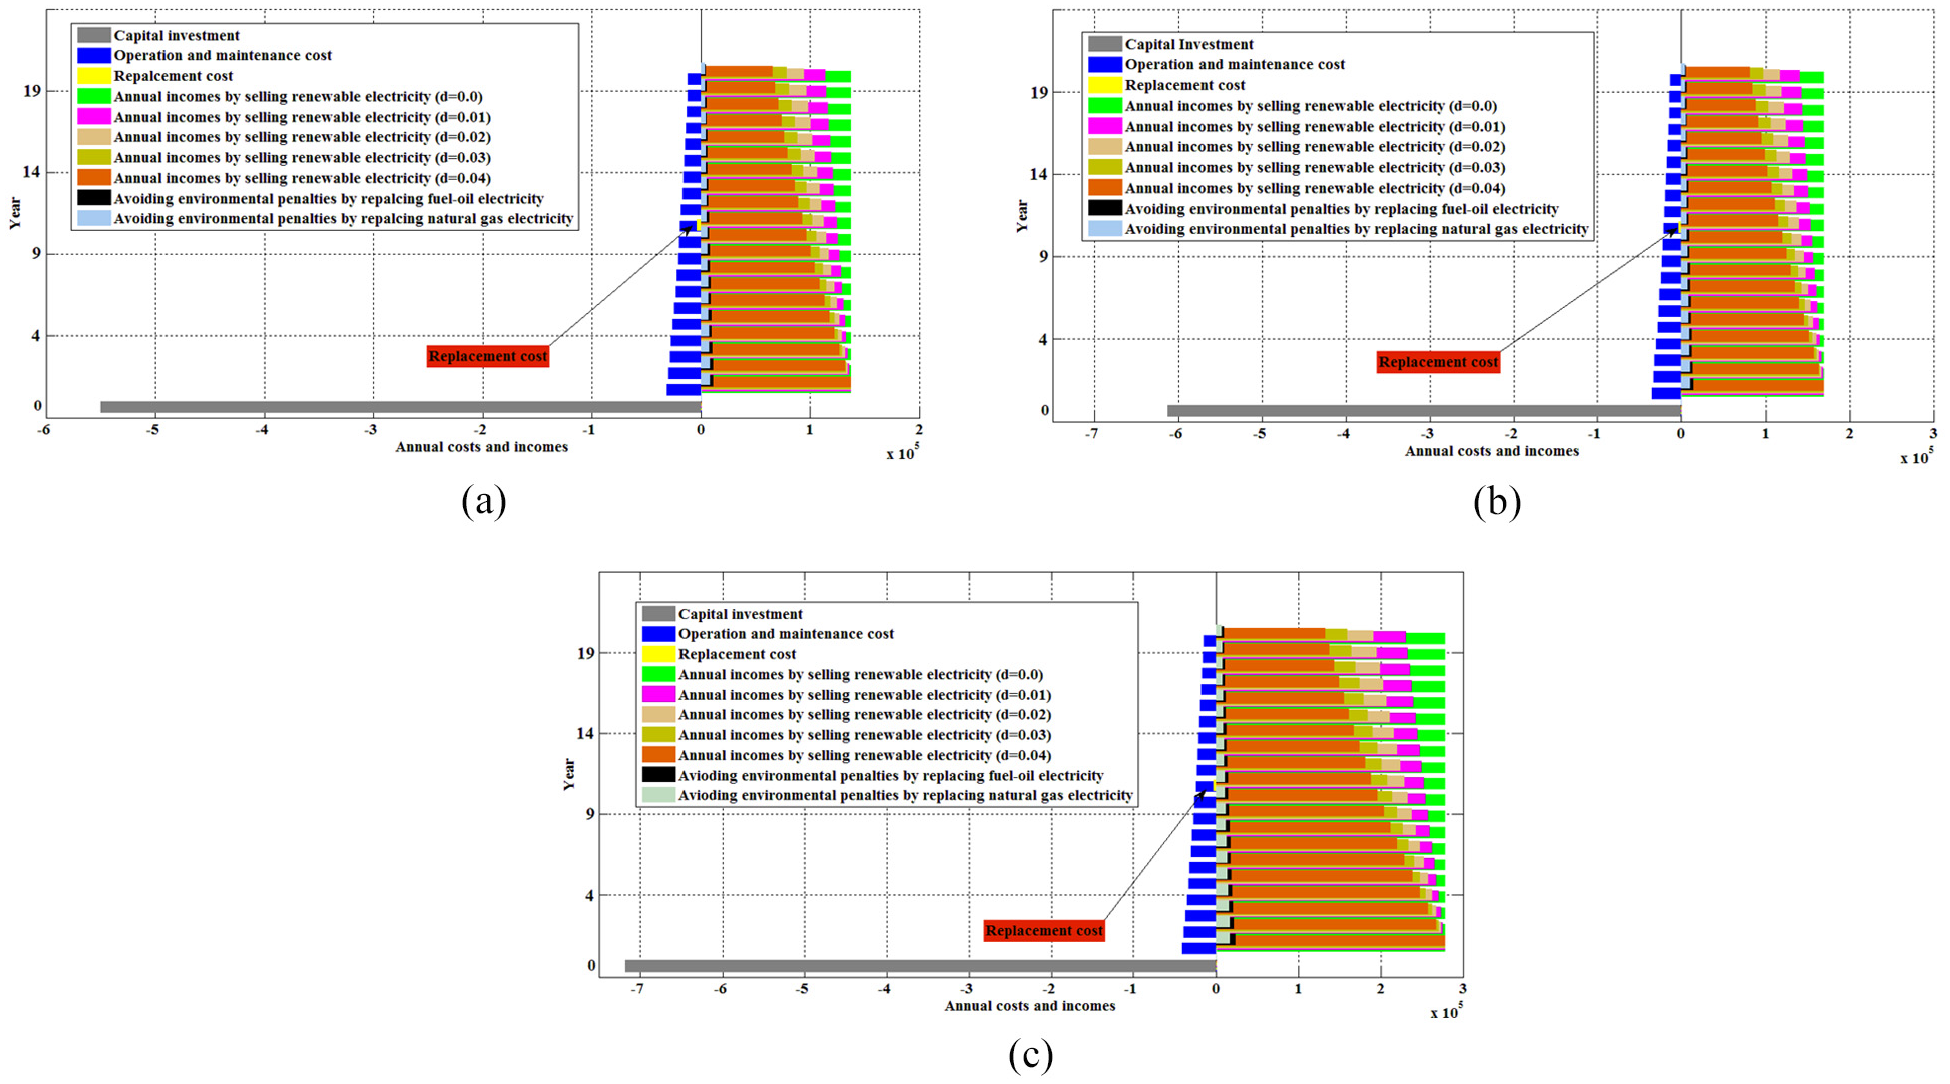
Present worth of all costs imposed and incomes earned within the lifespan of the project after selling electricity generated by (a) Gamesa G47/660, (b) AWE 52/750, and (c) EWT 52/900 wind turbines for five values of
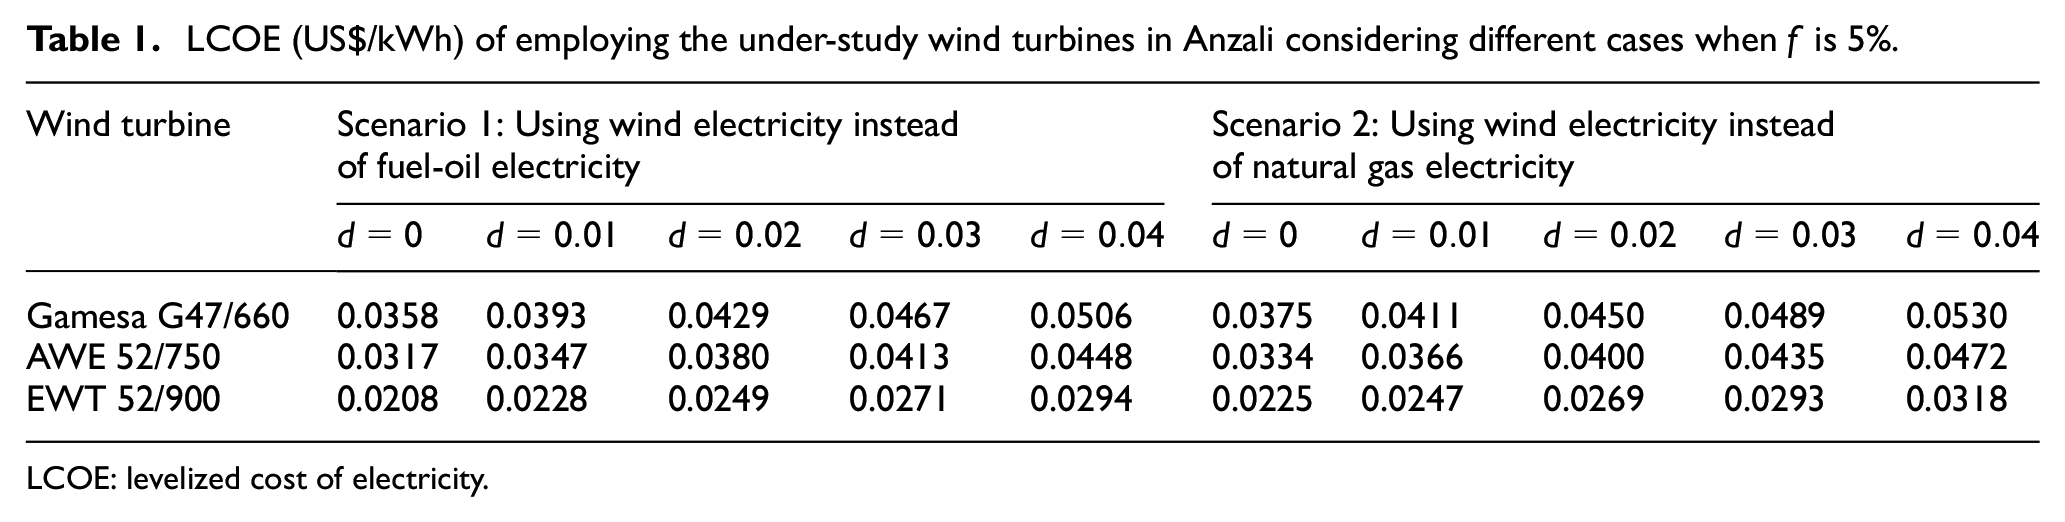
Before estimating LCOH pertaining to the proposed system launched in Anzali under different values of
LCOE (US$/kWh) of employing the under-study wind turbines in Anzali considering different cases when
LCOE: levelized cost of electricity.
Afterwards, the amount of seawater that can be desalinated using wind electricity was evaluated as depicted in Figure 5.
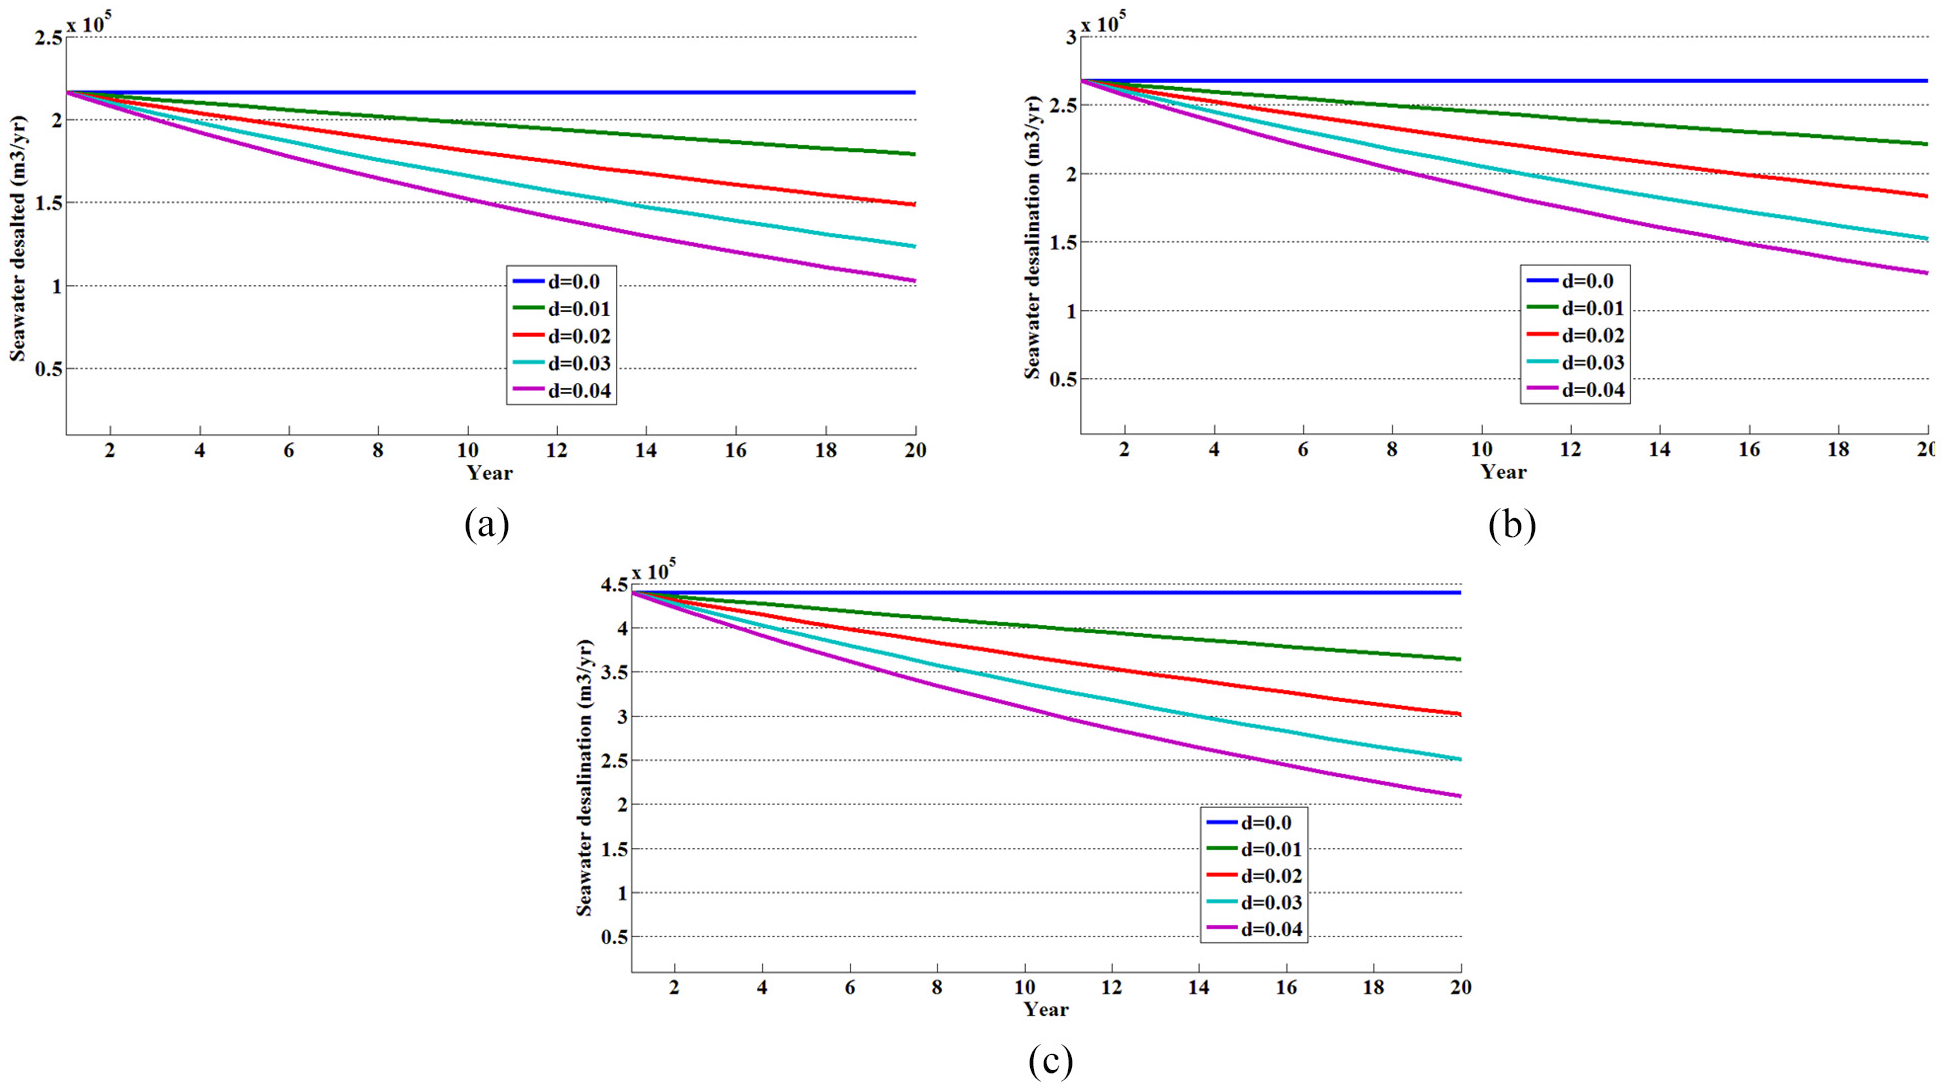
Seawater desalination (m3/year) using (a) Gamesa G47/660, (b) AWE 52/750, and (c) EWT 52/900 wind turbines for five values of
Then, LCOW, which indicates the cost of desalinating seawater, was computed. The findings implied that using one set of Gamesa G47/660 for the purpose of desalinating seawater under scenario 1 would impose almost 0.0281 US$/m3 when
LCOW (US$/m3) of utilizing the under-study desalination system in Anzali considering different cases.

LCOW: levelized cost of water desalinated.
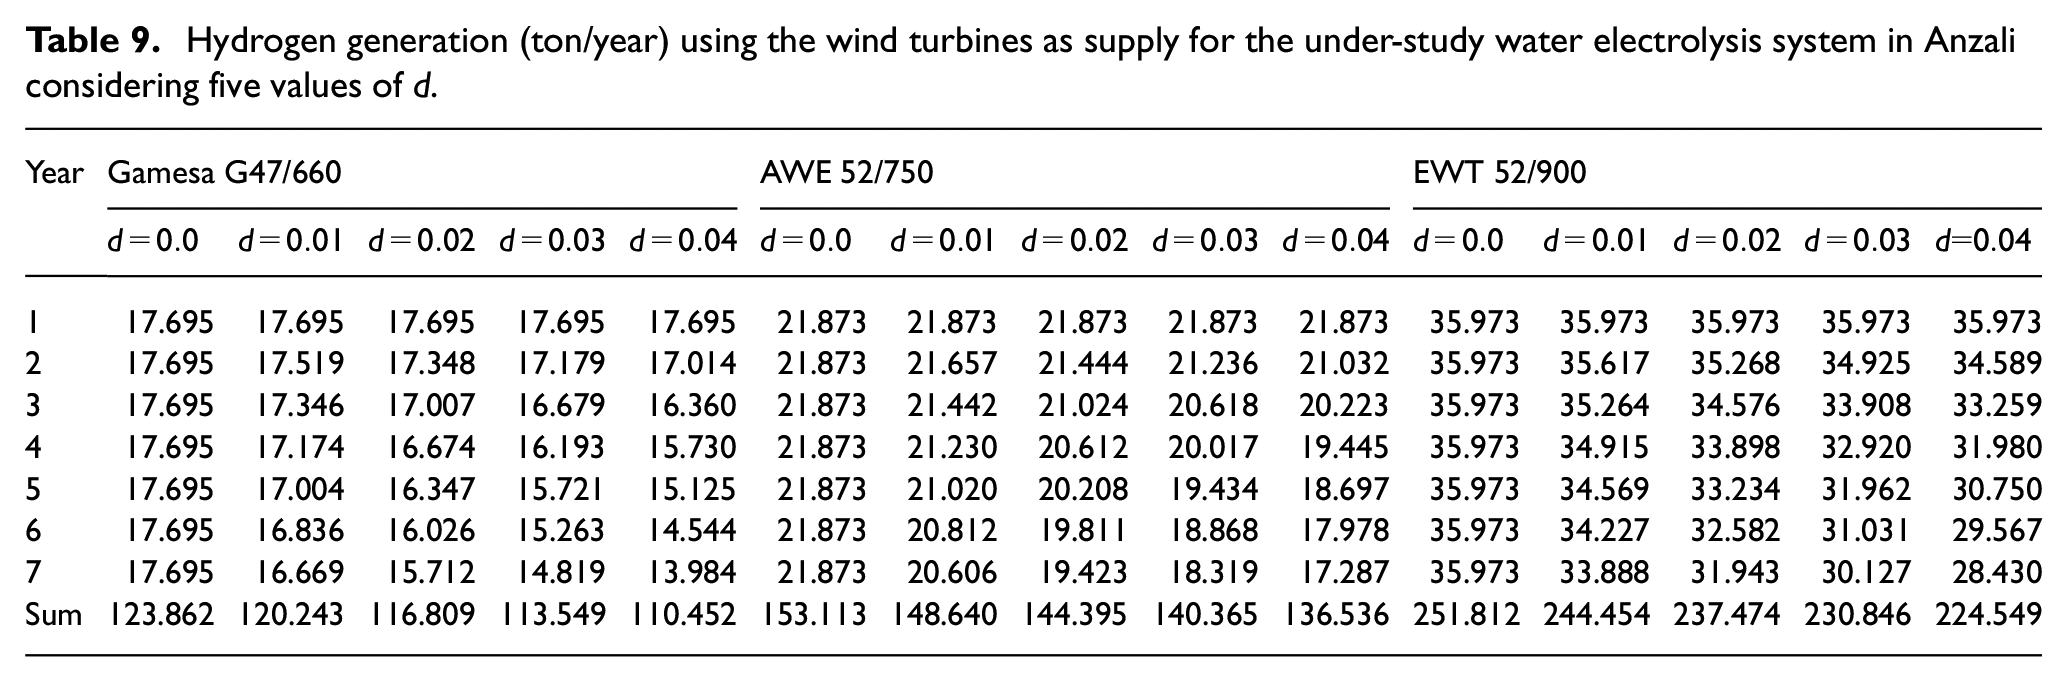
Then, how much hydrogen would be obtained within the lifetime of the electrolyzer under all examined cases was calculated. Figure 6 demonstrates the amount of hydrogen production using the aforementioned wind turbines and the studied electrolyzer over 7 years.

Hydrogen generation (ton/year) using (a) Gamesa G47/660, (b) AWE 52/750, and (c) EWT 52/900 wind turbines for five values of
Having computed all necessary values for estimating the cost of hydrogen generation, the amount of LCOH required for installing and launching the proposed system in Anzali was estimated. According to the results of the calculations, as the rated power of the wind turbines grew, the cost of producing renewable hydrogen using desalinated seawater became less. Figures in Table 3 indicates that LCOH under the first scenario would range from 10.5023 to 10.5483 US$/kg, from 9.6389 to 9.6792 US$/kg, and from 7.0074 to 7.0337 US$/kg when deploying Gamesa G47/660, AWE 52/750, and EWT 52/900 wind turbines, respectively. These ranges increased by just very few cents when evaluating the second scenario.
LCOH (US$/kg) of utilizing the proposed system in Anzali considering different cases.

LCOH: levelized cost of hydrogen
Estimating PBP
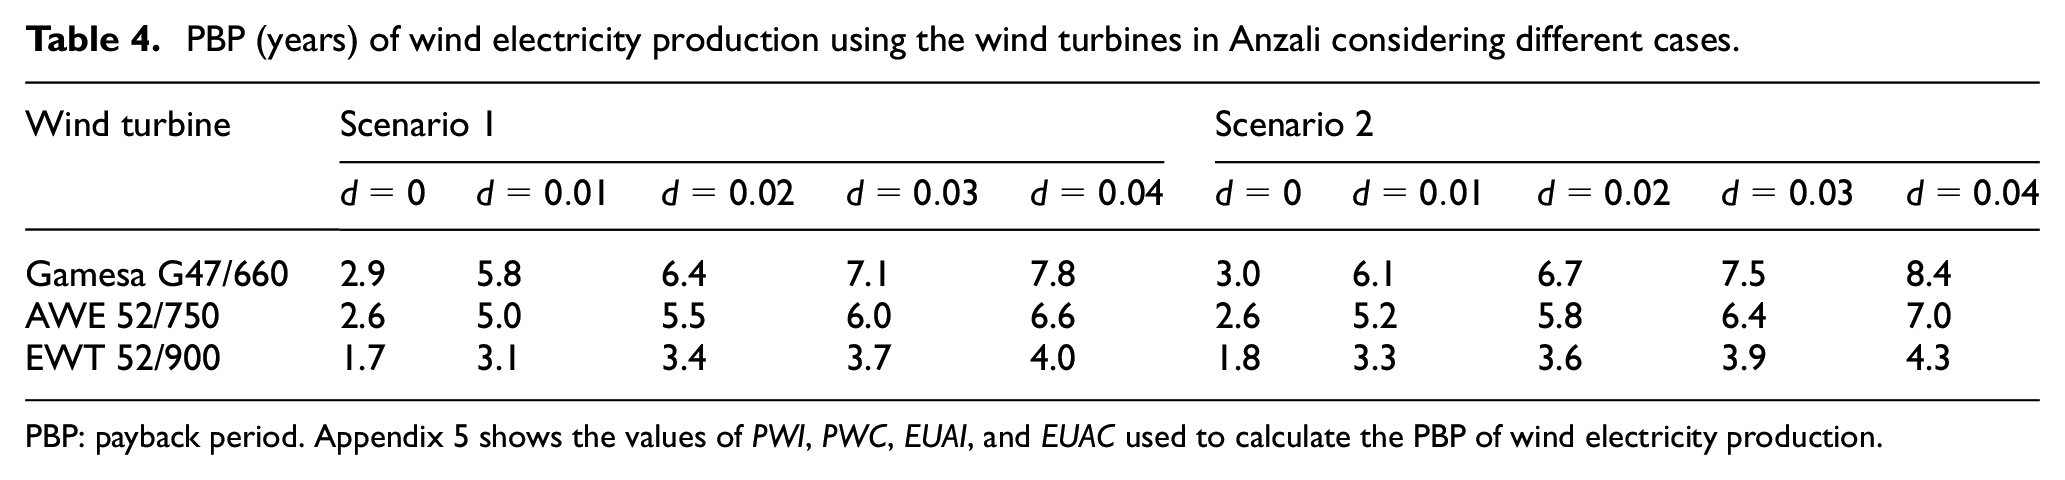
As mentioned earlier, those investing on projects obviously expect to receive their capital investment and reach profitability as soon as possible. To this end, equations (7) to (10) can be used to guess the time required to gain profit. The results showed that PBP of selling wind-generated electricity after purchasing, installing, and utilizing all wind turbines under investigation would be less than half of their lifespan. Take the first scenario for instance, all initial investment as to Gamesa G47/660 wind turbine utilization for electricity production in Anzali is expected to recover before the beginning of year 4 when
PBP (years) of wind electricity production using the wind turbines in Anzali considering different cases.
PBP: payback period. Appendix 5 shows the values of
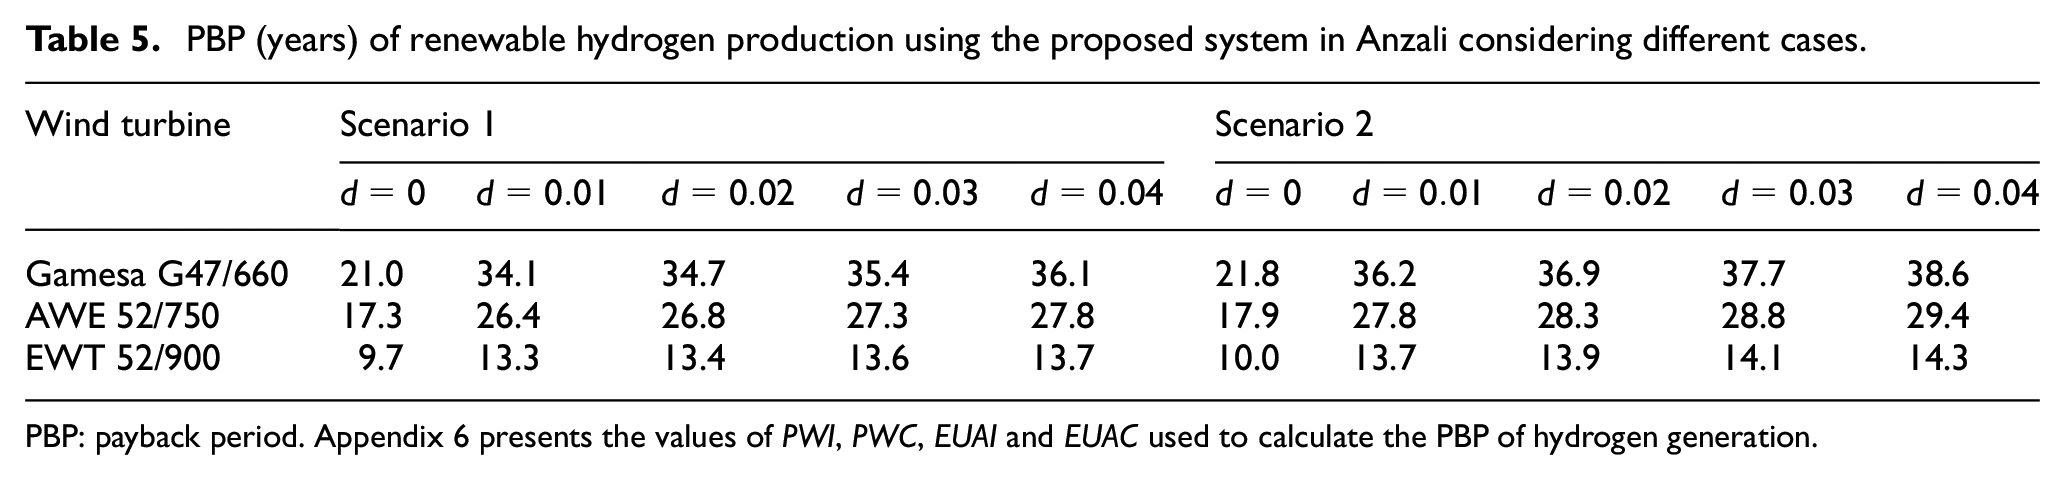
Accordingly, PBP concerned with hydrogen production using the proposed system was calculated. Utilizing Gamesa G47/660 wind turbine under the first scenario and when
PBP (years) of renewable hydrogen production using the proposed system in Anzali considering different cases.
PBP: payback period. Appendix 6 presents the values of
Conclusion
Due to the high value of economic aspects of producing renewable hydrogen, this study aimed at assessing the economic viability of utilizing wind energy for hydrogen generation via desalinated seawater. This process was proposed in the previous work (Rezaei et al., 2018a) because of water shortage issue in Iran. After scrutinizing seven coastal cities situated in the north and south of Iran and also obtaining promising results regarding technical analysis of the system for the city of Anzali, econometrics were conducted to provide investors with the most likely outcomes of the project. The main findings are drawn as follows:
If wind electricity were to be employed instead of electric power generated by a fuel-oil power plant, then LCOE of Gamesa G47/660, AWE 52/750, and EWT 52/900 turbines would be, respectively, 0.0506, 0.0448, and 0.0294 US$/kWh when
Under the second scenario, replacing natural gas electricity with wind electricity, LCOE of the abovementioned turbines, respectively, were 0.053, 0.0472, and 0.0318 US$/kWh when
All the values of LCOE proved profitability, since the price of purchasing renewable electricity in Iran is 0.12 US$/kWh;
Evaluating the first scenario, LCOW would vary from 0.0281 to 0.0398 US$/m3, from 0.0235 to 0.0332 US$/m3, and from 0.0147 to 0.0208 US$/m3 when using electricity generated by the turbines with rated powers of 660, 750, and 900 kW, respectively;
Considering the second scenario, LCOW would, respectively, range between 0.0286 and 0.0404 US$/m3, between 0.0239 and 0.0338 US$/m3, and between 0.0151 and 0.0214 US$/m3;
LCOH ranges were calculated between 10.5023 and 10.5483 US$/kg, between 9.6389 and 9.6792 US$/kg, and between 7.0074 and 7.0337 US$/kg under scenario 1. Furthermore, these ranges increased slightly by less than 2 cents when the second scenario was taken into account;
Computations pertaining to PBP showed that utilizing all turbines under study would be lucrative for the purpose of electricity generation, whereas utilization of EWT 52/900 for hydrogen production would be debatable if some supportive schemes were introduced by the government.
Footnotes
Appendix 1
Electricity production (kWh/year) using the wind turbines in Anzali considering five values of
| Year | Gamesa G47/660 | AWE 52/750 | EWT 52/900 | ||||||||||||
|---|---|---|---|---|---|---|---|---|---|---|---|---|---|---|---|
|
|
|
|
|
|
|
|
|
|
|
|
|
|
|
|
|
| 1 | 1,138,970 | 1,138,970 | 1,138,970 | 1,138,970 | 1,138,970 | 1,407,950 | 1,407,950 | 1,407,950 | 1,407,950 | 1,407,950 | 2,315,530 | 2,315,530 | 2,315,530 | 2,315,530 | 2,315,530 |
| 2 | 1,138,970 | 1,127,693 | 1,116,637 | 1,105,796 | 1,095,163 | 1,407,950 | 1,394,010 | 1,380,343 | 1,366,942 | 1,353,798 | 2,315,530 | 2,292,604 | 2,270,127 | 2,248,087 | 2,226,471 |
| 3 | 1,138,970 | 1,116,528 | 1,094,742 | 1,073,588 | 1,053,042 | 1,407,950 | 1,380,208 | 1,353,278 | 1,327,128 | 1,301,729 | 2,315,530 | 2,269,905 | 2,225,615 | 2,182,609 | 2,140,838 |
| 4 | 1,138,970 | 1,105,473 | 1,073,277 | 1,042,319 | 1,012,540 | 1,407,950 | 1,366,542 | 1,326,743 | 1,288,474 | 1,251,662 | 2,315,530 | 2,247,431 | 2,181,976 | 2,119,038 | 2,058,498 |
| 5 | 1,138,970 | 1,094,528 | 1,052,232 | 1,011,960 | 973,596 | 1,407,950 | 1,353,012 | 1,300,728 | 1,250,945 | 1,203,522 | 2,315,530 | 2,225,179 | 2,139,192 | 2,057,318 | 1,979,325 |
| 6 | 1,138,970 | 1,083,691 | 1,031,600 | 982,486 | 936,150 | 1,407,950 | 1,339,616 | 1,275,224 | 1,214,510 | 1,157,232 | 2,315,530 | 2,203,147 | 2,097,247 | 1,997,397 | 1,903,197 |
| 7 | 1,138,970 | 1,072,961 | 1,011,373 | 953,869 | 900,145 | 1,407,950 | 1,326,353 | 1,250,219 | 1,179,136 | 1,112,723 | 2,315,530 | 2,181,334 | 2,056,124 | 1,939,220 | 1,829,997 |
| 8 | 1,138,970 | 1,062,338 | 991,542 | 926,087 | 865,524 | 1,407,950 | 1,313,220 | 1,225,705 | 1,144,792 | 1,069,926 | 2,315,530 | 2,159,737 | 2,015,808 | 1,882,738 | 1,759,612 |
| 9 | 1,138,970 | 1,051,820 | 972,100 | 899,113 | 832,234 | 1,407,950 | 1,300,218 | 1,201,672 | 1,111,449 | 1,028,775 | 2,315,530 | 2,138,353 | 1,976,283 | 1,827,901 | 1,691,935 |
| 10 | 1,138,970 | 1,041,406 | 953,039 | 872,926 | 800,225 | 1,407,950 | 1,287,345 | 1,178,110 | 1,079,076 | 989,207 | 2,315,530 | 2,117,181 | 1,937,532 | 1,774,661 | 1,626,861 |
| 11 | 1,138,970 | 1,031,095 | 934,352 | 847,501 | 769,447 | 1,407,950 | 1,274,599 | 1,155,009 | 1,047,647 | 951,161 | 2,315,530 | 2,096,219 | 1,899,541 | 1,722,972 | 1,564,289 |
| 12 | 1,138,970 | 1,020,886 | 916,031 | 822,816 | 739,853 | 1,407,950 | 1,261,979 | 1,132,362 | 1,017,133 | 914,577 | 2,315,530 | 2,075,464 | 1,862,295 | 1,672,788 | 1,504,124 |
| 13 | 1,138,970 | 1,010,778 | 898,070 | 798,851 | 711,397 | 1,407,950 | 1,249,484 | 1,110,159 | 987,508 | 879,401 | 2,315,530 | 2,054,915 | 1,825,780 | 1,624,066 | 1,446,273 |
| 14 | 1,138,970 | 1,000,770 | 880,461 | 775,583 | 684,036 | 1,407,950 | 1,237,113 | 1,088,391 | 958,745 | 845,578 | 2,315,530 | 2,034,570 | 1,789,980 | 1,576,763 | 1,390,647 |
| 15 | 1,138,970 | 990,862 | 863,197 | 752,993 | 657,727 | 1,407,950 | 1,224,864 | 1,067,050 | 930,821 | 813,056 | 2,315,530 | 2,014,425 | 1,754,882 | 1,530,838 | 1,337,161 |
| 16 | 1,138,970 | 981,051 | 846,271 | 731,062 | 632,430 | 1,407,950 | 1,212,737 | 1,046,128 | 903,710 | 781,785 | 2,315,530 | 1,994,481 | 1,720,473 | 1,486,251 | 1,285,732 |
| 17 | 1,138,970 | 971,338 | 829,678 | 709,768 | 608,105 | 1,407,950 | 1,200,730 | 1,025,615 | 877,388 | 751,716 | 2,315,530 | 1,974,733 | 1,686,738 | 1,442,962 | 1,236,280 |
| 18 | 1,138,970 | 961,721 | 813,410 | 689,096 | 584,717 | 1,407,950 | 1,188,841 | 1,005,505 | 851,833 | 722,804 | 2,315,530 | 1,955,181 | 1,653,665 | 1,400,934 | 1,188,731 |
| 19 | 1,138,970 | 952,199 | 797,461 | 669,025 | 562,228 | 1,407,950 | 1,177,071 | 985,789 | 827,022 | 695,004 | 2,315,530 | 1,935,823 | 1,621,240 | 1,360,130 | 1,143,011 |
| 20 | 1,138,970 | 942,771 | 781,824 | 649,539 | 540,603 | 1,407,950 | 1,165,416 | 966,460 | 802,934 | 668,273 | 2,315,530 | 1,916,657 | 1,589,451 | 1,320,514 | 1,099,049 |
| Sum | 22,779,400 | 20,758,877 | 18,996,268 | 17,453,347 | 16,098,133 | 28,159,000 | 25,661,309 | 23,482,441 | 21,575,143 | 19,899,880 | 46,310,600 | 42,202,869 | 38,619,479 | 35,482,717 | 32,727,561 |
Appendix 2
Present value of incurred costs when

| Gamesa G47/660 | AWE 52/750 | EWT 52/900 | |||||||||||||
|---|---|---|---|---|---|---|---|---|---|---|---|---|---|---|---|
| Scenario 1 | Scenario 2 | Scenario 1 | Scenario 2 | Scenario 1 | Scenario 2 | ||||||||||
| 0 | 549,364 | 0 | 0 | 0 | 0 | 612,364 | 0 | 0 | 0 | 0 | 717,364 | 0 | 0 | 0 | 0 |
| 1 | 0 | 0 | 31,314 | 10,880 | 7855 | 0 | 0 | 34,905 | 13,449 | 9711 | 0 | 0 | 40,890 | 22,119 | 15,970 |
| 2 | 0 | 0 | 29,748 | 10,336 | 7463 | 0 | 0 | 33,160 | 12,777 | 9225 | 0 | 0 | 38,845 | 21,013 | 15,172 |
| 3 | 0 | 0 | 28,261 | 9819 | 7090 | 0 | 0 | 31,502 | 12,138 | 8764 | 0 | 0 | 36,903 | 19,962 | 14,413 |
| 4 | 0 | 0 | 26,848 | 9328 | 6735 | 0 | 0 | 29,926 | 11,531 | 8326 | 0 | 0 | 35,058 | 18,964 | 13,692 |
| 5 | 0 | 0 | 25,505 | 8862 | 6398 | 0 | 0 | 28,430 | 10,954 | 7909 | 0 | 0 | 33,305 | 18,016 | 13,008 |
| 6 | 0 | 0 | 24,230 | 8419 | 6078 | 0 | 0 | 27,009 | 10,407 | 7514 | 0 | 0 | 31,640 | 17,115 | 12,357 |
| 7 | 0 | 0 | 23,018 | 7998 | 5774 | 0 | 0 | 25,658 | 9886 | 7138 | 0 | 0 | 30,058 | 16,259 | 11,740 |
| 8 | 0 | 0 | 21,868 | 7598 | 5486 | 0 | 0 | 24,375 | 9392 | 6781 | 0 | 0 | 28,555 | 15,446 | 11,153 |
| 9 | 0 | 0 | 20,774 | 7218 | 5211 | 0 | 0 | 23,157 | 8922 | 6442 | 0 | 0 | 27,127 | 14,674 | 10,595 |
| 10 | 0 | 0 | 19,735 | 6857 | 4951 | 0 | 0 | 21,999 | 8476 | 6120 | 0 | 0 | 25,771 | 13,940 | 10,065 |
| 11 | 0 | 3721 | 18,749 | 6514 | 4703 | 0 | 3721 | 20,899 | 8053 | 5814 | 0 | 3721 | 24,482 | 13,243 | 9562 |
| 12 | 0 | 0 | 17,811 | 6188 | 4468 | 0 | 0 | 19,854 | 7650 | 5523 | 0 | 0 | 23,258 | 12,581 | 9084 |
| 13 | 0 | 0 | 16,921 | 5879 | 4245 | 0 | 0 | 18,861 | 7267 | 5247 | 0 | 0 | 22,095 | 11,952 | 8630 |
| 14 | 0 | 0 | 16,075 | 5585 | 4033 | 0 | 0 | 17,918 | 6904 | 4985 | 0 | 0 | 20,990 | 11,354 | 8198 |
| 15 | 0 | 0 | 15,271 | 5306 | 3831 | 0 | 0 | 17,022 | 6559 | 4736 | 0 | 0 | 19,941 | 10,787 | 7788 |
| 16 | 0 | 0 | 14,507 | 5041 | 3639 | 0 | 0 | 16,171 | 6231 | 4499 | 0 | 0 | 18,944 | 10,247 | 7399 |
| 17 | 0 | 0 | 13,782 | 4789 | 3457 | 0 | 0 | 15,363 | 5919 | 4274 | 0 | 0 | 17,997 | 9735 | 7029 |
| 18 | 0 | 0 | 13,093 | 4549 | 3285 | 0 | 0 | 14,594 | 5623 | 4060 | 0 | 0 | 17,097 | 9248 | 6677 |
| 19 | 0 | 0 | 12,438 | 4322 | 3120 | 0 | 0 | 13,865 | 5342 | 3857 | 0 | 0 | 16,242 | 8786 | 6344 |
| 20 | 0 | 0 | 11,816 | 4106 | 2964 | 0 | 0 | 13,171 | 5075 | 3664 | 0 | 0 | 15,430 | 8347 | 6026 |
| Sum | 549,364 | 3620 | 401,764 | 139,591 | 100,788 | 612,364 | 3620 | 447,838 | 172,557 | 124,590 | 549,364 | 3620 | 524,627 | 283,790 | 204,902 |
Appendix 3
Amount of seawater desalinated (m3/year) after using the wind turbines as supply for the under-study desalination system in Anzali considering five values of

| Year | Gamesa G47/660 | AWE 52/750 | EWT 52/900 | ||||||||||||
|---|---|---|---|---|---|---|---|---|---|---|---|---|---|---|---|
|
|
|
|
|
|
|
|
|
|
|
|
|
|
|
|
|
| 1 | 216,404.3 | 216,404.3 | 216,404.3 | 216,404.3 | 216,404.3 | 267,510.5 | 267,510.5 | 267,510.5 | 267,510.5 | 267,510.5 | 439,950.7 | 439,950.7 | 439,950.7 | 439,950.7 | 439,950.7 |
| 2 | 216,404.3 | 214,261.7 | 212,161.1 | 210,101.3 | 208,081.1 | 267,510.5 | 264,861.9 | 262,265.2 | 259,718.9 | 257,221.6 | 439,950.7 | 435,594.8 | 431,324.2 | 427,136.6 | 423,029.5 |
| 3 | 216,404.3 | 212,140.3 | 208,001.1 | 203,981.8 | 200,077.9 | 267,510.5 | 262,239.5 | 257,122.7 | 252,154.3 | 247,328.5 | 439,950.7 | 431,281.9 | 422,866.9 | 414,695.7 | 406,759.2 |
| 4 | 216,404.3 | 210,039.9 | 203,922.6 | 198,040.6 | 192,382.6 | 267,510.5 | 259,643.1 | 252,081.1 | 244,810.0 | 237,815.9 | 439,950.7 | 427,011.8 | 414,575.4 | 402,617.2 | 391,114.6 |
| 5 | 216,404.3 | 207,960.3 | 199,924.1 | 192,272.4 | 184,983.3 | 267,510.5 | 257,072.3 | 247,138.4 | 237,679.6 | 228,669.1 | 439,950.7 | 422,784.0 | 406,446.4 | 390,890.5 | 376,071.7 |
| 6 | 216,404.3 | 205,901.3 | 196,004.1 | 186,672.3 | 177,868.6 | 267,510.5 | 254,527.1 | 242,292.5 | 230,756.9 | 219,874.1 | 439,950.7 | 418,598.0 | 398,476.9 | 379,505.3 | 361,607.4 |
| 7 | 216,404.3 | 203,862.6 | 192,160.8 | 181,235.2 | 171,027.5 | 267,510.5 | 252,007.0 | 237,541.7 | 224,035.8 | 211,417.4 | 439,950.7 | 414,453.5 | 390,663.6 | 368,451.8 | 347,699.4 |
| 8 | 216,404.3 | 201,844.2 | 188,392.9 | 175,956.5 | 164,449.5 | 267,510.5 | 249,511.9 | 232,884.0 | 217,510.5 | 203,286.0 | 439,950.7 | 410,350.0 | 383,003.6 | 357,720.2 | 334,326.4 |
| 9 | 216,404.3 | 199,845.7 | 184,698.9 | 170,831.6 | 158,124.5 | 267,510.5 | 247,041.5 | 228,317.6 | 211,175.3 | 195,467.3 | 439,950.7 | 406,287.1 | 375,493.7 | 347,301.1 | 321,467.7 |
| 10 | 216,404.3 | 197,867.0 | 181,077.4 | 165,855.9 | 152,042.8 | 267,510.5 | 244,595.5 | 223,840.8 | 205,024.5 | 187,949.3 | 439,950.7 | 402,264.4 | 368,131.1 | 337,185.6 | 309,103.5 |
| 11 | 216,404.3 | 195,907.9 | 177,526.9 | 161,025.1 | 146,194.9 | 267,510.5 | 242,173.8 | 219,451.8 | 199,052.9 | 180,720.5 | 439,950.7 | 398,281.6 | 360,912.8 | 327,364.6 | 297,214.9 |
| 12 | 216,404.3 | 193,968.3 | 174,045.9 | 156,335.1 | 140,572.1 | 267,510.5 | 239,776.0 | 215,148.8 | 193,255.3 | 173,769.7 | 439,950.7 | 394,338.2 | 353,836.1 | 317,829.7 | 285,783.6 |
| 13 | 216,404.3 | 192,047.8 | 170,633.3 | 151,781.6 | 135,165.5 | 267,510.5 | 237,402.0 | 210,930.2 | 187,626.5 | 167,086.3 | 439,950.7 | 390,433.9 | 346,898.1 | 308,572.6 | 274,791.9 |
| 14 | 216,404.3 | 190,146.4 | 167,287.6 | 147,360.8 | 129,966.8 | 267,510.5 | 235,051.5 | 206,794.3 | 182,161.6 | 160,659.9 | 439,950.7 | 386,568.2 | 340,096.2 | 299,585.0 | 264,223.0 |
| 15 | 216,404.3 | 188,263.7 | 164,007.4 | 143,068.7 | 124,968.1 | 267,510.5 | 232,724.2 | 202,739.5 | 176,856.0 | 154,480.6 | 439,950.7 | 382,740.8 | 333,427.6 | 290,859.2 | 254,060.6 |
| 16 | 216,404.3 | 186,399.7 | 160,791.6 | 138,901.7 | 120,161.6 | 267,510.5 | 230,420.0 | 198,764.2 | 171,704.8 | 148,539.1 | 439,950.7 | 378,951.3 | 326,889.9 | 282,387.6 | 244,289.0 |
| 17 | 216,404.3 | 184,554.2 | 157,638.8 | 134,856.0 | 115,540.0 | 267,510.5 | 228,138.6 | 194,866.9 | 166,703.7 | 142,826.0 | 439,950.7 | 375,199.3 | 320,480.2 | 274,162.7 | 234,893.3 |
| 18 | 216,404.3 | 182,726.9 | 154,547.8 | 130,928.2 | 111,096.2 | 267,510.5 | 225,879.8 | 191,046.0 | 161,848.3 | 137,332.7 | 439,950.7 | 371,484.5 | 314,196.3 | 266,177.4 | 225,858.9 |
| 19 | 216,404.3 | 180,917.7 | 151,517.5 | 127,114.7 | 106,823.3 | 267,510.5 | 223,643.4 | 187,300.0 | 157,134.2 | 132,050.7 | 439,950.7 | 367,806.4 | 308,035.6 | 258,424.7 | 217,172.0 |
| 20 | 216,404.3 | 179,126.5 | 148,546.6 | 123,412.3 | 102,714.7 | 267,510.5 | 221,429.1 | 183,627.4 | 152,557.5 | 126,971.8 | 439,950.7 | 364,164.8 | 301,995.7 | 250,897.7 | 208,819.3 |
| Sum | 4,328,086 | 3,944,186.6 | 3,609,290.9 | 3,316,136.1 | 3,058,645.2 | 5,350,210.0 | 4,875,648.6 | 4,461,663.7 | 4,099,277.2 | 3,780,977.2 | 8,799,014.0 | 8,018,545.2 | 7,337,701.0 | 6,741,716.1 | 6,218,236.5 |
Appendix 4
Hydrogen generation (ton/year) using the wind turbines as supply for the under-study water electrolysis system in Anzali considering five values of
| Year | Gamesa G47/660 | AWE 52/750 | EWT 52/900 | ||||||||||||
|---|---|---|---|---|---|---|---|---|---|---|---|---|---|---|---|
|
|
|
|
|
|
|
|
|
|
|
|
|
|
|
|
|
| 1 | 17.695 | 17.695 | 17.695 | 17.695 | 17.695 | 21.873 | 21.873 | 21.873 | 21.873 | 21.873 | 35.973 | 35.973 | 35.973 | 35.973 | 35.973 |
| 2 | 17.695 | 17.519 | 17.348 | 17.179 | 17.014 | 21.873 | 21.657 | 21.444 | 21.236 | 21.032 | 35.973 | 35.617 | 35.268 | 34.925 | 34.589 |
| 3 | 17.695 | 17.346 | 17.007 | 16.679 | 16.360 | 21.873 | 21.442 | 21.024 | 20.618 | 20.223 | 35.973 | 35.264 | 34.576 | 33.908 | 33.259 |
| 4 | 17.695 | 17.174 | 16.674 | 16.193 | 15.730 | 21.873 | 21.230 | 20.612 | 20.017 | 19.445 | 35.973 | 34.915 | 33.898 | 32.920 | 31.980 |
| 5 | 17.695 | 17.004 | 16.347 | 15.721 | 15.125 | 21.873 | 21.020 | 20.208 | 19.434 | 18.697 | 35.973 | 34.569 | 33.234 | 31.962 | 30.750 |
| 6 | 17.695 | 16.836 | 16.026 | 15.263 | 14.544 | 21.873 | 20.812 | 19.811 | 18.868 | 17.978 | 35.973 | 34.227 | 32.582 | 31.031 | 29.567 |
| 7 | 17.695 | 16.669 | 15.712 | 14.819 | 13.984 | 21.873 | 20.606 | 19.423 | 18.319 | 17.287 | 35.973 | 33.888 | 31.943 | 30.127 | 28.430 |
| Sum | 123.862 | 120.243 | 116.809 | 113.549 | 110.452 | 153.113 | 148.640 | 144.395 | 140.365 | 136.536 | 251.812 | 244.454 | 237.474 | 230.846 | 224.549 |
Appendix 5
Before estimating the time required to reach profitability via selling wind electricity,
Appendix 6
To guess PBP of investing on hydrogen generation using the proposed system, the values of
Declaration of conflicting interests
The author(s) declared no potential conflicts of interest with respect to the research, authorship, and/or publication of this article.
Funding
The author(s) received no financial support for the research, authorship, and/or publication of this article.
