




Abstract
High Wind Speed Shutdown (HWSS) events pose a significant threat to power system security for grids with a high penetration of wind energy. To date, however, the forecasting of wind speed events has received limited attention in literature. This study proposes a hybrid WRF-ANN forecasting model to address the research objective of modelling wind speed events at turbine level, using meso-scale wind speed forecasts as inputs. A multi-model WRF ensemble model is used for the short-term meso-scale wind speed forecasts, whereas the ANN model uses the forecast as the input in order to predict the wind speed events for individual turbines. The performance of the model is evaluated for wind speed events which are derived using two wind speed thresholds for a large utility-scale wind farm. All significant events are accurately predicted by the model with few false alarms.
Keywords
Introduction
The expeditious uptake of renewable generation has transformed the standard operational practices of power system operators. The increase in the variability of the constituent generation portfolio for grids with a high penetration of renewables has necessitated the investment in more flexible generation sources to mitigate the inherent risk to the security of supply (Kabouris and Kanellos, 2010). These rapid response services are employed to maintain frequency stability during large power ramps. The investment in flexible plant, however, is acquired at a high upfront investment and operational cost.
In the context of frequency stability, High Wind Speed Shutdown (HWSS) represents a high-risk scenario as large, rapid power swings are possible when multiple turbines shut down within quick succession (Coughlan et al., 2012; Detlefsen et al., 2011; MacDonald et al, 2014). HWSS is a protection feature employed on most wind turbines, which results in the sudden curtailment of generation when turbines are exposed to high wind speeds (Coughlan et al., 2012). Case studies indicate that large power swings can occur due to HWSS occurrences within short durations. Cutululis et al. (2013), for example, reported that 1500 MW is at risk within a time frame of 30 minutes for the worst-case scenario for the Danish power system. MacDonald et al. (2014) analysed the operational data from two wind farms situated approximately 180 km apart from one another. Complete shutdown of the windfarms occurred, on average, approximately 5% to 10% of the time when HWSS events occurred. The fastest disconnection time observed in the study period of 3 years and 5 months for an entire wind farm was approximately 6 minutes. These findings demonstrate that HWSS can present significant operational challenges to the system operator which will increase with an increasing penetration of wind energy.
The application of dedicated, event-based models for the forecasting of power ramp events has increased with the ubiquitous expansion of renewable generation (Bossavy et al., 2013; Taylor, 2017). The utilisation of event-based forecasting models has, furthermore, shown tangible benefits as a supplementary forecasting model (Potter et al., 2009). Traditional forecasting techniques employ metrics that are designed to reduce errors over long periods of time in order to minimise the total forecast error. Event-based models, however, are devised to predict irregular occurrences with improved accuracy. The application of dedicated, event-based models is of primary interest for a more cogent, risk-averse approach to scheduling and dispatch, as well as the cost-effective utilisation of rapid-response services. Despite the recent interest in event-based modelling, the application of forecasting models for HWSS events has not received any attention in literature. A number of authors have noted the potential impact of large-scale HWSS events, as well as the importance of forecasting these events (Cutululis et al., 2013; Detlefsen et al., 2011; MacDonald et al., 2014; National Grid, 2013). To date, however, all studies of the HWSS phenomenon have been empirical, and no dedicated forecasting model has been developed for HWSS events. Event-based forecasting models have been extensively applied for the forecasting of ramp events (Ferreira et al., 2011; Florita et al, 2013). Although ramp forecasting and HWSS forecasting models could potentially have similar architectures, their formulations depart at the specification of the objective function. The event-based ramp forecasting models are constructed to predict the magnitude and direction of ramp events. In this instance the metrics of importance are the direction, the magnitude of the ramp, the ramp start time and the duration of the ramp. For a dedicated HWSS event forecasting model, only the number of turbines in HWSS mode is of interest if each time step is considered as a discrete event. This translates directly to a figure for the loss of the associated generation.
Forecasting techniques can be sub-divided into three categories, namely physical, statistical and hybrid techniques (Giebel et al., 2011). In physical forecasting methods, numerical equations are utilised to resolve the atmospheric state. Statistical methods are data-driven approaches that compute the complex relationships between predictors and predictands. Hybrid techniques adopt multiple facets of either the physical or statistical classes, or both of these classes. Physical forecasting models generally yield superior performance beyond a 3 to 6 hour forecasting horizon (Giebel et al., 2011). As a result, short-term wind speed forecasting models typically utilise Numerical Weather Prediction (NWP) models, which operate at the meso-scale level. HWSS events, however, occur at the micro-scale, or turbine, level. Accurate forecasting of HWSS events is therefore complicated in practice due to the complex nature of the related meteorological processes, and the need to downscale the associated meso-scale forecasts (Carlini et al., 2016).
It is standard practice to utilise a downscaling technique to improve the accuracy of NWP forecasting models. This is particularly true for wind farms situated in complex terrain, where increased horizontal resolution is required to resolve the local topography (Castellani et al., 2014, 2016). Numerous downscaling techniques have been proposed in literature. These techniques are categorised into physical, statistical and hybrid models. The physical models include dynamical downscaling (Heikkila et al., 2011), as well as Computational Fluid Dynamics (CFD) models (Bilal et al., 2016; Yue et al., 2016). The practicality of dynamical downscaling for wind power forecasting applications is limited due to intensive computational expense, as well as by the parameterisations which are implemented to model sub-grid scale processes (Carlini et al., 2016). CFD models present similar challenges due to their associated computational expense, and have demonstrated poor performance in resolving local wind flow conditions for sites with complex terrain (Castellani et al., 2016). Simplified CFD models have been proposed that utilise the concept of pre-calculated flow fields to reduce the associated computational expense (Li et al., 2013).
The utilisation of statistical post-processing tools to improve the accuracy of numerical forecasts is known as Model Output Statistics (MOS). Historically, MOS procedures have been employed to correct for systematic errors in numerical forecasts using historical forecasts and measured data. Statistical models are effectively transfer functions that map wind speed forecasts from meso- to micro-scale. Statistical models comprise Artificial Neural Networks (ANN) (Li et al., 2001), random forests (Alonzo et al., 2018), Bayesian models (Fasbender and Ouarda, 2010), among others. The application of ANN models for downscaling wind speed forecasts for wind farm applications is popular in literature. Salcedo-Sanz et al. (2009) utilised an ANN model to downscale an hourly wind speed NWP forecast to predict the wind speed for each of the 33 turbines in a wind farm. A Mean Absolute Error (MAE) of 1.45 to 2.2 ms−1 is achieved over a test period of 6 months for the model, with a 48 hour forecast horizon. Castellani et al. (2016) compared an ANN downscaling model to a hybrid ANN-CFD downscaling model where both models utilised the same NWP input. Both techniques returned similar results for individual power forecasts over a study period of 7 months for 24 turbines at a wind farm. The authors note that the performance of the ANN downscaling model will likely improve with a larger training set. In an extension of this study, Mana et al. (2017) reported similar performance for an ANN-CFD and an ANN downscaling model. The CFD model’s ability to encode wind flow acceleration resulted in a superior representation of wind power variation for the ANN-CFD model. Both authors note that the ANN-CFD model exhibited superior performance compared to an ANN model for the same application at low and high power generation levels, while the ANN model demonstrated superior performance at mid-range power levels. The supervised learning approach of the ANN model, however, renders it capable of forecasting HWSS events. This observation was inferred by the authors from the decrease in wind farm power at high wind speeds.
Ensemble forecasting models entail the utilisation of multiple NWP forecasting models. The performance of ensemble forecasts has been shown to be superior to that of any individual forecasting model (Landberg et al., 2003). Ensemble models are generated by perturbing the initial and boundary conditions, staggering the model initialisation time, varying the parameterisation options, varying the grid lengths or by using different input and boundary conditions (Deppe et al., 2013). Siuta et al. (2017) investigated the wind forecast sensitivity of the Weather Research and Forecasting (WRF) model with various permutations of the Planetary Boundary Layer (PBL) representation, the grid length and the initial conditions for wind farm applications. The results of this study show that the forecast accuracy is most impacted by the variation of the PBL, as well as the grid length. The synthesis of multi-model ensemble forecasts has been investigated using fuzzy systems (Zhao et al., 2016), random forests (Abuella and Chowdhury, 2017), and Bayesian model averaging (Eide and Bremnes, 2017), among others. In a related work, an ANN ensemble synthesis model with various meteorological parameters was implemented for the same wind farm targeted in this investigation (Groch and Vermeulen, 2019b). The ANN model showed substantial improvement over the benchmark average with a skill score of the order of 10%. Furthermore, it was demonstrated that the inclusion of temperature and wind direction resulted in improved performance of the downscaling model.
Evaluation of the available literature demonstrates a clear need to develop a suitable forecasting model for HWSS events. An effective forecasting model will aid in the mitigation of the risk to the security of supply, and will reduce the associated cost of the balancing operations for grids with a high penetration of wind generation. From the appraisal of effective modern forecasting practices for wind farm applications, it is postulated that a hybrid ensemble model would potentially yield the best forecasting results. The WRF model is the most popular NWP model for forecasting applications, and it is therefore utilised to generate the ensemble wind speed forecasts. An ANN model is selected owing to its popularity for wind speed downscaling of WRF forecasts, and its demonstrated effectiveness for ensemble synthesis. The application of the ANN model in this investigation deviates from the norm in the sense that the output of the ANN model is the quantification of the number of turbines in high wind speed event mode, rather than wind speed or aggregated wind power.
The main contribution of this work is the development and evaluation of a forecasting model for high wind speed events. This topic has received very limited attention in literature. The model presented in this contribution represents a significant advancement on previous work on the forecasting of HWSS events (Groch and Vermeulen, 2019a), and reflects a number of improvements. The number of NWP ensemble members that are used to derive the wind speed forecasts are increased. False alarms and missed events of the wind speed event forecasts are, furthermore, incorporated into the analysis. The literature review discussion of the results and comments for future research has been expanded. Moreover, the utilisation of an asymmetrical loss function to improve short-term NWP forecasts for high wind speeds is a novel application.
The remainder of this manuscript is organised as follows. Section 2 describes the methodology. Sections 3 and 4 detail the WRF Model and the ANN model used for high wind speed event prediction respectively. The wind speed event model is described in Section 5, and the performance evaluation and case study results are given in Section 6. The conclusions and future work are discussed in Section 7.
Modelling methodology
Overview
A hybrid WRF-ANN model is proposed for the forecasting of HWSS events. The architecture of this model is shown in Figure 1. Multiple WRF models are utilised to generate an ensemble of short-term meso-scale wind speed forecasts for the wind farm. An ANN model is utilised to translate the meso-scale ensemble of wind speed forecasts into a number of turbines in wind speed event mode.

Hybrid WRF-ANN ensemble model proposed for the forecasting of wind speed events.
Dataset and mathematical framework
The temporospatial dataset for the targeted site includes measured turbine nacelle wind speeds, wind direction measurements from on-site meteorological masts, and numerical wind speed forecasts. The set of sampling intervals,

where
The set of measured nacelle wind speeds,

where

where

where
Weather research and forecasting model
Overview
The short-term forecasting is undertaken with the Advanced Research WRF (ARW) core, version 3.9.1 (University Corporation for Atmospheric Research (UCAR), 2019b). WRF is a non-hydrostatic, meso-scale model which is commonly used in operational forecasting. The WRF model downscales global NWP models such as the European Centre for Medium-Range Weather Forecasts (ECMWF) and the Global Forecasting System (GFS). This is achieved through numerical approximation of the equations which govern atmospheric flow (National Center for Atmospheric Research (NCAR), 2017).
Model configuration
Figure 2 displays the multi-model WRF ensemble model for the proposed WRF-ANN forecasting model. The WRF ensemble model generates a diverse set of meteorological representations for the target site. This is accomplished by varying the PBL scheme for three of the four WRF models, and the remaining physics parameterisations are altered for the fourth. The acronyms MYJ1, MYJ2, ACM2 and YSU designate the different NWP model formulations. The associated parameterisation selections of the individual WRF models are summarised in Table A1 in Appendix A. Three PBL schemes are selected, namely the Asymmetric Convective Model version 2 (ACM2) scheme, the Mellor-Yamada-Janjic (MYJ) scheme and the Yonsei University (YSU) scheme.

Generation of WRF ensemble members using various parameterisation sets and grid domains.
Two input datasets are required for the WRF model initialisation. The requisite initial and boundary conditions are satisfied by the GFS model with a resolution of 0.5° (National Centres for Environmental Information, 2019). The selected GFS model forecasts are initialised at 00H00 UTC, for a daily cold-start forecast, with a forecasting horizon of 24 hours, and a sampling interval of 10 minutes. The static terrestrial data input denotes the geographical dataset which comprises topography height, land-use categories, soil type, vegetation fraction etc. (University Corporation for Atmospheric Research (UCAR), 2019a).
The WRF integration area is bounded by three unidirectional, nested domains, each with 100 × 100 points, centred on the location of the targeted wind farm. The three nested domains, D1, D2 and D3 are set to 3 km, 9 km and 27 km respectively.
The vertical discretisation is based on the meso-scale modelling in the Wind Atlas of South Africa (WASA) project (Hahmann et al., 2015). Four of the 41 mass-based terrain-following vertical coordinates are specified within 100 m above ground level, namely 14 m, 43 m, 72 m and 100 m, to improve the representation of the near-surface wind speeds.
The WRF Single-Moment (WSM) 5-class scheme, Rapid Radiation Transfer Model (RRTM), and Duhia scheme are selected for the microphysics, long wave and short-wave radiation schemes respectively. The Monin-Obukhov, and Pleim-Xiu models are utilised for the surface layer representation. The Kain-Fritsch scheme is chosen for the cumulus parameterisation for the two outermost domains, with no cumulus scheme specified for the inner domain.
Wind speed, wind direction, temperature and pressure are extracted from the WRF ensemble model for each of the defined domains. A total of twelve outputs is therefore generated by the WRF ensemble forecast for each of these meteorological variables.
Performance assessment metrics for the wind speed forecasts
Wind speed forecasting errors are determined as follows:

where

The MAE is derived by averaging the individual forecasting errors for all samples,
Wind speed event model
Overview
HWSS events occur when a turbine is exposed to a wind speed in excess of its cut-out speed. The typical cut-out speed for turbines at utility-scale wind farms is of the order of 22 ms−1 (MacDonald et al., 2014). Wind speeds above 22 ms−1 are, however, infrequent for the wind farm site used in this investigation. This presents a challenge for the implementation of supervised learning techniques, as well as for the performance evaluation, due to the sparse occurrences of these events. The proposed model is therefore evaluated for events which are derived using lower wind speed thresholds in order to extract more frequent events. The resulting wind speed events are analogous to high wind speed events at the target site, and are useful to assess the methodology for the quantification of HWSS events.
Definition of wind speed events
Figure 3 depicts a conceptual representation of wind speed events which are derived using the wind speed event model. A wind speed event is characterised by the number of turbines exceeding a wind speed threshold, as well as by a start and end time. The start and end times are given by


Conceptual representation of wind speed events derived using the wind speed event model.
and

where
Wind speed events are extracted for two wind speed thresholds and are analysed in separate case studies. The wind speed thresholds are selected as 12 and 17 ms−1 to represent a frequent, mid-range wind speed and an infrequent high wind speed condition respectively. Approximately 0.4% of the measured nacelle wind speeds exceed the infrequent wind speed threshold of 17 ms−1. Kay et al. (2009) reported a higher percentage of true HWSS event occurrences in a survey for multiple wind farm sites. The wind speed threshold for infrequent events is therefore analogous to HWSS events in the sense that the extracted wind speed events display a similar incidence rate.
The number of turbines in wind speed event mode,

where
Artificial neural network model for wind speed event prediction
Overview
The ANN model is utilised to predict the wind speed events by using the forecast from the WRF ensemble model as the input, and the derived wind speed events as the supervised target. Two case studies are considered for two different wind speed event definitions. These definitions, as described in the previous section, utilise the wind speed event model with wind speed thresholds of 12 and 17 ms−1 to derive frequent and infrequent wind speed events respectively.
Model architecture
Figure 4 depicts the flow diagram of the proposed ANN wind speed event model. An ANN model is trained to translate an input parameter set containing the forecasted meteorological variables into a number of turbines in wind speed event mode,

Flow diagram depicting the training and forecasting approach for determining the number of turbines in wind speed event mode using an ANN model.
The optimal ANN model configuration was determined using a combination of domain knowledge and model optimisation. Due to the small dataset, 1 month was utilised to tune the model hyper parameters with 30% comprising the validation set. A grid search algorithm was employed to determine the optimal number of hidden layers, as well as the number of neurons in each layer. The optimised ANN model contains three hidden layers with 20, 80 and 150 neurons, each of which utilises a rectified linear unit activation function. A linear activation function is applied to the input layer, with the number of neurons dependent on the input parameter set. The output layer comprises a singular neuron with a linear activation function to return the forecast for the number of turbines in wind speed event mode,
Once the model is optimised, a forecast is generated for the number of turbines in wind speed event mode using out of sample data.
Assessing the skill of the wind speed event forecasts
Contingency tables are generally used to assess the skill of forecasting models through inspection of the resulting hits, misses, correct negatives and false alarms (Boneh et al., 2007). This approach is effective for categorical events, however, the assessment of forecasts for continuous variables requires a different approach.
The following metrics are introduced for this application:
The percentage error,
The percentage error,
The defined metrics are given by

and

where
Figure 5 shows a conceptual illustration of the forecasting errors for a large number of events in accordance with the defined metrics. The forecasting error extends from

Illustration of the forecasting error for all events.
The number of false alarms and missed events are defined by the relationships

and

where
Performance evaluation and case study results
Overview
The performance of the proposed model is evaluated in this section using the metrics derived in (10) and (11). Results are presented for three cases of the considered input parameters. In the first case, the mean wind speed is utilised as an input parameter to the ANN model to assess the model’s forecasting ability to translate a meso-scale wind speed to a number of turbines in wind speed event mode. This assessment, furthermore, serves as a baseline for the performance appraisal of the forecasts. The results of two formulations of the model with different input parameter sets are subsequently presented for the short-term forecasting of frequent, that is, greater than 12 ms−1, and infrequent wind speed events, that is, greater than 17 ms−1.
Wind resource dataset
The wind resource dataset used to evaluate the proposed model is acquired from a utility-scale wind farm which is of the order of 100 MW. The wind farm is situated in an area with moderate topographical complexity and a typical Mediterranean climate. The wind resource dataset consists of turbine nacelle wind speed measurements, as well as wind direction measurements from an on-site meteorological mast. These measurements are available for the period from 1 January 2017 to 31 July 2017 with a sample resolution of 10 minutes. It is acknowledged that the results could potentially be influenced by seasonal bias. Given the dataset available for this investigation, the analysis of biases is not possible. This requires further investigation with a larger dataset.
Figure 6 shows the probability density distribution of the measured mean wind speed, as well as the wind rose for the wind resource dataset. The probability density of the mean wind speed indicates that the wind farm is a low wind speed site. A maximum mean wind speed of 21.6 ms−1 is recorded at the site. The wind direction at the site is predominantly south-south westerly.

Probability density distribution of the mean wind speed and wind rose for the wind farm targeted in the investigation.
Evaluation of the ensemble wind speed forecasts
Figure 7 shows standard boxplots of the MAEs for the WRF ensemble forecast versus the measured mean wind speed for each month of the study period for the test site. The results show that the WRF ensemble produces good forecasts for each of the months considered in the investigation. It must be noted, however, that these results represent a generalised error which does not distinguish between low and high wind speeds.
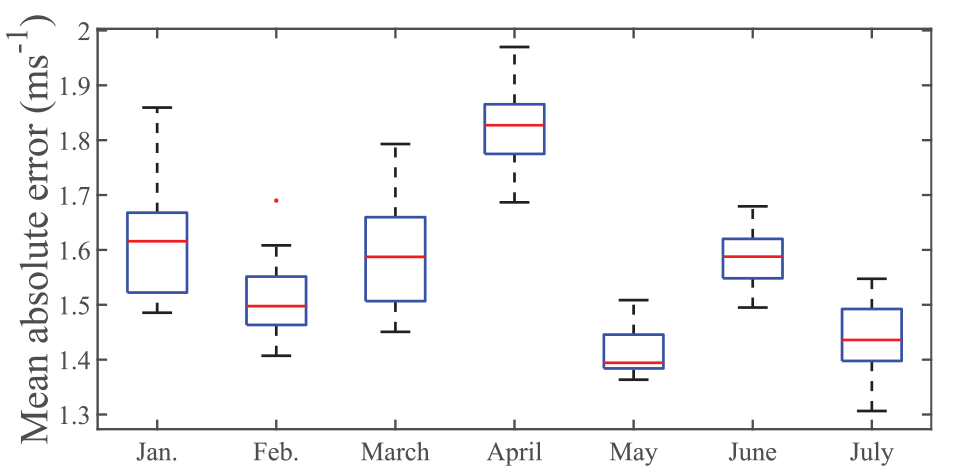
Boxplots of the mean absolute error of the ensemble forecast versus the measured mean wind speed for the targeted windfarm for each month of the study period for the test site.
Figure 8 displays the MAE for the wind speed forecasts for all of the WRF ensemble members versus the mean wind speed at the wind farm. The increase in MAE with increasing wind speed has implications for the forecasting of events which occur at high wind speeds. It is evident that the ensemble members offer varying levels of performance across the range of wind speeds. Member 3, for example, yields close to the poorest forecast at 17 ms−1, and close to the best forecast at 22 ms−1.

Mean absolute error of the wind speed forecasts for the individual ensemble members versus the measured mean wind speed for the test site.
Figure 9 shows the probability density distributions of the WRF wind direction forecast, and the wind direction measured by the meteorological mast at the wind farm. Overall, the results show that the wind direction predicted by the WRF model is in good agreement with the wind direction measured by the on-site meteorological mast.
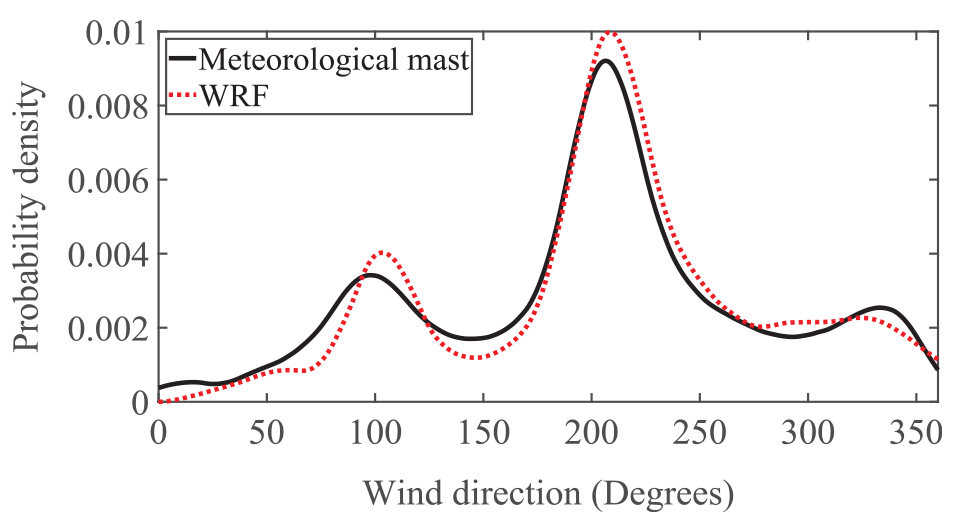
Comparison of the probability density distributions of the forecasted and measured and wind direction for the test site.
Evaluating the ANN model for wind speed event prediction
The proposed model’s ability to predict the number of turbines exceeding a wind speed threshold is assessed using the mean wind farm wind speed as the input parameter to the ANN model. Heatmaps are utilised to analyse the forecasting errors for the metrics defined in (10) and (11).
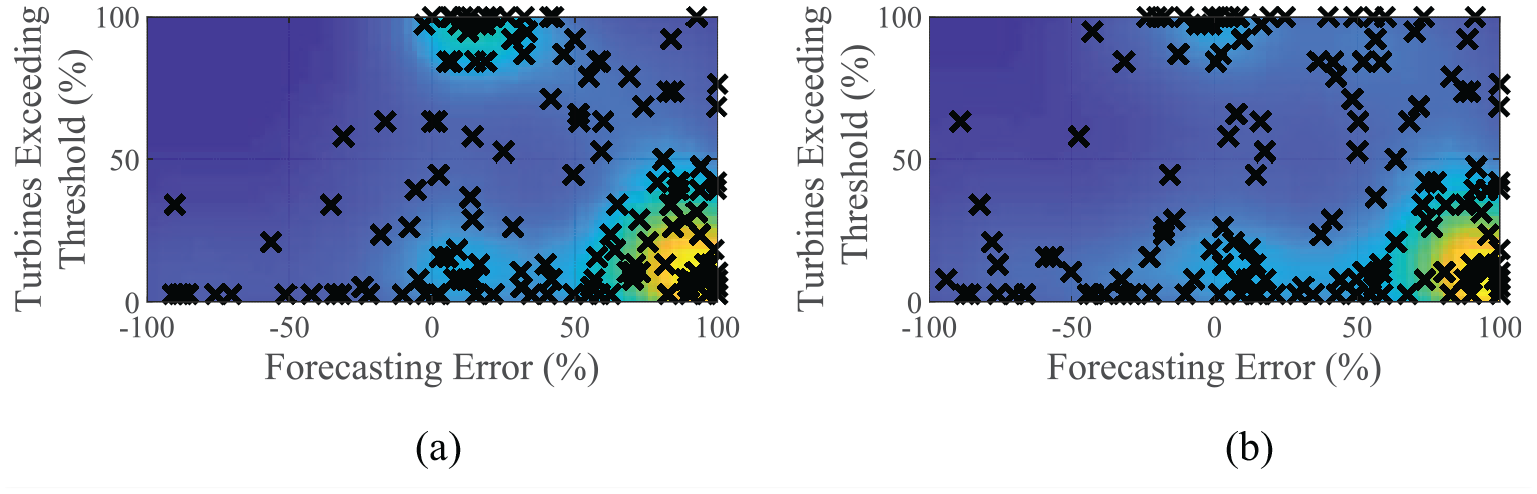
Figure 10 shows the forecasting error for frequent and infrequent events. This error is expressed as a function of the maximum measured percentage of turbines at the wind farm which are exceeding the wind speed threshold. This is a measure of the significance of a wind speed event. The forecasting error and the corresponding percentage of turbines exceeding the wind speed threshold is recorded with an x for each event, and is overlaid on a heatmap that expresses the density of events. The results demonstrate that the proposed model’s accuracy increases with an increase in the significance of wind speed events. Small, insignificant events, where less than a maximum of 20% of the turbines are exceeding the wind speed threshold are predominantly between 50% and 100% under-predicted by the model. From the results, it is clear that the model is more adept at predicting the maximum number of turbines exceeding the wind speed threshold for both frequent and infrequent events.
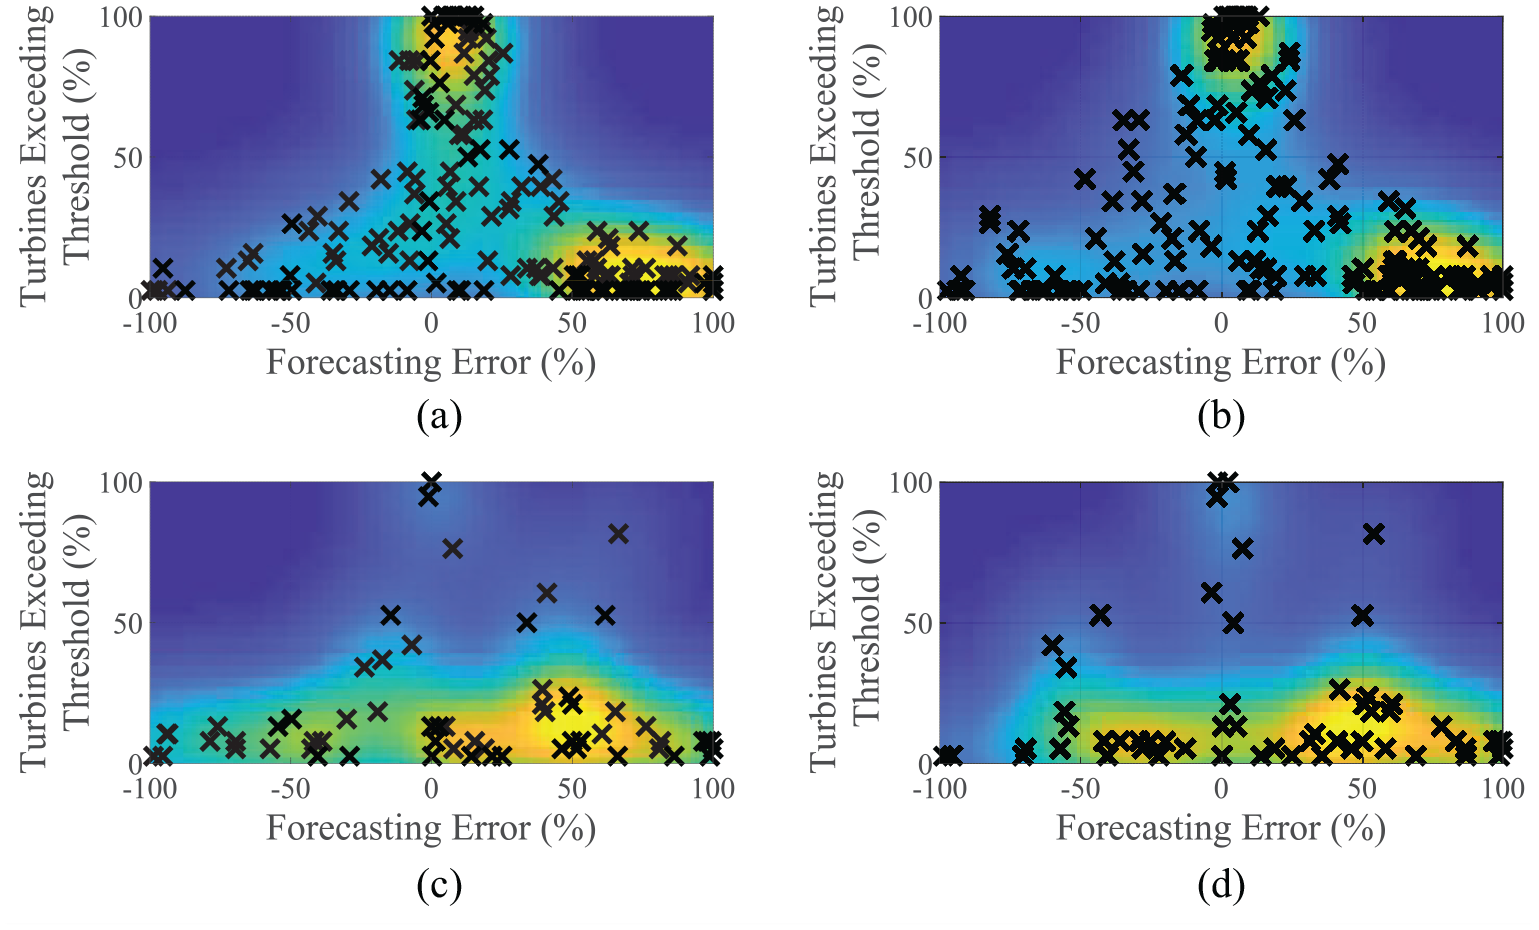
Wind speed event forecasting error expressed as a function of the maximum measured percentage of turbines which are exceeding the wind speed threshold. Results are presented for the metrics: (a)
Figure 11 displays the number of false alarms predicted by the model versus the percentage of wind turbines exceeding the wind speed threshold. The results show that false alarms are only produced for insignificant events, where fewer than 10% of the turbines are exceeding the wind speed threshold.
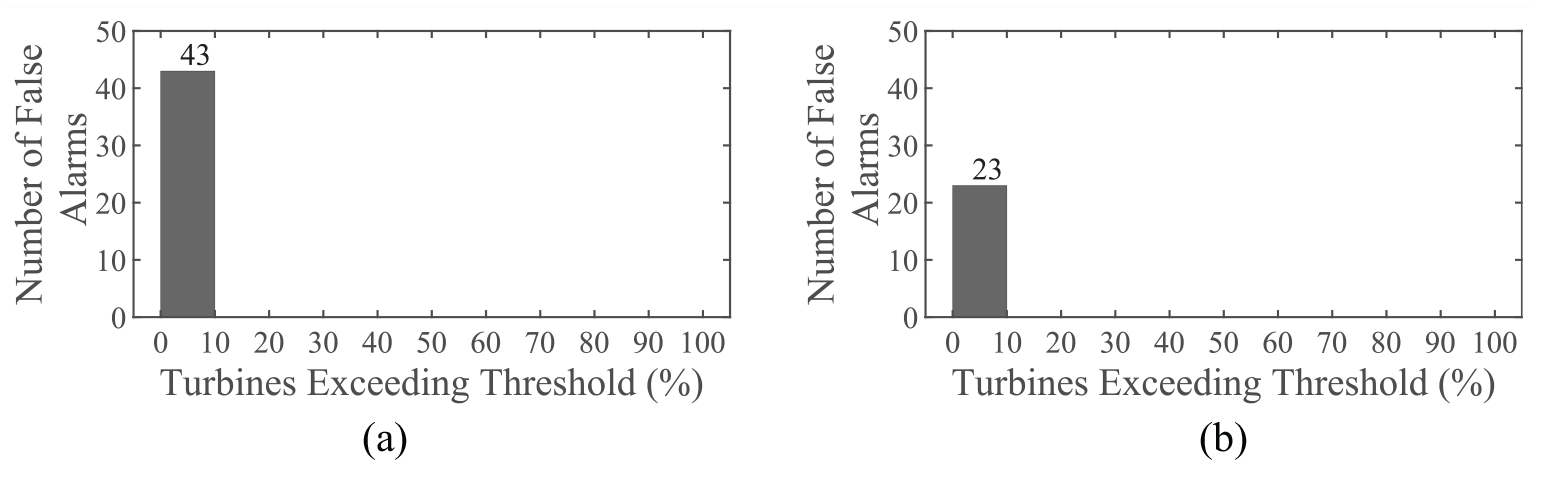
Number of false alarms predicted by the model versus the percentage of wind turbines exceeding the wind speed threshold for: (a) frequent events and (b) infrequent events.
Figure 12 presents the results for the number of missed events, as well as the total number of events, versus the percentage of wind turbines exceeding the wind speed threshold. Missed events are only recorded for insignificant events, where fewer 10% of the wind turbines are exceeding the wind speed threshold.
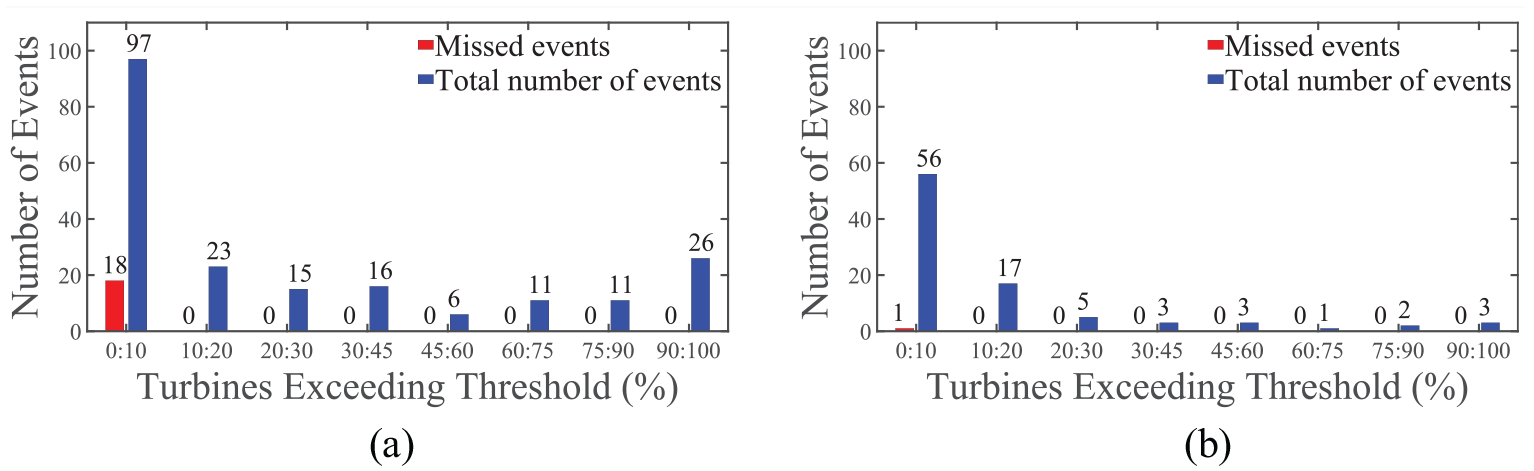
Number of missed events, as well as the total number of events, versus the percentage of wind turbines exceeding the wind speed threshold for: (a) frequent events and (b) infrequent events.
The results show that the proposed model is capable of predicting the number of turbines in wind speed event mode for frequent and infrequent events. It is further evident that the model is more suited to the prediction of significant events. The input parameter set is amended to assess the forecasting capability of the proposed model in the next section.
Forecasting frequent wind speed events
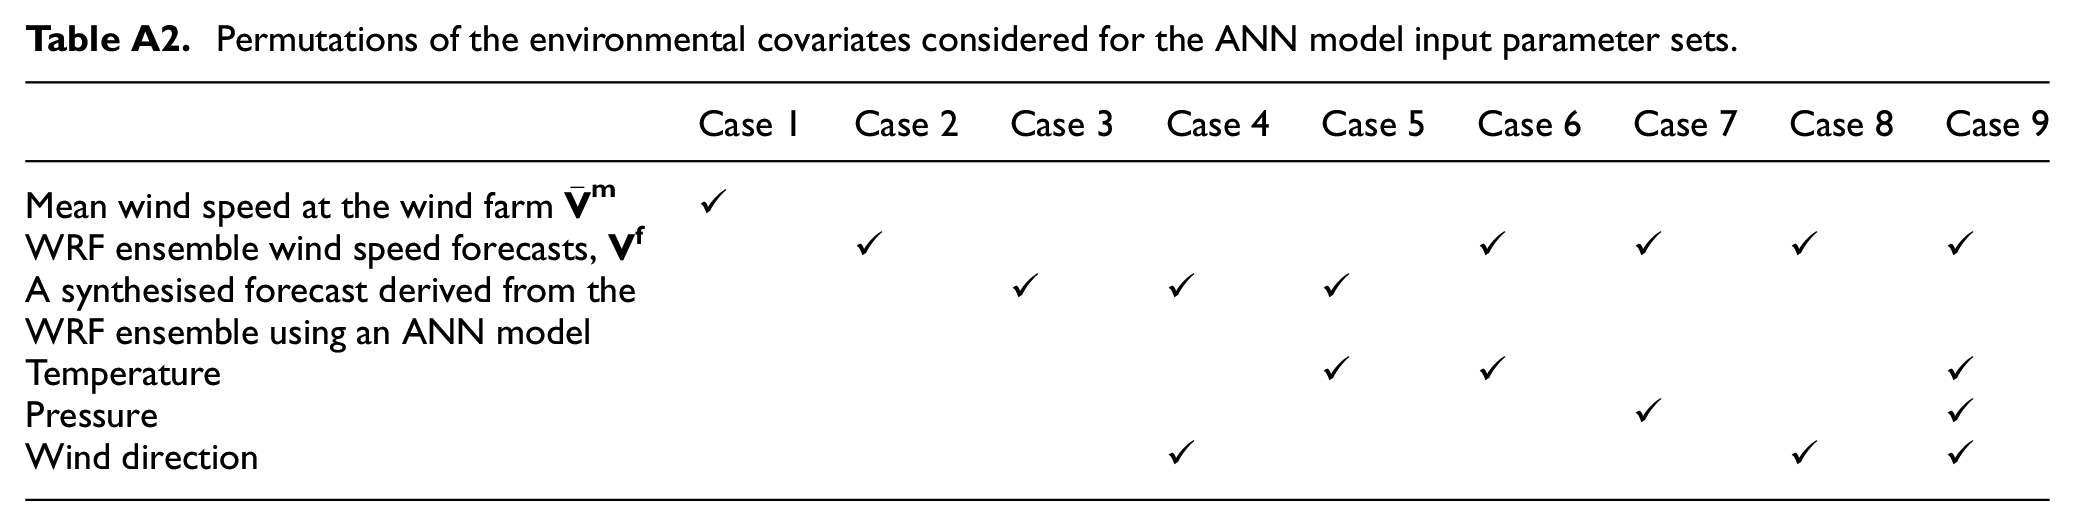
This section presents the results for the performance of the proposed model when used to forecast wind speed events with a wind speed threshold of 12 ms−1. The input parameter sets listed in Table A2 in Appendix A are considered with the view to identify the model architecture with the most forecasting skill. The cold-start WRF ensemble forecast, coupled with the wind direction forecast, that is, case 8, yields the best performance of all considered permutations. Only the results for this case are presented.
Figure 13 displays the wind speed event forecasting error for frequent events using the metrics
The model’s forecasting skill increases with an increasing percentage of turbines exceeding the wind speed threshold, that is, with increasing event significance.
The forecasting error is larger for insignificant events, where less than 30% of the wind turbines are exceeding the wind speed threshold, for both metrics with a forecasting error ranging between 60% and 100%.
The model tends to under-predict wind speed events for both metrics.
The proposed model returns a superior forecast for the metric denoted by
Wind speed event forecasting error expressed as a function of the maximum measured percentage of turbines which are exceeding the wind speed threshold of 12 m s−1. Results are presented for the metrics: (a)
Figure 14 displays the number of false alarms predicted by the model, as well as the number of missed events, along with the total number of events, versus the percentage of wind turbines exceeding the wind speed threshold. False alarms are only predicted for insignificant events where fewer than 10% of the wind turbines are exceeding the wind speed threshold. There is a slight increase in false alarms from the baseline model which uses the mean wind speed as an input parameter. The occurrence of false alarms for insignificant events is expected due to the variability of the wind resource, and the complexity of the forecast. Figure 14(b) shows that the majority of the events are predicted by the model, with only 25 missed events from a total of 205 measured wind speed events. Of the 25 missed events, 24 are insignificant events, with fewer than 20% of the wind turbines exceeding the wind speed threshold. Only one significant event, where between 75% and 90% of the turbines are in wind speed event mode, has not been detected.
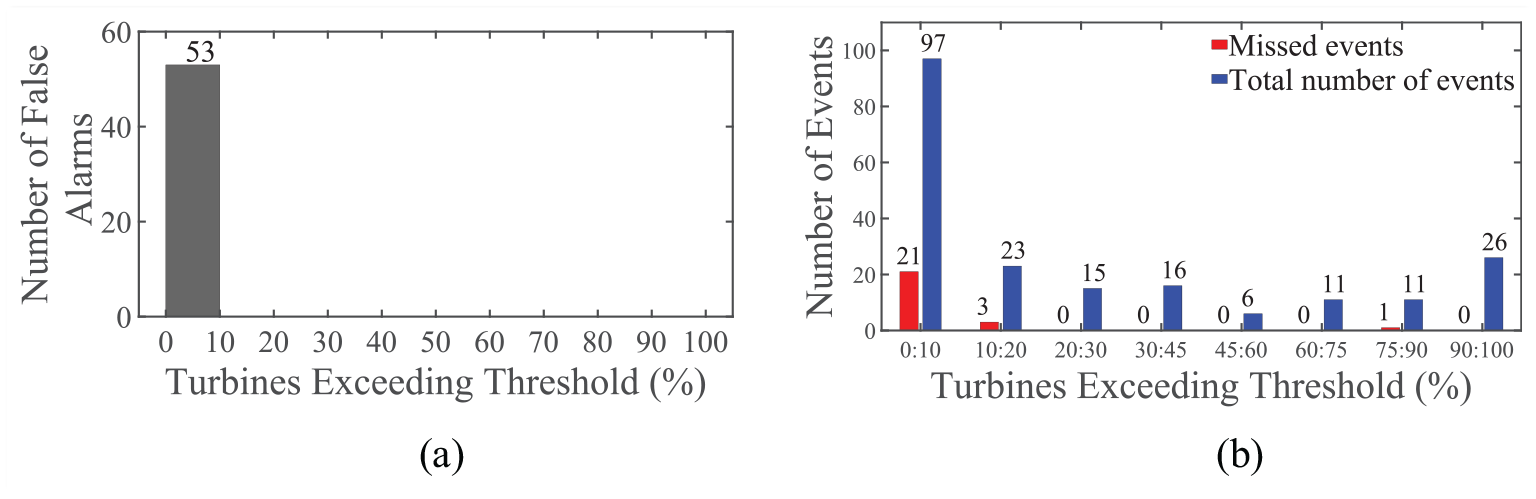
Frequent wind speed event forecast: (a) number of false alarms and (b) number of missed events, as well as the total number of events, versus the percentage of wind turbines exceeding the wind speed threshold.
Table 1 shows a contingency table listing the forecasting results of the model for frequent events. The true negatives are not included in the table as accuracy metrics are not calculated in this investigation due to the imbalanced nature of the classification problem. The results show that the model correctly predicts 180 of the 205 events that occur in the test set.
Contingency table showing the results of the frequent event forecasts.

Forecasting infrequent wind speed events
This section presents the results for the performance of the proposed model when used to forecast infrequent wind speed events with a threshold of 17 ms−1. The decline in the accuracy of the WRF ensemble forecast, coupled with the occurrence of fewer wind speed events complicates the nature of the forecast. The input parameter sets listed in Table A2 in Appendix A are considered with the view to identify the model architecture with the best forecasting skill. The cold-start WRF ensemble forecast, that is, case 2, yields the best performance of all considered permutations. Only the results for this case are presented.
The success of the forecast is adjudicated through consideration of a number of factors. These factors are the number of hits, misses and false alarms. Based on insight gained in the preceding sections of this investigation, a good high wind speed event forecasting model should return a low number of false alarms for significant events, no missed events for significant events, and a high degree of accuracy for significant events. To this end, the asymmetric Linex loss function (Varian, 1975) is selected and tuned to reflect these goals. The Linex loss function,

where
Figure 15 displays the wind speed event forecasting error for infrequent events using the metrics
The model’s forecasting skill increases with an increasing percentage of turbines exceeding the wind speed threshold, that is, with increasing event significance.
Insignificant wind speed events, where less than 30% of the turbines are exceeding the wind speed threshold, are predominantly between 50% and 100% under-predicted.
The model is more suited to the forecasting of the maximum number of turbines exceeding a wind speed threshold for an event, that is,
All significant wind speed events with more than 40% of the turbines exceed the wind speed threshold have been forecast with good accuracy.
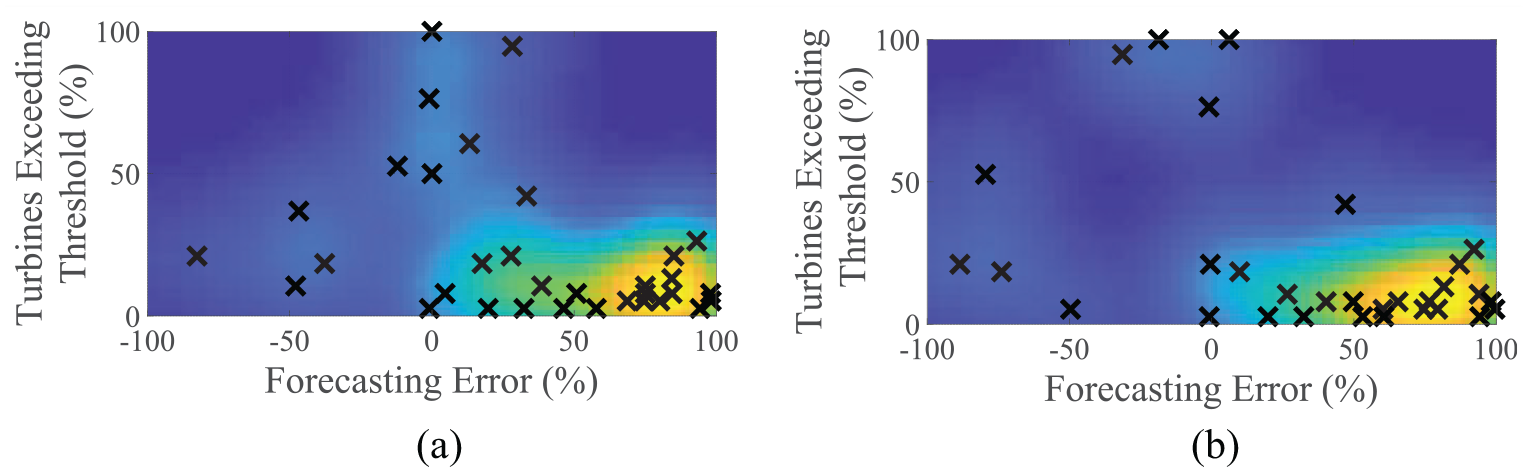
Wind speed event forecasting error expressed as a function of the maximum measured percentage of turbines which are exceeding the wind speed threshold of 17 m s−1. Results are presented for the metrics: (a)
Figure 16 displays the number of false alarms predicted by the model, as well as the number of missed events, along with the total number of events, versus the percentage of wind turbines exceeding the wind speed threshold.
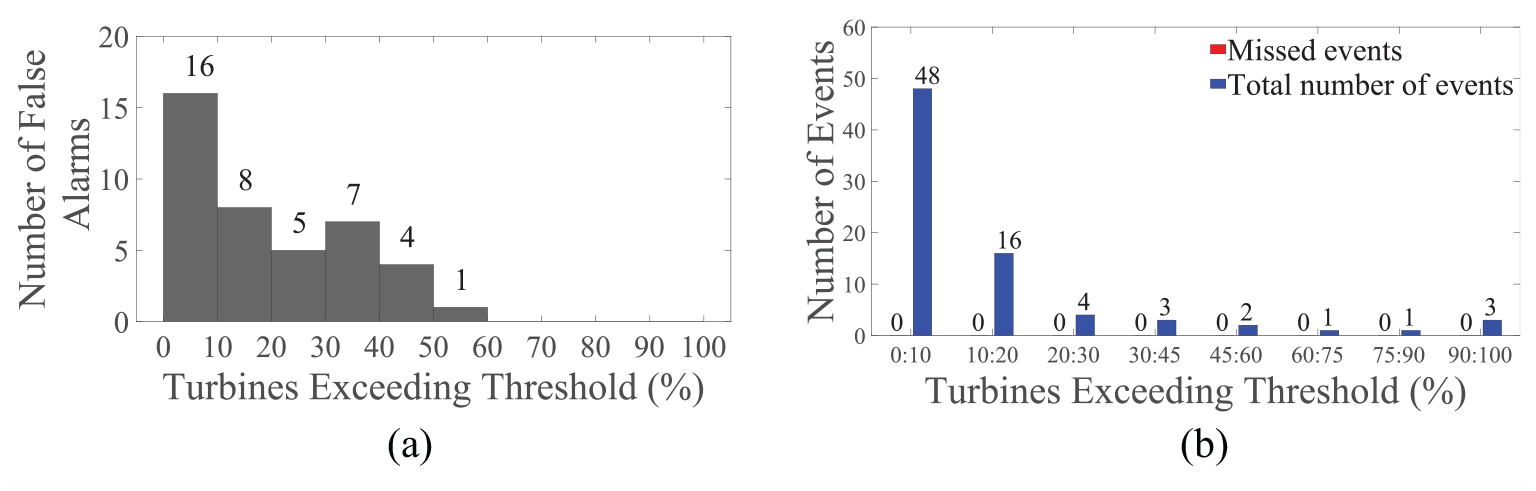
Infrequent wind speed event forecast: (a) number of false alarms and (b) number of missed events, as well as the total number of events, versus the percentage of wind turbines exceeding the wind speed threshold.
Table 2 shows a contingency table listing the forecasting results of the model for frequent events. The true negatives are not included in the table as accuracy metrics are not calculated in this investigation due to the imbalanced nature of the classification problem. The results show that the model correctly predicts all of the 78 events that occur in the test set. Notably, 41 false alarms have been raised, however, from Figure 16(a), no false alarms are raised where more than 60% of the turbines exceed the wind speed threshold.
Contingency table showing the results of the infrequent event forecasts.

The proposed model produces a good forecast for the wind speed event occurrences. It is concluded that the Linex loss function enables the model to penalise the under-forecasting of significant events, thereby increasing the accuracy of these forecasts, whilst minimising the number of false alarms. In order to improve the performance of the model in predicting wind speed events, the WRF forecasting accuracy must be improved.
Conclusions and future work
This paper proposes a hybrid WRF-ANN ensemble forecasting model for the short-term forecasting of wind speed events. The wind speed event definition is analogous to the case of HWSS events in the sense that the model must predict the number of turbines exceeding a defined wind speed threshold for every sampling interval. Results are presented for two cases where different wind speed thresholds are applied. These thresholds represent both frequent and infrequent wind speed events at the wind farm in this investigation. All significant events are accurately predicted by the model with few false alarms. This model is not capable of predicting high wind speed events representing a magnitude lower than 30% of the wind farms’ nameplate capacity. The proposed model is practical to implement in the sense that the short-term power forecasts which are already in use for wind farm applications are ported to a dedicated event-based model. A pre-trained ANN model for the high wind speed event prediction is all that is required. This will not add significantly to the computational time.
Several important aspects are recommended for future work. These are listed below:
The proposed model is evaluated using a dataset spanning 7 months. The generation of ensemble wind speed forecasts, coupled with the associated data sanitisation and post processing, is a time-consuming exercise which requires access to high-performance computing resources. The procurement of the required datasets for longer time periods rapidly increases the scale of the research project. For future work, it is recommended that forecasting accuracy be sacrificed by utilising a WRF ensemble model with fewer members. This will enable the generation of forecast data for longer time spans, and will provide more events for the training and assessment of the supervised learning algorithm.
The proposed model was evaluated for a low wind speed site situated in terrain with moderate topographical complexity. In future work, this technique should be applied to a high wind speed site situated in complex terrain. Moreover, turbine alarms which indicate HWSS occurrences should be incorporated into the analysis. This will complicate the study as the individual turbine control and shutdown procedures will need to be modelled for a deterministic forecasting model.
As an alternative approach, the downscaling model can be utilised to forecast the wind speed at individual turbines in the wind farm. These wind speeds can then be converted to turbine events by applying turbine cut-out parameters, after which the events can be aggregated. This approach should be investigated.
The proposed model is a deterministic forecasting approach. For future work, the merits of a probabilistic forecasting model should be assessed.
Footnotes
Appendix A
Permutations of the environmental covariates considered for the ANN model input parameter sets.
| Case 1 | Case 2 | Case 3 | Case 4 | Case 5 | Case 6 | Case 7 | Case 8 | Case 9 | |
|---|---|---|---|---|---|---|---|---|---|
| Mean wind speed at the wind farm | ✓ | ||||||||
| WRF ensemble wind speed forecasts, |
✓ | ✓ | ✓ | ✓ | ✓ | ||||
| A synthesised forecast derived from theWRF ensemble using an ANN model | ✓ | ✓ | ✓ | ||||||
| Temperature | ✓ | ✓ | ✓ | ||||||
| Pressure | ✓ | ✓ | |||||||
| Wind direction | ✓ | ✓ | ✓ |
Acknowledgements
The authors gratefully acknowledge the Centre for High Performance Computing (CHPC) for the use of their resources for the WRF simulations.
Declaration of conflicting interests
The author(s) declared no potential conflicts of interest with respect to the research, authorship and/or publication of this article.
Funding
The author(s) received no financial support for the research, authorship and/or publication of this article.
