
Abstract
The growth rate of offshore wind is increasing due to technological advancement and reduction in cost. An approach using mast measured data at coastline and reanalysis data is proposed for offshore wind resource assessment, especially for developing countries. The evaluation of fifth generation European Reanalysis (ERA5) data was performed against measured data using statistical analysis. ERA5 data slightly underestimates wind speed and wind direction with percentage bias of less than 1%. Wind resource assessment of region in Exclusive Economic Zone (EEZ) of Pakistan was performed in terms of wind speed and Wind Power Density (WPD). The range of monthly mean wind speed and WPD in the region was 4.03–8.67 m/second and 73–515 W/m2 respectively. Most-probable wind speed and dominating wind direction on corners and center of the region were found using probability distributions and wind rose diagrams respectively. Most-probable wind speed ranges 4.41–7.64 m/second and dominating wind direction is southwest.
Keywords
Introduction
The global energy demand and consumption are rapidly increasing with industrial maturity and advances in technology. The fossil fuels (coal, oil, and natural gas) have largest share of energy generation worldwide. The emissions from fossil fuel-based power plants are one of major causes of environmental pollution and climate change (Costoya et al., 2021). The greenhouse gases, organic particulate matter, and other pollutant emissions are causing serious issues of global warming, ocean acidification, melting of polar ice caps, and increase in occurrence of extreme weather events (NASA, 2021). The nations of the world are forming collaborations and strategies to implement emission monitoring and control standards on fossil fuel-based power generation. The use of renewable and environment friendly energy resources for electricity generation is also increasing to mitigate the climate change issues.
Sustainable energy conversion technologies utilize different renewable resources for power generation, which provides environment friendly electricity for industrial and domestic use. The increase in renewable power generation can ensure energy security and avoid any potential energy crisis similar to the oil crises of 1973 and 1980 (Nezhad et al., 2021b). The global renewable installed capacity has significantly increased in the last two decades with 2802 GW installed at end of 2020 (IRENA, 2021). Hydropower, wind, and solar power are three major renewable energy sources being utilized worldwide. Hydropower has major contribution with an installed capacity of 1333 GW which is 47% of total renewable power generation (IRENA, 2021). Wind power is the second most abundantly used renewable resource for environment-friendly power generation with 733 GW installed till 2020 that makes 26% of global renewable power (IRENA, 2021).
Wind power has salient features of significantly fewer contaminants released into the environment, the highest decarbonization capability per MW of power produced, and sustainability of the resource (Lee and Zhao, 2021). Onshore wind is one of the cheapest renewable energy technologies having minimum global weighted levelized cost of electricity with lesser problems mainly; issues in land procurement, noise during operation, path interference for migratory birds, public opinion, and sentiment (Saidur et al., 2011). A significant increase of 513 GW in installed wind power capacity is observed in the last decade (2011–2020) (IRENA, 2021). The main reasons for this growth include development in wind turbine technologies, reduction in costs to even less than fossil fuels, and increased exploration of offshore regions for wind farm installation (IRENA, 2020).
Offshore wind power generation is becoming an attractive option in wind power industry with four times more growth in installed capacity than onshore wind in the last decade (IRENA, 2021). Offshore wind has many advantages over onshore wind including higher wind speeds, consistent patterns, uniformity for wider areas and lesser environmental impact (Majidi Nezhad et al., 2021a). Several of the typical drawbacks associated with onshore wind power generation can be avoided in case of offshore wind farms, such as land occupancy and noise issues (Lima et al., 2015; Majidi Nezhad et al., 2021a). The Levelized Cost of Electricity (LCOE) for offshore wind farms has reduced by 48% from 16.2 to 8.4 US¢/kWh in the last decade (IRENA, 2020). The total installed capacity of offshore wind farms is at 34 GW till 2020 with the largest capacity of about 25 GW currently operational in Europe (IRENA, 2021). China has also shown remarkable progress in this field with about 23% (almost 9 GW) of the global offshore wind capacity (IRENA, 2021; reve, 2021). The growth of offshore wind power development for developing countries is very low compared to developed countries, due to lack of resources to initiate a project especially offshore wind resource assessment. There is a need to develop a cheaper novel approach that can be easily implemented in developing countries.
The preliminary requirement for wind resource assessment in a region is accurate and long-term in-situ measured data. The wind data is usually measured with masts installed in concerned offshore region either using buoy or other arrangements. The offshore wind data measurement is costly and challenging for longer time periods (Carvalho et al., 2014a) especially in developing countries. The alternative to measured data are satellites or reanalysis datasets, the accuracy of these datasets varies from location to location, and it is important to evaluate accuracy before its use. The reanalysis datasets are available globally, free of cost, but their spatial and temporal resolution is lower compared to satellite data. A majority of recent studies have utilized reanalysis wind data due to their global coverage, long-term availability, and free access at any region. There are several reanalysis datasets available, but ERA5 has finer temporal and spatial resolution among all. The details about reanalysis datasets and compiling organizations are presented in Nezhad et al. (2021b). ERA5 data provides wind data having temporal resolution of 1-hour, spatial resolution of 30 km (0.28125° × 0. 28125°), elevation levels of 10 and 100 m and 137 pressure levels from 1979 to date (Kardakaris et al., 2021; Olauson, 2018). The use of satellite and reanalysis data has been reported for wind resource assessment in previous studies (Gil Ruiz et al., 2021; Kistler et al., 2001; Kokkos et al., 2021; Majidi Nezhad et al., 2021a; Nezhad et al., 2021b, 2021c). The quality and accuracy of reanalysis data is important to evaluate before its use which is checked against measured data.
The evaluation of reanalysis data against in-situ measured data is performed using statistical parameters, and reanalysis data with known accuracy is used for wind resource assessment as reported in recent literature (Gil Ruiz et al., 2021; Kistler et al., 2001; Kokkos et al., 2021; Nezhad et al., 2021c). The assessment based on wind speed is usually reported in previous literature (de Assis Tavares et al., 2020; Kardakaris et al., 2021; Nezhad et al., 2021b; Taoufik and Fekri, 2021) but use of wind direction is not common and reported in few studies (Gil Ruiz et al., 2021; Kokkos et al., 2021). The wind resource assessment using reanalysis data by European Center for Medium-Range Weather Forecasts (ECMWF) is commonly reported in previous literature (Gil Ruiz et al., 2021; Kardakaris et al., 2021; Nezhad et al., 2021b, 2021c).
Nezhad et al. (2021c) performed wind resource assessment in the Oresund area in the Baltic Sea using ERA-Interim data at 65 m height in terms of monthly mean wind speed contour plots, annual, and monthly time-series of wind speed. Nezhad et al. (2021b) evaluated ERA-interim reanalysis data against measured data at 90 m height for Samothraki island in the Mediterranean using statistical analysis, the offshore wind farm site assessment was reported in terms of contour plots and time-series of annual and monthly mean wind speed. Kardakaris et al. (2021) evaluated ERA5 reanalysis data against buoys measured data at six different locations at 3 m height using statistical analysis, the wind resource was assessed at 100 m using reanalysis data in terms of contour plots for annual mean WPD. Gil Ruiz et al. (2021) evaluated ERA5 reanalysis data with measured data from 13 sites at 10 m height in the Caribbean region of Colombia, wind resource assessment was performed in terms of Weibull probability distributions, wind rose diagrams and contour plots of monthly mean wind speed and WPD. The latest ERA5 is the only reanalysis dataset that provides wind data at 100 m height, wind data at 100 m is not evaluated so far as per best knowledge of authors, which is much needed to use it for commercial applications, and this is one of the objectives of this study.
The study aims to use a novel approach to assess offshore wind potential for a region with unavailability of offshore wind data. The wind mast on coastline can be used, which is easy to install and operate compared to offshore installation. The evaluation of ERA5 reanalysis wind data (both speed and direction) at 100 m height was performed (for the first time) against high quality mast measured data using statistical analysis, comparison of wind speed frequency distributions and comparison of wind rose diagrams. The only wind mast installed on coastline of Pakistan (a developing country) was selected and measured data of 2 years duration was used for evaluation of reanalysis data. The coastline is about 990 km long and area of the Exclusive Economic Zone (EEZ) of Pakistan is 240,000 km2, but not a single attempt was made for offshore wind resource assessment. The evaluation of reanalysis data performed on coastline is considered to be applicable for the offshore region in surroundings. The offshore wind resource assessment of a region in the EZZ was performed using 15 years reanalysis data with known uncertainty in terms of contour plots of annual mean wind speed and annual mean WPD. The wind speed probability distributions and wind rose diagrams were plotted to find most probable wind speed and dominating wind direction at corners and center of the region. The approach used in this study can help researchers in developing countries to perform offshore wind resource assessment. This study is a guideline for policy-makers in Pakistan for development of offshore wind farms to reduce fossil-fuel imports and harmful emissions.
Methodology
This section presents the methodology followed for offshore wind resource assessment for a region in the Exclusive Economic Zone (EEZ) of Pakistan. The evaluation of reanalysis data against measured data was carried out in terms of statistical parameters, Weibull probability function and wind rose diagrams. The contour plots of wind speed and Wind Power Density (WPD) were plotted for region selected near currently operational onshore wind farms. The step-by-step methodology adopted in this study is presented in Figure 1.

Representation of methodology developed for wind resource assessment.
Wind data
The wind resource assessment of a region is usually performed using in-situ measured data which is not available for most locations in developing countries. The reanalysis datasets provide wind data for long-term duration with different spatial and temporal resolutions globally, free of cost. The reanalysis datasets are used for wind resource assessment due to lack of availability of measured data at taller hub heights and unavailability of long-term duration measured data.
The mast measured wind data for one location on coastline was available for Pakistan. The mast was installed on Pakistan’s coastline at Hawks Bay (HB) in Karachi, by the Alternative Energy Development Board, Pakistan (AEDB) in collaboration with the United Nations Development Program (UNDP) (Tahir et al., 2020). The mast location is shown on coastline in Figure 4. The geographical location of the mast has longitude of 66.86°E, latitude of 24.87°E, and altitude of 4 m. The wind speed was measured using anemometers installed at 10, 30, 60, and 80 m heights whereas wind direction was measured using wind vane at 28.5 and 78.5 m heights. The temporal resolution of measured wind data was 10 minutes and data of 2 years duration (May 2009–April 2011) was used. The measured data was averaged to hourly data for comparison with reanalysis wind data. Bilinear interpolation technique was used to compute ERA5 reanalysis data at mast location, which is commonly used approach in previous studies (Carvalho et al., 2014b; Hawkins et al., 2011; Jaramillo et al., 2013).
Wind data vertical extrapolation
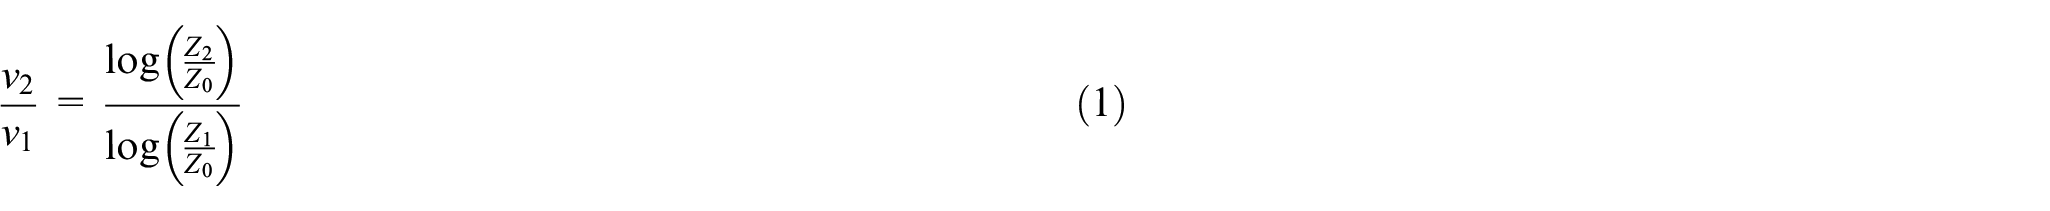
Due to improvements in wind turbine technology, taller hub-heights are used to increase rotor swept area for higher capacity, which signifies the need for methods to extrapolate measured data to corresponding hub-heights. Two commonly used models for interpolation or extrapolation of wind data are power law (using coefficient of wind shear) and logarithmic law (using length of surface roughness). Both laws are dependent on factors such as seasonal variations of data, day-time, changes in atmosphere, and topography conditions of region. The Logarithmic law extrapolates or interpolates wind speed at a wider range, elevations, locations, and is commonly used in previous studies (Nezhad et al., 2021c; Tahir et al., 2020). The measured data was extrapolated using the logarithmic law at 100 m to compare with reanalysis data using equation (1) (Nezhad et al., 2021b). Z0 is surface roughness, v1 and v2 is the wind speed at elevation Z1 and Z2 respectively in equation (1).
Evaluation of reanalysis data
The accuracy of reanalysis data is commonly evaluated by comparison with measured data using statistical analysis (Kardakaris et al., 2021; Majidi Nezhad et al., 2021a). The evaluation of the reanalysis data is initial step in wind resource assessment. The statistical parameters used to evaluate performance of ERA5 wind data (magnitude and direction) against measured data were; mean bias error (MBE), mean absolute error (MAE), root mean square error (RMSE) and standard deviation of errors (STDE). These statistical parameters for evaluation of reanalysis data were widely used in previous studies and were calculated by equations mentioned (Kardakaris et al., 2021; Kokkos et al., 2021; Majidi Nezhad et al., 2021a; Tahir et al., 2020). The MBE shows the average difference between measured and reanalysis data (Dong et al., 2021), the MAE is absolute bias (Kardakaris et al., 2021), the RMSE is root mean square deviation (Tahir et al., 2021a), and the STDE is extent of deviations for each interval of time between measured and reanalysis data values. The MBE near to zero shows accuracy of reanalysis data against measured data, underestimation if minus values and overestimation if positive values. Overall, closer to zero values are acceptable for all these statistical parameters. The approach used is to evaluate reanalysis data using measured data at the coastline to find errors and then perform wind resource assessment for the EEZ of Pakistan with known uncertainty.
The comparison of wind speed distribution of reanalysis data with measured data provides further validation. Different probability distribution functions (Weibull, Gamma, Gaussian, Beta, and Rayleigh) are utilized to analyze the frequency of the wind speed for a particular time span (Tahir et al., 2021b). The most applied and considered to be accurate is the Weibull probability distribution function which is governed by two parameters, a shape factor (k) and a scale factor (A) (Tahir et al., 2021b). The mathematical model of Weibull distribution is presented as equation (2) (Kokkos et al., 2021), v is wind speed in m/second. The Weibull parameters (k and A) were determined using one of several numerical techniques (Moment method, WAsP, least square method, Openwind algorithm, Maximum likelihood method, etc.) available in literature (Tahir et al., 2021b). The Openwind algorithm was used in the Windographer® software and the best-fit Weibull curve was obtained for the two data at mast location.

Analysis of dominating wind direction is a crucial step before the installation of wind turbines in a wind farm. The wind rose diagrams are widely used to predict prevailing direction for a particular region (Tahir et al., 2021b). The orientation of the wind speed and type of wind turbine to install in a wind farm are determined using wind rose diagrams. The wind rose diagrams in terms of wind direction frequency were plotted at 100 m using ERA5 data and measured data at mast location, and wind direction trends were compared. The wind rose diagrams consists of 12 sectors (each sector covers 30°) were plotted using commercial software Windographer® (Windographer, 2021).
Wind resource assessment
The wind resource assessment is a key factor to check power potential and feasibility of a wind farm at a specific site, and is generally carried out using three parameters; wind speed, WPD, and wind direction (Chancham et al., 2017; Gil Ruiz et al., 2021). Resource assessment of a site is necessary for wind power generation and is a key step to get confidence of investors to install wind projects (Li et al., 2018). The measured data of more than 2 years (preferably) should be used to analyze interannual variations. The measured data is usually available for short durations (generally 3 years), therefore, long-term reanalysis data as an alternative are used for resource assessment.
ERA5 reanalysis data was used to perform the offshore wind resource assessment for EEZ of Pakistan after necessary evaluation. The key parameters of wind speed, WPD, and wind direction were analyzed for the selected region, and the variations throughout the year were observed. The WPD was computed using equation (3), where ρ is density of air at 100 m, v is reanalysis wind speed, and N is number of occurrences in the observed time period (He et al., 2020). The region in the EEZ in the vicinity of currently operational onshore wind farms was selected as shown in Figure 4. The Top-left, Top-right, Bottom-left, and Bottom-right corners of the region are represented as A, B, D, and E respectively whereas Center of the region as C.

The annual mean wind speed and WPD at 100 m height for the region were plotted. The average monthly mean wind speed and WPD of whole region were computed to observe variation over the year. The wind speed frequency distribution for corners and center of the region was plotted. The Openwind algorithm was used to determine the Weibull parameters of the best-fit curve. The wind direction behavior was also observed at corners and center of the region using wind rose diagrams, and the dominant direction was identified.
Results and discussion
The results of wind resource assessment are presented in this section. The evaluation of reanalysis data was performed using statistical analysis, comparison of wind speed frequency distributions and wind rose diagrams. The wind resource in selected region was assessed in terms of contour plots of wind speed and WPD using ERA5 data of 15 years duration. The wind speed frequency distribution and wind rose diagrams, for corners and center of the region were plotted.
Evaluation of reanalysis data
The evaluation of reanalysis wind speed was performed in terms of statistical analysis and comparison of frequency distributions whereas evaluation of reanalysis wind direction was performed in terms of statistical analysis and comparison of wind rose diagrams.
Statistical analysis
The statistical parameters (MBE, MAE, RMSE, STDE) were computed for hourly ERA5 wind speed and wind direction data at an elevation of 100 m above mean sea level by comparing measured data at mast location for overlapping time duration. The details of wind data errors are presented in Table 1. The MBE values for wind speed would be either positive or negative based on overestimation or underestimation of reanalysis data relative to the measured data. Similarly, the positive or negative MBE for wind direction represents clockwise or anti-clockwise deviation of reanalysis data respectively. Low values of statistical parameters are ideal for good agreement between reanalysis and measured data.
Statistical parameters for wind speed and wind direction at 100 m for mast location.

There is underestimation of both wind speed and wind direction in terms of MBE whereas overestimation for all other errors. The discrepancy in wind direction is slightly higher than wind speed for all errors. The lower values of statistical parameters indicate a good agreement between reanalysis and measured wind speed and wind direction. The range of errors for wind speed (wind direction) is −0.01–1.87 m/second (−2.73°–36.41°). The percentage difference between wind speed and wind direction is −0.2% and −0.9% receptively. The possible reasons of the occurrence of errors are; comparison is being made between the data acquired from two different sources and extrapolation of measured data from a lower height to 100 m height. Low percentage errors (<1%) are observed for all statistical parameters which show ERA5 data is a good option for offshore wind resource assessment.
The MBE, MAE, RMSE, and STDE were also used to evaluate hourly ERA5 wind data against measured data from six buoys at 3 m elevation in the Greek Sea by Kardakaris et al. (2021) and for eight locations at 10 m elevation in Qatar by Aboobacker et al. (2021). The errors of present study are comparable with previous two studies. The evaluation of hourly ERA5 wind data at 100 m elevation for one offshore location and two coastal locations in Brazil was performed by Fernandes et al. (2021), the RMSE in range of 2.20–3.76 m/second was reported. The RMSE for ERA5 wind speed data at 100 m height calculated in this study is comparable with errors mentioned in the previous study.
Wind speed and wind direction comparison
The most commonly used Weibull probability distribution function which is governed by two parameters (k and A) is used for comparison of ERA5 wind speed with measured wind speed at mast location. Weibull distribution in terms of frequency of wind speed at mast location for measured data and reanalysis data is presented in Figure 2(a) and (b) respectively. The two frequency histograms are closely similar, with the most abundant wind speed range was 6.0–6.5 m/second in corresponding observed time periods. The wind speed occurrences for both frequency histograms are also same, ranging from 0 to 15.5 m/second. The Weibull best-fit curves for the measured and ERA5 data are also quite similar. The k values for measured and reanalysis wind speed was 2.58 and 2.66 respectively, with a percentage difference of 2.78%. The difference of values A for two best-fit curves are less than 1 m/second and percentage difference of 10.46%, measured data has value of 6.68 m/second whereas ERA5 has 7.46 m/second. It is evident from the two distributions and corresponding best-fit curves that ERA5 wind speed data agrees well with measured data at mast location.
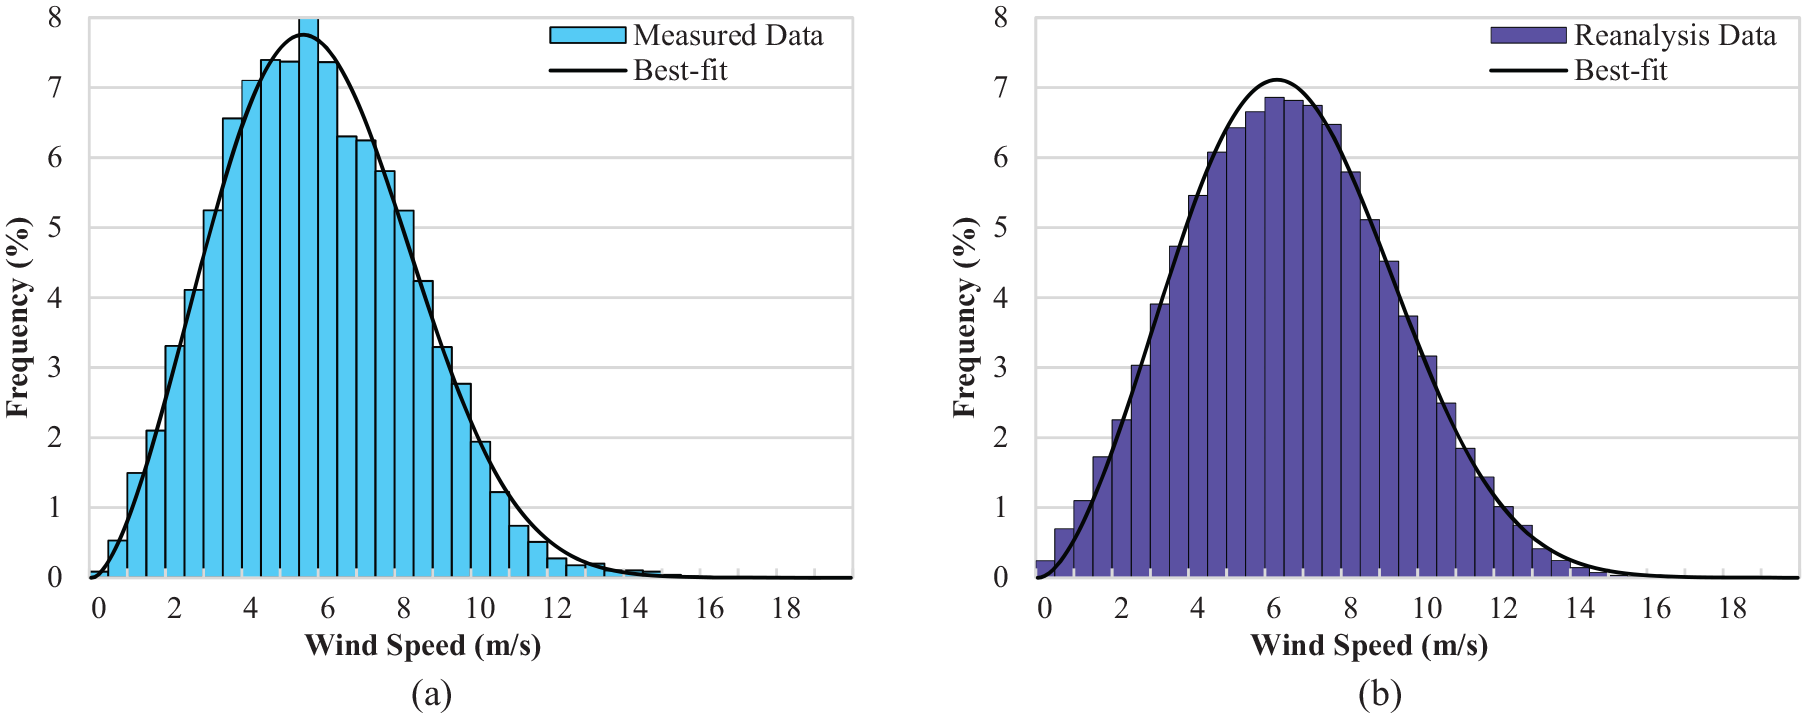
Wind speed frequency and Weibull best-fit at mast location: (a) measured data and (b) reanalysis data.
The wind direction trends and prevailing direction range are compared at mast location for both measured and ERA5 data. The wind rose diagram for measured data and ERA5 data is presented in Figure 3(a) and (b) respectively. The wind direction (°) is presented along the circumference with 12 sectors of 30° interval each, the frequency occurrence is labeled along the concentric circles, and the wind speed (m/second) for a particular direction interval is shown by color bins elaborated by a legend. The dominant wind direction is represented by the sector with highest wind speed frequency occurrence. West to Southwest direction is observed as the dominant wind direction for both measured and reanalysis data with slight differences in frequency. The same frequency distribution of about 70% is observed within a 100° span from 200° to 300° as shown in Figure 3. The comparison of wind rose diagrams shows that ERA5 wind direction data is also consistent with the measured data. The statistical analysis of wind speed and wind direction, Weibull distributions and wind rose diagrams show good agreement and consistency of reanalysis data with measured data. This comparison makes ERA5 data good for offshore wind resource assessment with reasonable accuracy.

Wind rose diagrams at mast location: (a) measured data and (b) reanalysis data.
Selected region
The evaluation of reanalysis data performed at mast location on coastline is considered to be applicable for the offshore region in the surroundings, so wind resource assessment is carried out using ERA5 data. A rectangular region is selected in the eastern part of EEZ of Pakistan for possible offshore wind farm development. The coordinate bounds are 65.50°–67.00° longitude and 22.50°–25.50° latitude, with an area of 50,760 km2. The selected region includes some coastal areas around the wind mast location and is in vicinity of the Gharo-Keti Bandar wind corridor, where three onshore wind power projects in Pakistan are currently operational (Alternative Energy Development Board [AEDB], 2018). The wind speed trends are expected to be attractive in the selected region relative to the western portion of the EEZ. The selected region is shown in Figure 4 as red dashed rectangle, the wind mast location as red triangle, currently working onshore wind farms in Pakistan as blue squares. The EEZ and coastline of Pakistan are shown by a dash-dot line and a solid line respectively in Figure 4.
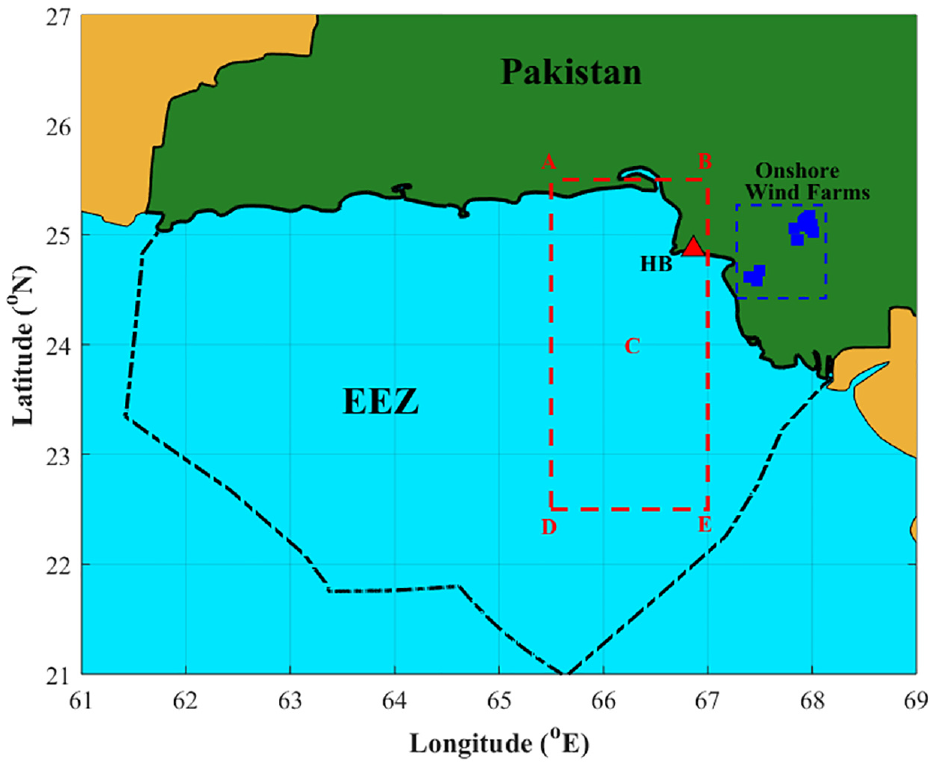
The selected region used in this study for offshore wind resource assessment.
Wind resource assessment in selected region
ERA5 reanalysis data for 15 years period from year 2004–2019 was used for wind resource assessment of selected region. The wind resource in selected region was assessed in terms of contour plots of wind speed and WPD of whole region. The Weibull frequency distribution of wind speed and wind rose diagrams for wind direction, at the corners and center of the selected region are presented.
Wind speed and wind power density
Wind speed is governing factor in selection of a suitable wind turbine for a potential region, whether onshore or offshore. The WPD for a region provides an estimation of wind power generation potential. Annual mean wind speed (m/second) and WPD (W/m2) for the selected region are shown as contour plots in Figure 5(a) and (b) respectively. The variations in contour plots for wind speed and WPD are explained by accompanying legends, with an increase in magnitude indicated as a shift from blue to red color. The highest annual mean wind speed ranges in 6.50–6.75 m/second and the highest WPD ranges in 300–325 W/m2. An increase in wind speed and WPD is observed from west to east and at distance away from coastline in the deep ocean. The wind speed and WPD both reduce drastically at the shift from offshore to onshore region along the coast.
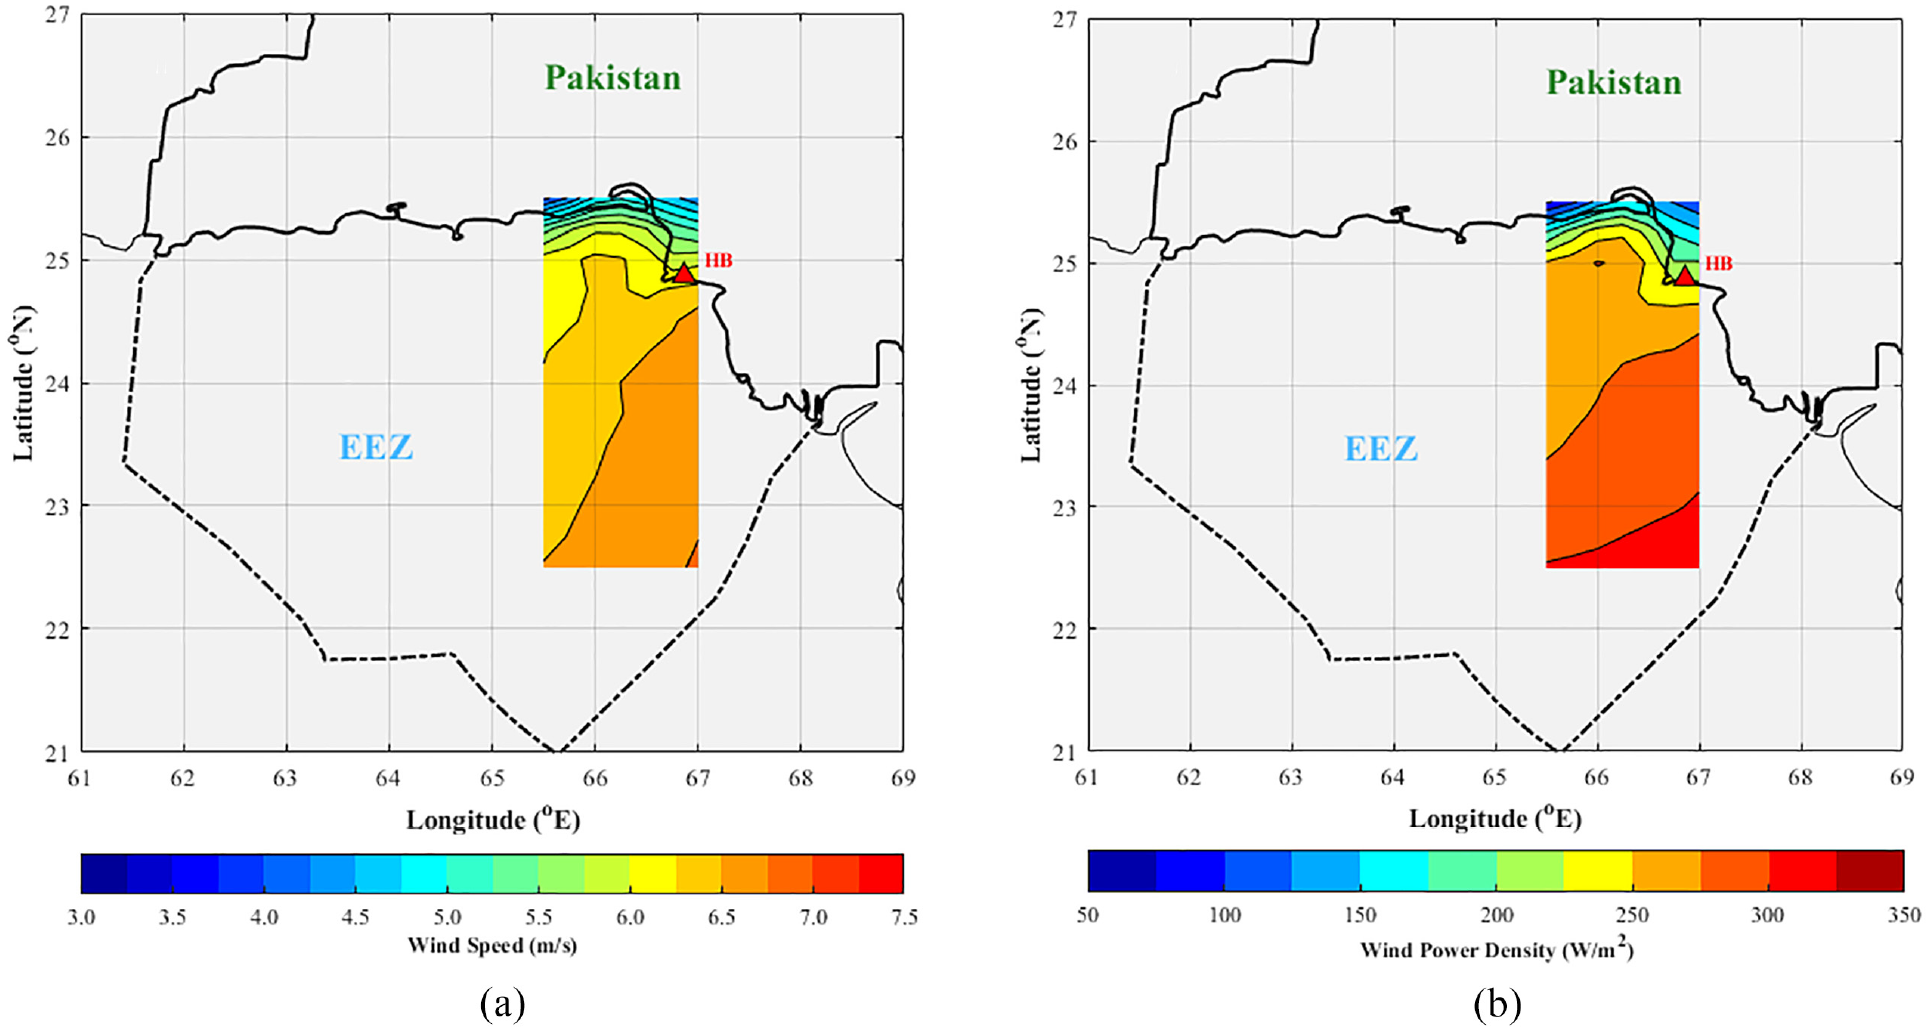
Annual mean wind resource at 100 m using 15 years data for (a) wind speed and (b) WPD.
The monthly mean wind speed and WPD in selected region using long-term reanalysis data is presented in Figure 6(a) and (b) respectively. The months are presented on horizontal axis and the wind speed (m/second) or WPD (W/m2) is on the vertical axis. The monthly mean plots show an increase in wind resource (wind speed and WPD) from January to July and then decrease from August to November. Pakistan like many Asian countries lie in high temperature zone and peak electricity is demanded in summer season. The offshore power potential shows coherence with electricity demand and can avoid additional steps require in power plants to meet peak demand of electricity in summer. The maximum wind speed (WPD) is observed as 8.67 m/second (515 W/m2) in July, whereas minimum wind speed (WPD) is observed as 4.03 m/second (73 W/m2) in November. The monthly mean plots show similar variations and follow an approximately normal distribution pattern for the whole year. The annual mean wind speed and WPD of whole region is 6.23 m/second and 258 W/m2 respectively.
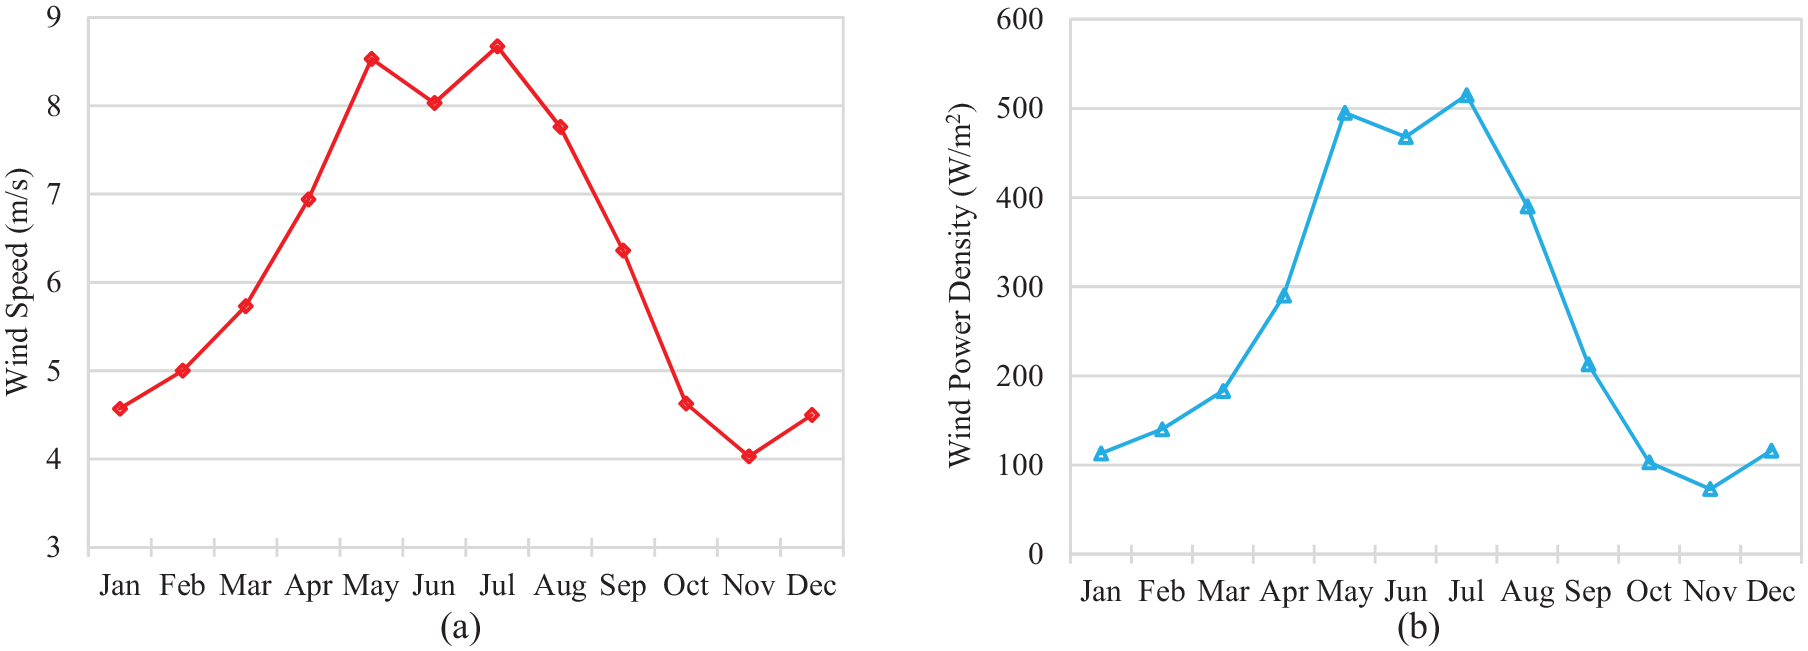
(a) Monthly mean wind speed of selected region at 100 m and (b) monthly mean wind power density of selected region at 100 m.
Weibull probability distribution
The wind potential of a particular site is estimated alternatively using wind speed frequency histogram and corresponding best-fit curve. The frequency distribution of wind speed and best-fit curves for the five locations (four corners point and one central point of selected region) are presented in Figure 7. The frequency histograms were plotted and the best-fit curves were determined using Weibull distribution function. The annual mean wind speed and mean wind direction, mean WPD, parameter k and parameter A for locations A–E are presented in Table 2. The parameter A which is a measure of wind potential in terms of most probable wind speed and parameter k which is measure of deviation of wind speed were determined. The values for Weibull parameters are higher for the three locations in deep ocean with maximum scale factor of 7.64 at point E. A small difference of 3.94% in shape factor and 2.43% in scale factor is observed for three locations (C–E) in offshore region. The two locations (A and B) in onshore region show k and A values close to each other, however, percentage differences of shape and scale factors are higher than offshore region points. The values of A and k are decreased from 7.64 to 4.41 and 2.39 to 1.80 respectively, when progressing from offshore (bottom right point) to the onshore (top left locations) region. Both shape factor and scale factor have values higher for offshore than onshore region which signify the need of assessing significant wind power potential available in offshore region. The wind speed occurrences range from 0 to 17.50 m/second for locations C, D, and E whereas from 0 to 14 m/second for A and B. The peak wind speed observed in three histograms for offshore locations is around 6 m/second, with an occurrence frequency of about 6%–7%. The two onshore locations have far lower wind speeds relatively, having peak wind speeds of three at location A, and approximately two at location B, with occurrence frequencies of 4%–4.5%. Weibull distributions show consistent and higher wind speed trends for the offshore region which makes it more suitable than onshore, for wind power generation.
Scale and shape factors for Weibull distribution at concerned points in targeted region.

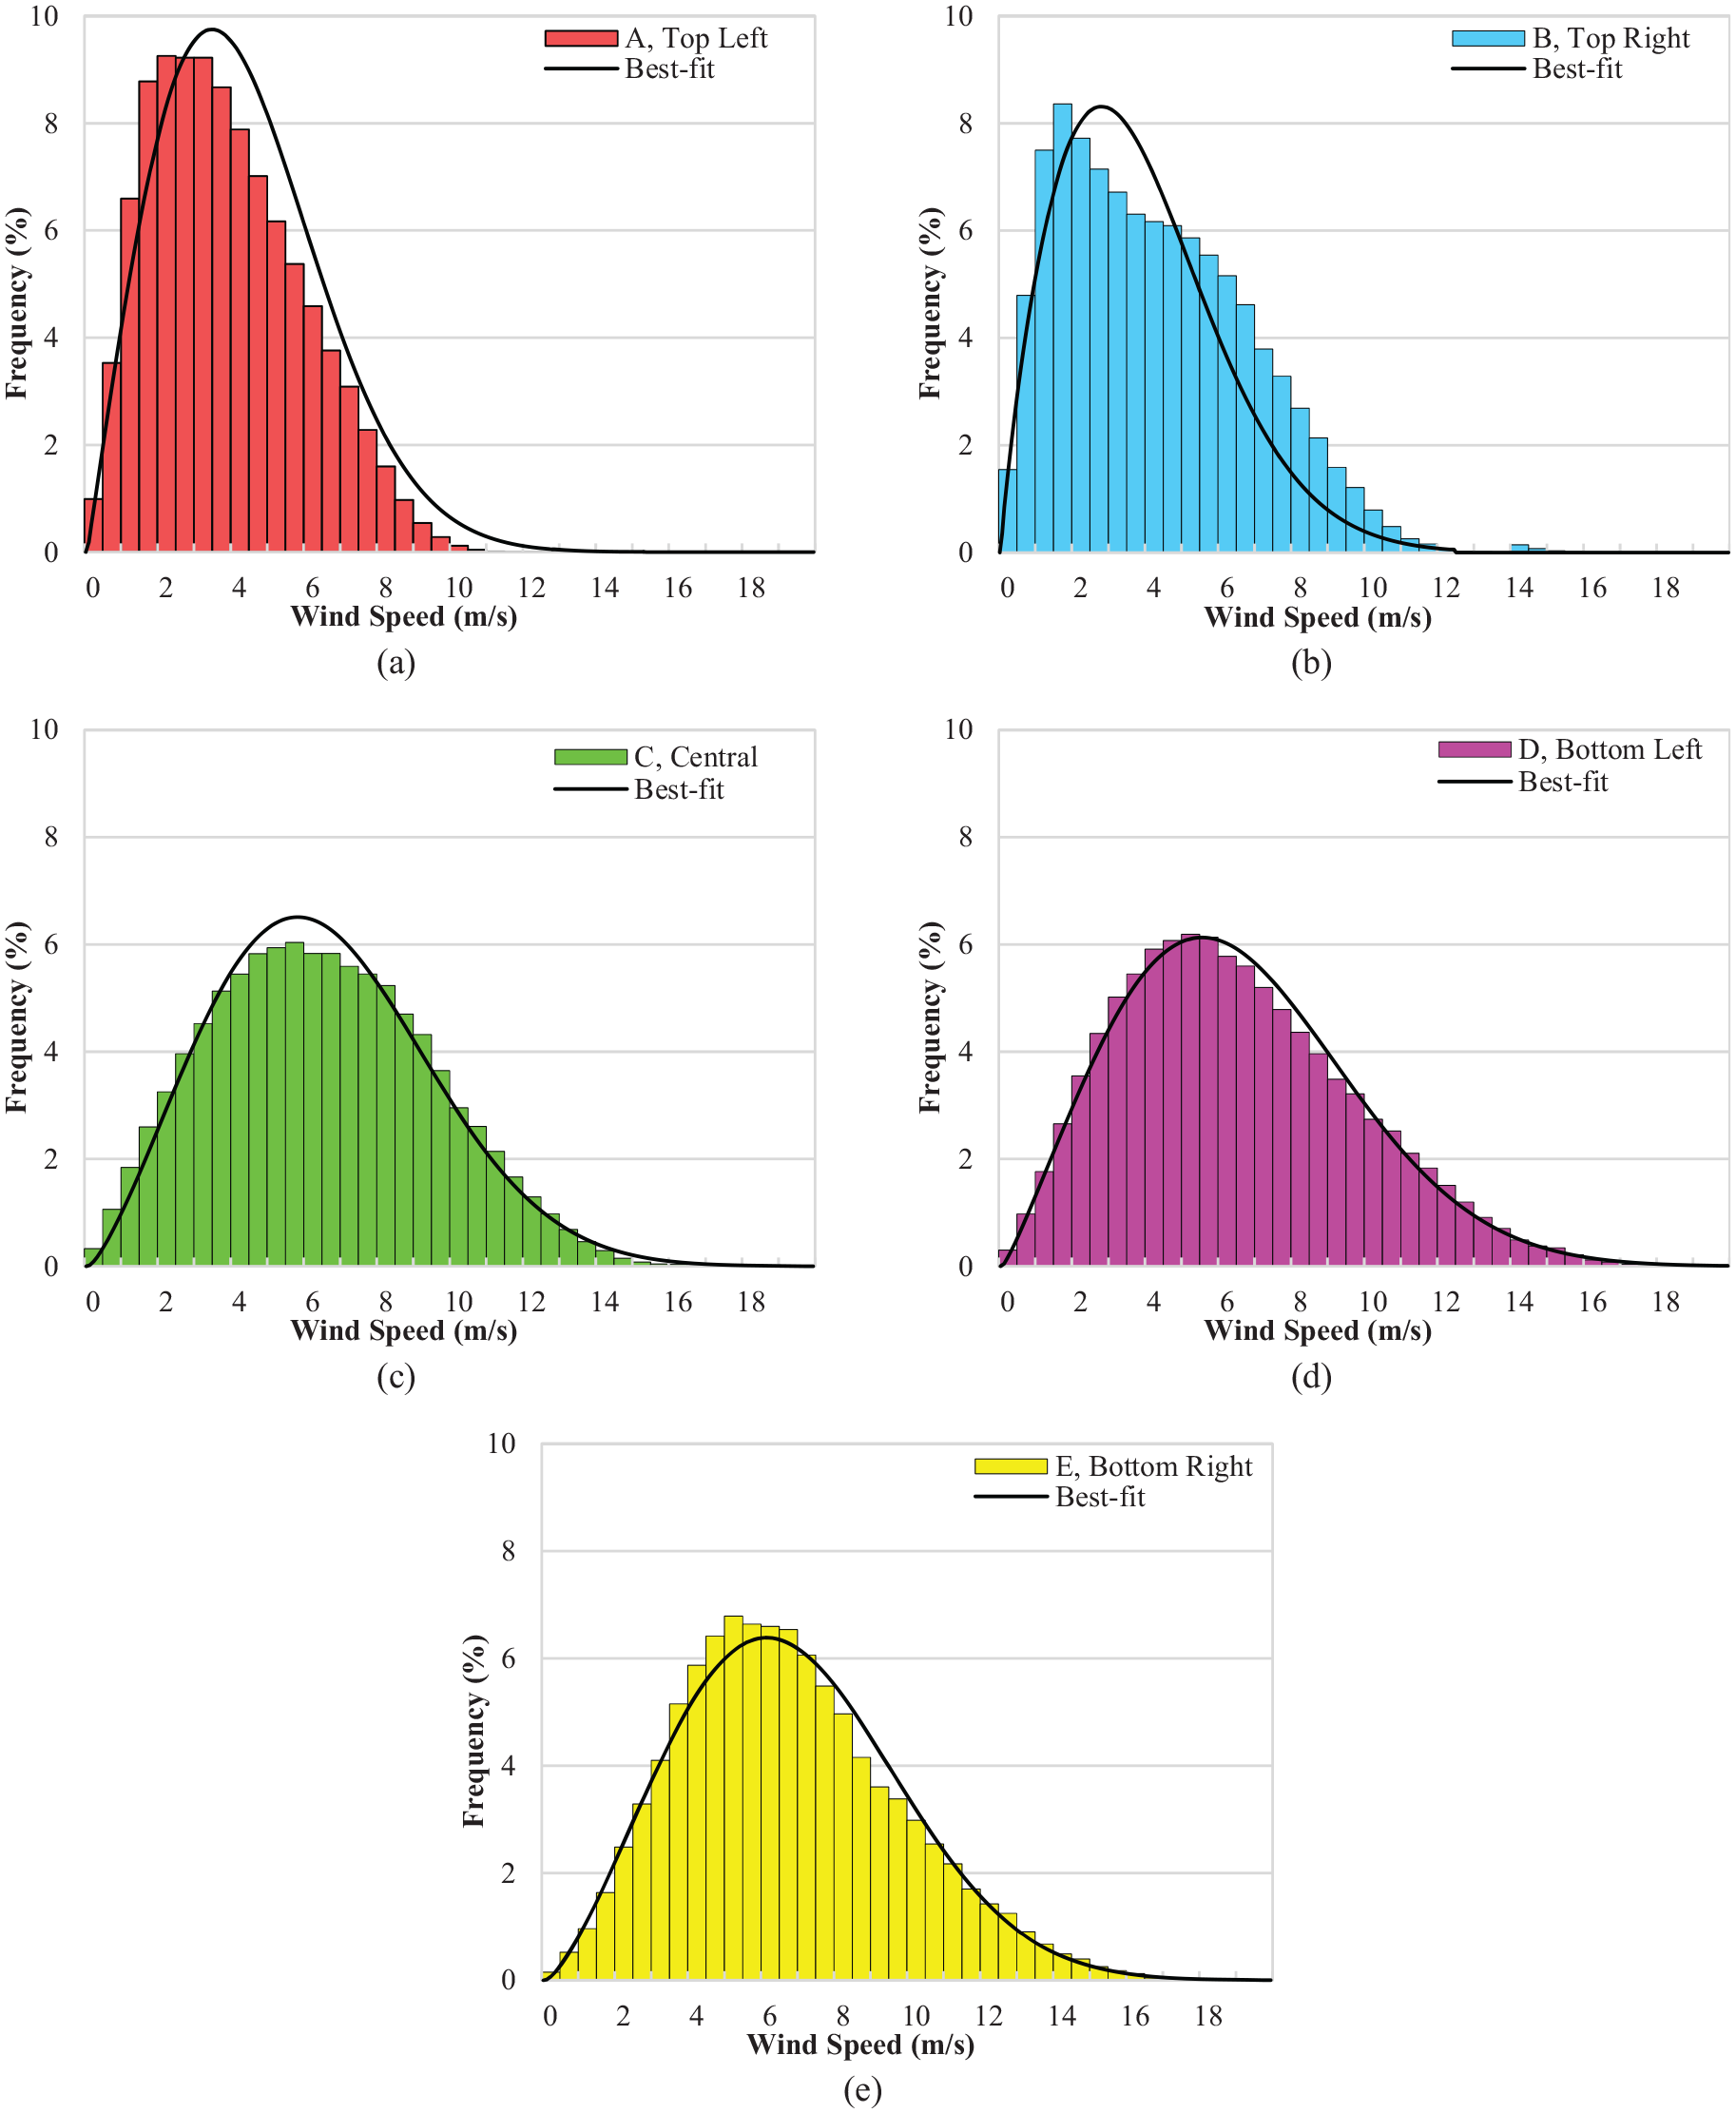
Wind speed frequency and Weibull best-fit at 100 m height for (a) A—top left corner, (b) B—top right corner, (c) C—central point, (d) D—bottom left corner, and (e) E—bottom right corner.
Wind direction
The wind direction data is used to find dominant direction throughout the year which is used for selection of wind turbine orientations during wind farm installation. The wind direction estimation is one of the fundamental factors to install any particular turbine in a wind farm. The turbines are arranged in such a manner that the swept area stays perpendicular to the incoming wind for most of the time. The ERA5 wind direction data was used to draw wind rose diagrams at A–E locations of selected area. The wind rose diagrams with 12 sectors of 30° interval each for five locations are presented in Figure 8, the wind speed in every particular direction is shown in form of color bins with accompanying legends. The wind direction frequency trends at A–E locations of selected region appear to be similar, with minor differences.
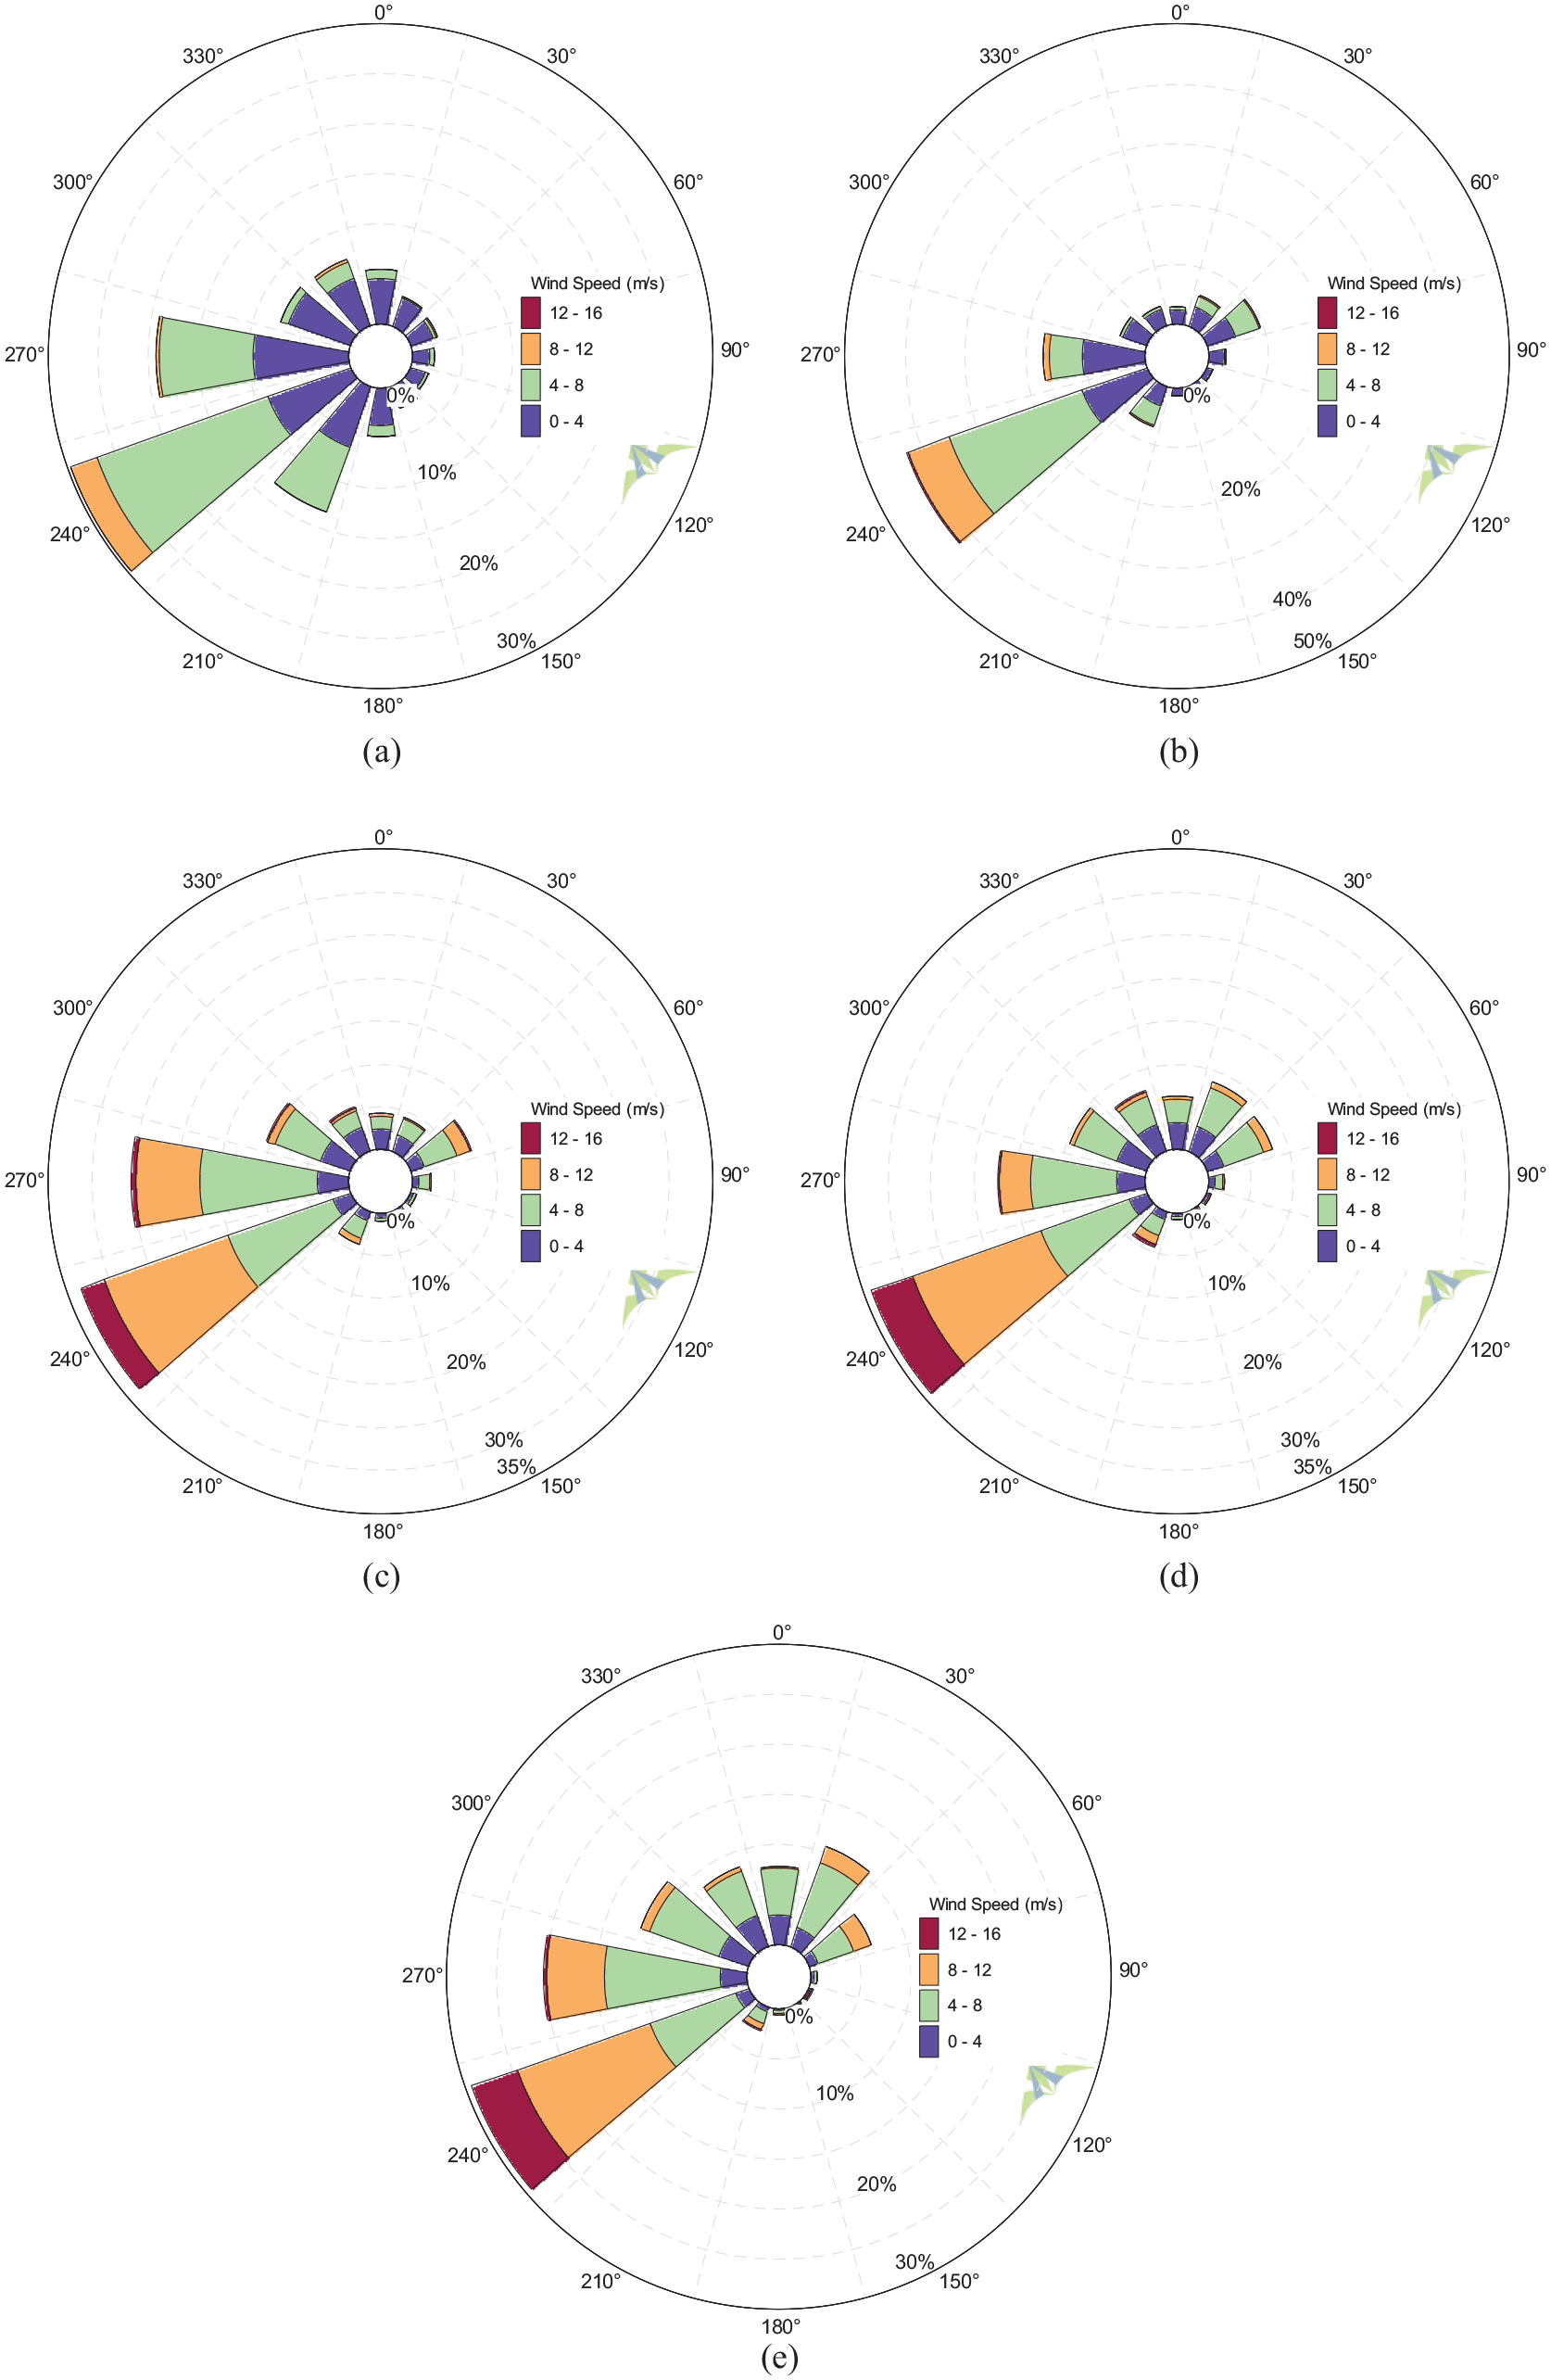
Wind rose diagrams at 100 m height for (a) A—top left corner, (b) B—top right corner, (c) C—central point, (d) D—bottom left corner, and (e) E—bottom right corner.
The dominant wind direction at the five locations is found to be southwest with the maximum occurring frequencies of 30%, 42%, 33%, 34%, and 29% at 240° bin for A–E locations respectively. The consistency in the wind direction patterns throughout the selected region is evident from the wind rose diagrams and the directional behavior at the center of the region are assumed valid for the whole region. Based on results of this novel approach, it is suggested that for installation of offshore wind plant, directional trends for complete plant area are needed not to be assessed rather directional behavior at its center can be assumed same over whole wind farm. Overall, a frequency distribution of about 70% is observed within a span from 200° to 300° taking north as reference, for prevailing southwest. This information can be used when performing layout optimization of offshore wind farms in terms of turbine spacing and optimum orientation for a specific offshore site.
Conclusion
Several developing countries, including Pakistan, do not have measured wind data for offshore regions which hinders progress toward offshore resource assessment. An approach presented in this study is to evaluate reanalysis data against measured data at coastline to find uncertainty and then perform offshore resource assessment in nearby region with known uncertainty. The only wind mast at coastline of Pakistan was selected for application of proposed approach to assess offshore wind potential of the EZZ of Pakistan, which was not performed before. This approach can be adopted by researchers to assess offshore wind potential for other regions.
The evaluation of ERA5 reanalysis wind data at 100 m height was performed against mast measured data at a coastline location to check its accuracy to use for wind resource assessment. The reanalysis data shows slight underestimation, the percentage bias of hourly wind speed and wind direction was −0.2% and −0.9% respectively. The most probable reanalysis wind speed using Weibull frequency distribution shows overestimation with percentage difference of 2.8%. The dominant wind direction was southwest shown by both measured and reanalysis data, same occurrence of about 70% was observed from 200° to 300° span. The reanalysis wind data shows good agreement with measured data with reasonable accuracy and lower uncertainty so it can be used for offshore wind resource assessment in nearby regions.
The assessment of wind resource was performed for a region in the EZZ of Pakistan in terms of mean wind speed and WPD using 15 years ERA5 reanalysis data at 100 m height. The annual mean wind speed and WPD of whole selected region is 6.23 m/second and 258 W/m2 respectively. The range of monthly mean wind speed and WPD of the region was 4.03–8.67 m/second and 73–515 W/m2 respectively. The maximum wind potential was observed in Summer and minimum in Winter, which is synchronized with trend of electricity demands. The wind speed and wind direction of the selected region was assessed in terms of Weibull frequency distribution and wind rose diagram to find most probable wind speed and dominating wind direction, at corners and center of the region. The most probable wind speed at two onshore locations ranges from 4.41 to 4.85 m/second whereas for three offshore locations ranges from 7.34 to 7.64 m/second, this depicts significant offshore power potential compared to onshore. The dominant wind direction for all locations was observed as southwest with more than 70% wind speeds frequency occurrence. This wind resource assessment shows promising potential for offshore wind power generation in the selected region. The selected region can be further narrowed down for offshore wind farms for specific ocean depth conditions.
Footnotes
Declaration of conflicting interests
The author(s) declared no potential conflicts of interest with respect to the research, authorship, and/or publication of this article.
Funding
The author(s) received no financial support for the research, authorship, and/or publication of this article.