



Abstract
Renewable energy technologies offer the promise of clean and abundant energy harvested from natural resources, self-renewable sources such as sun, wind, water, earth, and plants. In this work, we optimize the hybrid system using Homer power program, where the hybrid system is composed by solar panels, wind turbines with batteries to supply 20 homes that are not equipped with electricity in Ouzera area (Medea, Algeria), and by taking the results presented by the Homer program for Ouzera region, we obtained the cost of each day, of each season and the cost of energy ($/kWh), as well as the optimal number and characteristics for each solar panels and wind turbines with storage batteries. The homer software allows us to obtain real results in taking into account the constraints cost and variations in off-grid weather data. The most important criterion of this technique for optimizing renewable energy systems was the cost, seeking to minimize the expenses, while ensuring optimum quality and continuity of electricity supply.
Introduction
Energy consumption continues to increase. Most of the energy consumed comes from fossil fuels (oil, natural gas, coal, etc.) whose massive use can lead to the depletion of these reserves and really threatens the environment. This threat has manifested itself mainly through pollution and global warming of the earth by greenhouse effect (Gu et al., 2023).
Renewable energies, also called green, alternative or clean energies, have brought a lot of solutions to the problems encountered during the exploitation of energies fossils. Indeed, renewable energies have a positive ecological impact, and they meet international pollution control standards (Ming et al., 2017).
Questions raised by global energy consumption relate to the impact of climate change and the depletion of energy resources. Currently, more than 85% of the energy produced comes from materials fossil fuels such as oil, coal, natural gas or nuclear energy, which makes electricity production largely dependent on sources conventional energy sources that will eventually run out. Forms of electricity production have considerable environmental impacts such as gas emissions greenhouse effect causing irreversible climate change or storage problems radioactive waste resulting from long-term nuclear radioactive contamination (Maleki et al., 2017a, 2017b).
Renewable energy technologies, such as photovoltaics and wind turbines, are growing and can produce electricity or heat (Maleki, 2018). However, their deployment is limited by cost and technological issues. Over the past decades, the photovoltaic generators and wind turbines have seen a considerable improvement in their efficiency and reliability, while investment costs have been reduced (Eltamaly and Mohamed, 2014; Yahiaoui and Tlemçani, 2022).
The most widely used renewable energies are solar, wind and hydraulics. However, wind speeds and solar irradiation are not constant and depend on weather conditions. Hence the interest and to hybridize them in order to attenuate the intermittent effect of the latter, by compensating one with the other. This balances the flow of production and meet the needs of the load. In addition, for standalone use (off grid), a system storage will be essential. In general, batteries are the most used (Erdinc and Uzunoglu, 2012; Mohamed et al., 2016).
In this study, we will use two sources of renewable energy, solar energy and wind energy, to supply electricity to 20 independent homes. In order to ensure optimum operation, it is essential to accurately size the whole system. In addition, energy management is necessary to regulate the flow of power between the different subsystems: the wind generator, the photovoltaic generator and the battery storage system.
Mathematical model of proposed hybrid system components
Photovoltaic system
A PV panel can produce its peak power under standard conditions such as 1000 W/m2 and 25°C. However, in this study the effect of temperature is not taken into account in PV generation model. Hence, the output power of the PV panel is calculated as follows (Yahiaoui et al., 2016, 2017):

Where PPV is the output power of the photovoltaic panel, I is solar radiation, ηPV is the photovoltaic tracking efficiency, and A designated the area of PV panel.
Wind turbine system
For a wind turbine, if the wind speed exceeds the cut-in speed, the wind turbine begins to produce energy. If the wind speed is equal to or greater than the rated wind speed of the wind turbine, the generator will produce constant power. However, if the wind speed exceeds the cut-off speed of the wind turbine, the wind turbine stops generating to protect the turbine and component from damage. The expression of the instantaneous produced power of each wind turbine (

Where υ is the wind speed, Pr is the rated power of the wind turbine, and

The batteries
Due to the intermittent nature of wind resources, battery storage systems have become a common part of most hybrid setups. Battery storage system changes in response to the hybrid system configuration. The state of charge of the battery is obtained as follows: when the power total of the wind turbine is greater than the load demand, the battery is switched to state of charge using the excess energy produced by the wind turbine to be charged. The amount of battery charge at time t is estimated as follows (Kamarzaman et al., 2022):

Where, Pbat(t) is the input/output power (positive during charging and negative during discharging) of batteries. Δt is each simulation time step that is assumed to be an hour. The round-trip efficiency ηbat is defined as 80% for charging and 100% for discharging models. Additionally, Nbat, Cbat, and Vbat denote the number of batteries, the nominal capacity and the nominal voltage of each battery, respectively.
The battery model retains the SOC between the lower limit (SOCmin) and the upper limit (SOCmax) to ensure safety. The charge and discharge mechanism of battery banks depends on the condition of generated power in the hybrid system. Due to intermittent power from PV panels and/or wind turbines, power from battery bank is required whenever these two sources are unable to supply the sufficient power required by the load demand. Whereas, if the power produced from these two sources exceeds the load demand power, the excess power will be stored in the batteries storage system. On the other side, if this excess power is not sufficient for charging the batteries, the diesel generators can sustain the operation of the batteries charging. The variation of the open circuit voltage as a function of the state of charge (SOC) is shown in Figure 3. The battery model adopted is that which makes it possible to predict the autonomy of the system, that is to say to allow at any moment to estimate the remaining energy (state of charge or depth of discharge (D0D) in the battery. Considering the DOD variable as a parameter varying between 0 and 1, depending on whether the battery is fully charged or fully discharged as shown in equation (5).

The capacity of the batteries in Wh can be calculated by the following equation (Kamarzaman et al., 2022):

Where,
Converter
The various electrical devices in our system do not operate at the same voltage or are not of the same type: we have direct current (DC) or alternating current (AC). We therefore need to insert DC/AC converters and/or DC/DC (voltage step-up or step-down) in order to be able to connect with each other. And it expresses the conversion efficiency, for all types of converters, according to the following equation (Kamarzaman et al., 2022):

Where, a and b are constants,

Where,
Economic parameters for hybrid renewable energy system
In the HOMER system, it is essential to provide the annual interest rate as an input parameter. It is possible to estimate the annual interest rate as follows (Yilmaz and Dincer, 2017):

Where, I is the interest rate,
The discounted energy price corresponds to the average cost of producing useful electricity from the hybrid system. It is possible to estimate this cost using the following equation (Buonomano et al., 2018; Yilmaz and Dincer, 2017):

Where, EL is the load demand, r is the interest rate, that equal 0.06 in this work and n represent the lifespan of each component.
The NPC can be calculated based on the capital cost (CC), the replacement cost (RC), the maintenance cost (MC), the emission cost (EC) produced by diesel generators, and the total salvage cost (S). The case study presented in this paper is taken from Ouzera, Algeria (Medea).
The total net present cost is calculated according to the following equation (Rohani and Nour, 2014):


Where,

In this work, the units that need replacement are the wind turbine and the battery bank. Hence, the

Where,

The total maintenance cost of the system can be obtained by the following equation (Cho et al., 2016; Ma et al., 2014):

Where,
Simulation results and discussions
For an installation to be effective it will depend on the rigor of its sizing and its use, the control of dimensioning of the various components of the system hybrid power generation is necessary because it affects the cost and performance of our system. Solar energy and wind energy are highly dependent on the conditions meteorological (sunshine, wind speed and temperature) of the installation site of the hybrid energy system.
To optimize the installation proposed in our research work (PV/wind with batteries), we will use the Homer software. The software will be used to a better evaluation of the economic costs. A simulation of the entire system hybrid will be made on this tool in order to offer us an optimal economic and energy choice.
Presentation of site data
In this project, we supply electricity to an unconnected (off-grid) house electricity), through the use of a hybrid system for the production of energy in a city in Algeria.
Medea (Ouzera) is an inland city located between 15 and 36°N latitude and 45 and 2° de longitude E, with an altitude of 894 m (Figure 1) (http://www.longitude-latitude-maps.com/city/2_548,Ouzera,Medea,Algeria).
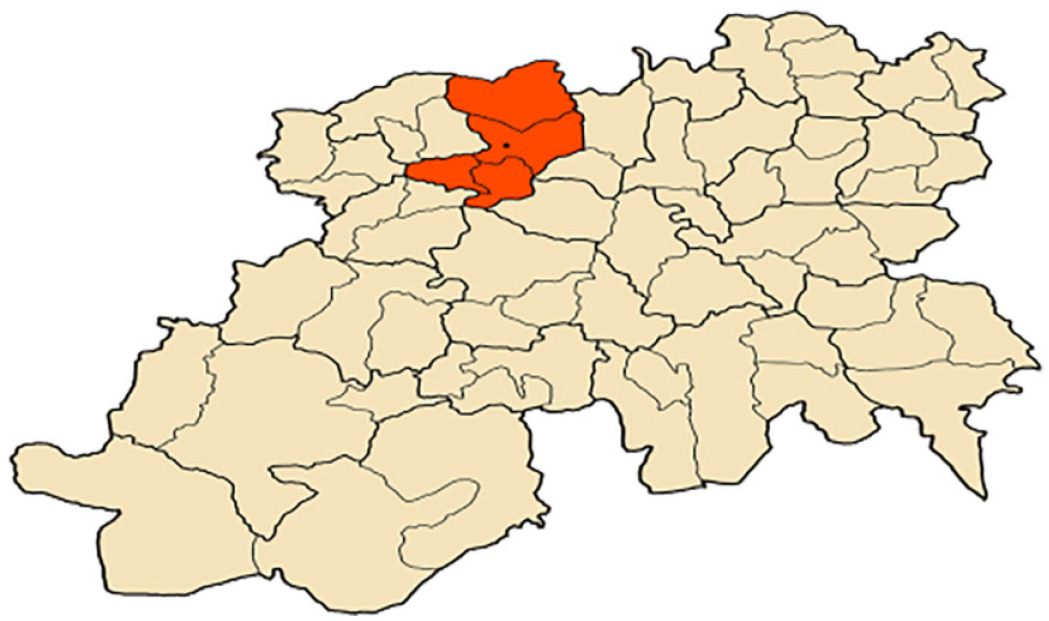
Geographical location of the site under study (https://www.pngwing.com/en/free-png-tbngx).
We have retrieved weather information from the year 2022, including (radiation, wind speed and temperature) using the HOMER software and taking into account the characteristics of the site of measurement, we obtained the following results:
Irradiation data
HOMER creates solar radiation values every hour for the four seasons (see Figures 2–5).
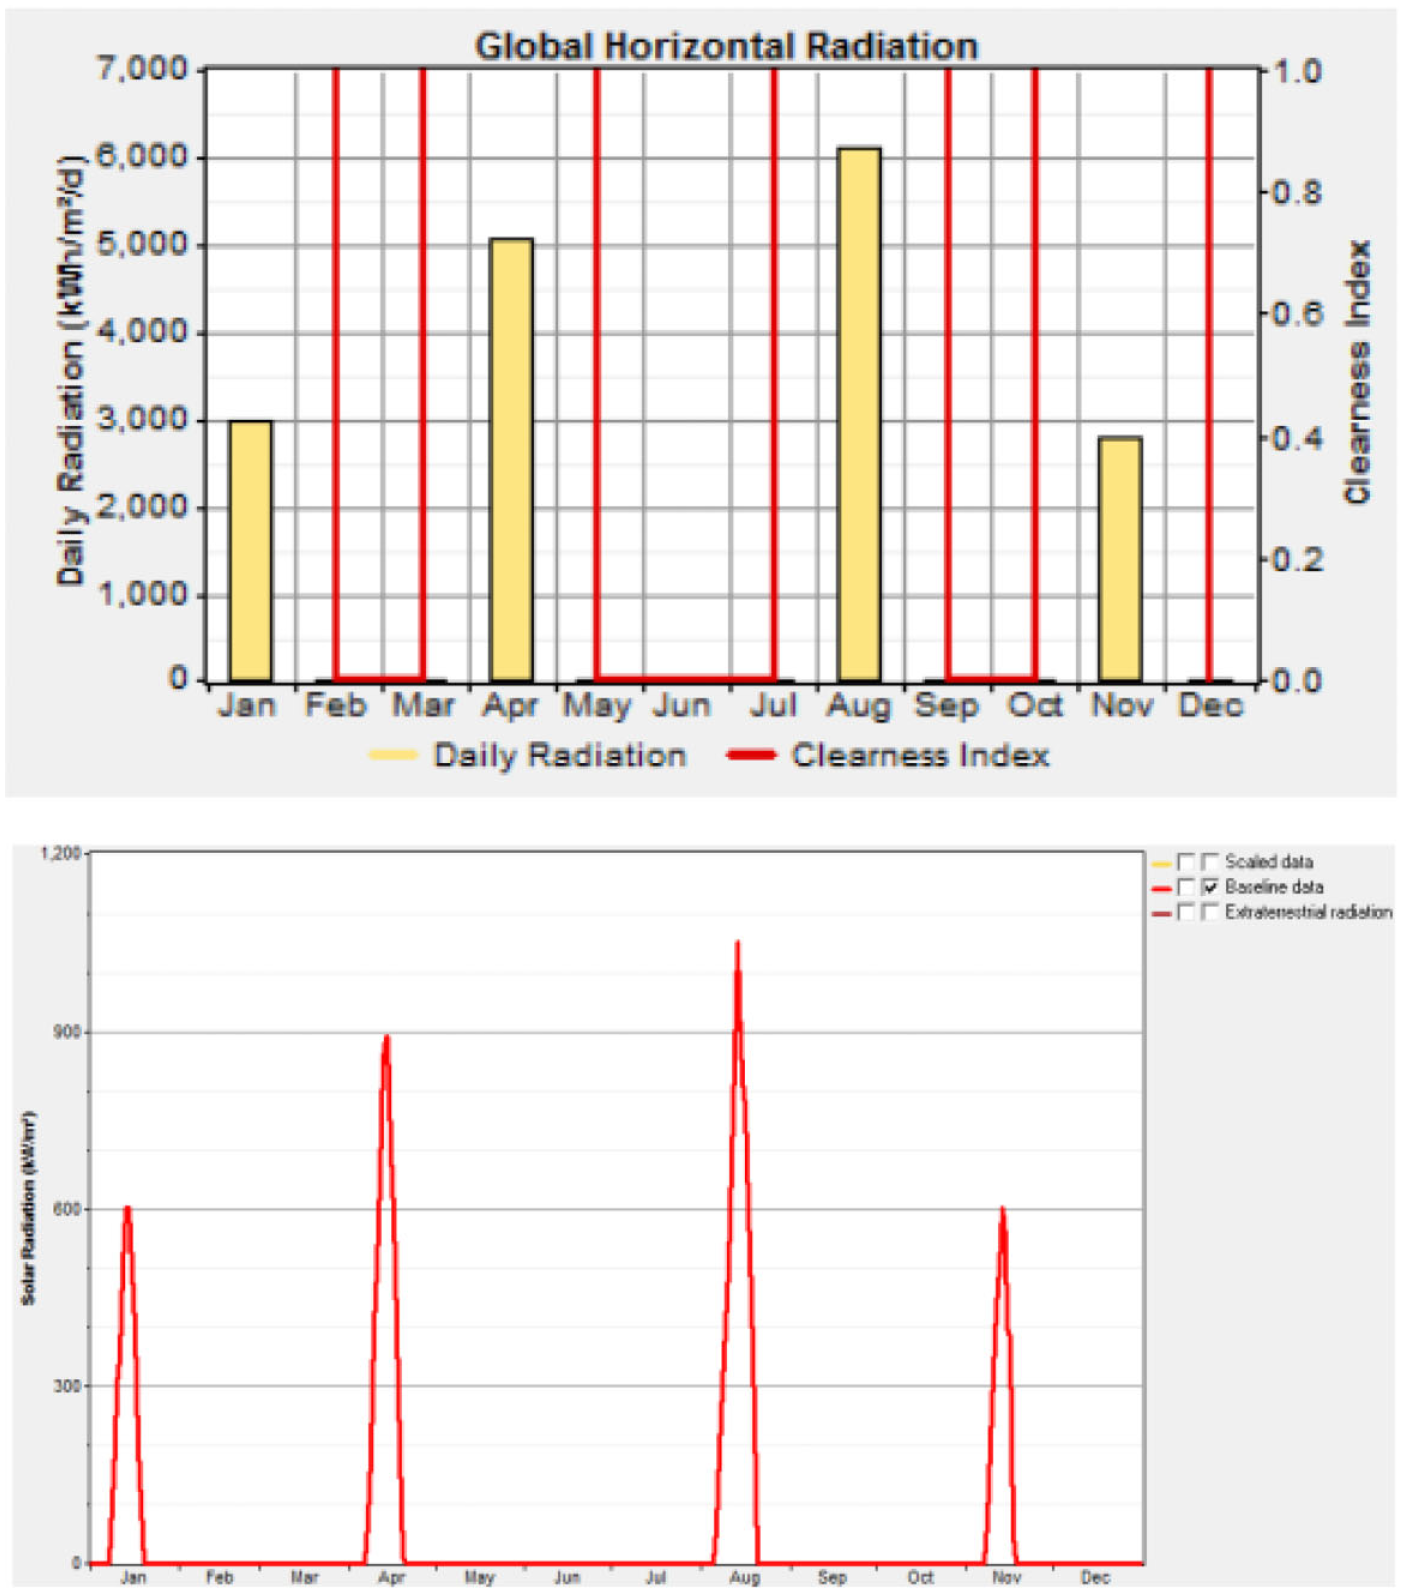
Irradiation for 1 month of each season.
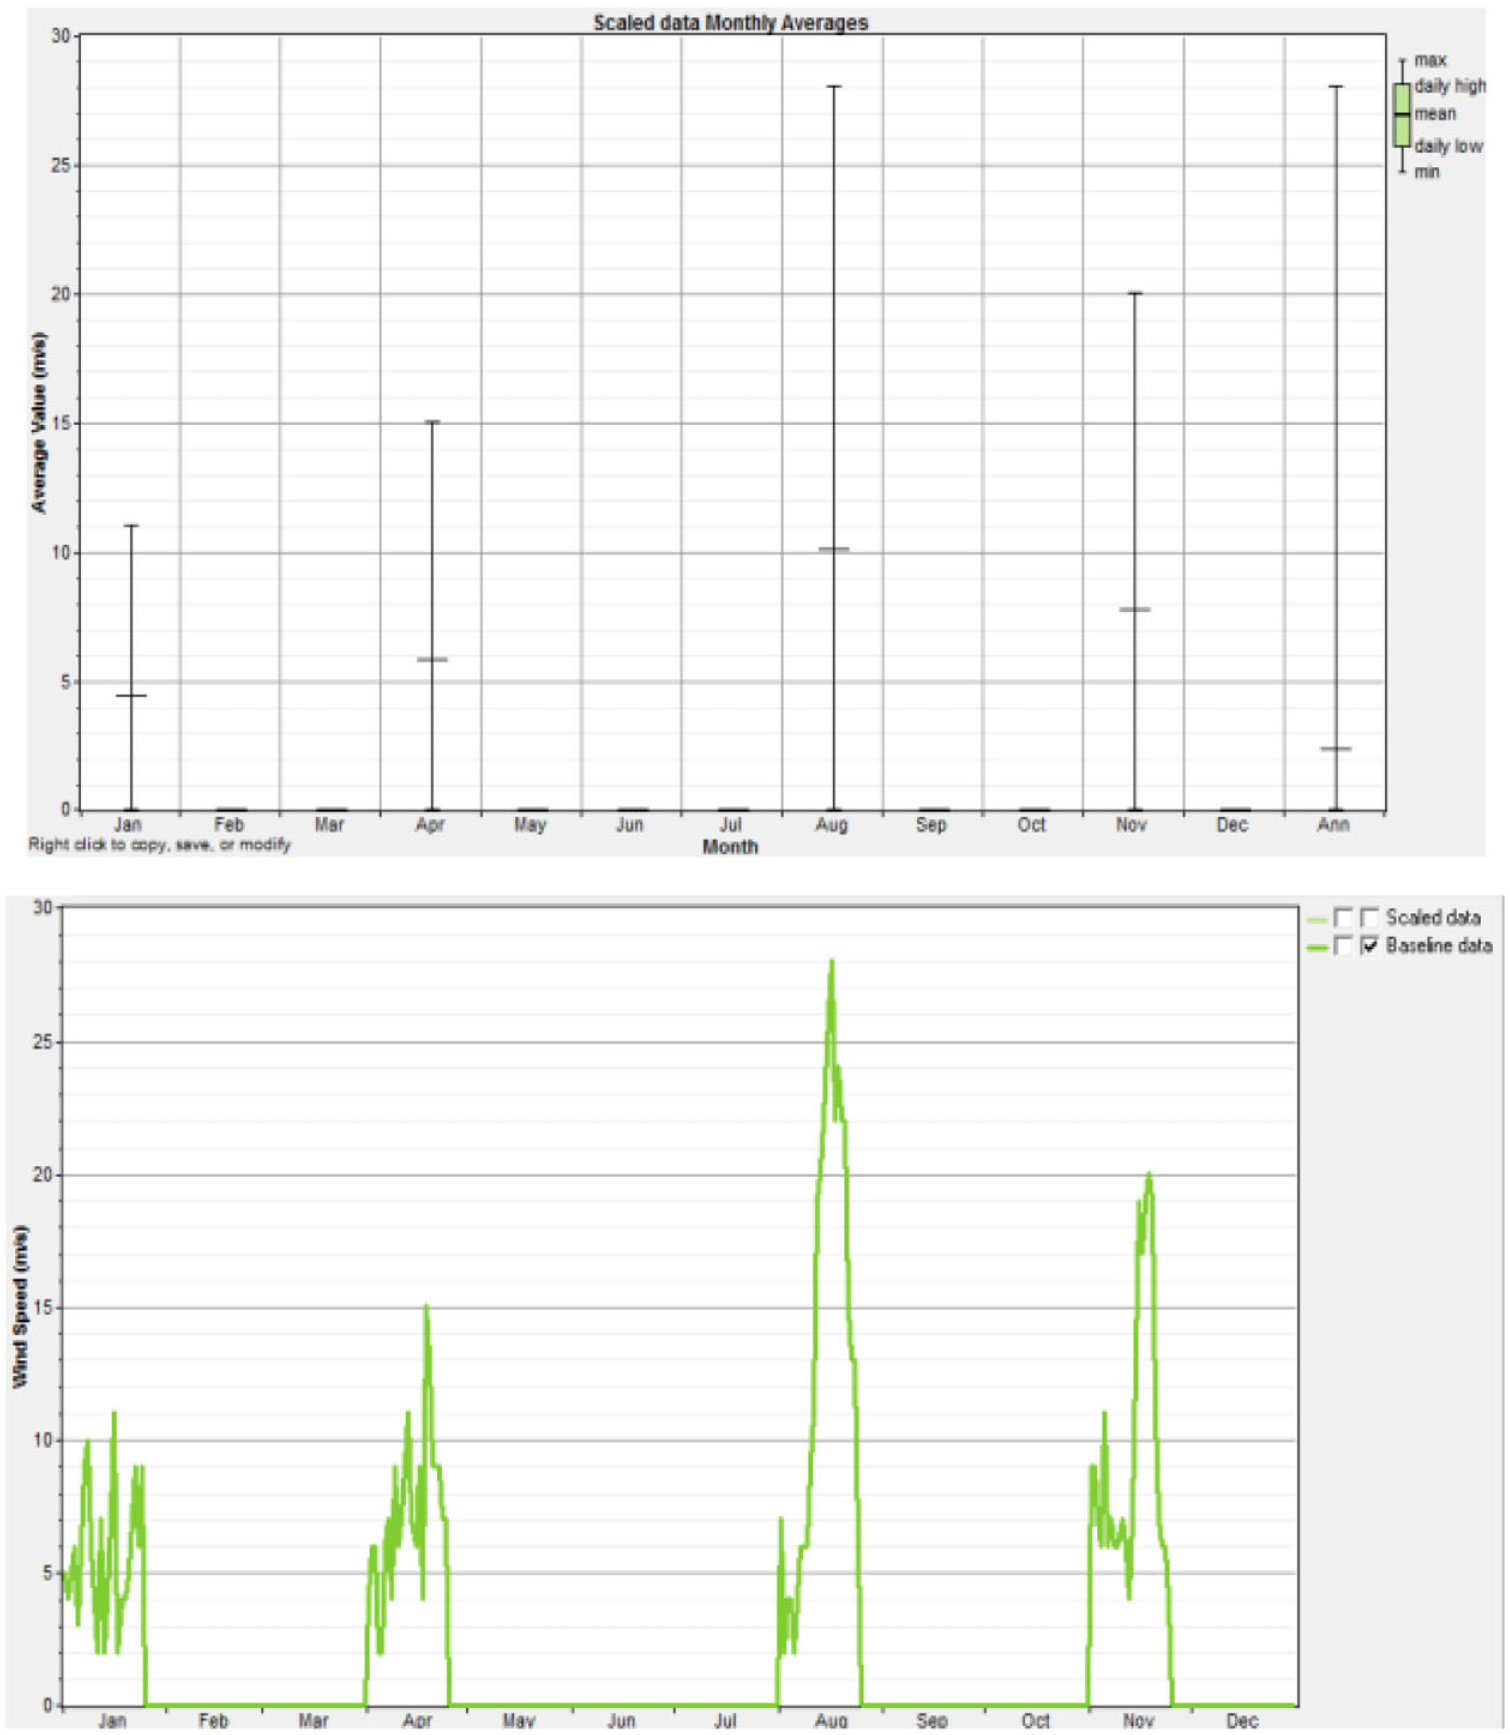
Wind speed profile for 1 month of each season.
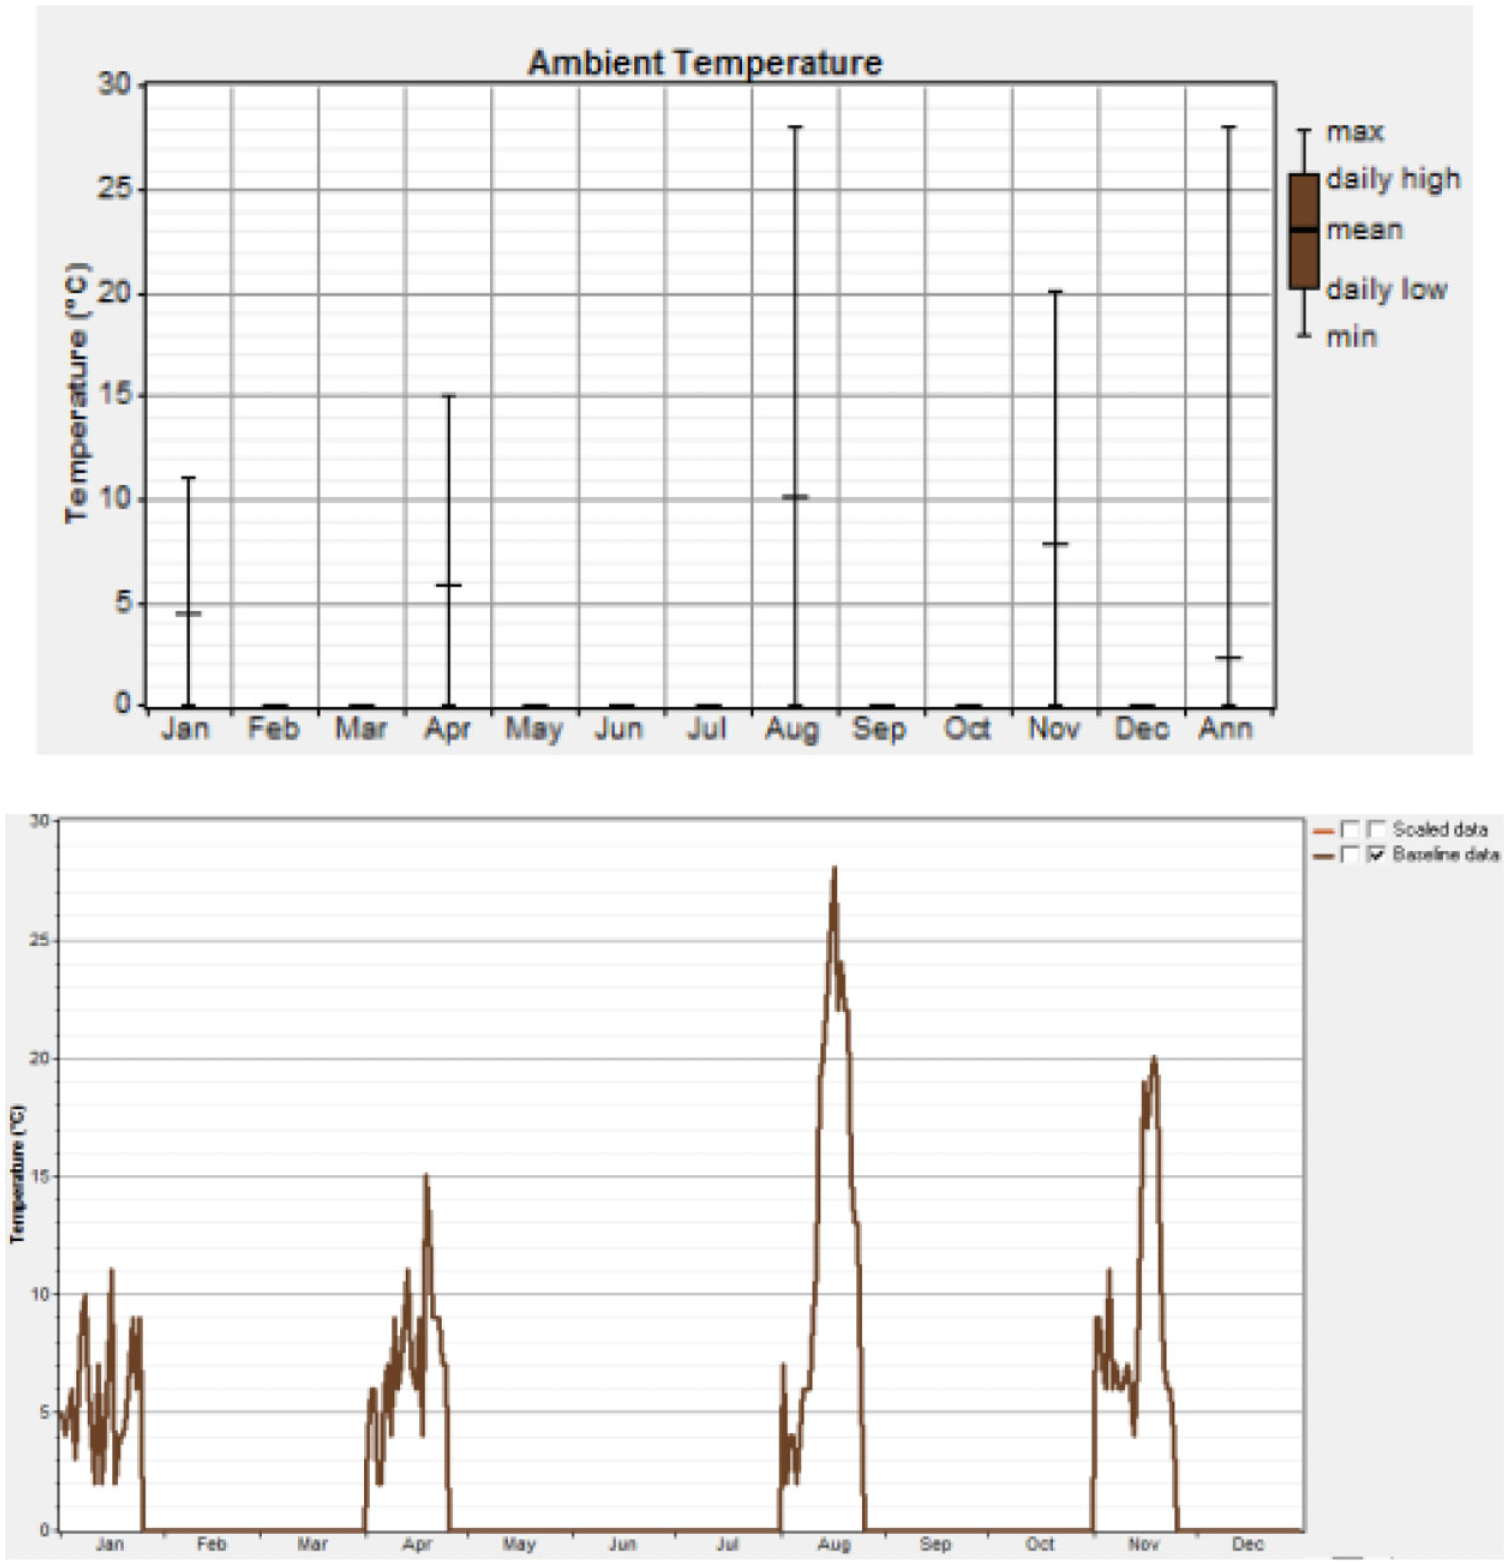
Temperature profile for 1 month of each season.
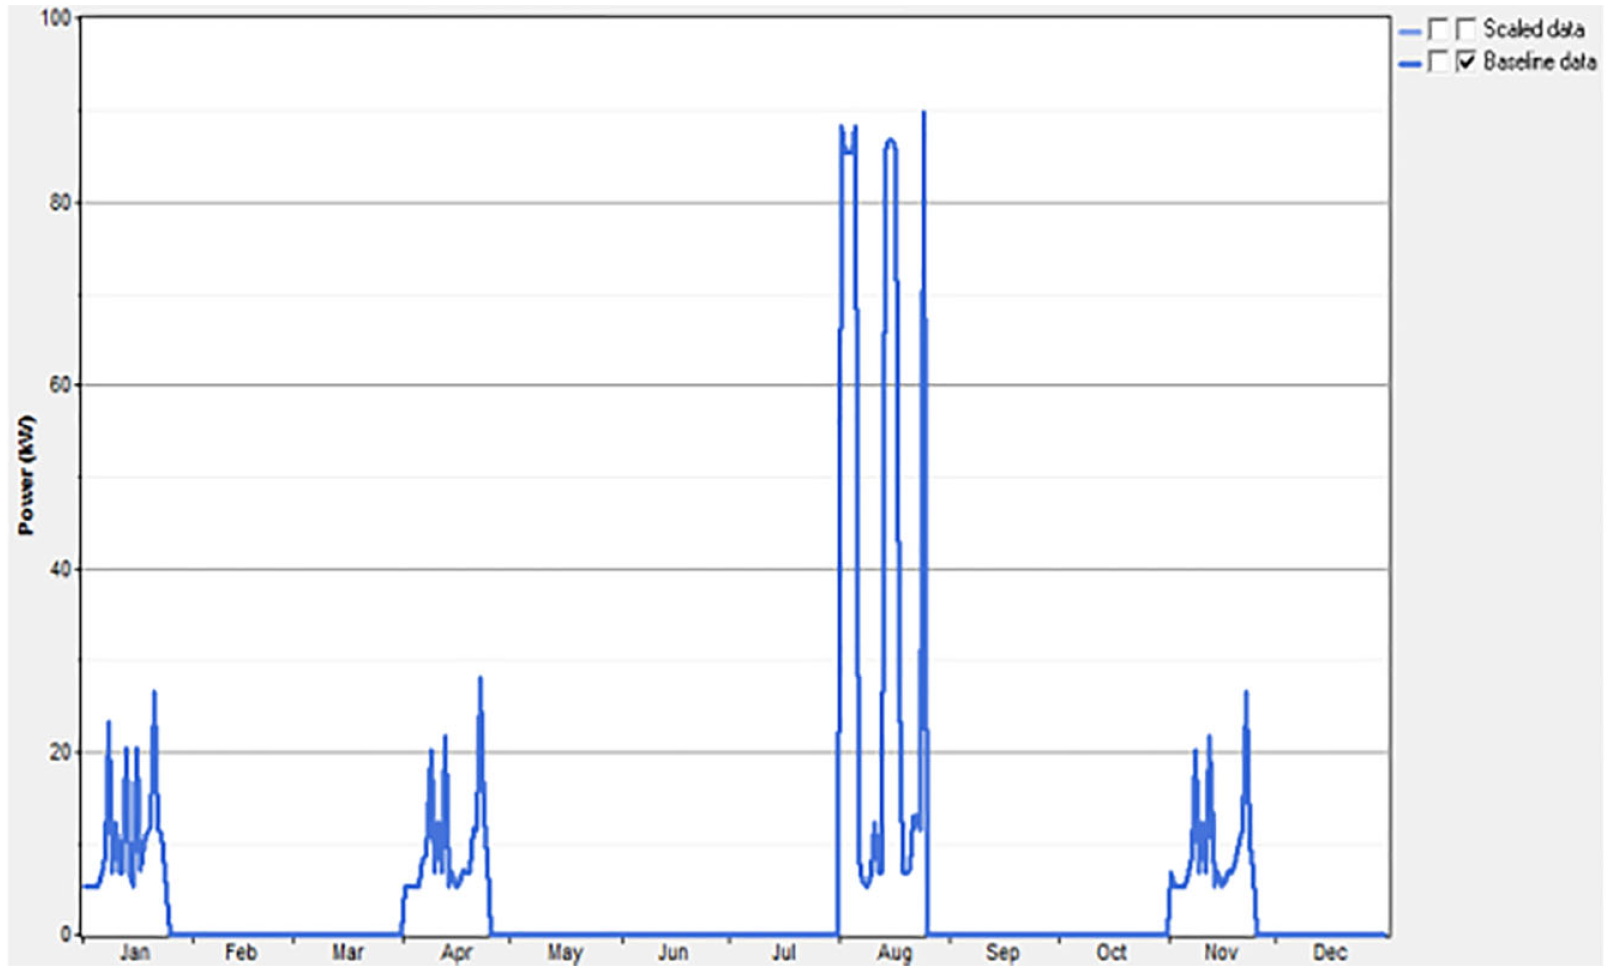
The load profile for 1 month of each season.
Wind speed data
The evolution of the wind speed profile for the four seasons of the year is given by the following figures:
The site of Ouzera (Medea) enjoys an average monthly wind speed of at least 9 m/s at a height of 10 m from the ground. Since most wind turbines require speeds of winds greater than 3 m/s to start, this site is suitable for the use of wind energy.
Temperature data
The graphs in Figure 4 illustrate the variations in the load profile over the four seasons of the year. By studying the histogram of monthly average temperatures, it is possible to note that the hottest month is August, and on the other hand, the month of January is the colder month.
Load profile data
The evolution of the load profile for the four seasons of the year is given by Figure 5.
Figure 5 illustrates the amount of energy consumed on average each month during the year 2022. It is noted that the total energy consumption for the year amounts to approximately 112 kWh/day, which corresponds to a maximum power of 90 kW. This figure shows the hourly load profile for months of January, April, August and November from Ouzera area. We calculate the amount of electricity needed to cover the electrical needs of the village, with a thorough study of all the electrical instruments used (Fridge, WiFi modem, Freezer, Lamps, Charger mobile, Microwave, Television, Washing machine, Computer …), which is represented by the amount of electricity consumed, and the hours of operation through 24 hours (day by day and hour by hour). The load profile consists of 20 homes, taking into account the frequency of electrical devices during their operation under a standard voltage 230 V–50 HZ. The manuscript was updated in this regard.
Construction of hybrid power generation system
As part of the HOMER environment, we have taken into account all the relevant information, including the technical and economic characteristics of the various components as well as meteorological data, to define each element of our installation. We then performed simulation using the data meteorological for each season, varying the components (PV, wind, battery) for each simulation. The objective of these simulations is to determine the simulator most economical to supply energy to the 20 homes (off-grid or autonomous).
Our simulation system consists of PV, wind turbines, batteries, converters, to satisfy the demand for a load that represents for 20 habitats (see Figure 6). The system works as follows:
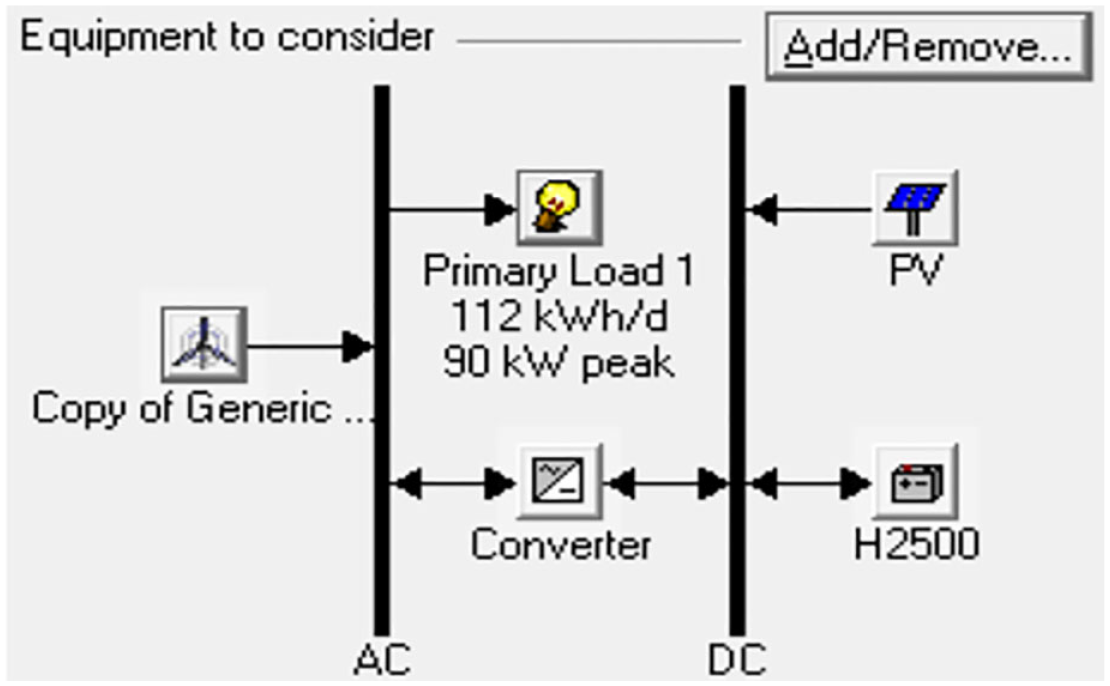
Electric assembly of the hybrid system.
When the energy produced by PV and wind turbines is sufficient to meet the needs of the charge we test the state of the battery
If Pbat < Pbat max the energy loss from the load is used to charge the battery.
If Pbat > Pbat max excess energy is considered a loss.
After the simulation, we obtained the following results:
According to Figure 7 we observe that the first line for each system is the most efficient, because the ranking was based on NPC (Net present Cost) value, ranging from smallest to largest.
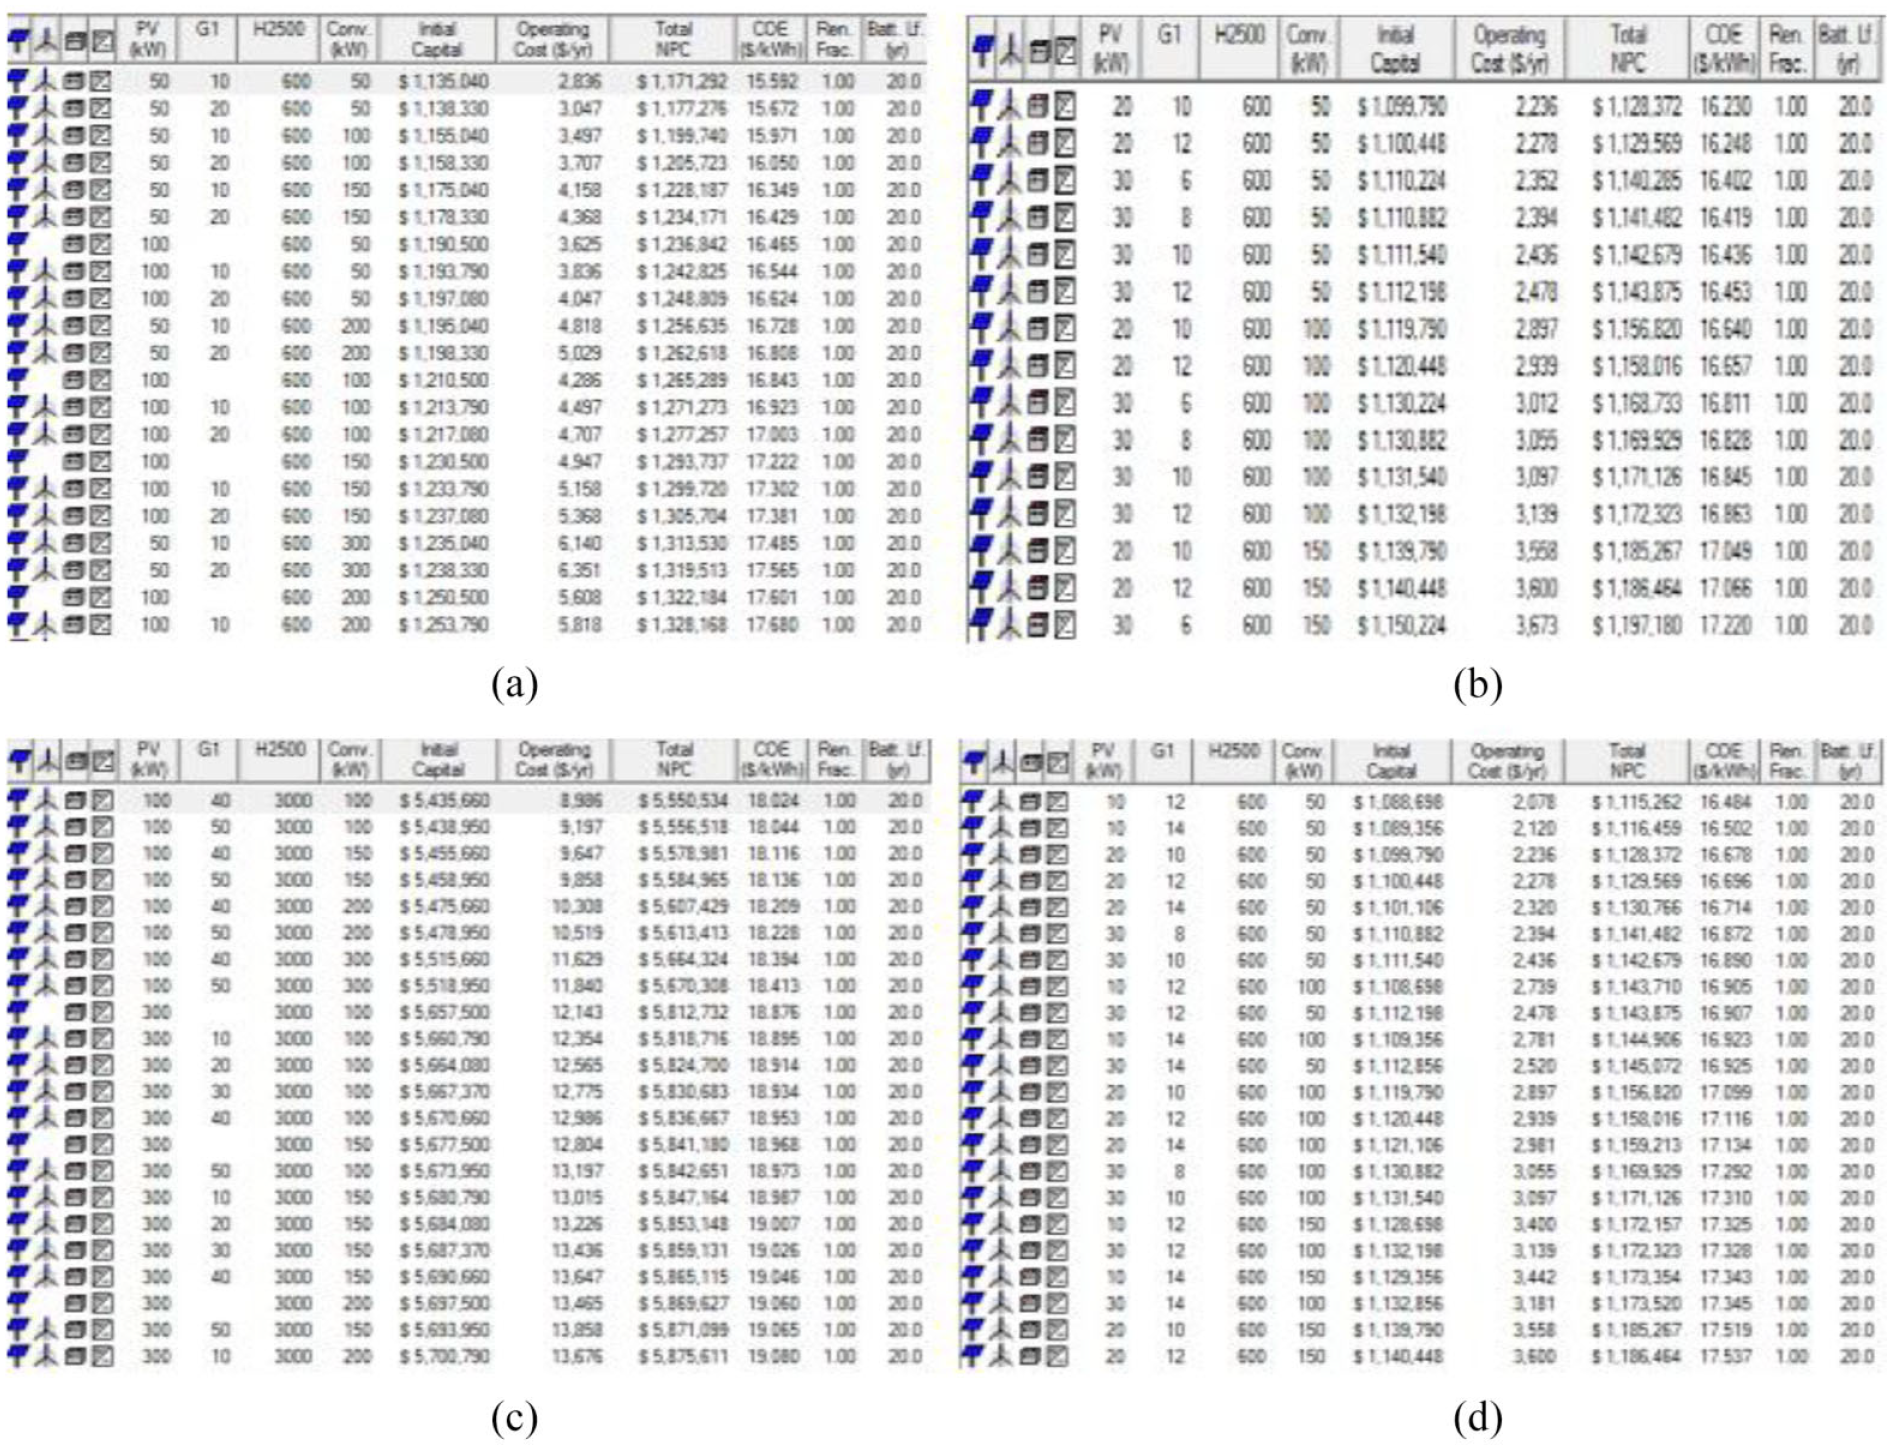
All hybrid system optimized results by HOMER: (a) month of winter, (b) month of spring, (c) month of summer, (d) month of Autumn.
The first line had the smallest value of IC (Initial Capital) with a value of (1,135,040 $) for (A), (1,099,790 $) for (B), (5,435,660 $) for (C), and for (D) (1,088,698 $).
NPC (Net Present Cost) with a value of (1,171,292 $) for (A), (1,128,372 $) for (B), (5,550,534 $) for (C), and for (D) (1,115,262 $). COE (levelized cost of energy) for the year 2022 estimated (15.592 $/kWh) for (A), (16.230 $/kWh) for (B), (18.024 $/kWh) for (C), and for (D) (16.484 $/kWh). After the simulation, the sensitivity of the results is presented in Figure 8.
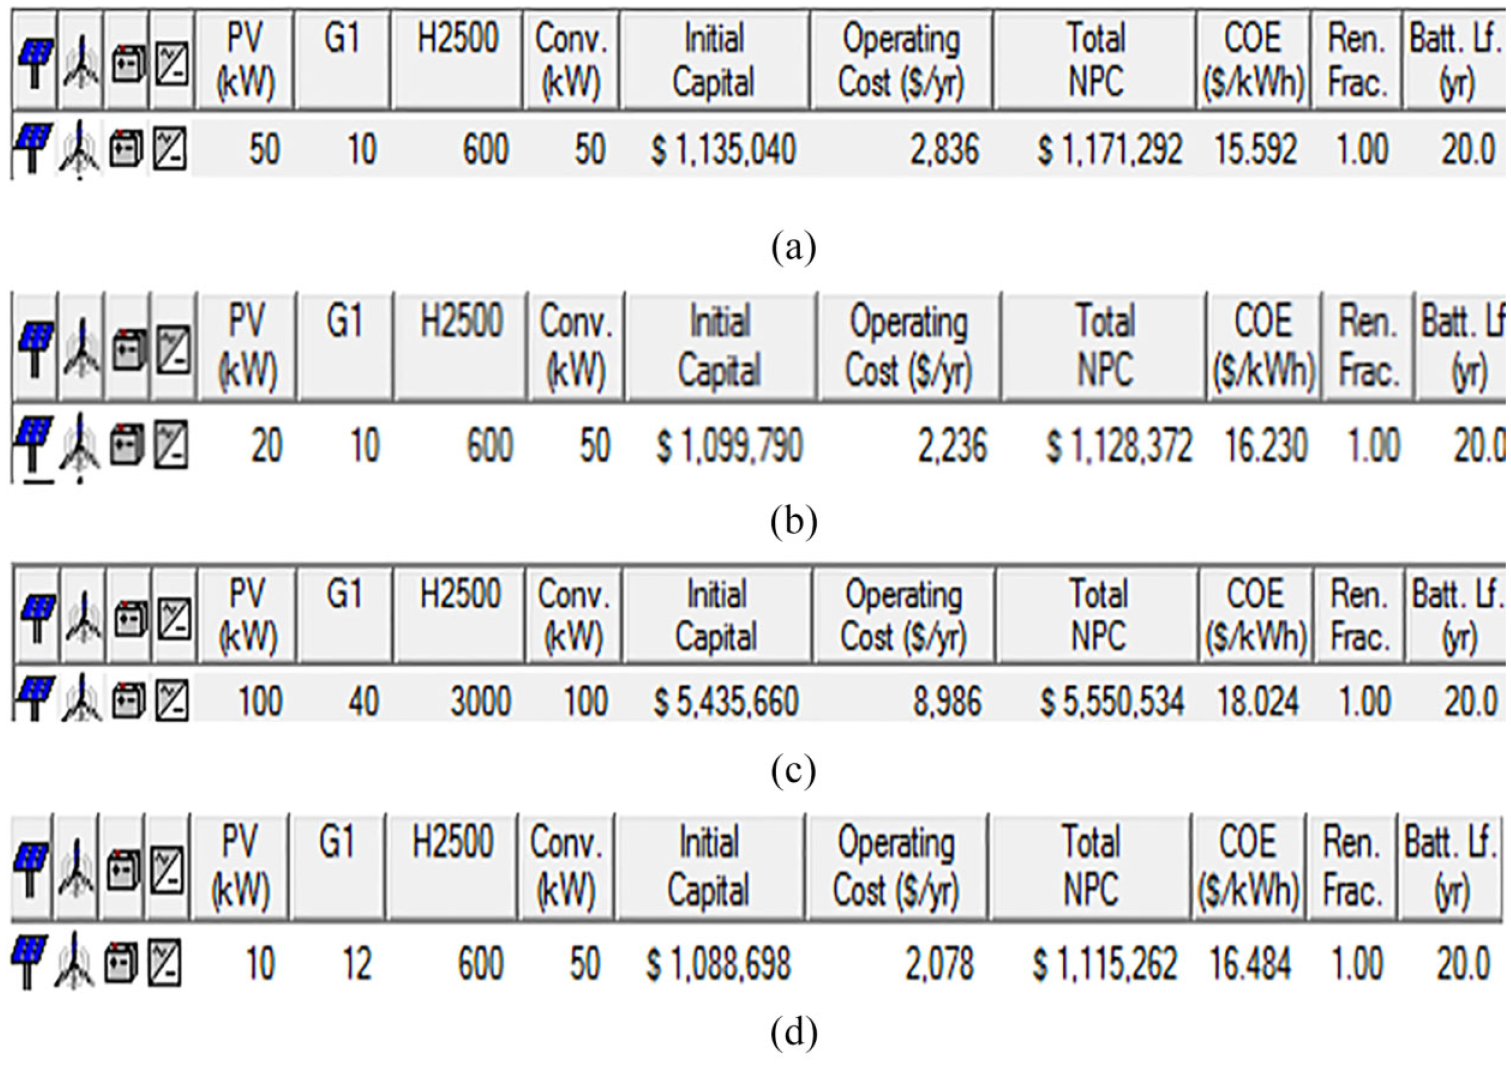
Optimal results for the hybrid system: (a) month of winter, (b) month of spring, (c) month of summer, (d) month of Autumn.
We observe that the hybrid system, composed of solar panels, wind turbines and batteries, is considered the most efficient among the systems studied. This diagram was associated with the total net present cost (NPC) value, ranging from smallest to largest.
From this result, we find that the ideal hybrid system used is the one that consist of (see Figure 9):
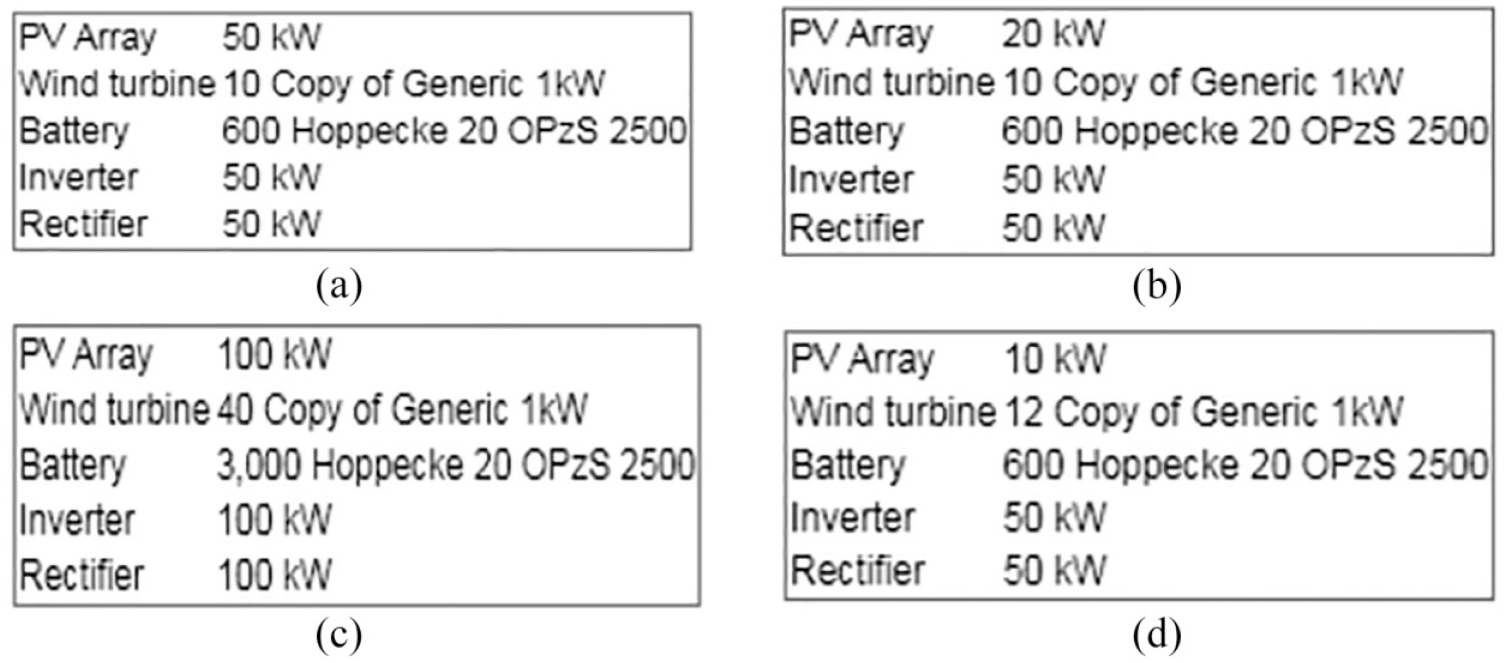
Optimized results from a system: (a) month of winter, (b) month of spring, (c) month of summer, (d) month of Autumn.
To take over the load of four systems, we need the following:
▪ The load of a winter day of 26 kW, it would be necessary to have a system comprising 50 solar panels of 1 kW, 10 wind turbines of 1 kW, 600 Hoppecke 20 OPzS type batteries, as well as 50 converters.
▪ 1 day spring load of 28 kW would require a system including 20 solar panels of 1 kW, 10 wind turbines of 1 kW, 600 Hoppecke 20 OPzS type batteries, as well as 50 converters.
▪ The load of a summer day of 90 kW, it would be necessary to have a system comprising 100 solar panels of 1 kW, 40 wind turbines of 1 kW, 3000 batteries of Hoppecke type 20 OPzS, as well as 50 converters.
▪ Autumn day load of 26 kW would require a system including 10 solar panels of 1 kW, 20 wind turbine of 1 kW, 600 Hoppecke 20 OPzS type batteries, as well as 50 converters.
In reality, HOMER performs the simulation of all possible system configurations hybrids that can perform optimally on a given site by providing enough electrical power to meet the needs of the load, and exhibits the most efficient setup.
Figure 10 illustrates the amount of energy produced by the optimal system.
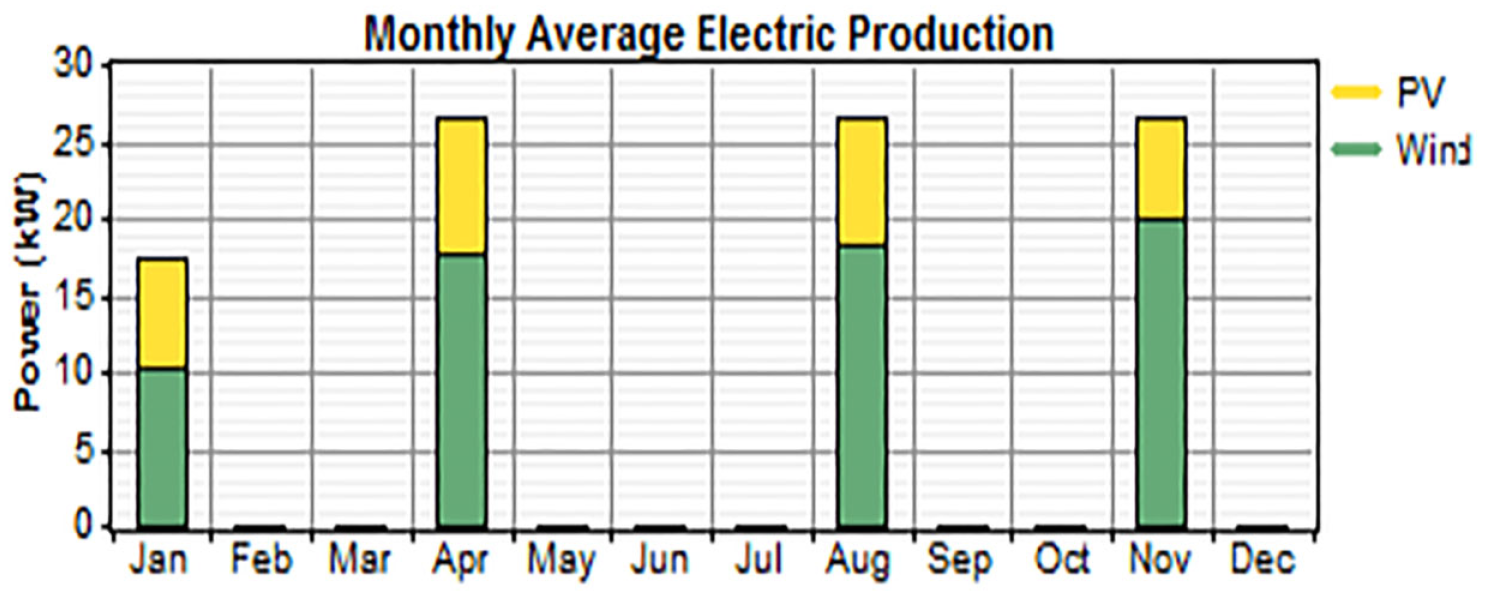
Electricity production quantity of 1 day of each season.
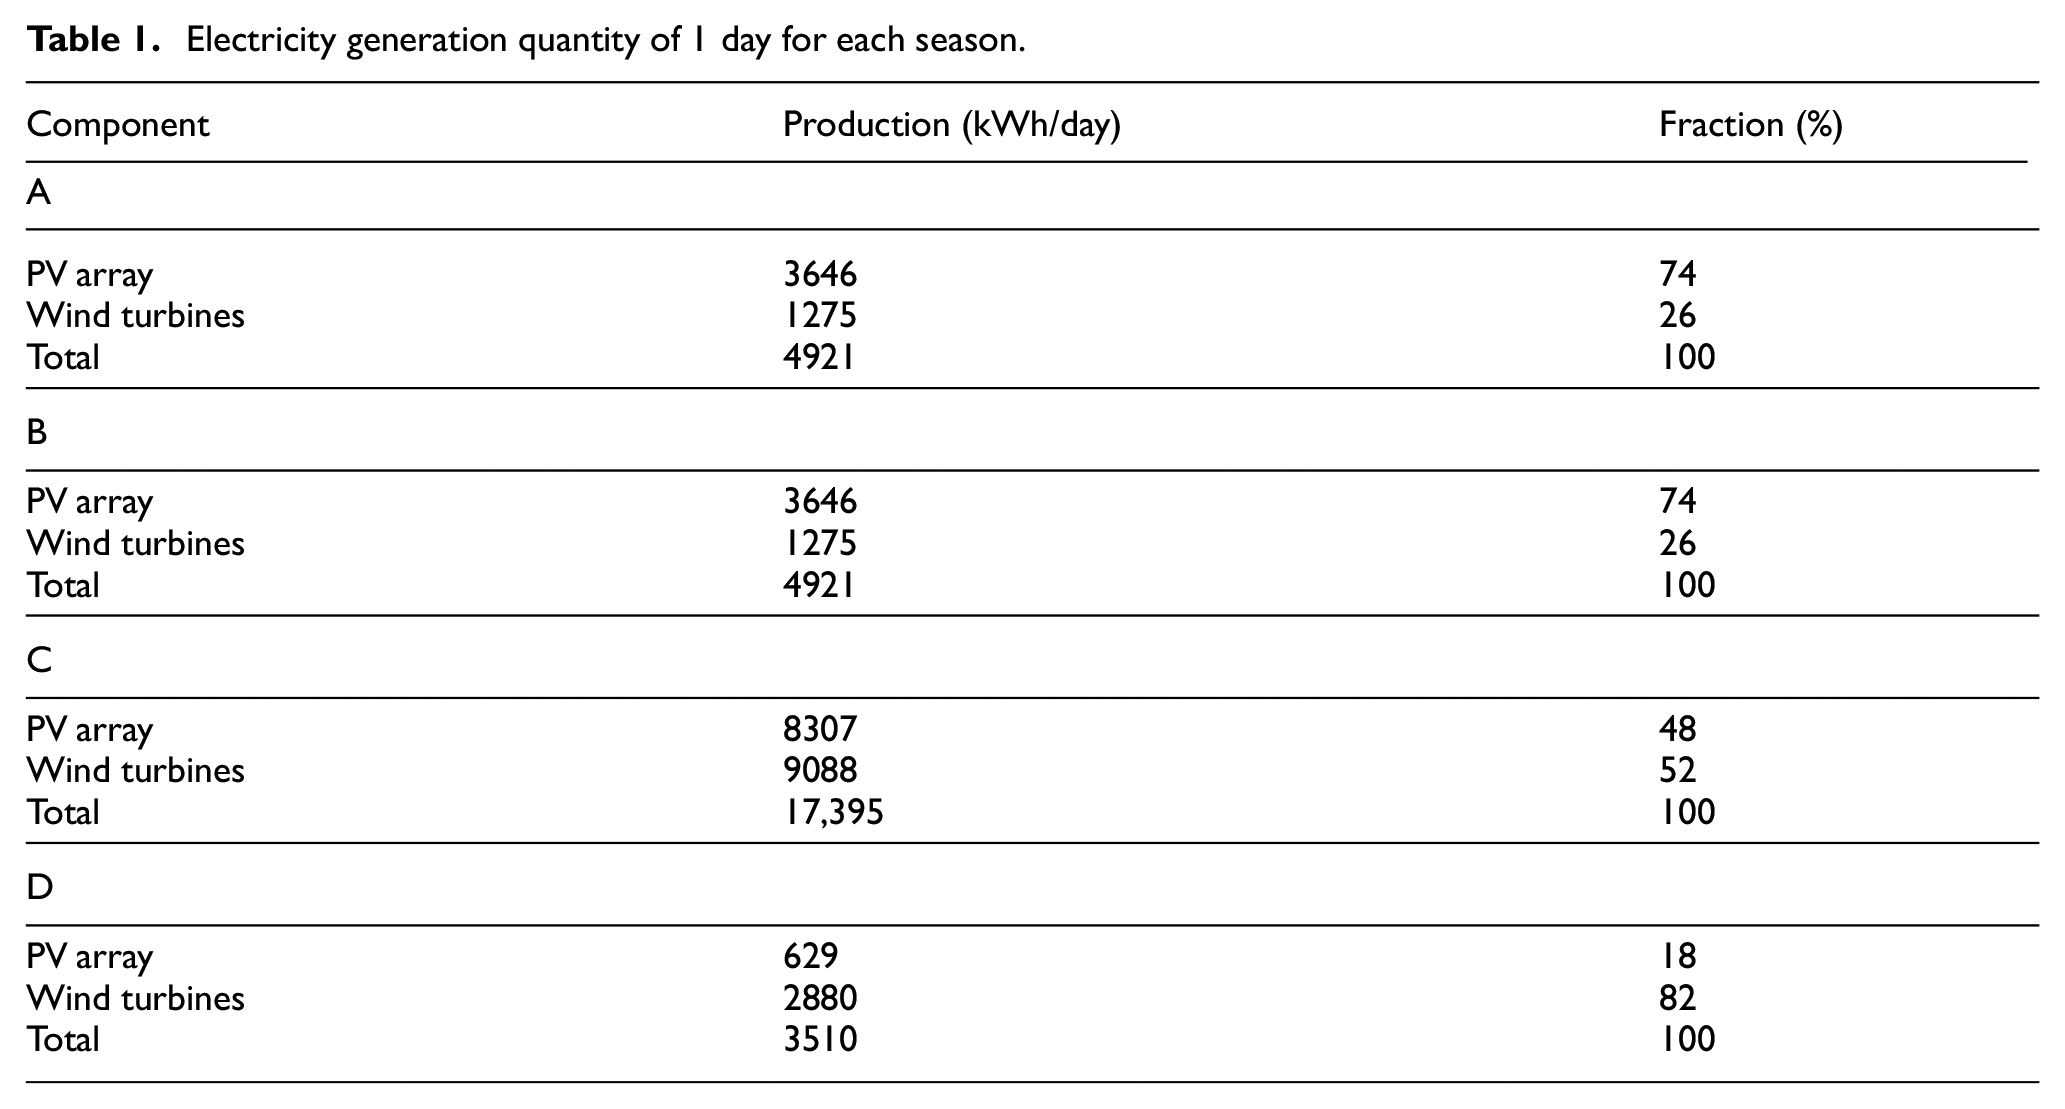
Table 1 present in details the results for four cases. They provide information on the amount of electrical energy produced by each generator during a day of each season. This Table shows that the total daily energy production (PV + Wind) is 4921 kWh/day for the month of January, 4921 kWh/day for the month of April, we see that the total daily energy production are equal for these 2 months explained by the load profiles of January and April which are almost equal. We also note from Table 1 that the total production for the month of August equals 17,395 and 3510 kWh/day for the month of November. So the daily power produced in the month of August is almost four times greater than the other 3 months.
Electricity generation quantity of 1 day for each season.
Photovoltaic panel operating parameters are shown in the Table 2.
Information concerning the energy production by the PV at 1 day for every season.
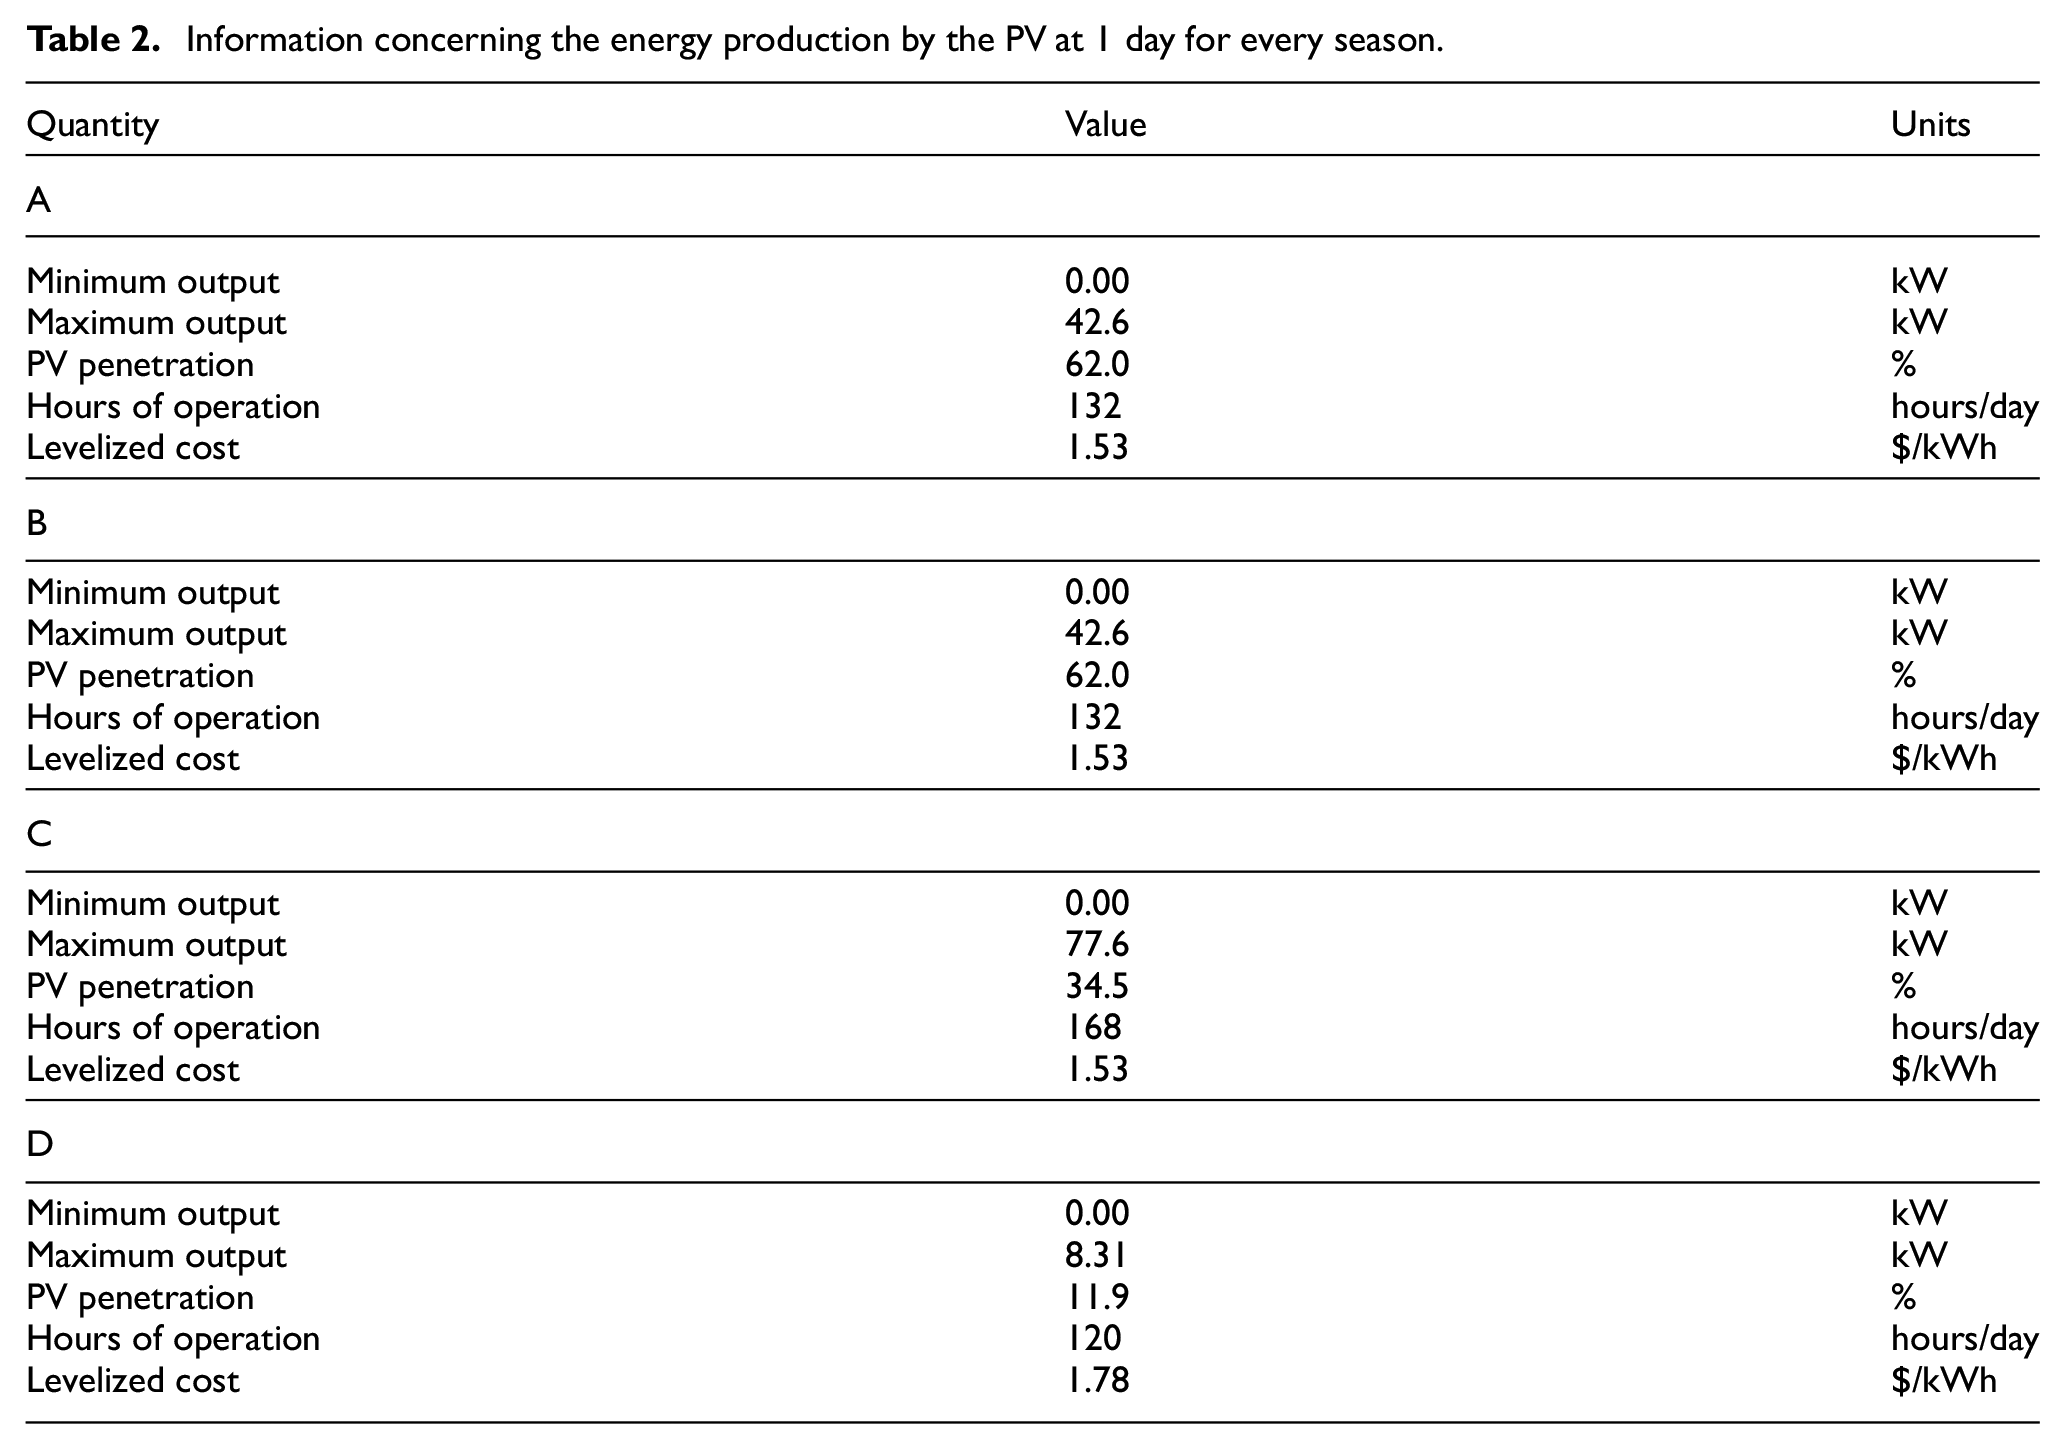
According to Figure 11 we note that the operating time range of the photovoltaic solar panels is limited for 1 day in each season, from 6 a.m. to 6 p.m. The solar panels do not produce any energy during the rush hour at 8 p.m., in accordance with the daily load profile, which requires the use of other generators or the use of energy stored in the batteries to meet load demand.

Operation of photovoltaic generator.
Wind generator operating parameters are shown in Table 3 and Figure 12.
Information regarding the production of wind energy in a day for every season.
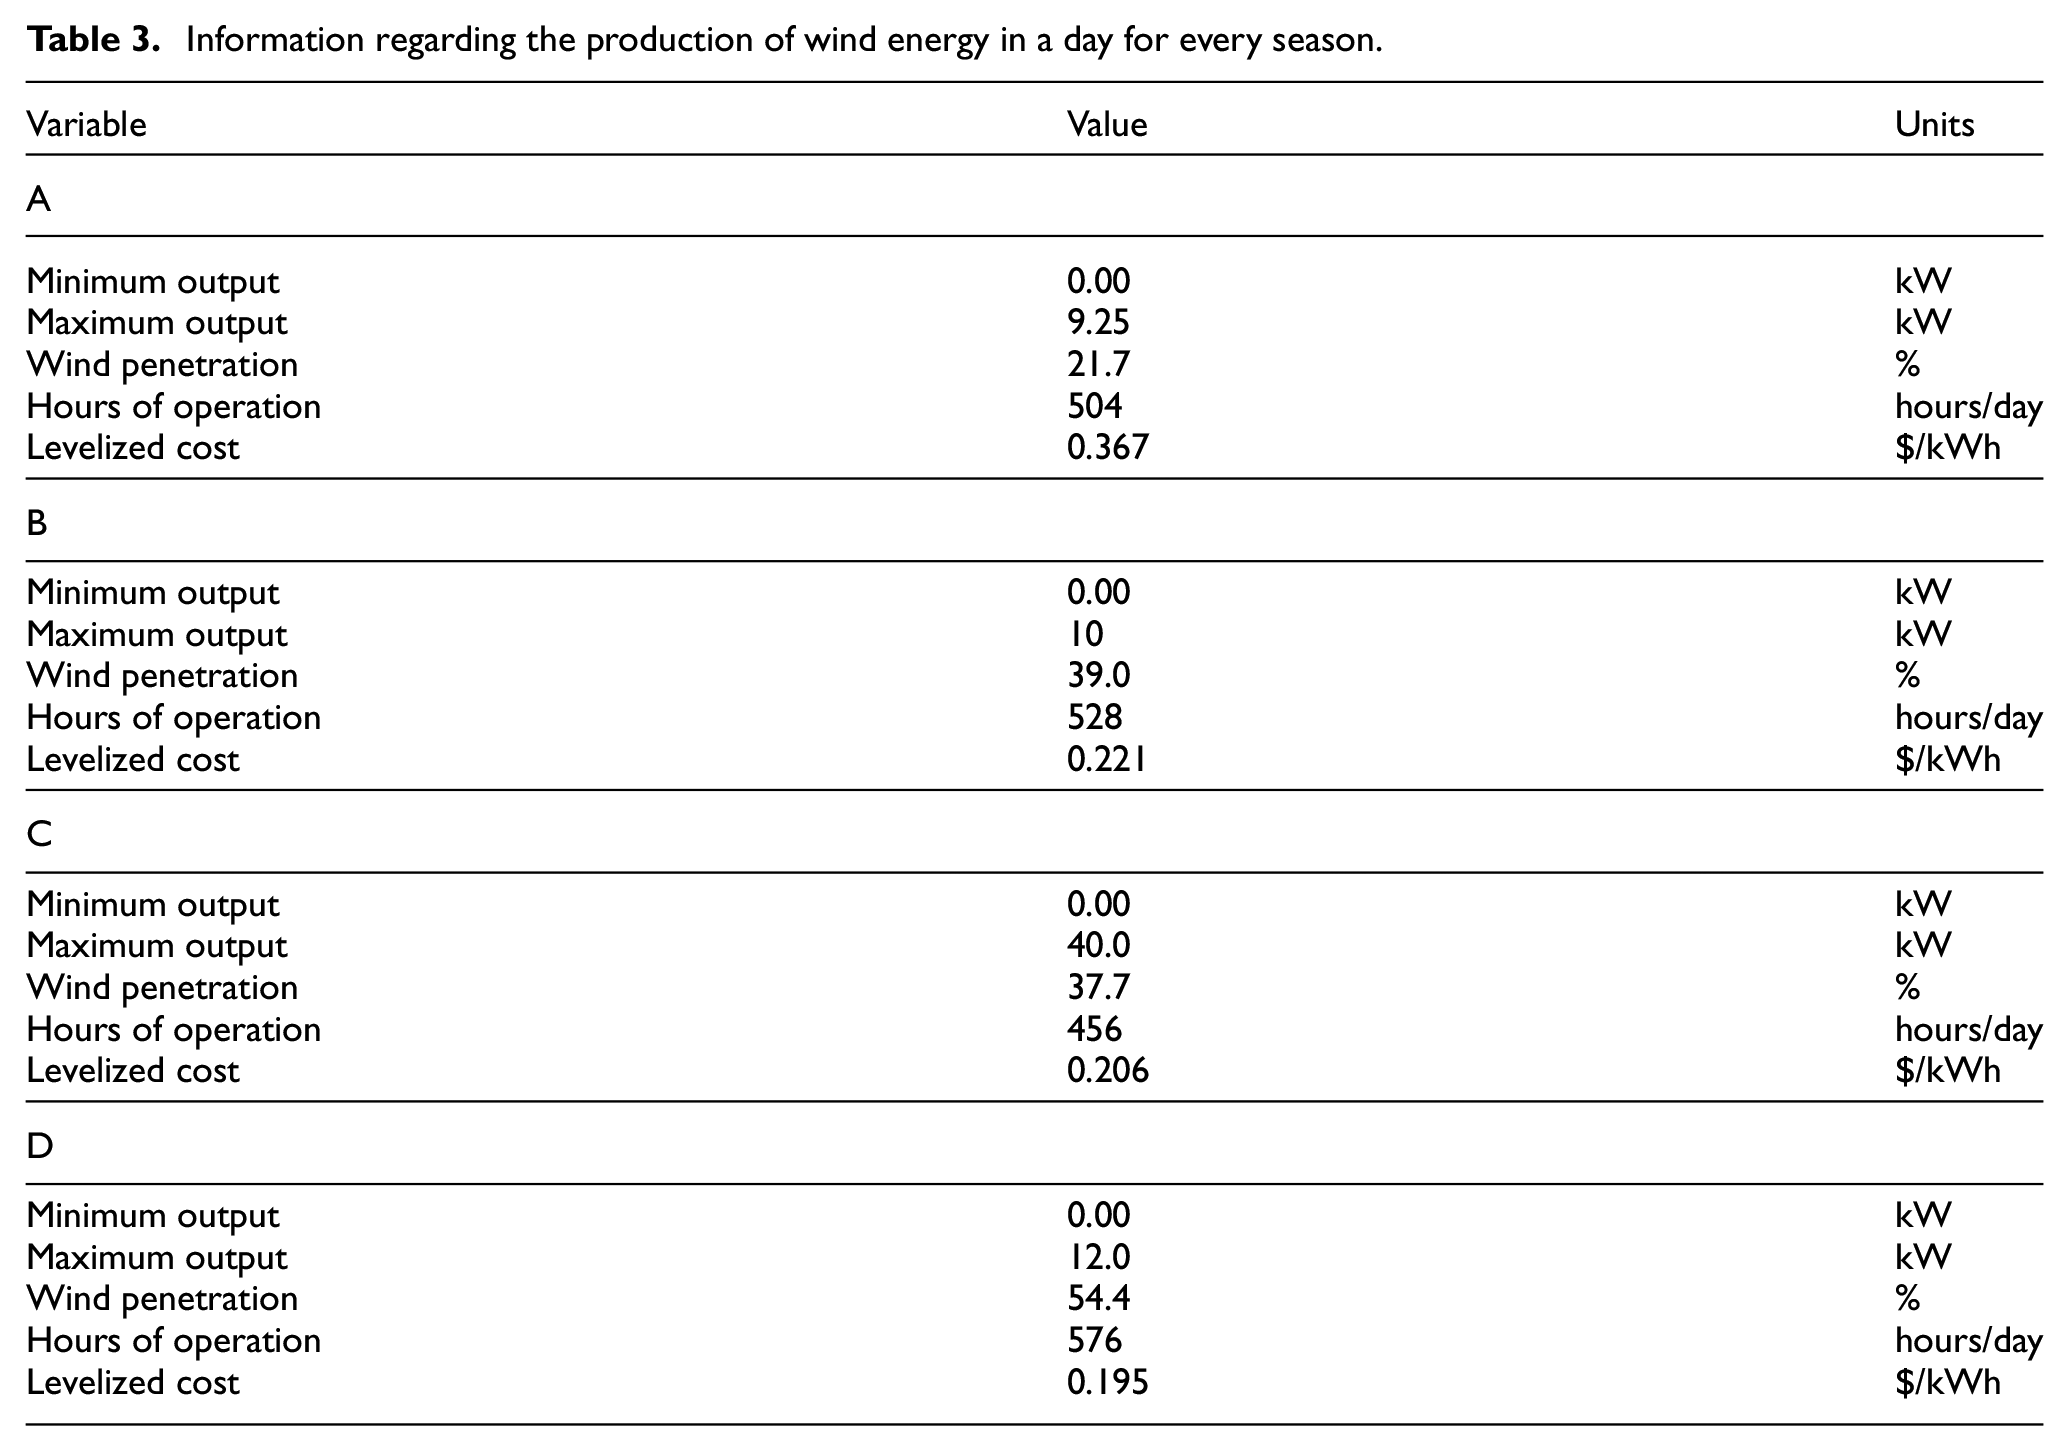

Wind generator operation.
Based on the estimate obtained in Figure 13, the total cost of the project for working on a winter day amounts to (1,171,292 $), and (1,128,372 $) for a spring day, (5,550,535 $) for a summer day and for a fall day (1,115,262 $), this sum includes all costs such as as capital, replacement, operation and maintenance (O&M) costs as well as salvage value. By analyzing the results, we see that the most high is related to the system used, represented by operating and maintenance costs (O&M) which amount to (33,237 $) for a winter day, (25,567 $) for a spring, (106,102 $) for a summer day and for an autumn day (23,521 $).

The different costs of four systems: (a) month of winter, (b) month of spring, (c) month of summer, (d) month of Autumn.
The replacement cost is (6860 $) for a winter day and the same cost for a spring day, (19,965 $) for a summer day and for an autumn day (6922 $).
The salvage value is (−3844 $) for a winter day and a day of spring, (−11184 $) for a summer day and for an autumn day (−3879 $). The costs of the various components of our system is presented in Figure 14.
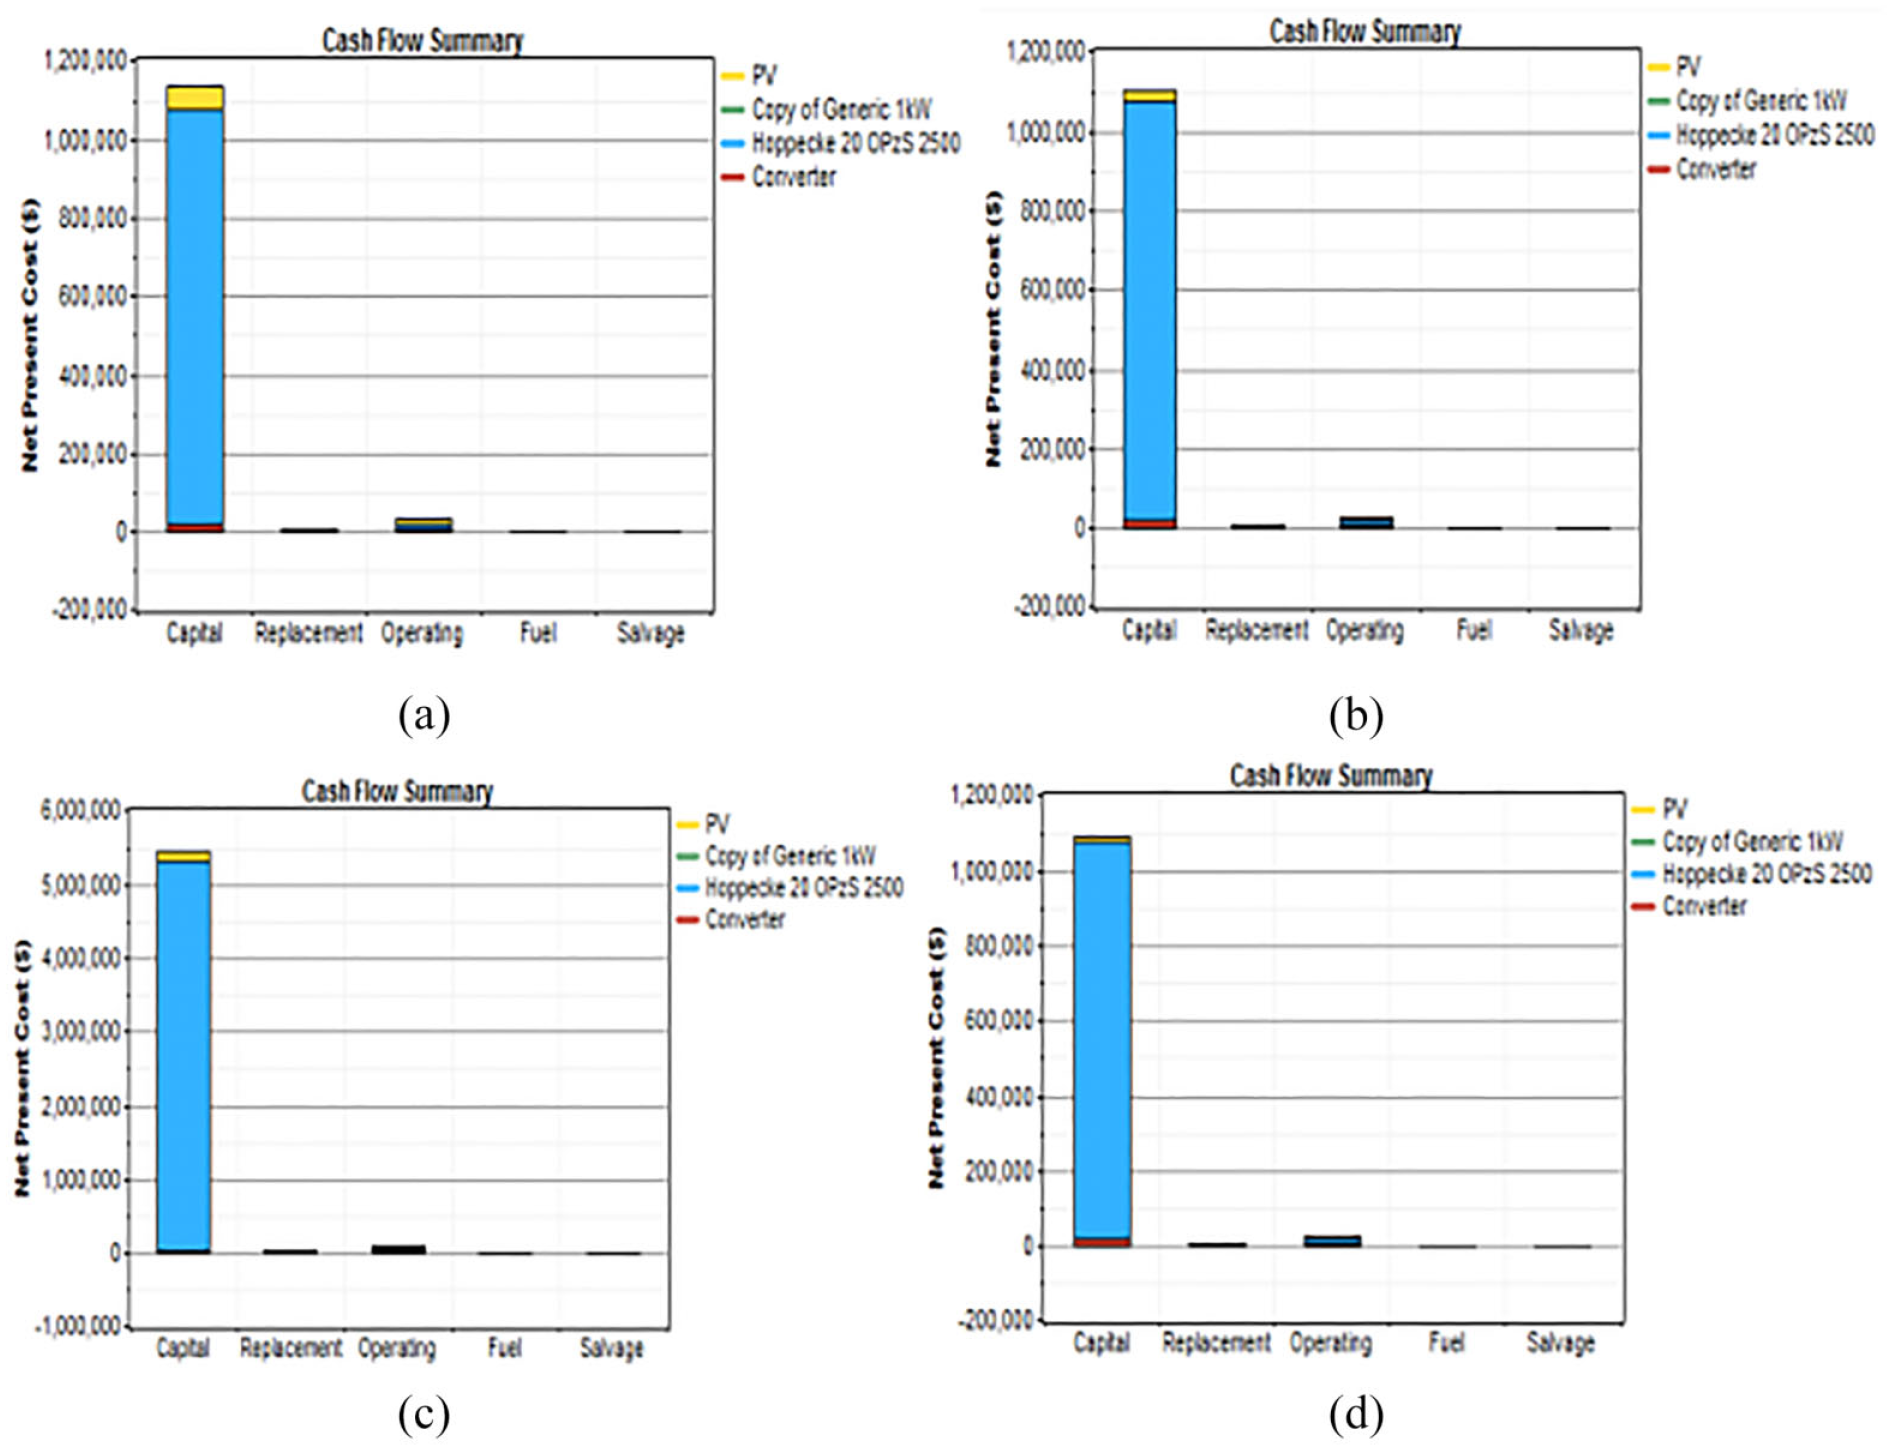
Summary of the costs of the various components: (a) month of winter, (b) month of spring, (c) month of summer, (d) month of Autumn.
Comparison of the results of four seasons
To compare the results of the system, we will study the four cases:
First case (Winter)
Figure 15 shows the results of the amount of energy generated by wind speed and solar energy in comparison with the amount of electrical energy consumed during 24 hours. It should be noted that:
- Between midnight and 7 a.m. and from 7 p.m. to midnight, solar energy is non-existent.
- Between midnight and 6 a.m. and from 5 p.m. to 8 p.m., the wind energy is weak.
- Between 8 a.m. and 6 p.m., the amount of solar energy begins to increase until it reaches 42 kW, while the amount of wind power is 9 kW.
- In 21 hours, the amount of energy consumed reaches a maximum of 26.5 kW.
- If the amount of energy consumed is greater than that produced by solar energy and the wind speed, the battery compensates for this lack of energy during the night.
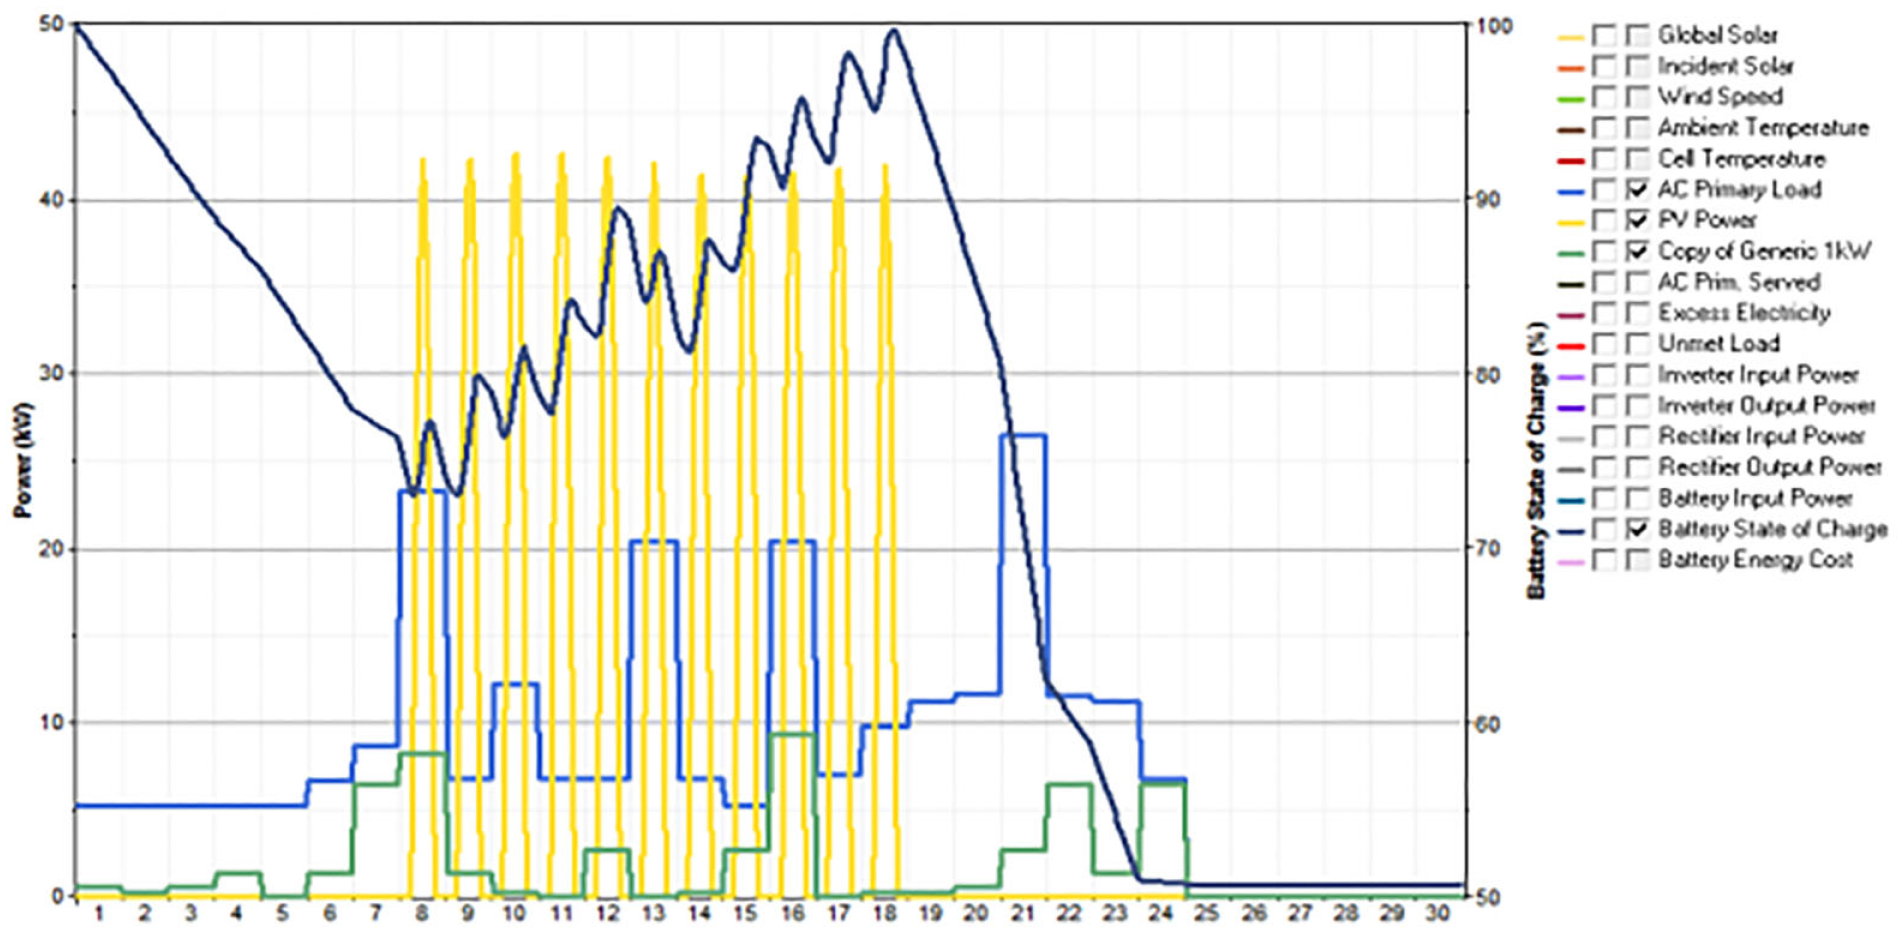
Winter system simulation results.
Second case (Spring)
Figure 16 shows the results of the amount of energy generated by wind speed and solar energy in comparison with the amount of electrical energy consumed during 24 hours. It should be noted that:
- Between 0 and 6 hours and from 20 to 24 hours, solar energy is non-existent.
- Between 0 and 6 o’clock, the wind power is weak.
- Between 7 a.m. and 7 p.m., the amount of solar energy begins to increase until it reaches 17.5 kW, while the amount of wind power is 10 kW.
- In 22 hours, the amount of energy consumed reaches a maximum of 28 kW.
- If the amount of energy consumed is greater than that produced by solar energy and the wind speed, the battery compensates for this lack of energy during the night.
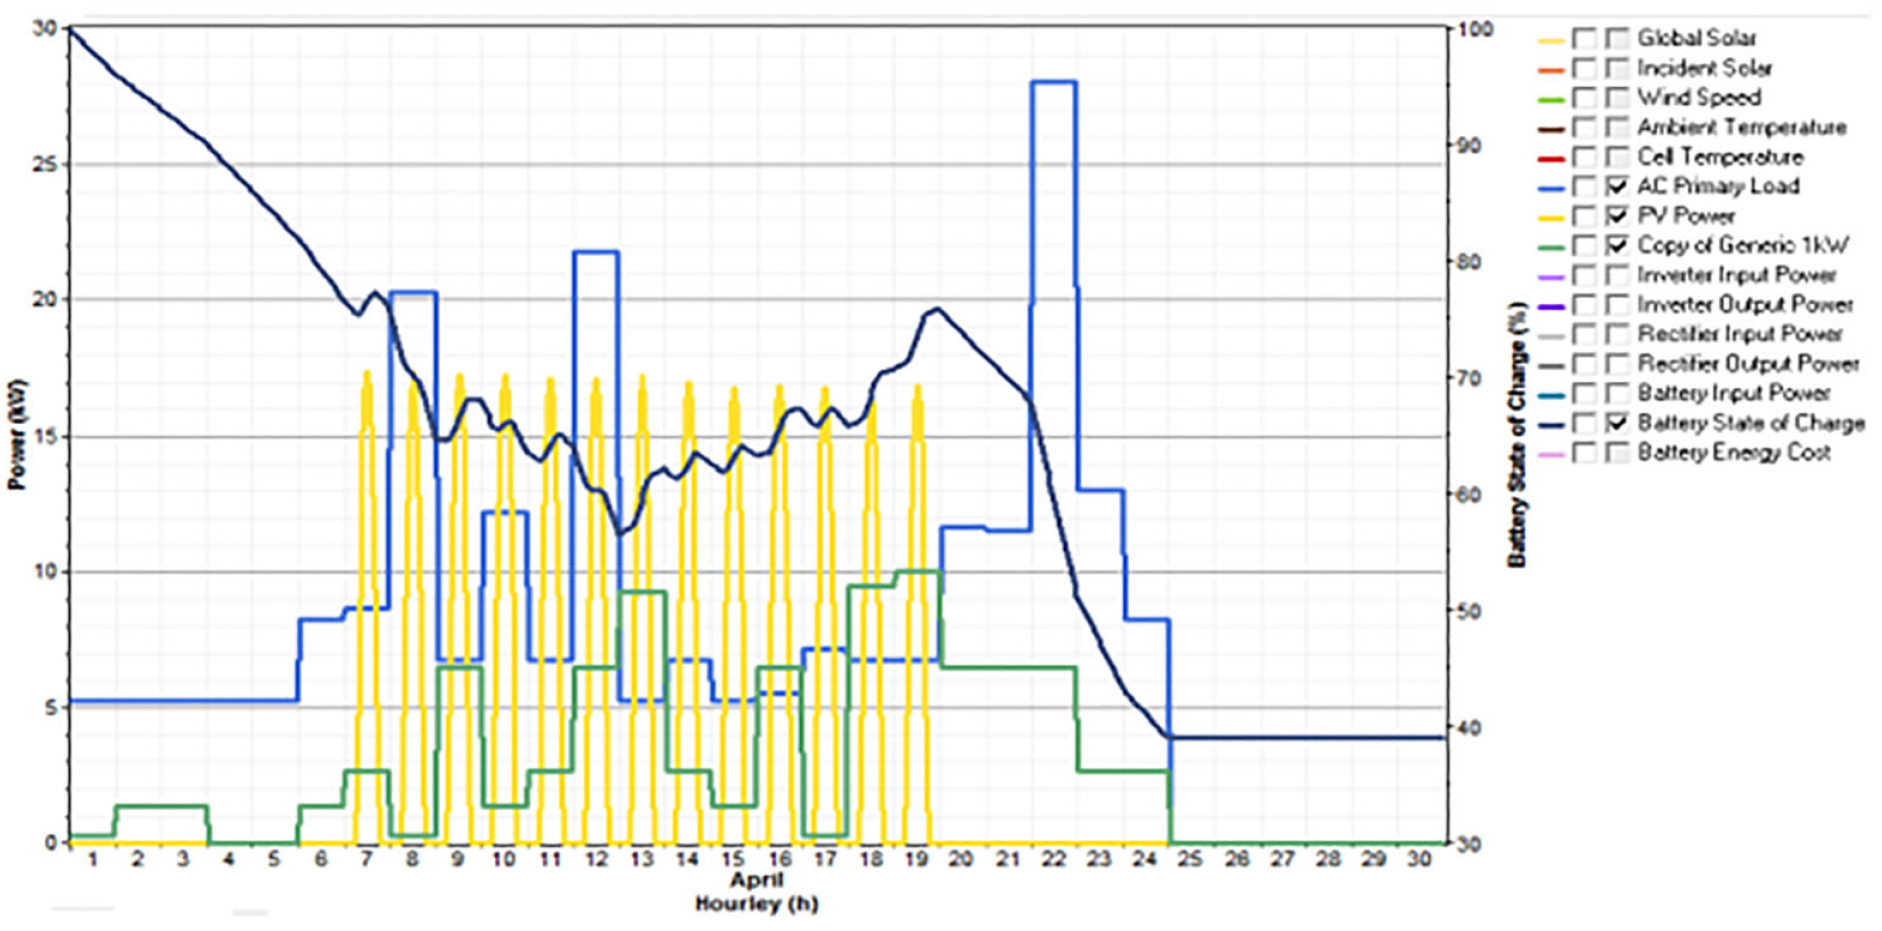
Spring system simulation results.
Third case (Summer)
Figure 17 shows the results of the amount of energy generated by wind speed and solar energy in comparison with the amount of electrical energy consumed during 24 hours. It should be noted that:
- Between 0 and 5 hours and from 20 to 24 hours, solar energy is non-existent.
- Between 2 and 6 hours, the wind energy is low.
- Between 6 a.m. and 7 p.m., the amount of solar energy begins to increase until it reaches 79 kW, while the amount of wind power is 40 kW.
- In 24 hours, the amount of energy consumed reaches a maximum of 90 kW.
- If the amount of energy consumed is greater than that produced by solar energy and the wind speed, the battery compensates for this lack of energy during the night.

Summer system simulation results.
Fourth case (Autumn)
Figure 18 shows the results of the amount of energy generated by wind speed and solar energy in comparison with the amount of electrical energy consumed during 24 hours. It should be noted that:
- Between 0 and 7 a.m. and from 6 p.m. to 12 a.m., solar energy is non-existent.
- Wind energy generally available all day.
- Between 8 a.m. and 5 p.m., the amount of solar energy begins to increase until it reaches 8.5 kW, while the amount of wind power is 12 kW.
- In 22 hours, the amount of energy consumed reaches a maximum of 26.5 kW.
- If the amount of energy consumed is greater than that produced by solar energy and the wind speed, the battery compensates for this lack of energy during the night.

Autumn system simulation results.
And finally, we found the following:
It can be seen that in the four seasons, both the photovoltaic solar panels and the wind turbines are working well. However, the use of these systems depends on several factors such as sunshine and wind speed specific to our region and the load to be driven.
We also notice that the almost similar load profiles during the three seasons (winter, spring, autumn). In contrast, during the summer season is higher due to an increased consumption during this period (Air Conditioner, Freezer), and the batteries helped to meet the demand needs of the load in any case. The batteries are charging during the day when solar panels or wind turbines generate electricity through sunlight and wind speed. This process allows energy to be stored for a later use, especially at night when electricity production is reduced.
Comparison of COE and NPC by PV and wind
Through the curves obtained in Figures 19 and 20, we have noticed that the more solar panels and turbines, the higher the NPC (present value cost). We found that the number of solar panels contributed to the high NPC, especially in summer, to meet the requirements of the load profile.

NPC versus PV: (a) month of winter, (b) month of spring, (c) month of summer, (d) month of Autumn.
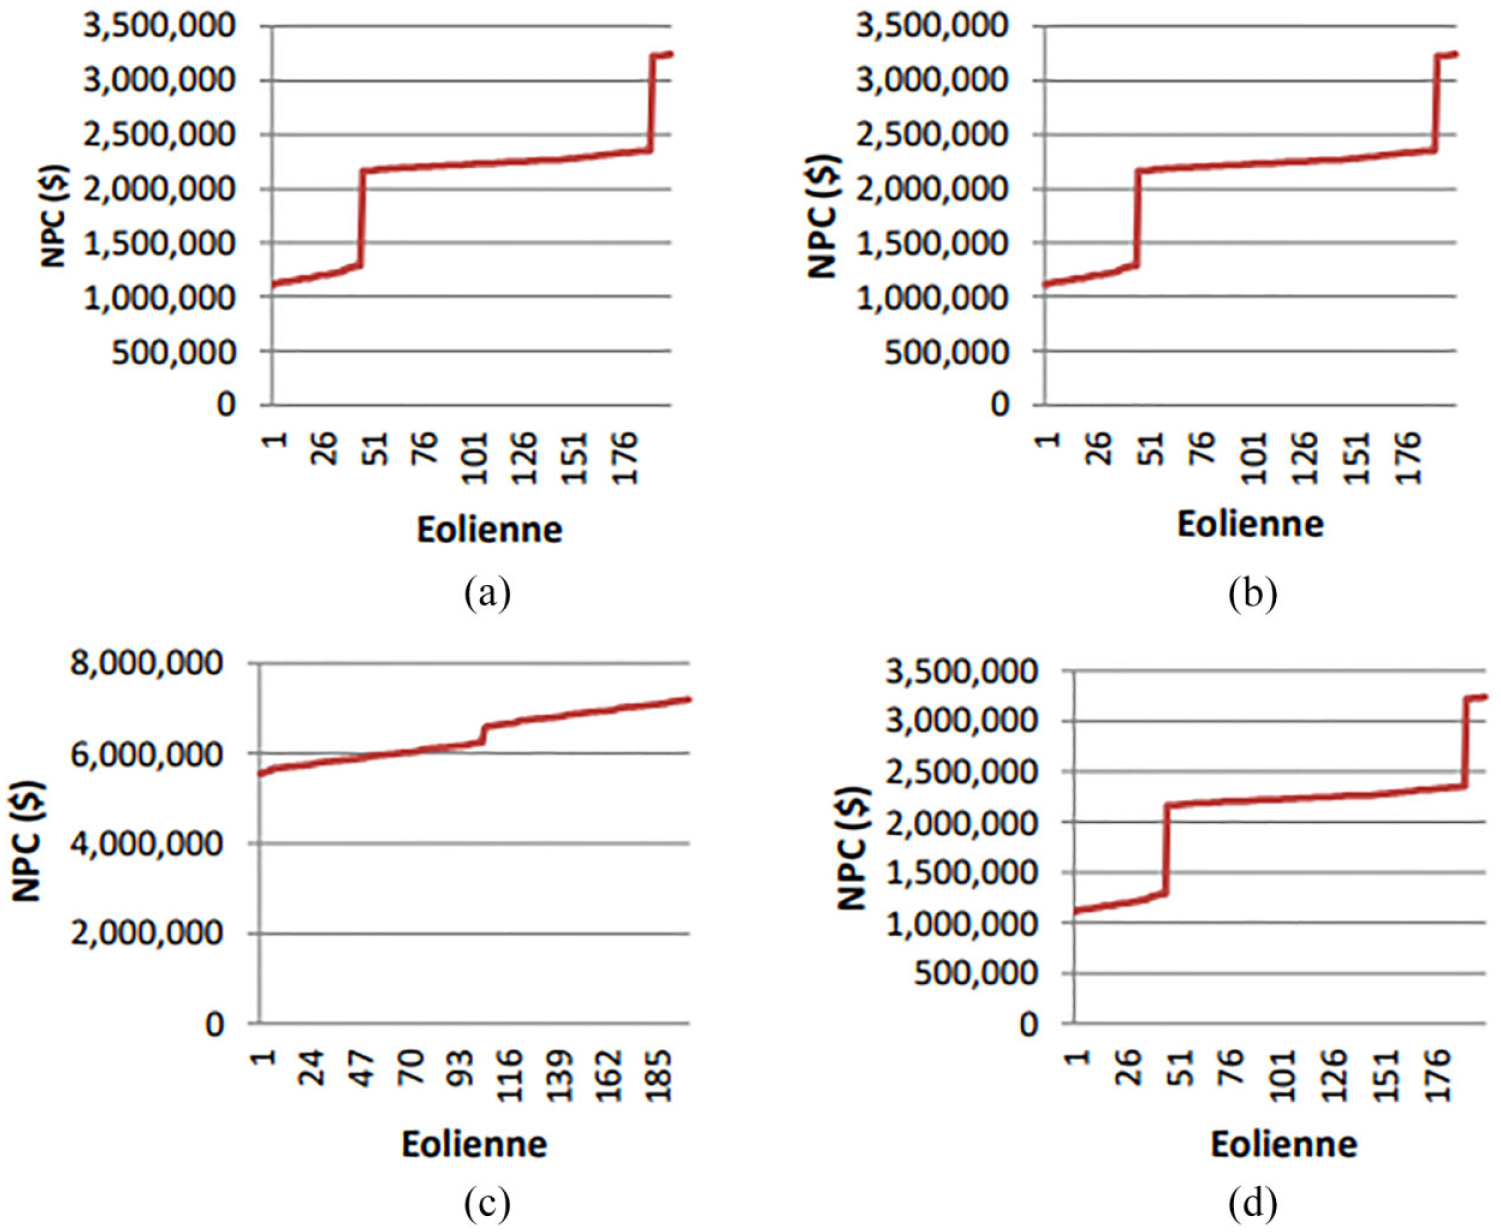
NPC versus wind turbine: (a) month of winter, (b) month of spring, (c) month of summer, (d) month of Autumn.
Through the curves obtained in Figures 21 and 22, we noticed that the more there are solar panels and wind turbines, the higher the COE (The cost of energy). We found that the number of PV panels contributed to the high COE, especially in summer, to meet the requirements of the load profile.
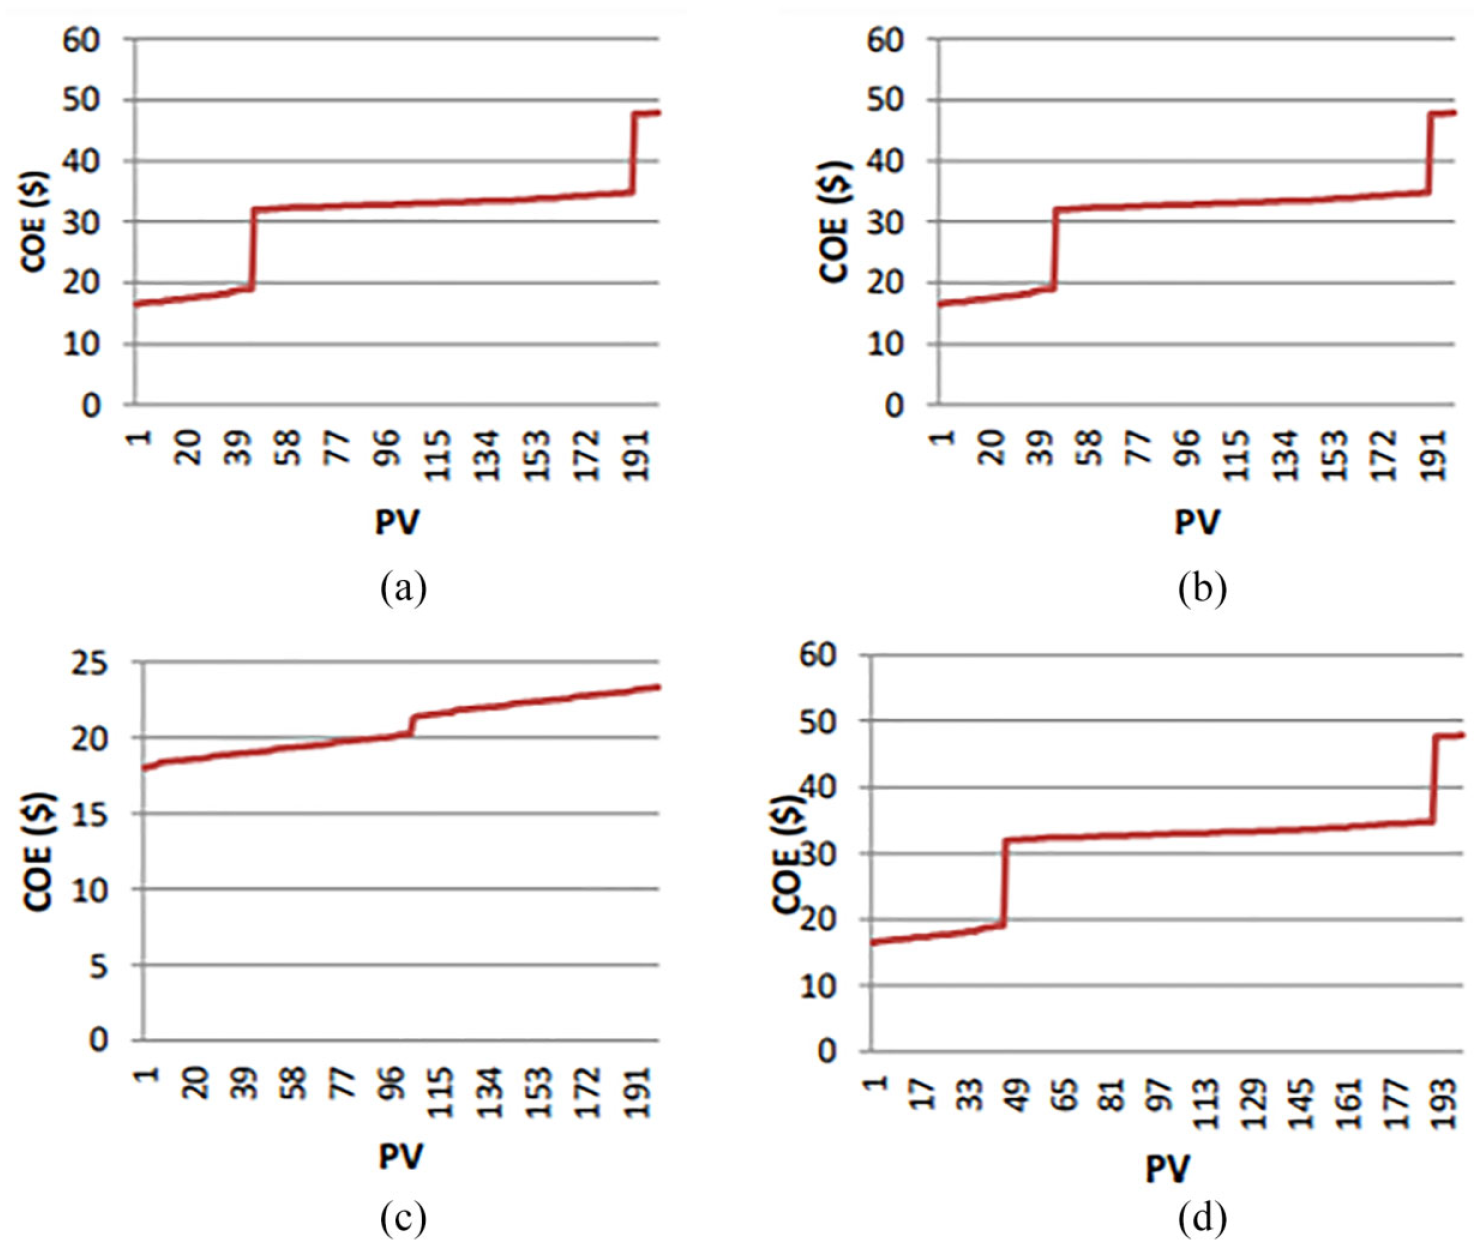
COE versus PV: (a) month of winter, (b) month of spring, (c) month of summer, (d) month of Autumn.

CEO versus wind turbine: (a) month of winter, (b) month of spring, (c) month of summer, (d) month of Autumn.
Conclusion
Our goal in this thesis is to study the management of a hybrid system (photovoltaic/wind/batteries). For this, precise sizing on all components was made to meet the requirements of 20 stand-alone habitats. Moreover, a study economic optimization on the investment side was made in order to analyze the existing possibilities proposed by HOMER software.
In order to establish an optimal dimensioning of our system, we used the software HOMER this specialized software for the economic optimization and the dimensioning of the system to assess the technical compatibility as well as the economic reliability before the execution of the project. For this we have presented a general description of the HOMER and the various operations that can be carried out, then we started the economic study of the installation (PV-wind turbine-battery) which can satisfy the power supply of our profile of load (Ouzera) which consumed an energy of 16 kWh/day for a winter day, 15 kWh/day for a spring day, 66 kWh/day for a summer day, and 14 kWh/day for an autumn day, first we presented the resources energy (irradiation, temperature and wind speed) for 1 day in each season and the costs of each component of the systems then the HOMER proposes the system most optimum with the sizing of the hybrid system that can be used.
In this study we have taken into account all the costs over the entire lifetime of project. These include not only initial costs but also replacement costs, the cost of operation and maintenance of the installation.
After performing the system configuration simulations (PV, wind turbine, batteries), they differ from each other in terms of components.
In this study, we have taken into account all the costs over the life of the project. That includes not only the initial costs, but also the replacement costs, the costs of operation and maintenance of the installation.
After performing simulations of different system configurations (PV, wind, batteries), which are differentiated by their components, we were able to determine the architecture optimal for a hybrid system. This provides the user with the necessary elements to decide which approach offers the best compromise between cost and need.
Footnotes
Declaration of conflicting interests
The author(s) declared no potential conflicts of interest with respect to the research, authorship, and/or publication of this article.
Funding
The author(s) received no financial support for the research, authorship, and/or publication of this article.
