
Abstract
In the current century, electrical networks have witnessed great developments and continuous increases in the demand for fossil fuels based energy, leading to an excessive rise in the total production cost (TPC), as well as the pollutant (toxic) gases emitted by thermal plants. Under this circumstances, energy supply from different resources became necessary, such as renewable energy sources (RES) as an alternative solution. This latter, however, characterized with uncertainty nature in its operation principle, especially when operator system wants to define the optimal contribution of each resource in an effort to ensure economic and enhanced reliability of grid. This paper presents an Enhanced version of Kepler optimization algorithm (EKOA) to solve the problem of stochastic optimal power flow (SOPF) in a most efficient way incorporating wind power generators and solar photovoltaic with different objective functions, the stochastic nature of wind speed and solar is modeled using Weibull and lognormal probability density functions respectively. To prove the effectiveness of the proposed EKOA, various case studies were carried out on two test systems IEEE 30-bus system and Algerian power system 114-bus, obtained results were evaluated in comparison with those obtained using the original KOA and other methods published in the literatures. Thus, shows the effectiveness and superiority of the efficient EKOA over other optimizers to solve complex problem. The incorporation of RES resulted in a significant 2.39% decrease in production cost, showcasing EKOA’s efficiency with a $780/h, compared to KOA’s $781/h, for IEEE 30-bus system. For the DZA 114-bus system revealed even more substantial reductions, with EKOA achieving an impressive 12.6% reduction, and KOA following closely with a 12.4% decrease in production cost.
Keywords
Introduction
Motivation and incitement
The electrical networks in the world are going through significant transformations to face the ongoing increases in energy demand, rising energy production costs, and ecological problems related to pollutant emissions from thermal power plants. To address this challenge, it becomes necessary to enhance the study of the optimal power flow (OPF) to a more complex and advanced level. This transition involves a move toward cleaner and more sustainable energy sources, enhance the grid technology, and a focus on energy efficiency and environmental responsibility.
The optimal power flow has been a topic of continuous interest and exploration within the power system research community for nearly half a century since its inception. The OPF is generally considered as a large-scale, non-convex, non-linear and multidimensional optimization problem. The main goal of OPF is to minimize generation costs by determining the optimal settings for control variables, including generated real power and generator bus voltages within the network. While achieving cost optimization, the system must also adhere to various constraints related to generator capability, power flow balance, line capacity, these constraints collectively represent the system’s optimal operating state, determined through the optimization process.
The classic OPF problem involves conventional thermal power generators powered by fossil fuels, and it stable energy source that can be controlled. However, as renewable energy sources (RES) like solar PV and wind are intermittent and variable, and are increasingly integrated into the network, it becomes necessary to study OPF while considering the uncertainties associated with these renewable sources.
Literature review
OPF that consider thermal power generators only has widely been studied by researchers, In the beginning, the studies relied on the use of conventional optimization techniques to s the problem, such as Newton method programing in Hong (1991) and Santos and da Costa (1995), quadratic programing, the interior point (Wei and Sasaki, 1995), linear programing and nonlinear programing in Habibollahzadeh et al. (1989) and Wu et al. (1993). However classical methods face significant limitations as they are not suitable for handling large and complex OPF problems that involve high nonlinearity and various optimization problems. Consequently, these methods might converge easily to local solutions (Ebeed et al., 2018).Therefore, the necessity of developing effective optimization techniques arises as an effort to address the limitations of traditional optimization methods (Hinojosa and Araya, 2013). The primary factors that likely contribute to such situations are the desire to prevent solutions from getting trapped in local minima. It is widely recognized that the selection of the initial condition is of utmost importance since it significantly impacts the solution’s outcome. Moreover, the inherent characteristics of the objective functions formulated to tackle the OPF problem contribute to the complexity of the task. This limitation not only restricts the application of gradient-based techniques but also opens up the door for adopting meta-heuristic evolutionary algorithms to pursue more efficient solutions.
Literature reveals that the power flow problem has been resolved based on metaheuristic algorithms. For instance, researchers have effectively applied techniques such as tabu search (TS) (Ongsakul and Bhasaputra, 2002), Particle Swarm Optimization (PSO) (Abido, 2002). The effectiveness and precision of results achieved through the utilization of these algorithms became increasingly evident as a greater number of published articles began to showcase their outcomes. Recently numerous metaheuristic optimization algorithms have been employed to address classical Optimal Power Flow (OPF) problems such as teaching learning based optimization(TLBO) (Bouchekara et al., 2014), backtracking search algorithm (BSA) (Chaib et al., 2016), Glowworm Swarm Optimization (GSO) (Surender Reddy and Srinivasa Rathnam, 2016), Strength Pareto evolutionary algorithm (SPE) (Yuan et al., 2017), vortex search algorithm (VSA) (Aydin et al., 2017), Metamodel-based global optimization (MBGO) (Xiao et al., 2018), Differential evolution (DE) (Biswas et al., 2017a), novel improved social spider optimization algorithm (NISSO) (Nguyen, 2019), The most valuable player algorithm (MVPA) and Powell’s pattern search (PPS) method (Kaur and Narang, 2020), gray wolf optimizer (GWO) (Nuaekaew et al., 2017), Sparrow Search Algorithm (SSA) (Jebaraj and Sakthivel, 2022), Whale optimization algorithm (WOA) (Naidu et al., 2021), and Harris Hawks optimization (HHO) (Islam et al., 2020).
While the references mentioned above primarily focus on thermal power generators only, it’s worth noting that recent research has delved into the integration of both thermal and renewable energy generators. This expanding research area delves into the optimization and operational synergy between thermal and renewable energy generation systems, shedding light on novel strategies to enhance energy efficiency and economic viability in power generation.
The successful incorporation of renewable energy sources into power systems plays a vital role in attaining sustainable and environmentally friendly electricity generation. An essential aspect of this objective involves optimizing the operation of power systems while adapting the variability and uncertainty associated with renewable energy generators. For addressing this challenge, Stochastic Optimal Power Flow (SOPF) has emerged as a promising approach that combines probabilistic modeling and optimization techniques. In recent years, various optimization algorithms have been developed and applied to SOPF problems. However, the effectiveness and efficiency of these algorithms in handling large-scale power systems with high renewable energy penetration remain areas of active research. For instance in Biswas et al. (2017b) the OPF problem in a power system with renewable energy generators is addressed using an adaptive differential evolution technique called SHADE. Authors utilized lognormal and Weibull probability distribution functions to predict the output of solar photovoltaic and wind generators. The feasibility of results was ensured by verifying that all control variables remained within defined constraints. Duman et al. (2021) used a symbiotic organism search (SOS) to solve AC OPF problem. The study incorporated test cases related to the stochastic nature of wind, solar, and tidal energy systems, the research included the evaluation of solutions concerning the integration of renewable energy into the power grids of IEEE 30-bus and IEEE 118-bus systems, employing various locations of heat generating units in these systems to optimize their overall performance. Mouassa et al. (2022) employed the Slime Mold Algorithm (SMA) to optimize power flow among diverse generating resources with the goal of minimizing the total operational costs of the main grid. In another publication (Sulaiman et al., 2023) an application of teaching–learning-based optimization (TLBO) for solving the stochastic optimal power flow problem in order to optimize two cases of single objective functions, production cost minimization and emission costs minimization including the imposition of a carbon tax to reduce the emission of greenhouse. In Nguyen et al. (2023) jellyfish search algorithm (JSA) was applied for reaching the maximum profit of two IEEE (30- 118) buss power transmission networks considering wind turbines and electrical market. Sulaiman and Mustaffa (2020) used barnacles mating optimizer (BMO) to solves SOPF in a hybrid power system that combine thermal, wind, PV and a small hydro power sources taking into account prohibited operating zones and for thermal generator limits. In Hassan et al. (2021a) the Rao-3 technique is employed to optimize the reactive power dispatch in a manner that takes into account uncertainties in PV power and its contribution to contributes to the reduction of active transmission losses.
As research progressed and systems became more complex, most of the proposed algorithms showed inability or limitations in dealing with the problems at hand, such as stagnation issues and trap in the local optima, moreover a significant execution time. Some researchers have been made in order to counter these problems. Literatures show that some researchers modified the algorithms and others merged two algorithms. For instance, Elattar and ElSayed (2019) proposed a modified Jaya algorithm that is created through an adjustment to the equation used for updating solutions, which typically relies on the best and worst solutions. The MJAYA is applied to solve the OPF problem with RES, employing four objective functions to improve outcomes when compared to other methods. The RES is represented as a negative load, and no anticipation techniques are utilized for solar PV and wind rated power output. The results show the effectiveness of MJAYA on the Jaya and other existing algorithms. Samakpong et al. (2022) a mutation-based particle swarm optimization (MPSO) proposed to solve OPF problem includes a cost model associating the expense related to the uncertainty sustained with the utilization of RES, and the uncertainty was executed by Monte Carlo method.32 Application of an improved artificial bee colony (IABC) algorithm for optimal power flow problem incorporating thermal units, solar PV and DFIG-based wind generators (Thorat et al., 2021). Zahedibialvaei et al. (2023) proposed an enhanced turbulent flow in water-based optimization (TFWO), referred to as (ETFWO), to optimize power flow in electrical networks incorporating solar photovoltaic (PV) units and wind turbines (WTs). ETFWO enhances the traditional TFWO framework by emphasizing communication and collaboration. This modification increases interactions among individuals within the population, enabling more precise exploration of the search space and reducing the probability of getting trapped in local optima. In this approach probabilistic models and real-time solar irradiance and wind speed data are employed to forecast the power output of both PV and WT producers. In the study referenced as Hassan et al. (2023a), an improved variant of the hunter-prey optimization (EHPO) was proposed to adjust the parameters of FACTS devices and optimizing the Optimal Power Flow (OPF) in the presence of (RES). Notably, the study highlights the robustness of EHPO in achieving global search exploration compared to the traditional hunter-prey optimization (HPO). Furthermore, it is observed that the HPO algorithm struggles to reach optimal solutions in the context of large-scale power systems. A modified version of the RUNge-Kutta optimizer (MRUN) proposed Ebeed et al. (2022) for solving the stochastic OPF problem with optimal integration of the WTs and PV systems along with Thyristor controlled series compensator (TCSC). Hassan et al. (2021b) proposed the Modified Rao-2 (MRao-2) technique is employed to optimize the Optimal Power Flow (OPF),in a hybrid power system that incorporate wind, solar, hydro and biomass sources aiming to minimize fuel costs in various scenarios for both IEEE 30 bus system taking into account the RES with contingency conditions, and 118-bus systems. An improved Salp Swarm Algorithm (ISSA) proposed in Abd El-sattar et al. (2021) to solve OPF issues in power systems, with a focus on stochastic solar power generation. iSSA’s effectiveness is evaluated on an IEEE 30-bus system by measuring its performance in reducing power loss, cost, and the combined cost and emissions from power generation. A comparative analysis is conducted against other recent algorithms, including SSA. Adhikari et al. (2023) introduces an adaptive lightning attachment procedure optimizer (ALAPO) as a means to enhance both exploration and exploitation within the conventional Lightning Attachment Procedure Optimizer (LAPO). The objective is to generate multiple scenarios that consider uncertainties linked to load demand, wind speed, and solar irradiation.
Pattnaik et al. (2023) proposed a Modified bacteria foraging algorithm (MBFA) to address the OPF problem in hybrid power systems, in an effort to enhance voltage security and operational efficiency in hybrid power systems. This study incorporates pumped hydro storage and battery energy storage with wind-PV-thermal generation and shows the advantages of combining both small and large-scale energy storage technologies to mitigate lower energy imbalance. And to effectively handle extended disruptions or protracted vulnerable events.
Other hybrid optimization approaches, integrating various algorithms, have been extensively suggested for addressing the SOPF problem and have been shown effectiveness in addressing various optimization problems. For instance, Ullah et al. (2019) highlighted the benefits of integrating a combination of two optimizations techniques that are phasor particle swarm optimization (PPSO) and gravitational search algorithm (GSA), referred to as (PPSOGS) for addressing the OPF problem, particularly when dealing with wind and solar PV energy systems. A novel hybrid algorithm, EESWHO, has been developed to enhance the Wild Horse Optimizer (WHO) by incorporating elite evolutionary strategies (EES). This improved algorithm is applied to optimize the Optimal Power Flow (OPF) problem while considering uncertainties related to solar PV and wind power generation (Hassan et al., 2023b). Riaz et al. (2021) used HPS-GWO to optimize the OPF problem with RES systems, demonstrating its superior performance over other algorithms on the IEEE 30-bus test system. Sureshkumar and Ponnusamy (2020) proposed an approach for managing power flow in hybrid thermal and renewable energy systems, referred to as MEHOTSA. This approach combines the modified Elephant Herding Optimization Algorithm with the Tabu Search Algorithm. Rizwan et al. (2021) Hybrid Harris Hawks optimizer (HHHO) for solve OPF problem taking into account the stochastic nature of renewable energy sources’ behavior. A hybrid optimization technique, combining machine learning (ML) and transient search optimization (TSO), was applied in Shaheen et al. (2022) to address the classical and probabilistic OPF problem for two large scale power systems, namely the IEEE 57-bus and IEEE 118-bus systems, incorporating renewable energy sources the study aims to evaluate and validate the efficiency of the hybrid (ML-TSO) algorithm in solving OPF problems. A hybrid multi-objective evolutionary algorithm (MOEA) that combines decomposition techniques with the Invasive Weed Optimization (IWO) algorithm is proposed in Avvari and Vinod Kumar (2023) for addressing the optimal power flow (OPF) problem within transmission networks. This modification extends the conventional OPF to a stochastic OPF scenario, incorporating uncertainties associated with Wind Energy (WE), Photovoltaic (PV), and Plug-in Electric Vehicle (PEV) systems.
The proposed algorithms have many setting parameters and some of the hybrid algorithms need a significant execution time. Moreover, the global solution is not ensured since the power flow is a nonlinear problem.
Contribution and paper organization
In this paper, a novel approach to address these limitations is presented by introducing the Enhanced version of Kepler Optimization Algorithm (EKOA) for efficient SOPF incorporating renewable energy sources. The modification to the conventional Kepler Optimization Algorithm enhances the algorithm’s capabilities for both exploration and exploitation, effectively preventing it from getting stuck in local optima and overcoming stagnation issues.
The main objective of this research is to develop an efficient SOPF framework using the EKOA, capable of handling the stochastic nature of renewable energy sources and delivering optimal solutions for large-scale power systems. Through extensive simulations and comparisons with existing optimization algorithms, we aim to demonstrate the effectiveness and efficiency of our proposed approach in enhancing the integration of renewable energy sources into power systems.
This paper introduces a novel Enhanced Kepler Optimization Algorithm (EKOA) to address stochastic Optimal Power Flow (SOPF) problems.
Addressing the stochastic Optimal Power Flow (OPF) with the incorporation of renewable energy resources (RES), such as solar PV and wind power generation systems.
Application of the lognormal and Weibull PDFs to model and characterize the uncertainties within the system
A statistical analysis is provided to validate the efficacy of the proposed Enhanced Kepler Optimization Algorithm (EKOA).
The remainder of this paper is structured as follows: Section 2 offers an extensive review of the mathematical formulation of the SOPF problem and Stochastic wind and solar PV power models for renewable energy integration. Section 3 presents the methodology, describing the Kepler Optimization Algorithm in detail. Section 4 presents the simulation setup and discusses the obtained results. Finally, Section 5 concludes the paper by summarizing the findings and discussing future research directions.
Optimal power flow problem formulation
The optimization problem in this paper aims to solve the Optimal Power Flow (OPF) for a power system that includes thermal and stochastic wind and solar PV power generations. The primary goal is to optimize power system variables and determine the optimal settings for control in power system components. This is achieved by minimizing selected objective functions while ensuring that all the equality and inequality constraints are satisfied, formulated Mathematically as-follows:


Where
Where:
-
-
- c represents the vector of decision variables, which includes the control settings for power system components, and d represent the vector of state variables which represent states of the power system, these variables describe the system’s dynamic behaviour.
Optimization problem
Cost of generation for thermal units
The fuel cost function for multiple thermal generator units can be modeled as a convex and differentiable quadratic function. It can be represented by the equation (3):

However, the above mentioned model ignores the valve point loading, which introduces oscillations or fluctuations to the actual input-output curve, can be addressed by modifying the equation (3). This modification involves the addition of an extra sin term to capture the valve point effects.

Where
The cost generation for renewable sources
Due to the absence of fuel requirements in wind and solar generators, the evaluation of cost functions for these sources follows certain norms, and different types of costs are associated with their operation. These include direct costs, reserve costs, and penalty costs.
Direct cost of wind and solar photovoltaic power
Direct costs refer to the expenses incurred in the generation of renewable energy. These costs encompass various components such as equipment, installation, maintenance, and operational expenses. Direct costs are primarily associated with the initial investment and ongoing operational activities of renewable energy. The direct cost for the wind generator, denoted as


Where
Cost evaluation of uncertainties in wind and solar power
In the presence of uncertainties, there are two potential scenarios to consider. The first scenario occurs when the actual power delivered by the wind farm or solar generator is lower than the estimated values. This situation is referred to as an overestimation of power. In such cases, the system operator must utilize spinning reserve resources to ensure a continuous and uninterrupted power supply to consumers. The cost related to deploying these reserve production units to offset the overestimated quantity is identified as the reserve cost (Biswas et al., 2017b). The reserve cost related to the wind and solar PV power generators is expressed by the following equations:
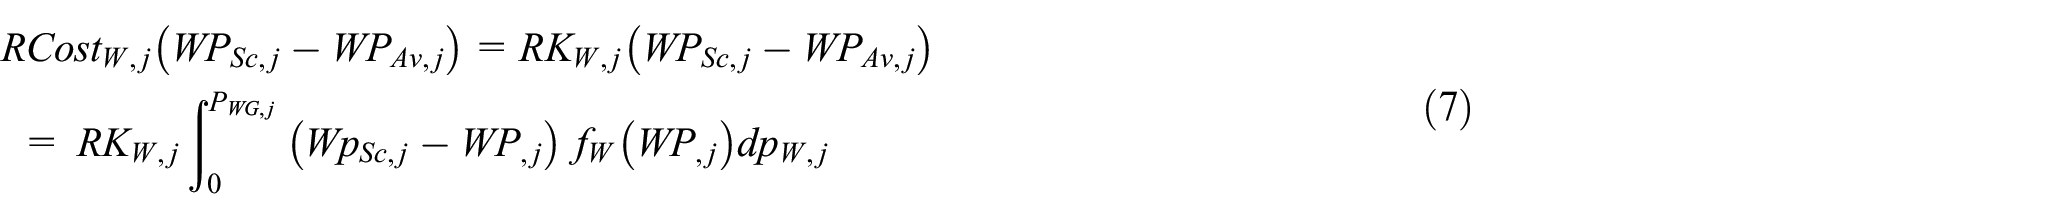

In the equation provided
The second scenario, referred to as the underestimation, Contrary of overestimation, this scenario is when the actual power produced by wind or solar power plant is higher than initially estimated one, this leads to a surplus of power. This situation needs introduce the penalty cost ensuring that the financial impact of the surplus energy is accounted, the penalty cost is expressed by these equations:
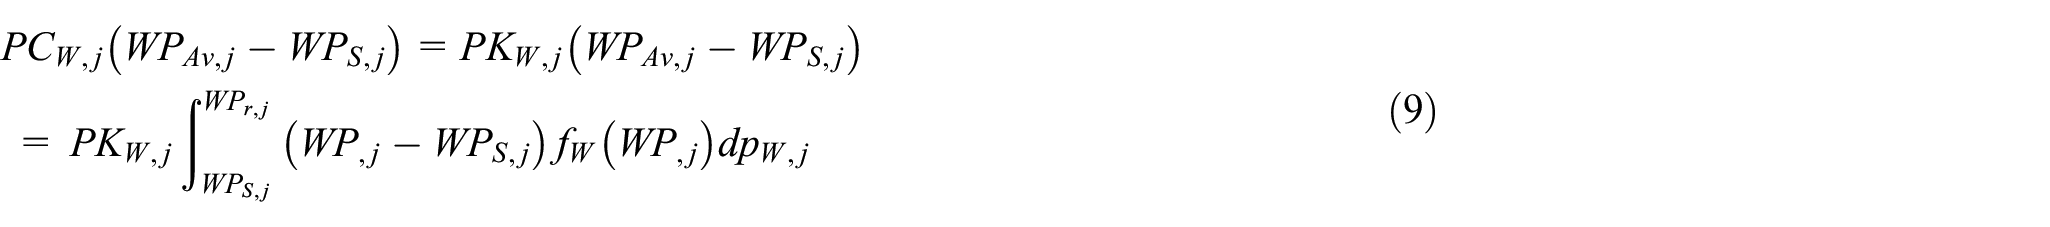

where
Emission and carbon tax
It is widely recognized that conventional sources of energy contribute to harmful gas emissions in the environment. The emission of sulfur oxide (SOx) and nitrogen oxide (NOx) tends to increase as the power generated from thermal power generators increases, following the relationship described in Equation (9). The emission level, measured in tones per hour (t/h), can be calculated using the following equation:

Where ωi, µi
In recent years, to tackle the global warming, numerous countries have been exerting significant pressure on the entire energy industry to minimize carbon emissions (Reddy, 2017). a carbon tax

In the Optimal Power Flow (OPF) problem, additional system parameters such as the power loss in the network transmission lines and voltage deviation play a significant role. These parameters are crucial indicators of system efficiency and stability. The power loss in the transmission system is inevitable due to the inherent resistance of the transmission lines. To calculate the network loss, the following equation is commonly used:

Where
Voltage deviation is a parameter used to evaluate the quality of voltage in a network. It represents the cumulative difference between the voltages of all load buses (PQ buses) and the nominal value of 1 per unit (p.u.). Mathematically, it is calculated as the sum of the deviations of each load bus voltage from the nominal value. The voltage deviation is expressed by the following equations:

Objective functions
Minimization of total generation cost
The first objective function formulates the cost of energy production taking into account presence of Renewable Energy Sources (RES), whereby all the cost-functions above-mentioned are involved. This objective aims to minimize the total generation cost of all types of generators in the system, including thermal, wind, and solar sources. It can be mathematically expressed as:
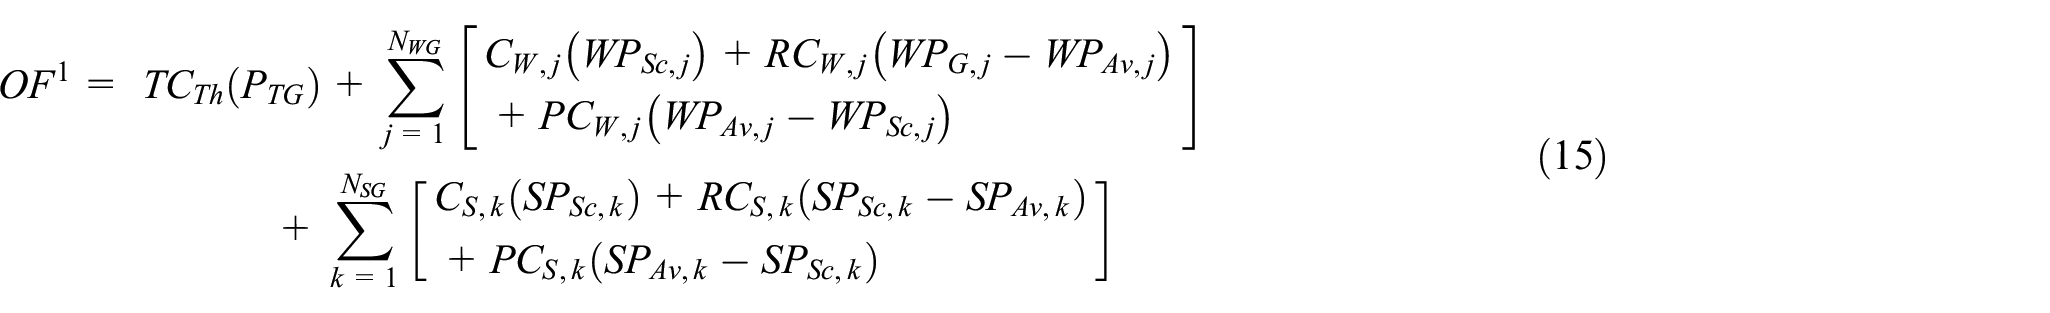
Where
Minimization of emission gases with carbon tax
In this case, the carbon tax

The carbon tax
Minimization of the real power losses
The equation (17) used for minimizing the overall real power losses of the network is as follows:

Minimization of the voltage deviation
The equation (14) used for minimizing the voltage deviation on all buses of the network as follows:

System constrains


Security constraints


Equations (19)–(21) establish the active power constraints for thermal power plants, wind power generators, and solar PV power generators respectively. Equations (21)–(24) represent the reactive power capabilities of thermal power plants, wind, and solar PV generators, and shunt reactive power sources. Equation (25) outlines the constraints imposed at the generator busbar, while equation (26) define the voltage limits for load buses, where LBN represents the number of load buses. Security constraints related to tap changing transformers and line capacities are expressed in equations (27) and (28) respectively, with LN denoting the number of lines in the electric grid.
When dealing with constraints, the static-penalty function method has been widely used, typically involving a trial-and-error process. However, selecting inappropriate penalty coefficients can lead to constraint violations. To address this issue, a technique of constraint handling known as the Superiority of Feasible Solutions is employed to ensure the feasibility of solutions. More details are given in Mouassa et al. (2022).
Stochastic wind-solar and uncertainty models
The evaluation of a wind generator and a solar PV unit can be influenced by the probability distribution functions (PDFs) of the wind speed and solar radiation, respectively. By incorporating the appropriate PDFs for wind and solar radiation, one can estimate the energy output and evaluate the economic viability of wind and solar projects. These evaluations are crucial for designing efficient renewable energy systems and making informed decisions about their implementation.
For a wind generator, Weibull distribution is commonly used to model the wind speed probability distribution. The Weibull distribution takes into account the average wind speed, the shape factor (k), and the scale factor (c) to describe the probability of different wind speeds occurring. By analyzing historical wind data, the Weibull distribution parameters can be determined, and the PDF can be constructed. This information helps in assessing the energy production potential and the performance of a wind generator in a particular location.
The wind speed is a stochastic variable, its distribution is established through the Weibull Probability Density Function (PDF), defined by the scale factor (c) and shape factor (k). This is expressed mathematically as follows:

Wind power model
The amount of power produced by a wind turbine is directly proportional to the speed of the wind, expressed mathematically by the following equation (Biswas et al., 2017a):
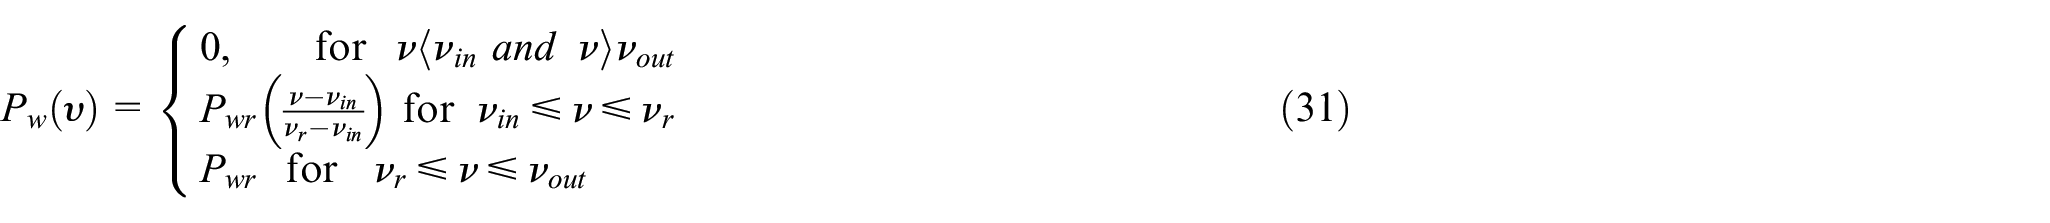
Where
Probability of wind power at various wind speeds
According to equation (32), if the wind speed


Unlike the discrete zones, the rated power output of the wind turbine remains continuous within a certain range

The solar radiation is typically modeled by using a lognormal distribution, the solar radiation is commonly modeled using a lognormal distribution. The lognormal distribution considers the average solar radiation, the standard deviation of the underlying normal distribution (σ) and the mean of the underlying normal distribution (μ). By analyzing historical solar radiation data, the lognormal distribution parameters can be estimated, and the PDF can be generated. This PDF aids in evaluating the energy production and performance of a solar PV unit in a given area.
The solar irradiance to energy conversion for the photovoltaic plant also can be given by

In the given context,
The proposed Kepler optimization algorithm
The Kepler optimization algorithm is a heuristic-search algorithm proposed by Abdel-basset et al. (2023) on March 2023, inspired by the orbital mechanics’ principles formulated by Johannes Kepler. It is a meta-heuristic algorithm used for optimization problems, particularly in the field of evolutionary computation.
The Kepler algorithm takes inspiration from Kepler’s laws of planetary motion, which define the motion of planets in our solar system as shown in Figure 1. It utilizes the concepts of attraction, orbit, and movement to guide the optimization process (Abdel-basset et al., 2023).
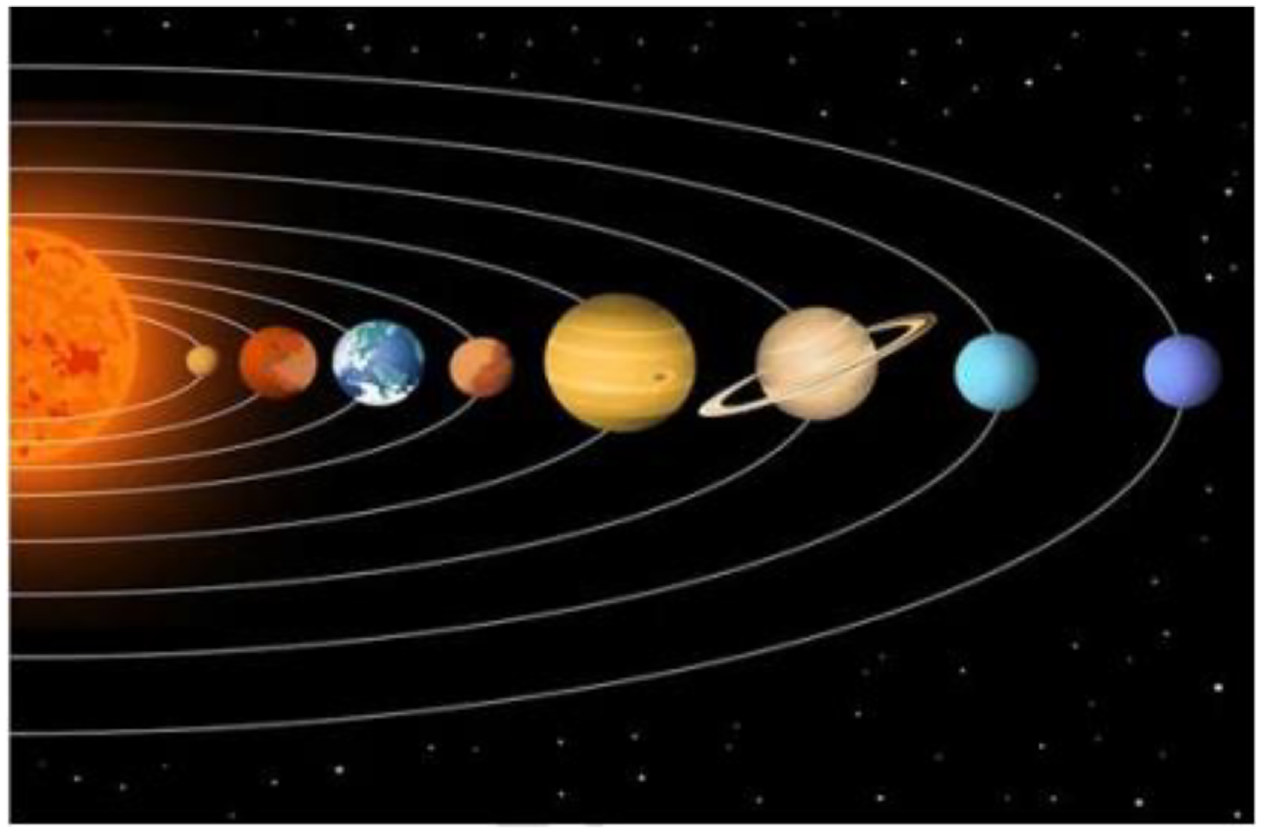
The motion of planets.
The proposed algorithm simulates Kepler’s first law by representing the search space with the Sun and revolving planets in elliptical orbits. The eccentricity is the number that characterizes how flat an ellipse looks, which is designated by e. The limiting cases are a line segment (e = 1) and the circle (e = 0). Figures 2 and 3 illustrates different ellipse shapes.
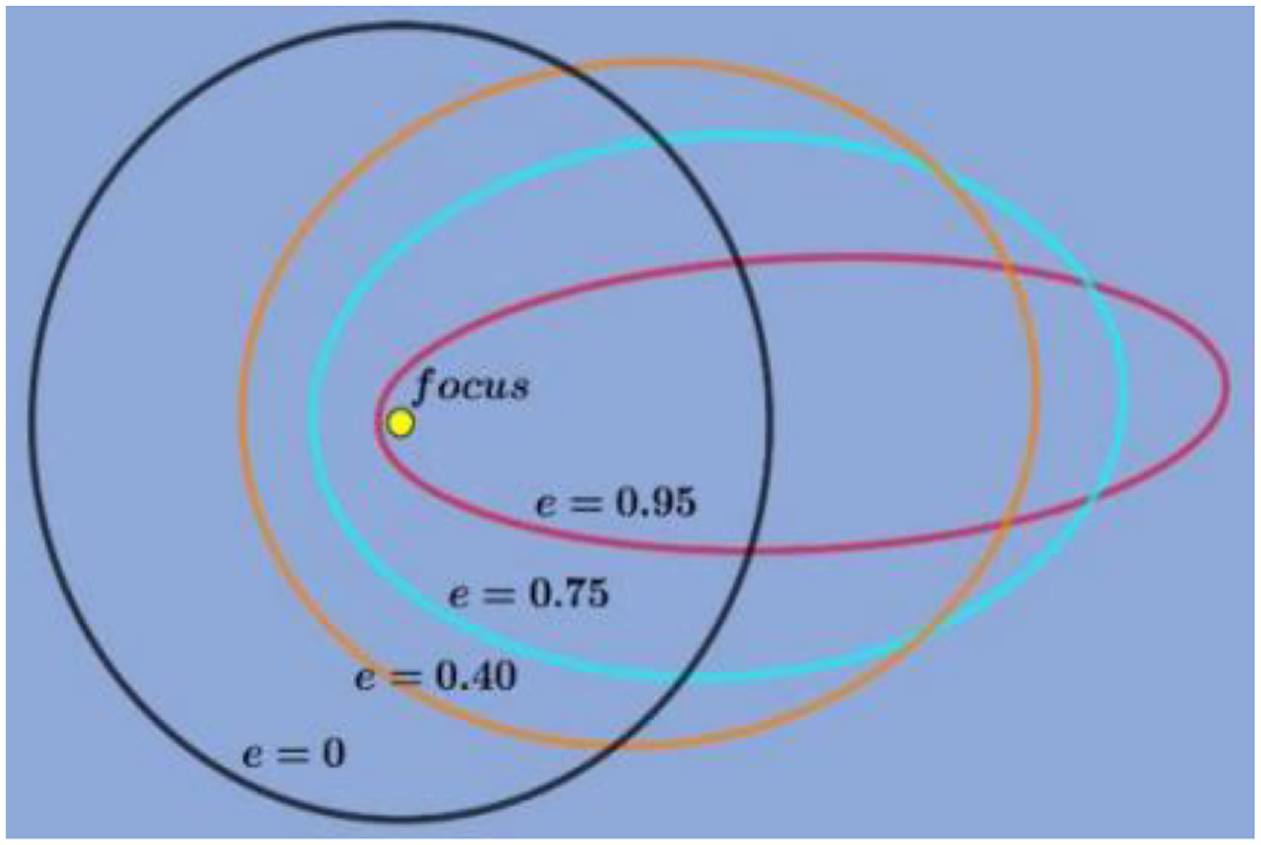
Different ellipse shapes.
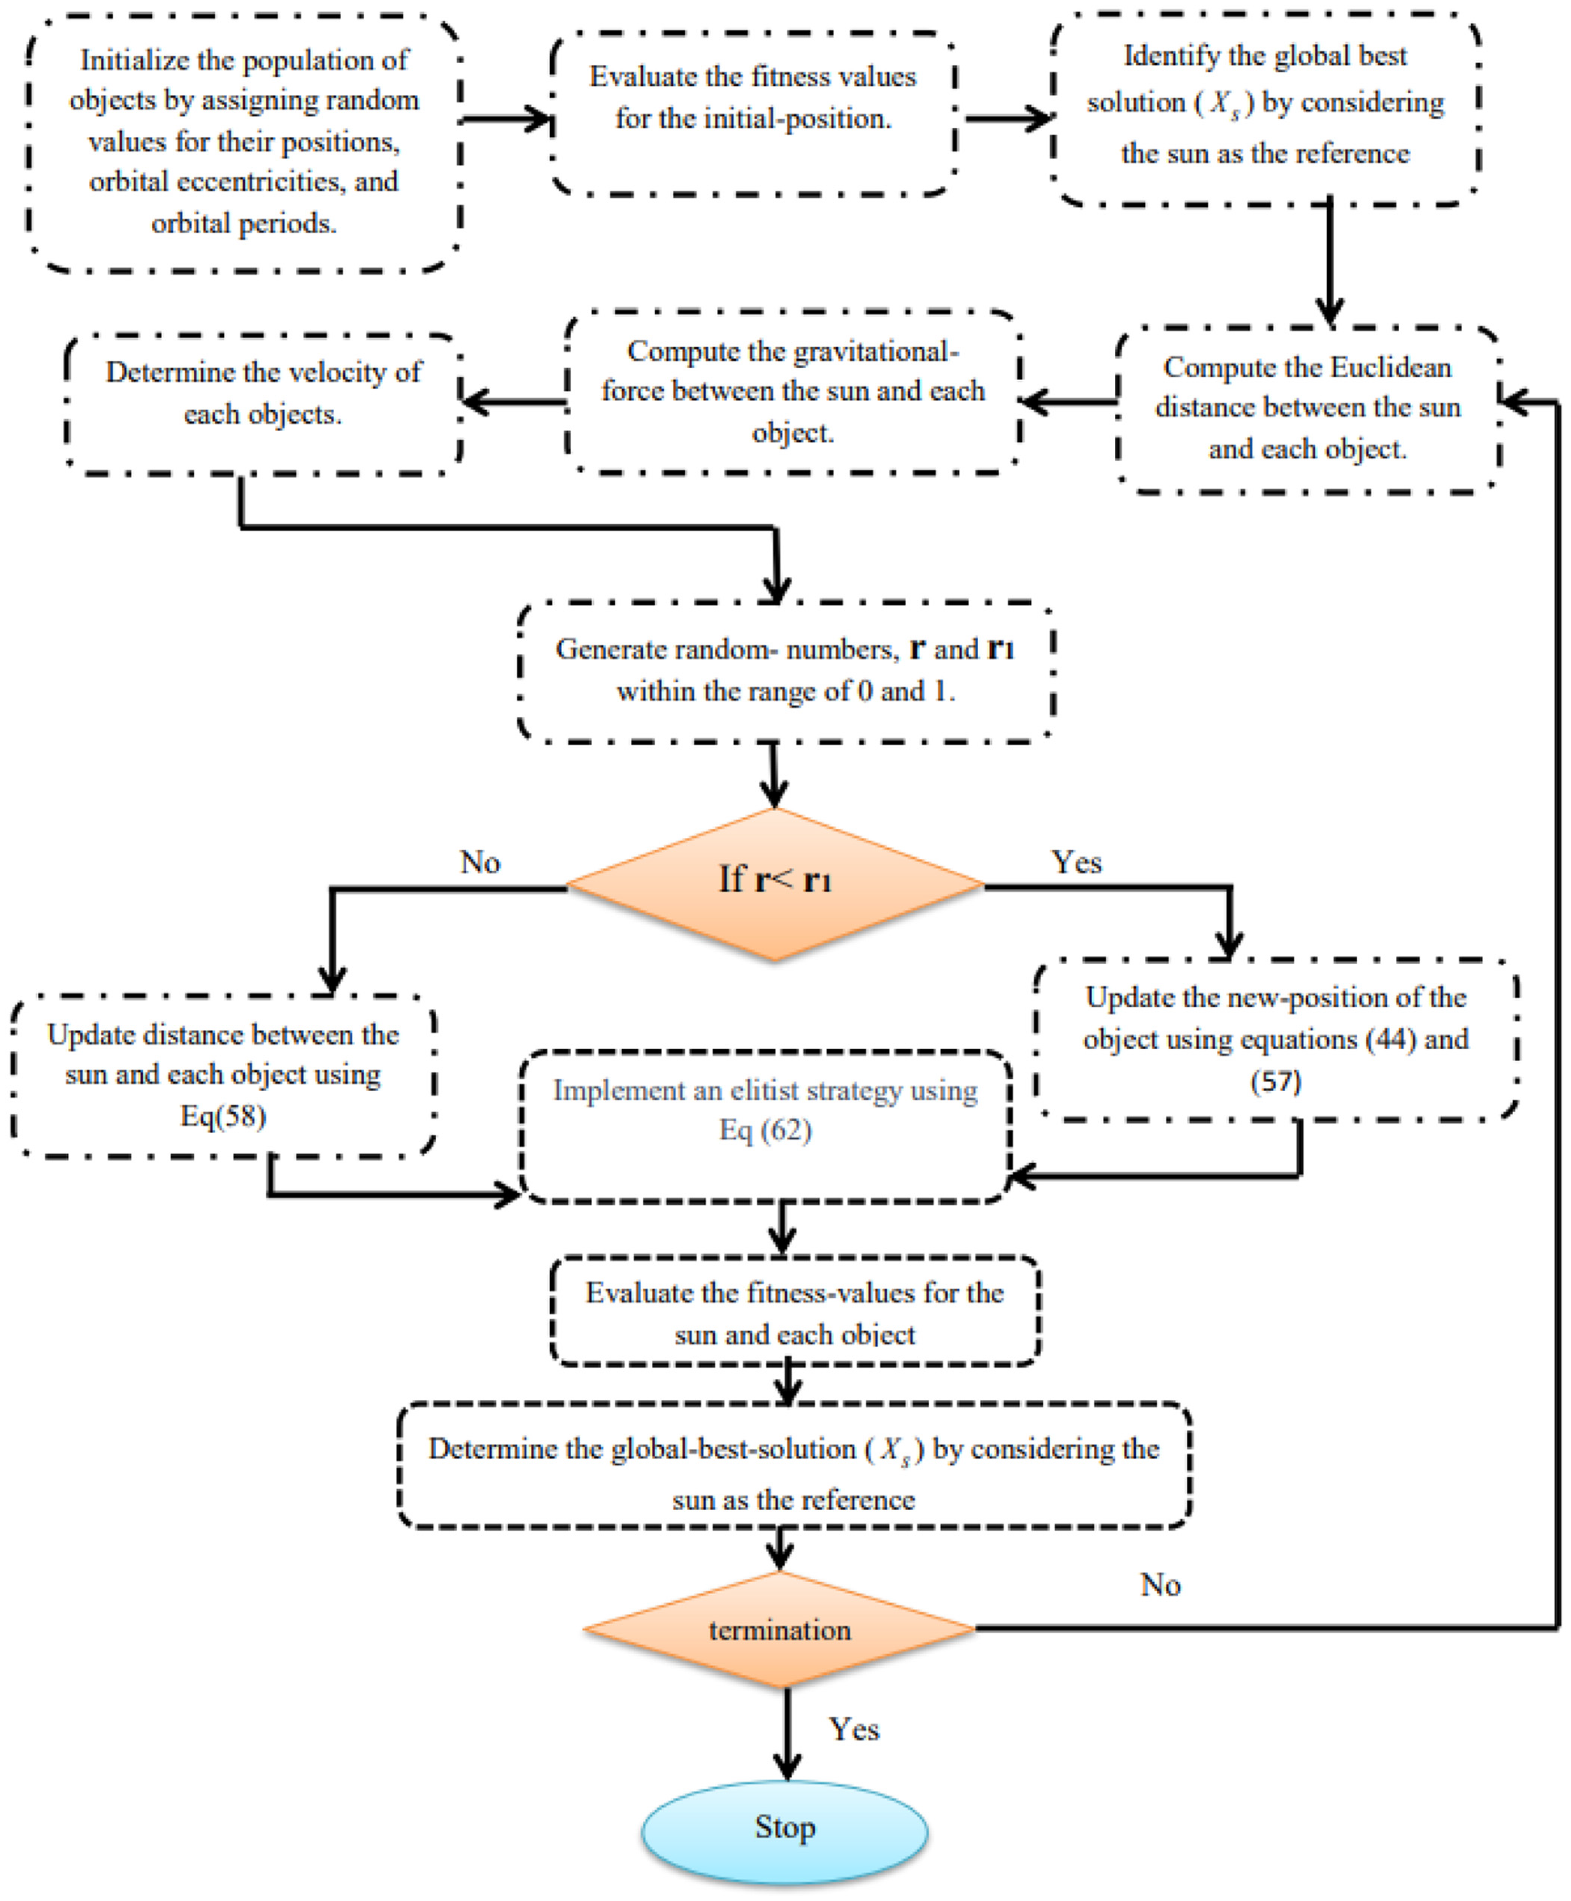
Flowchart of (KOA).
In this approach, the planets (candidate solutions) explore and exploit the search space more efficiently by being in diverse situations from the Sun (the best solution) at different epochs.
Similar to other metaheuristic algorithms, the Kepler optimization algorithm starts with an initial population of potential solutions and iteratively improves them to find the optimal solution. The algorithm utilizes the principles of attraction and movement, where the solutions are attracted toward promising regions in the search space and move toward better solutions over generations.
In our study, the term “time” is used instead of “iteration” because it aligns with the theory of solar system and cosmology. Through optimization in KOA, we apply the following rules:
- The planet’s (candidate solution’s) orbital period is randomly chosen following a normal distribution.
- The eccentricity of the planet’s orbit is randomly selected between 0 and 1.
- The fitness of a solution is determined based on the objective function.
- The best solution in each time is represented by the Sun, the central star.
- The distance between the planet and the Sun changes according to the current time.
The remaining section provides the mathematical model, and the processes of the proposed KOA:
Phase 1: Initialization process
During this stage, (N) planets (representing the population size) are dispersed randomly within (d) dimensions, symbolizing the decision variables, employing the subsequent expression.

Where
The initial orbital eccentricity (e) for each object indexed as ith is set using equation (37):


r is a randomly generated by the normal distribution.

Where


To introduce divergence in the mass values for different planets,

γ is a constant;
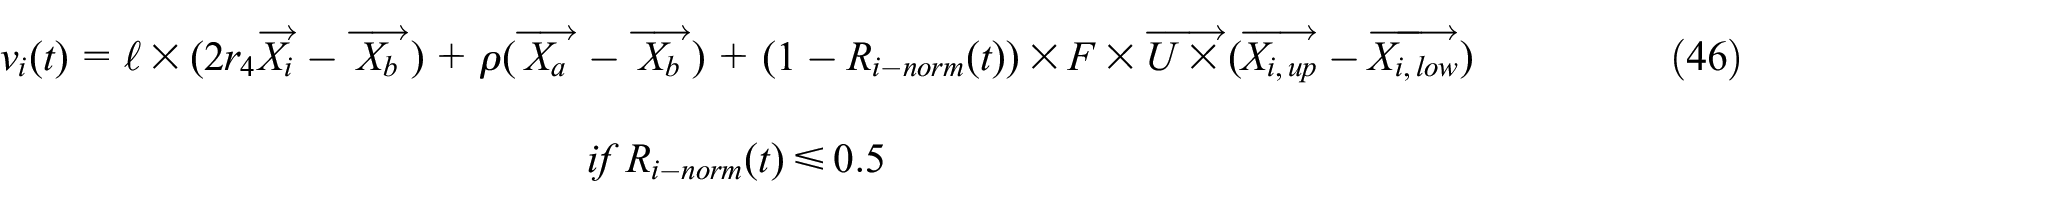
Phase 3: Calculating of planets velocity
The velocity of a planet depends on its proximity to the Sun. When close to the Sun, the planet’s velocity increases to counteract the strong gravitational pull. Conversely, when far from the Sun, the velocity decreases due to weaker gravitational forces. This behavior is mathematically expressed in equations (46) and (47) to enhance its search strategies, KOA benefits from diversifying its search strategies. However, this can lead to reduced diversity in solutions and slower progress when planets are near the Sun. To correct this, we incorporate a step size based on the optimization problem’s boundaries. This helps maintain planet velocity and prevents getting trapped in local minima. Additionally, the equation calculates planet velocity based on the assumption that planets are distant from the Sun However, to prevent the population from losing diversity and velocity near the sun, the equation calculates the velocity of the planet based on the difference between a randomly chosen solution and the current one, resulting in a reduction of the velocity of planets compared to the initial iteration.
However, the second fold lacks solution diversity, limiting KOA’s ability to navigate away from local optima due to minor changes in the current solution is addressed by introducing a second step size that takes into account the distance between the optimization boundaries in the second fold.
Else


In these equations,

Where

Equation (49) calculates the steps percentage for each object’s change. If
Phase 4: Avoiding the local optimum
In the solar system, celestial bodies typically revolve around the Sun in a counterclockwise direction while also rotating on their own axes. Nevertheless, there are exceptions, with some objects orbiting in a clockwise direction. The suggested algorithm leverages this phenomenon to prevent entrapment in local optima. The KOA algorithm integrates a flag
Phase 5: Updating objects’ locations
During the orbital motion around the sun, objects demonstrate a cyclic pattern of approaching and moving away. The KOA algorithm captures this behavior with an exploration-exploitation approach. In the exploration phase, objects distant from the Sun are explored broadly, uncovering new solutions. Simultaneously, objects near the Sun aid precise exploration for optimal solutions. The algorithm updates the position of distant objects using a specific equation during this phase.

In this context,
Phase 6: Updating the object’s distance from the Sun
KOA prioritizes optimizing the exploitation operator for planets near the Sun and the exploration operator for distant Sun objects. Decisions hinge on a regulating parameter that evolves gradually. A high \(h\) prompts the use of the exploration operator, promoting orbital separation from the Sun. Conversely, a small \(h\) leads to the exploitation operator, focusing on sections near the best-so-far solution. This mathematical concept enhances both KOA’s exploitation and exploration operators, particularly when planets are closest to the Sun.

Where h serves as an adaptive factor, regulating the distance between the current planet and the sun at time t, as indicated below:

where r is a randomly generated number from the normal distribution, and η is a factor that decrease linearly from 1 to −2, as represented below:

where

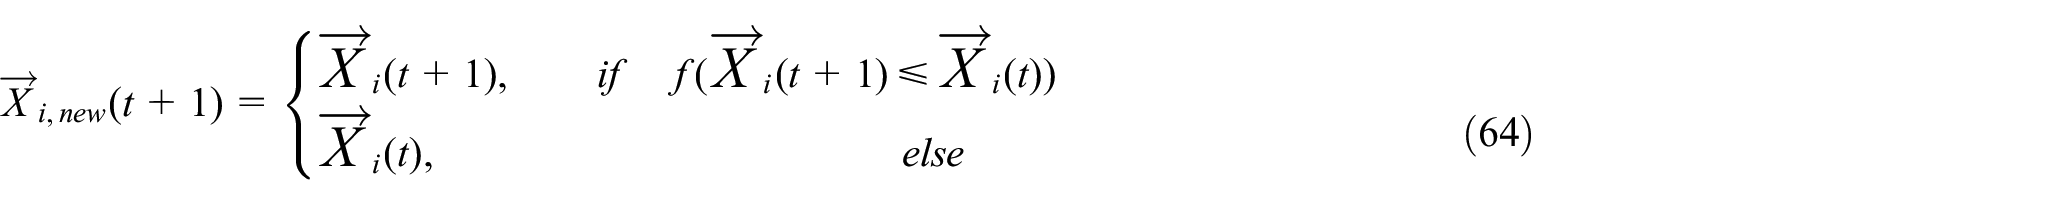
Phase 7: Elitism
The purpose of this phase is to apply an elitist approach, to ensure that the best positions for both the Sun and planets are maintained. This process can be succinctly expressed using equation (64).
Enhanced Kepler optimization algorithm
It is recognized that the performance of meta-heuristic technique can be ameliorated by fulfilling the suitable equilibrium between the two opposing phases. The initial phase, focused on local search, referred to as exploitation, while the subsequent phase, which aims to search globally, is known as exploration. The global minima can be guaranteed, and reducing the search space through these phases helps prevent the technique from becoming trapped in local minima (Hashim et al., 2023). A slight modification to this technique is introduced to generate a substantial exploration through a deeper search for new neighbor solutions in the search space. Hence, an operator phi is suggested to strike a better balance between the exploration and exploitation stages. More precisely, this operator also acts significantly on the acceleration of algorithm convergence rate. This operator decreases linearly during iterations from 1 to 0.5 using the equation (65):

Where
Simulation results
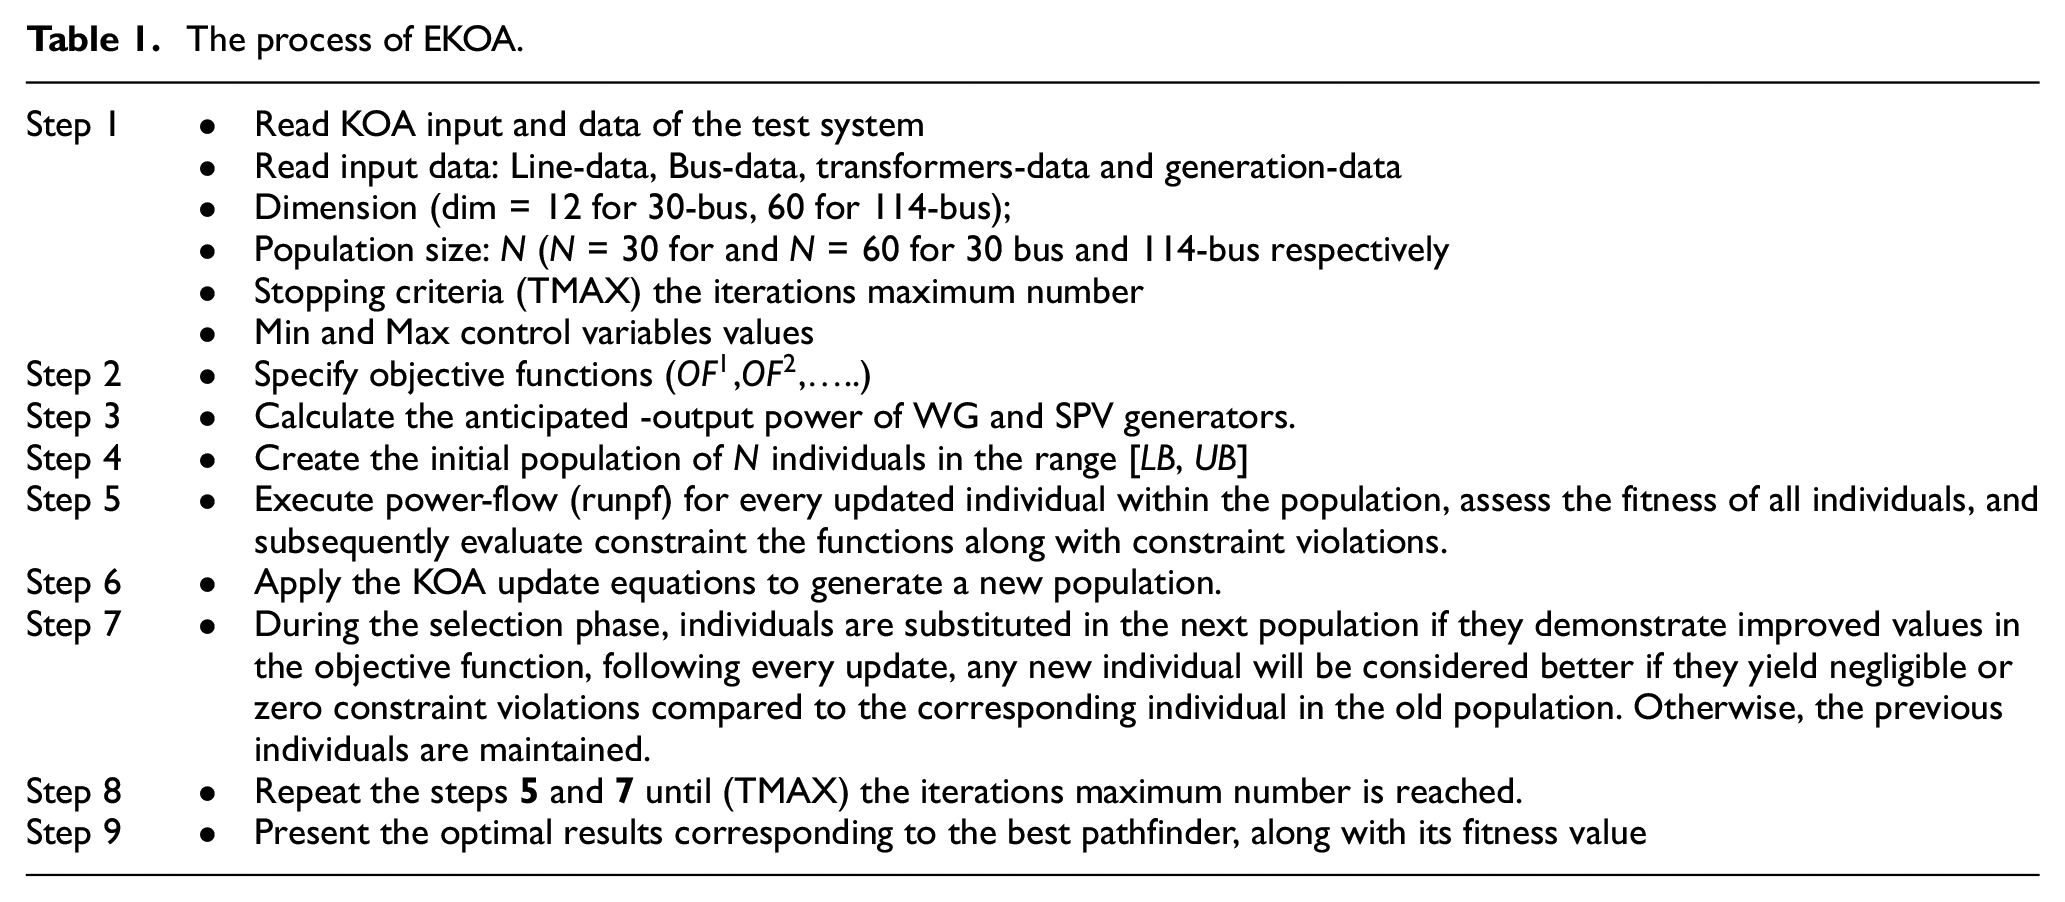
For the purpose of proving the effectiveness and practicality of the EKOA for addressing stochastic OPF (Optimal Power Flow) problems that incorporate solar PV and wind power generators, we conducted an analysis on the modified IEEE 30 bus network and the Algerian electricity network DZA 114 bus. Various objective functions were considered during the examination. The implementation of the proposed algorithm was carried out using the MATLAB software, and the simulations were performed on a personal computer equipped with an Intel Core™ i7-8300H 2.22 GHz processor and 8.00 GB RAM. In order to determine an appropriate population size for the Kepler Optimization (KOA) algorithm, empirical tests were conducted by executing the algorithm with varied population sizes, such as 20, 40, 60, and 80. The specific results of these tests are not provided in this document; however, we only mention the population sizes that yielded the best outcomes. Consequently, for all simulation cases, a population size of 30 individuals was selected for the IEEE 30-bus network, while 60 individuals were chosen for the DZA 114-bus system. Furthermore, the iterations maximum number was set to 300 for the IEEE 30-bus network 400 and for the practical 114-bus power system. To ensure an equitable comparison, the control variables of the two test systems were treated as continuous variables. Table 1 represent the optimization procedures with the EKOA.
The process of EKOA.
Test system 1: Modified IEEE 30 bus power system
With the aim of demonstrating the effectiveness of the Enhanced Kepler optimization algorithm, a series of case studies were conducted on the IEEE-30 bus system, Figure 1 represent the configuration of the IEEE 30 bus system, which was modified by incorporating two wind generators at buses 5 and 11, as well as a solar PV generator at bus 13. Detailed data can be found in Mouassa et al. (2024). The deterministic optimal power flow (OPF) scenarios for the modified system configuration were analyzed, specifically excluding the wind turbine generators (WT) and photovoltaic (PV) units. Four different cases were examined, each with their respective objective functions as outlined in the previous section. The findings of the case studies utilizing the Kepler algorithm are presented in a tabulated format, along with corresponding explanations provided in this section (Figure 4).
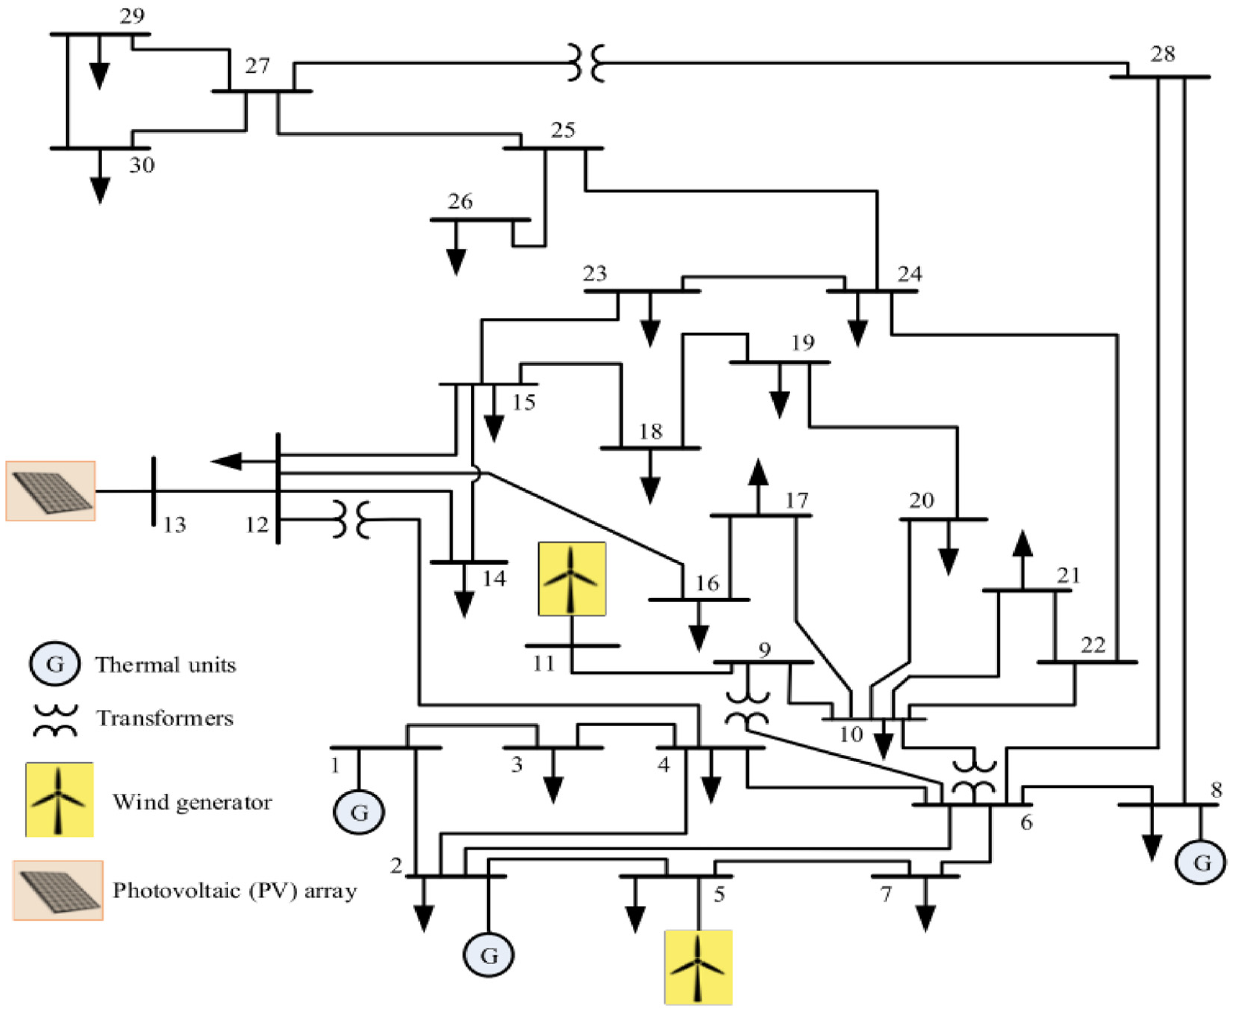
The modified IEEE 30 bus system.
Case 1: Total generation cost minimization
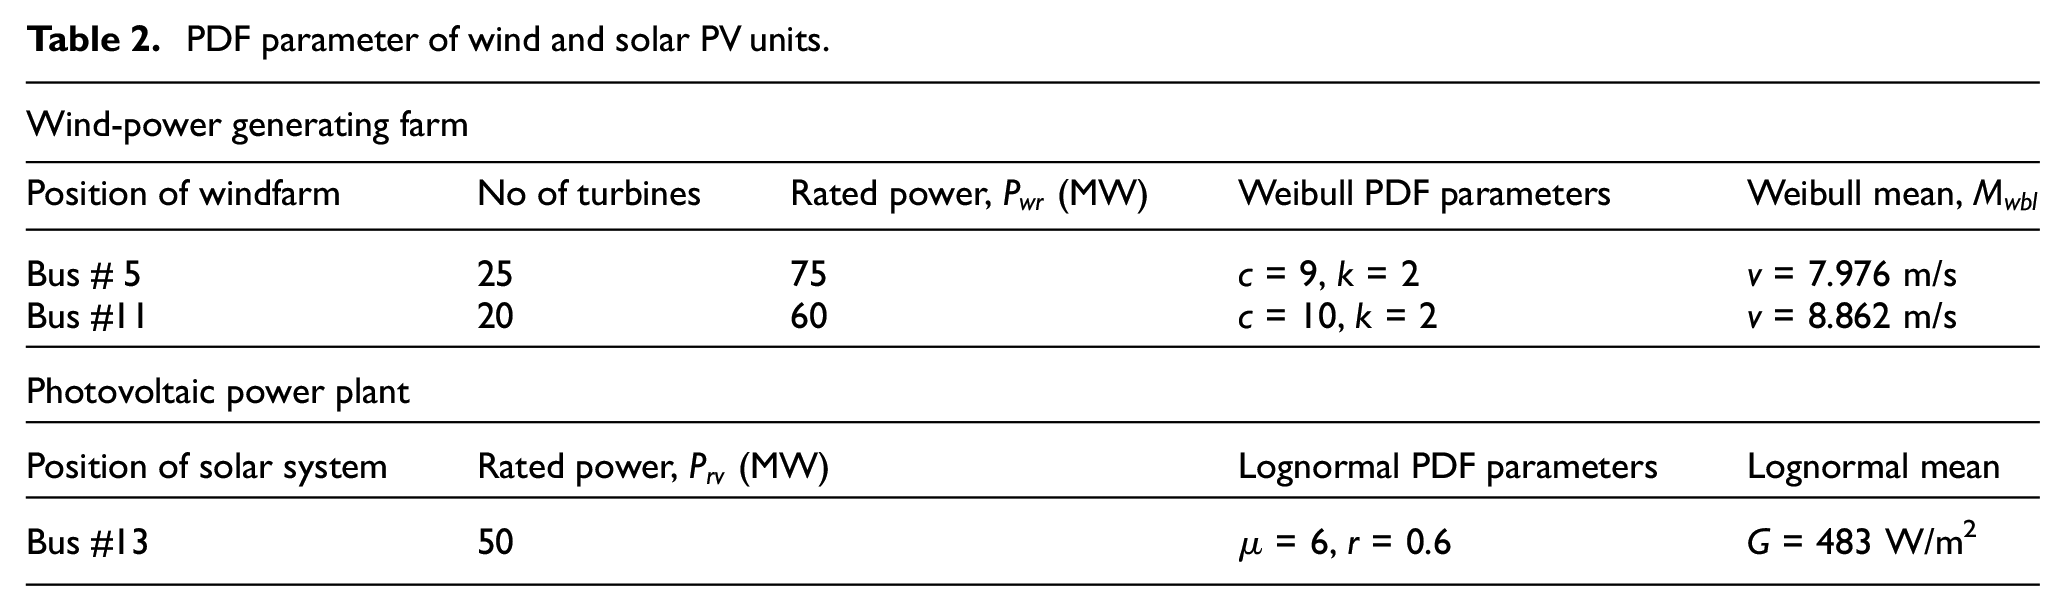
In the first case, the main objective is to minimize the total generation cost, taking into account the contributions from wind, solar. Where these last two both have the direct, penalty and reserve costs, the results obtained are based on the parameters of Weibull, lognormal probability density functions (PDFs). The specific PDF parameters for the renewable energy sources can be found in Table 2, furthermore, Emission and cost coefficients of thermal generators of IEEE 30 bus are represented in Table 3, which is referenced in Biswas et al. (2017b). The fitting of the Weibull distribution and the frequency distribution of wind speeds are depicted in Figure 5, generated via the simulation of 8000 Monte-Carlo scenarios. Additionally, Figure 6 displays the fitting of the lognormal distribution and the frequency distribution of solar irradiance, obtained from the simulation of a sample size of 8000 Monte Carlo scenarios. Furthermore, Figure 7 showcases the distribution of the power generated by the solar photovoltaic (PV) generator located at buss 11. The selection of optimal sites for wind farms and PV power generation is influenced by various factors, including wind speed and solar radiation (Figure 8; Hassan et al., 2021a).
PDF parameter of wind and solar PV units.
Emission and cost coefficients of thermal generators of IEEE 30 bus network.

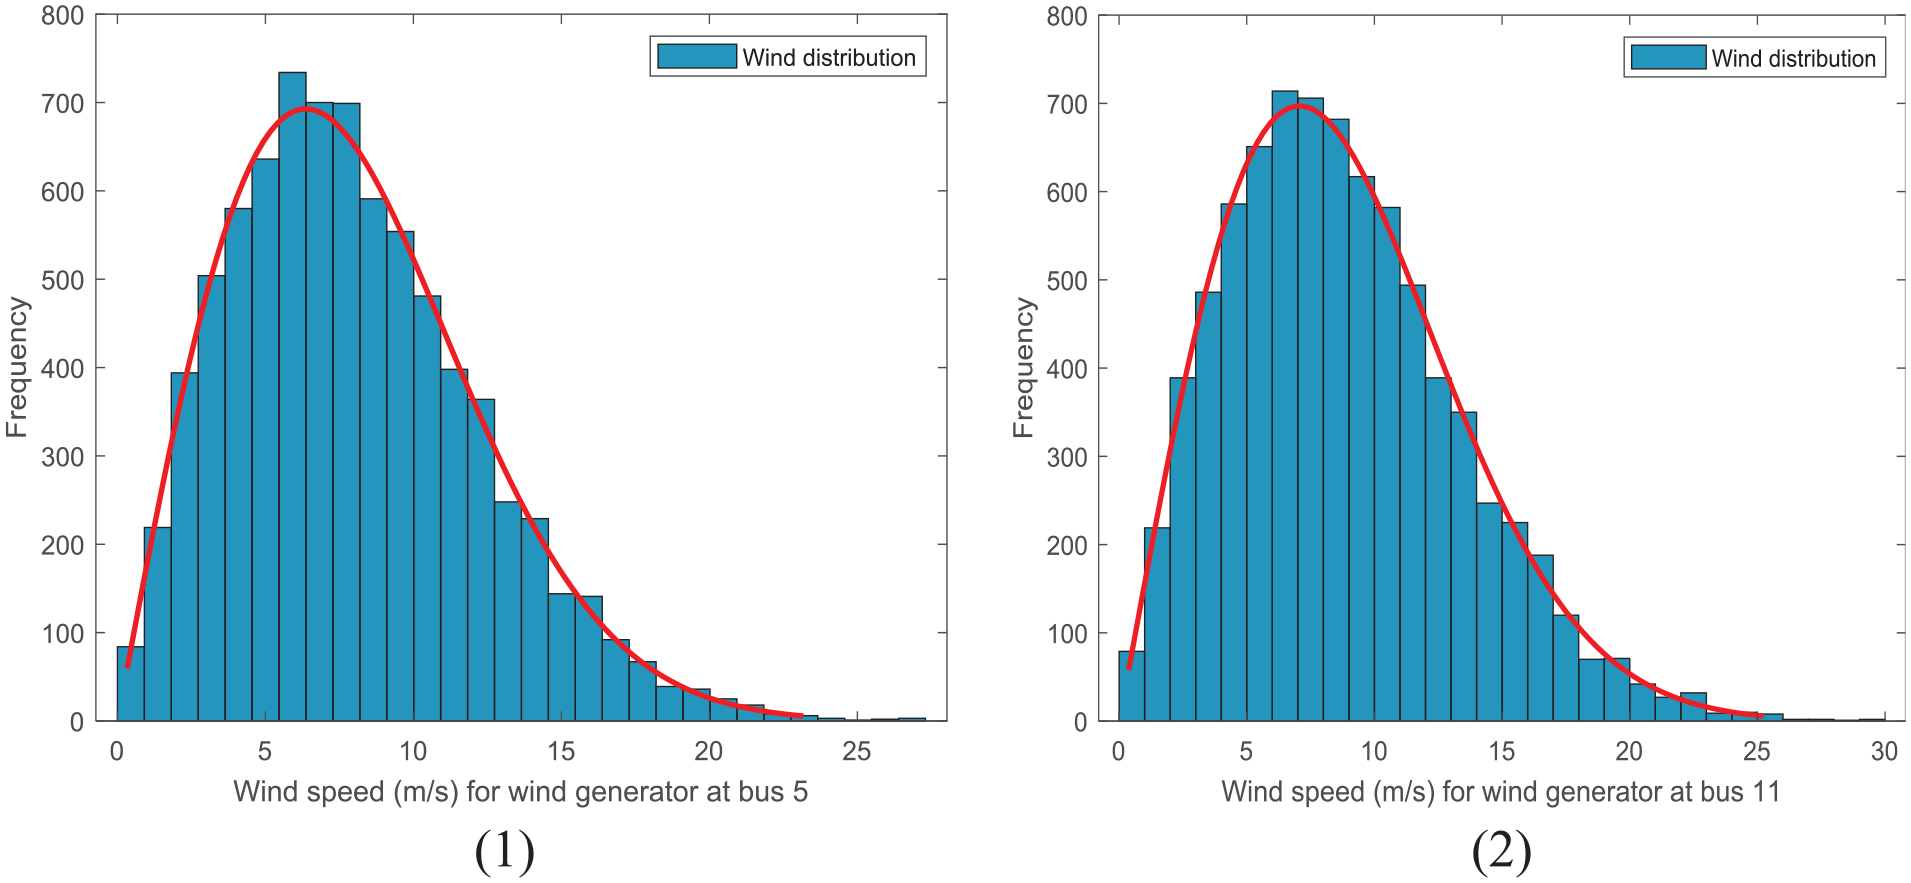
The speed of wind (Weibull PDF): (1) WG1 and (2) WG2.

Lognormal PDF of solar irradiance for SPV bus 13.
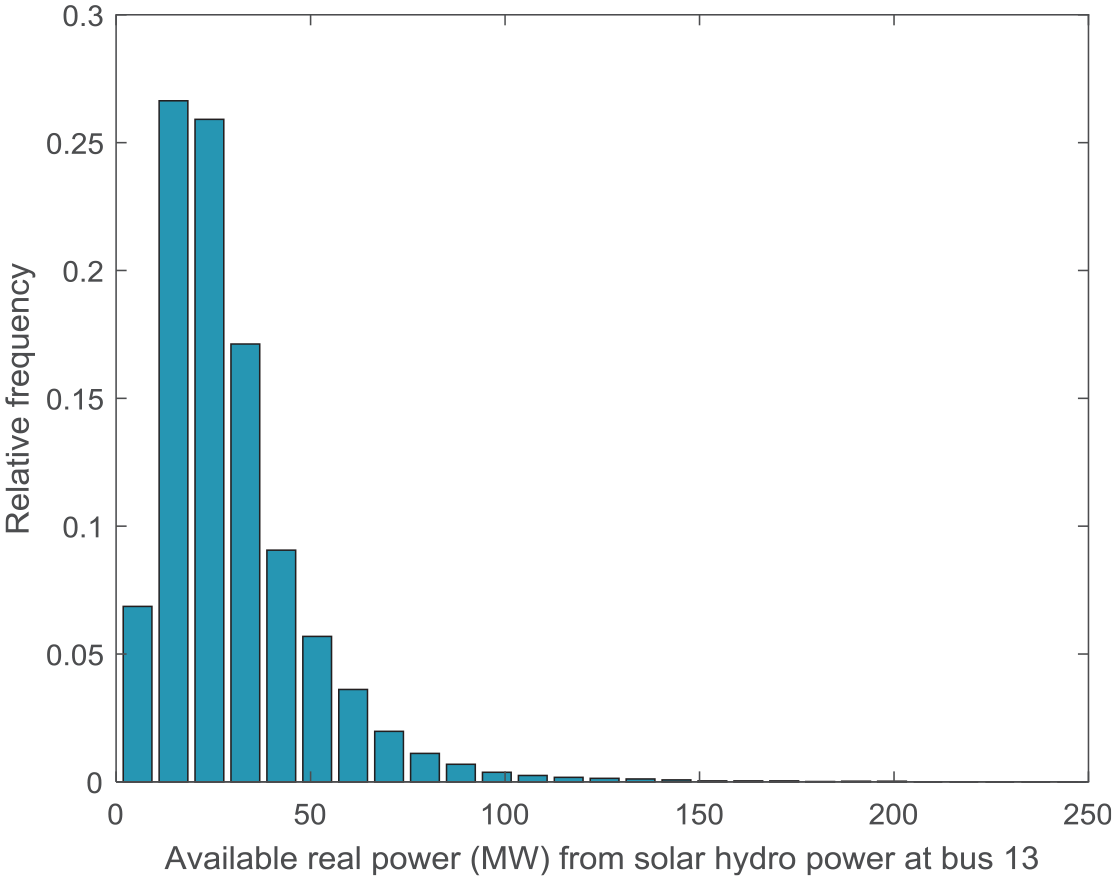
Available real power from SPV unit.
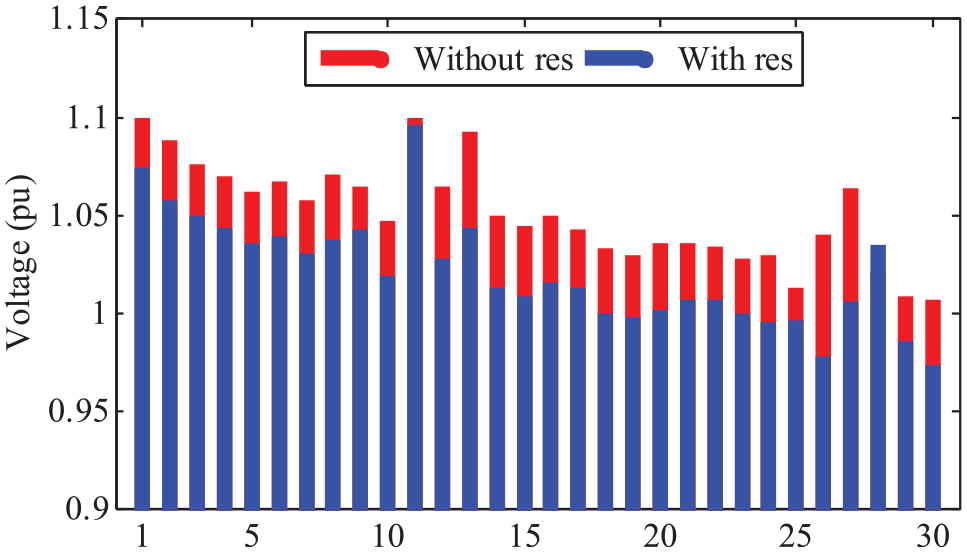
Voltage profile of 30 BUSS with and without RES.
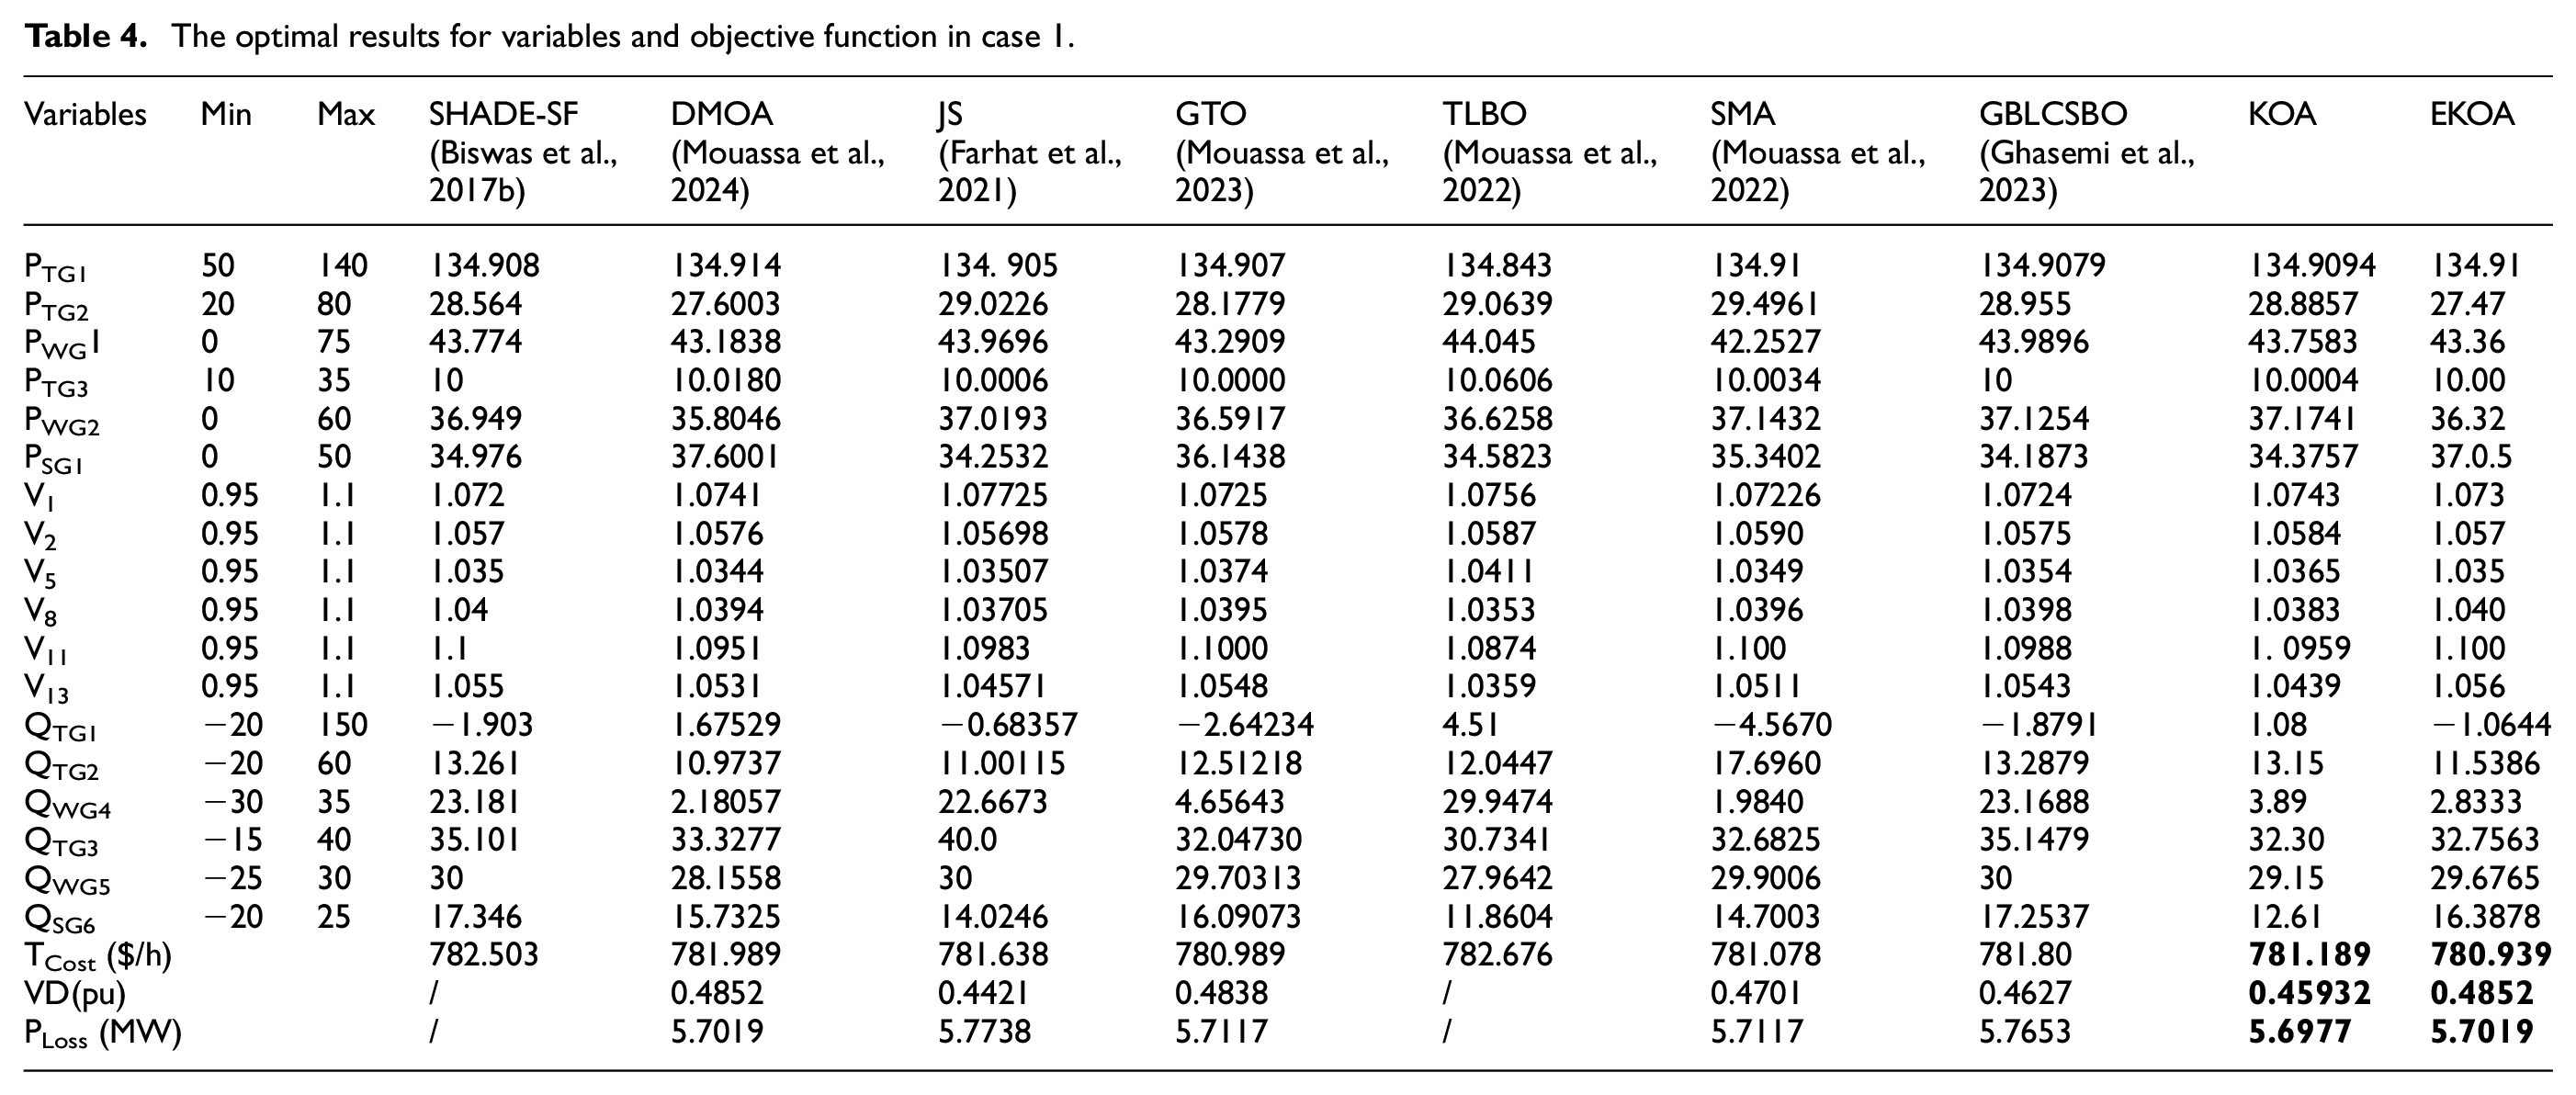
The results indicate that among the compared optimizers, EKOA consistently achieves the lowest generation cost as demonstrated in Table 4. The optimal generation cost attained by EKOA is 780.939 and 781.18 MW by the KOA, the rapidity of convergence and the superiority of the EKOA over KOA is represented in the Figure 9, while other optimization techniques, such as DMOA (Dwarf Mongoose optimization algorithm), yield 780.989 $/h, TLBO (Teaching-Learning-Based Optimization) results in 782.676 ($/h), SHADE-SF (Shade-based Success-History Feedback) generates 782.50 $/h, jellyfish optimization produces 781.638 ($/h), the artificial ecosystem optimizer achieves 781.521($/h), the hunger games search obtains 781.86 ($/h), orca predation algorithm generates 782.076 ($/h), and the gorilla troops optimizer (GTO) obtains 781.26 ($/h), (GBLCSBO) 781.80 ($/h), and slim mold algorithm (SMA) 781.07 ($/h).
The optimal results for variables and objective function in case 1.

Convergence curve for case 1 30-bus system.
Based on the literatures and the simulation results presented in Table 4, It can be inferred that the integration of (RES) leads to a decrease in the total power production cost. The initial reference cost of thermal power production is about 800.00 $/h reduced to 780.939$/h, resulting in a cost reduction of approximately 19.06 $/h. To put it more precisely, if this cost-saving rate of 19.06 $ per hour is maintained throughout the operating time of 7500 hours per year, the proposed optimizer EKOA can save a total of 142,950 $ annually. This clearly indicates that the incorporation of solar PV power plants and wind generators substantially contributes to decreasing the total generation cost when compared to the initial system configuration without renewable energy sources. For further comparison and statistical analysis for the case 1 of the EKOA algorithm with other algorithms, please refer to Table 5.
statistical analysis for the case 1 of the EKOA algorithm with other algorithms.

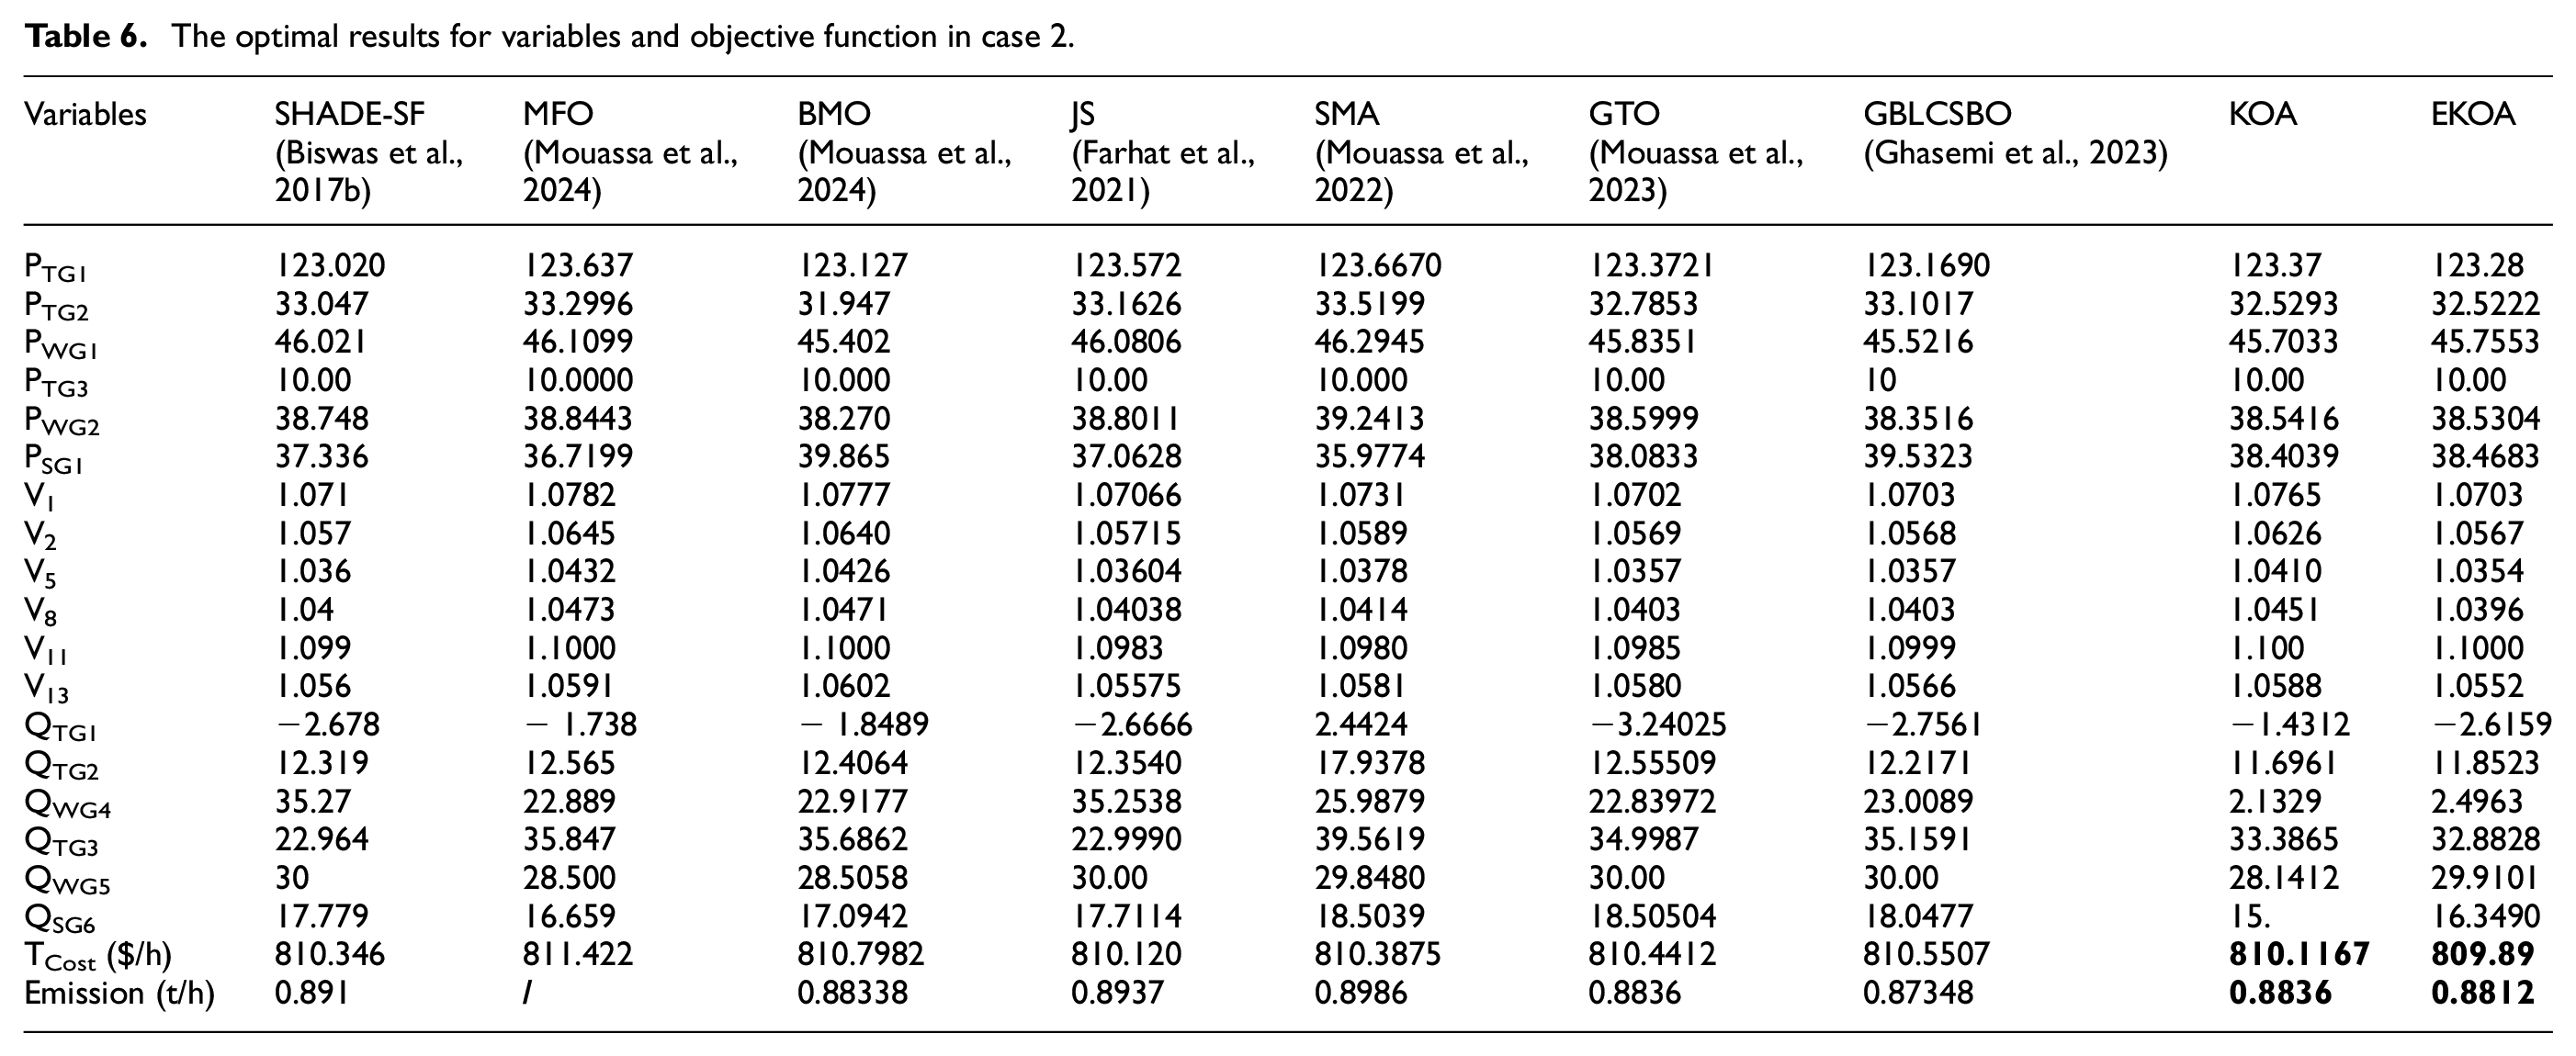
Case 2 minimizing the total cost with emission-carbon tax
In the second case, the minimization of the quadratic emission and total power production cost functions was conducted, taking into account the carbon tax referred to as (Ct) applied to thermal power generators. The specified carbon tax value is set at 20 $/ton. The introduction of the carbon tax notably increases the level of (RES) penetration, as evident in the simulation results listed in Table 6. EKOA consistently achieves the lowest generation cost 809.89 and lowest emession with 0.8812 ton/h compared to KOA with 810.1167 $/h and 0.8836 ton/h of gazes. The penetration ratio of RES in the optimal generation schedule is determined by the emission rate, influenced by carbon tax value. The primary objective is scheduling more power from the (RES) to keep the emission volume at minimum level.
The optimal results for variables and objective function in case 2.
Case 3: Optimized cost versus the reserve cost
In this case, all parameters remain unchanged from case 1, except for the reserve-cost coefficients. Specifically, the coefficients of solar PV and wind units were incrementally adjusted in discrete steps of 1, commencing from 4 and reaching 6. Specifically, we considered three cases: (RK) = 4 (case 3-1), RK = 5 (case 3-2), and up to RK = 6 (case 3-3). However, the coefficients of penalty-cost for all (RES) remain unchanged from case 1. The optimal power schedules of the generators are depicted with a bar graph in Figure 10, allowing for a comparison with the schedules obtained in the base case (case 1).

Variation of the scheduled active power versus the reserve cost coefficients.
When examining this case study, it was Noticed that as the reserve cost coefficient increased, the participation of the wind and solar PV generators gradually decreased as shown in Figures 10 and 11, leading to a shortfall in the scheduled power. Consequently, an immediate provision of spinning reserve became necessary to address this deficit. The compensatory measure involved thermal generators, which consequently raised the thermal power generation cost due to the amplified output power, in contrast the cost of solar PV wind units decreases as depicted in Figure 12.
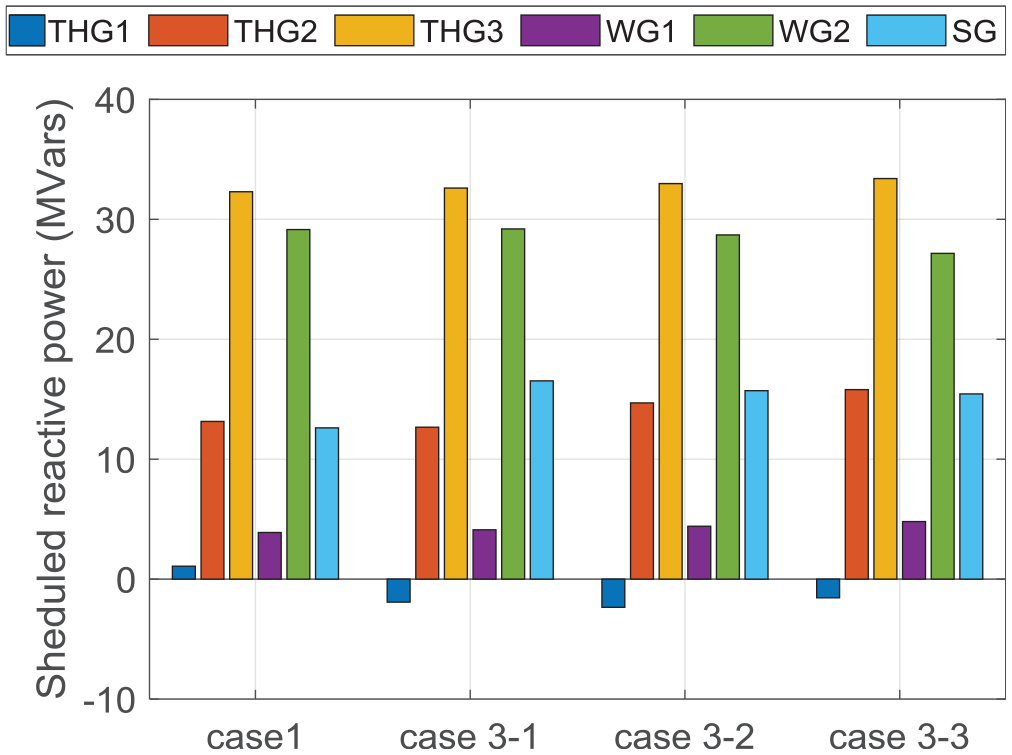
Variation of the scheduled reactive power versus the reserve cost coefficients.
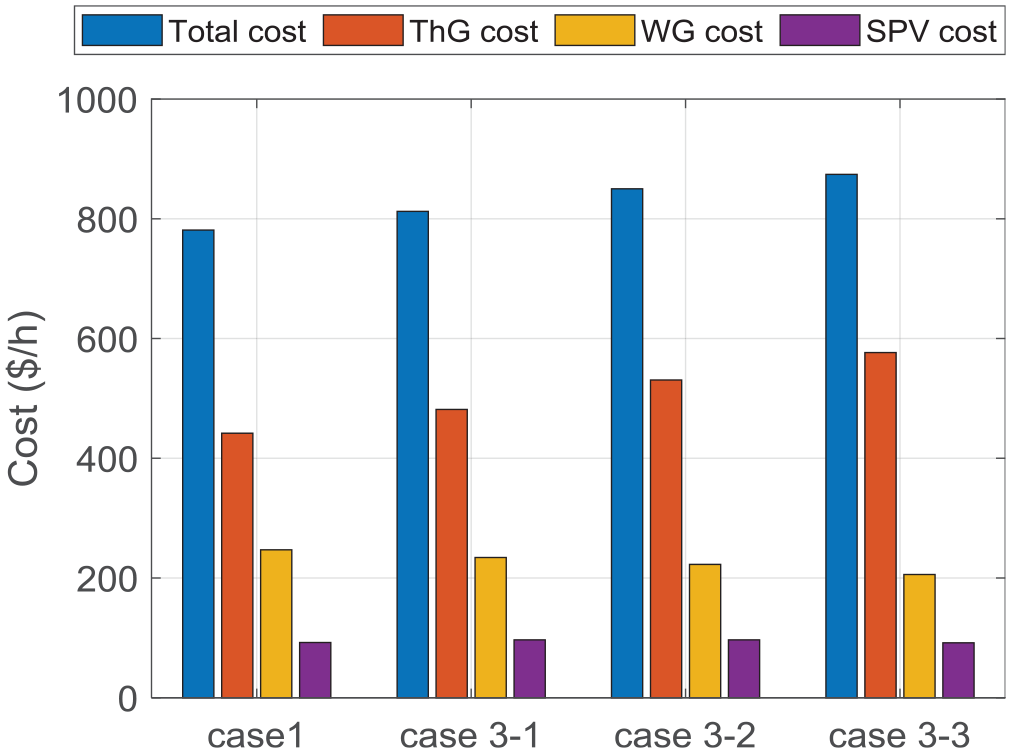
Variation of production cost against reserve cost coefficients.
Case 4: Optimized cost versus the penalty cost
In the fourth case, the reserve cost parameters remain unchanged from case 1, with the exception of the penalty cost coefficients. Specifically, the penalty-cost coefficients for all wind generators and the photovoltaic power plant are elevated from 4 to 6 in a sequential order: PK = 4 (case 4-1), PK = 5 (case 4-2), and PK = 6 (case 4-3). Figures 13 and 14 presents a bar graph showing the optimal active and reactive power schedules respectively for the six generators in comparison to those obtained in case 1, also shown in the same figure. When Figure 15 shows the different production costs variations with the variation of penalty cost.
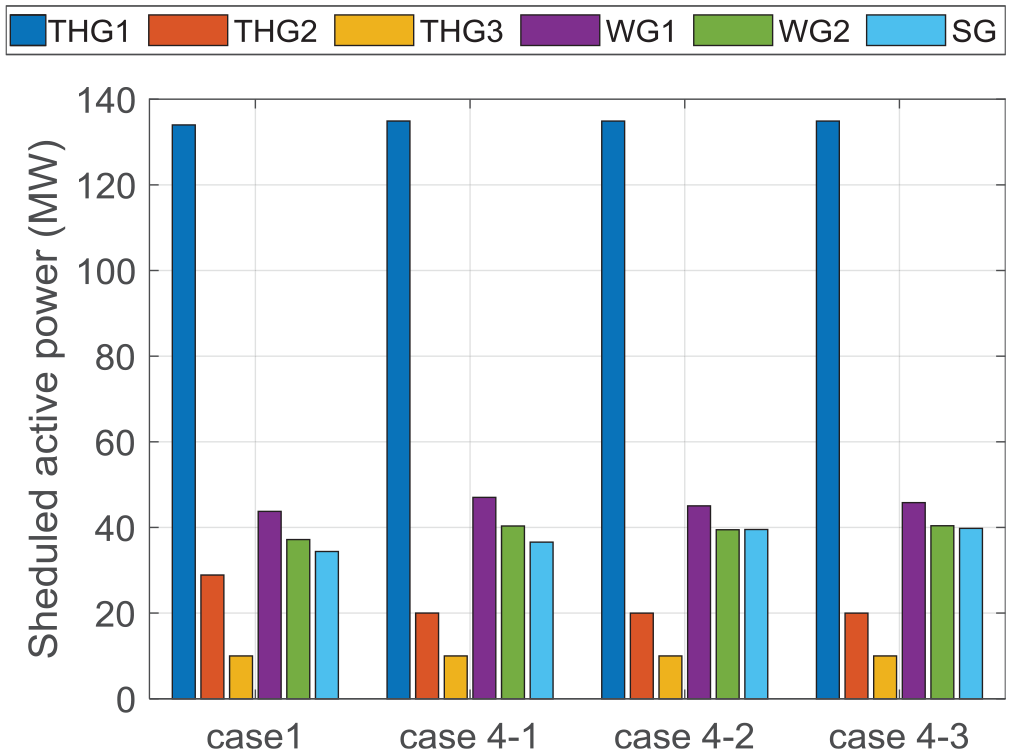
Variation of the scheduled active power versus the penalty cost coefficients.

Variation of the scheduled reactive power versus the penalty cost coefficients.
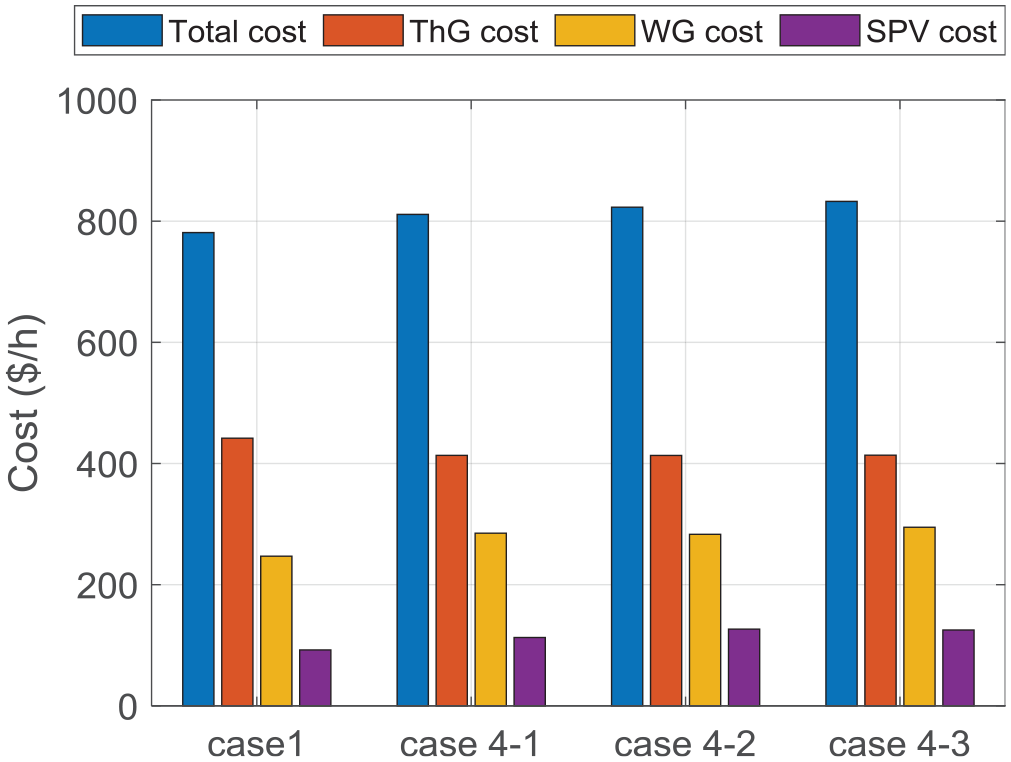
Variation of production cost against penalty cost coefficients.
In the fourth scenario, the reserve cost parameters remain consistent with those of case 1, with the exception of the penalty cost coefficients. Specifically, the penalty-cost coefficients for all wind generators and the photovoltaic power plant are elevated from 4 to 6 in a sequential order.
As the penalty cost coefficient increases, the participation of solar PV and wind and generators has gradually increased, leading to an increase in the power scheduled from (RES) generators. As a result, there is a non-uniform decrease in the output of thermal generating units, as shown in Figure 13. The economic dispatch analysis among three thermal generators indicates that a significant portion of the power is dispatched to the lowest production cost generator. Conversely, the scheduled output of all (RES) also exhibits non-uniform patterns. This variation can be attributed to the inherently nonlinear relationship between the probability density function (PDF) and the reserve and penalty cost associated with solar PV and wind generators. It is worth noting that the cost of thermal generators, decreases while an overall steady increase in the total generation cost is observed.
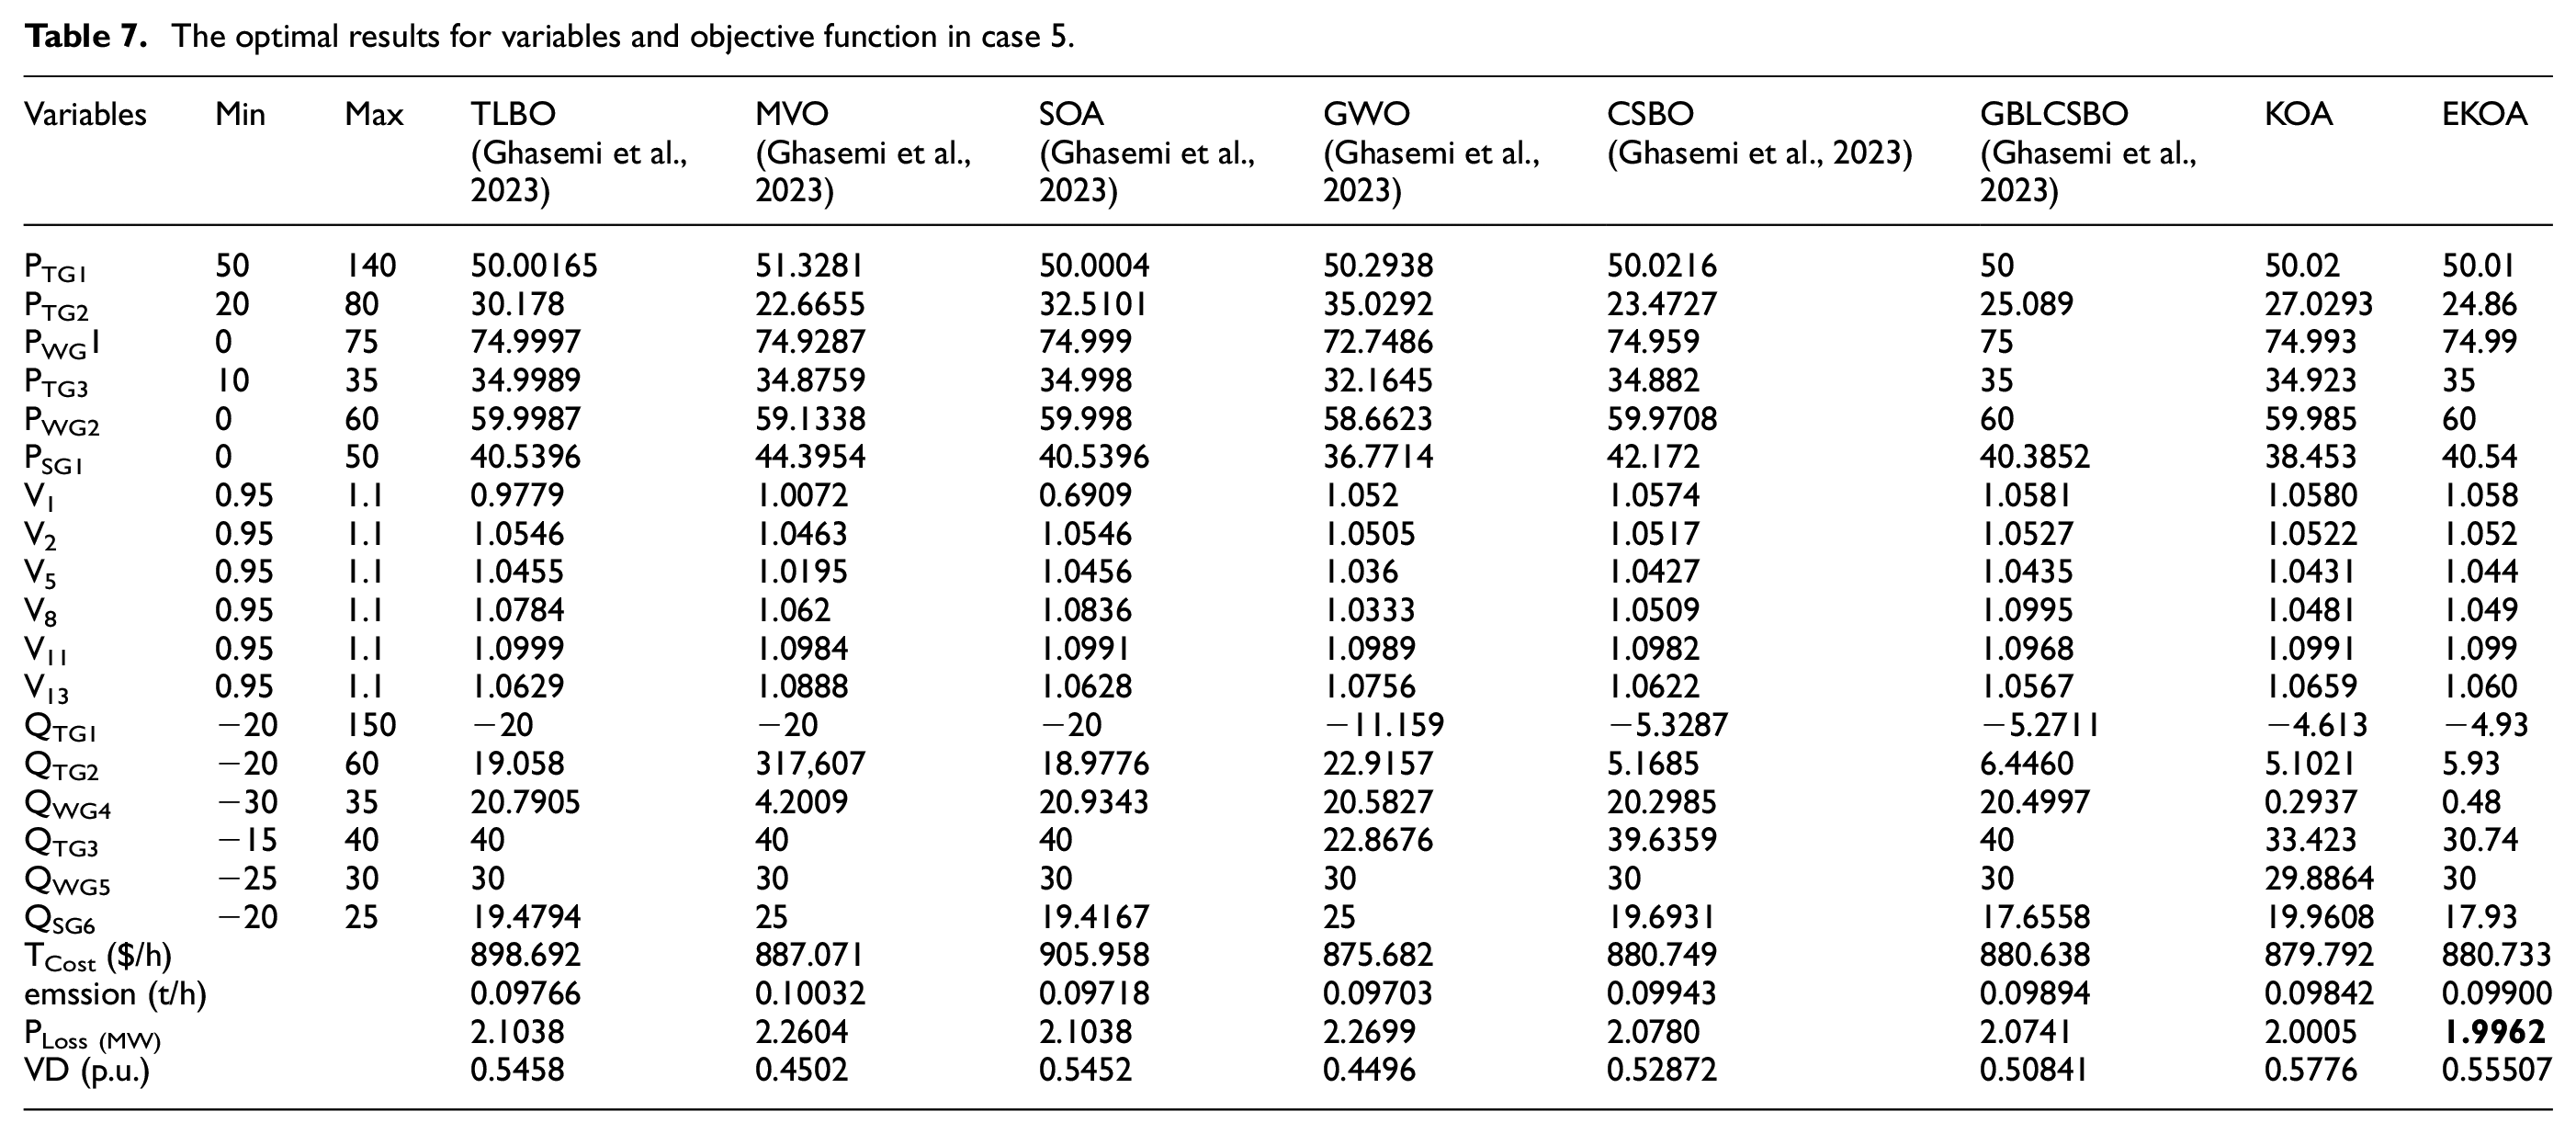
Case 5: Minimization of the real power losses
The case 5 pertains to minimizing the real power losses in transmission lines. MATPOWER is employed to calculate the overall power loss following the execution of the power flow program. Table 7 presents a comprehensive overview of the statistical indicators for various algorithms. Notably, the proposed EKOA stands out for its effectiveness and superiority in comparison to KOA and other methods, particularly in terms of power loss results. Table 7 reveals that the EKOA consistently produces the lowest values for power losses, underscoring its efficiency in minimizing transmission-related power losses.
The optimal results for variables and objective function in case 5.
Case 6: Minimization of voltage deviation
Taking into account the importance of voltage in power system analyses, Case 6 is dedicated to minimizing of the voltage deviation of the power system buses. The outcomes of simulations are detailed in Table 8, the results underscore the superiority of the EKOA method compared to the KOA and other counterparts, particularly in achieving the minimum voltage deviation. This affirms the efficacy of the EKOA approach.
The optimal results for variables and objective function in case 6.

Test-system 2: The modified Algerian DZA 114-bus power system
To showcase the efficacy of the suggested EKOA in a real-world practical, large-scale network, the Algerian DZA 114-bus electricity power system has been chosen as the test system the testing ground with some changes in the original configuration. This system encompasses 175 transmission lines with 15 generators, including 16 branches equipped with transformers tap changers. The aggregate power demand stands at (3727 + j 2070) per unit (p.u.) with a 100 MVA base.
The fourth bus serves as the slack-bus in the power system. As part of the modification, 2 wind generators have been added to buses 52 and 83, and a solar PV generator has been installed at bus 109. All the necessary data for the test system, in “MATPOWER format,” is freely available only to referees. This optimization problem involves a total of 46 variables, which include the active power of 15 generators, also the voltage magnitudes of 15 generators, and adjustments for 16 tap-changers. Additionally, the power system experiences voltage drops at certain buses, posing challenges in ensuring the feasibility of solutions, particularly with regard to reactive power generators. The maximum and the minimum operating limits of the control variables can be found in Table 8.
In this case, only three objective functions were considered due to the length of the article, which are the total power production cost minimization and the minimization of the real power losses, and the base case that denotes the total cost generation for the conventional DZA 114 bus system without considering renewable energy sources. These are important cases taken into consideration in both applied aspects and techno-economic studies.
Table 9 presents the maximum and minimum operating limits of control variables, along with the outcomes of various objective functions explored in this case, while Figures 17 and 18 represent the voltage profile and generators reactive power respectively. Notably, the proposed (EKOA) stands out for its remarkable effectiveness and superiority compared to the (KOA).
The objective function of test system 2 for four case.
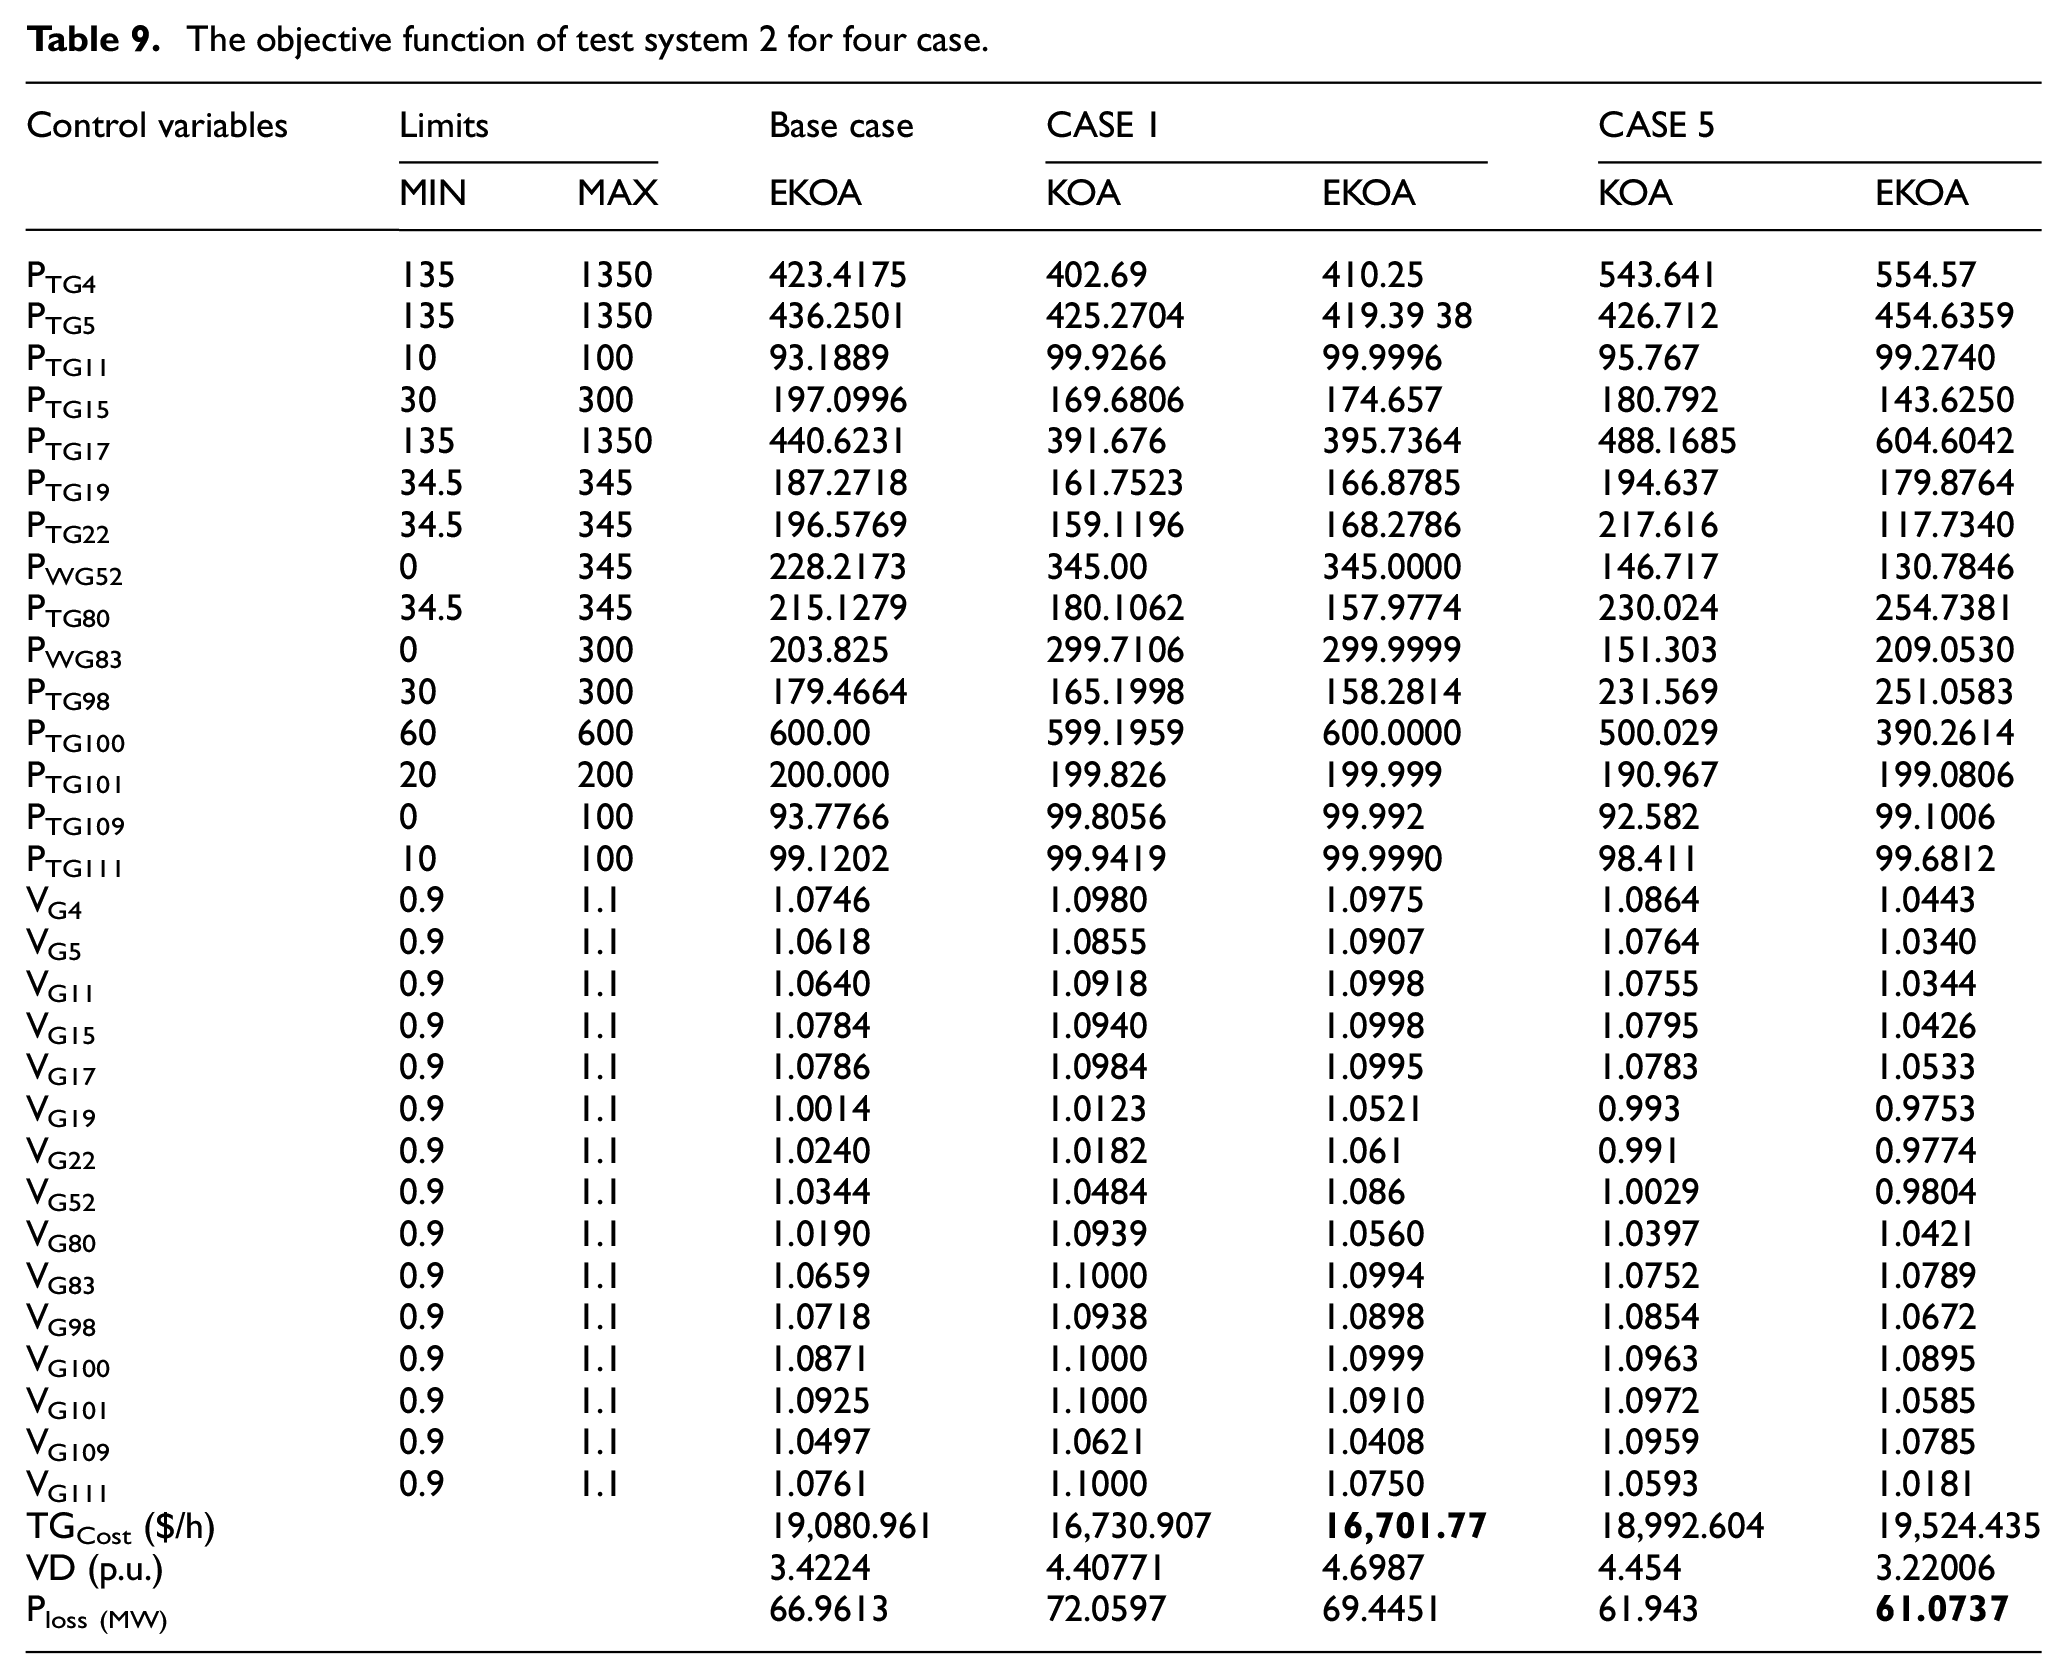
In practical system studies, it becomes crucial to demonstrate the advantages resulting from the integration of the (RES), particularly in techno-economic analyses. In the case of the conventional DZA 114-bus system, there is a substantial contrast in the cost of energy production 19,080.9613 ($/h) before RES integration and $16,701.773 ($/h) after integration, reflecting a difference of $2379.18 ($/h), which makes the profit significant in the long term. This underscores the substantial economic benefits of incorporating wind generators and solar power plants, leading to a notable reduction in the total generation cost compared to the original configuration of system without renewable energy sources.
Examining the convergence curves in Figure 16 reveals that EKOA converges more rapidly in the initial iterations, reaching a superior solution compared to KOA. The results from the studies conducted on the two test systems affirm the efficacy of the EKOA approach in effectively addressing numerous large scale optimization problems within the realm of power system studies.

Convergence curve for case 1 DZA 114-bus system.
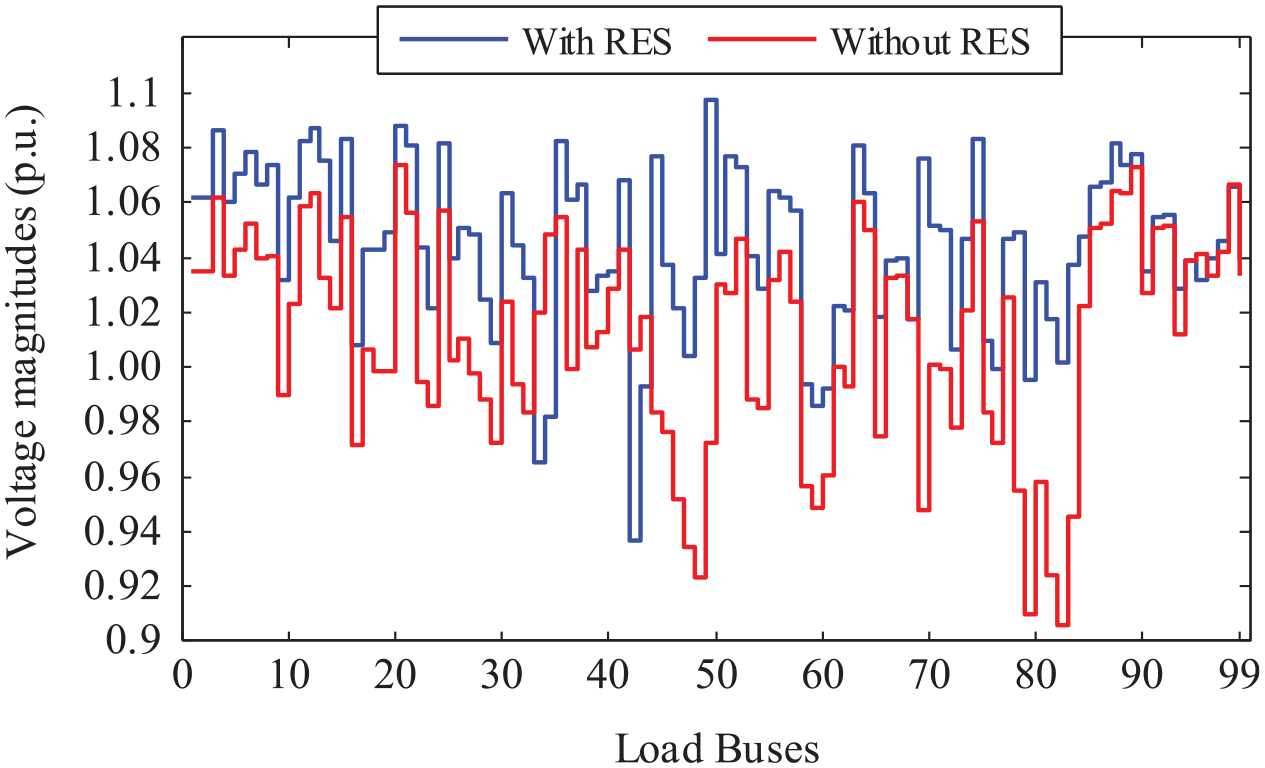
Voltage profile of DZA 114-load buses for case 1.

Generators reactive power for case 1.
Conclusion
The research presented in this paper utilized two novel metaheuristic algorithms: (KOA) and its enhanced counterpart, the (EKOA). These algorithms were applied to address Optimal Power Flow problems taking into account the presence of (RES) renewable energy sources with uncertainties. The investigation involved the IEEE 30 bus power system and the practical DZA 114-bus power system. The EKOA was developed by incorporating an operator
Footnotes
Acknowledgements
I would like to thank Dr.souhil mouassa from electrical engineering departement, university of bouira ,for his contribution in completing this work
Declaration of conflicting interests
The author(s) declared no potential conflicts of interest with respect to the research, authorship, and/or publication of this article.
Funding
The author(s) received no financial support for the research, authorship, and/or publication of this article.