
Abstract
Repowering wind farms entails upgrading or replacing old turbines with more efficient, capable, and profitable ones. This technique has the potential to boost energy production, improve grid integration, and lower operational costs. Repowering also makes use of the most recent breakthroughs in wind energy technology, ensuring that wind farms stay economically viable and contribute to the growth of renewable energy. The majority of the wind farms that are located in India were constructed in early 2000, and their capacity ratings range from 200 kW to 800 kW. The lifespans of these wind farms have finally come to an end. Repowering wind farms is a viable alternative in these regions due to the significant wind capacity that exists there. In order to find the wind potential in the site wind resource assessment is needed. This paper proposes a repowering scheme for the existing wind farm located in Kayathar, Tamil Nadu. The reduction in power loss due to the wake effect in the existing wind farm is analyzed using WAsP software and repowering scheme is proposed to increase the Annual Energy Production (AEP), Capacity Utilisation Factor (CUF). The Wind Atlas Analysis and Application Program (WAsP) is utilized in order to carry out the site’s wind resource evaluation. After the wind resource assessment, individual turbine wake loss is identified, and the viability of repowering the wind farm by raising the hub height of high wake-affected turbines was investigated. Another repowering study is also carried out by installing high-capacity turbines in place of the existing turbines.
Keywords
Introduction
Climate and weather play a significant effect in a nation’s economic development. Rainfall, temperature, pressure, wind, and humidity are a few of the crucial weather and climatic factors that govern life on Earth for both humans and other animals and plants. Building design, energy production, method of transportation, and dietary preferences all heavily depend on a nation’s climate and topography. Energy is essential to the advancement of humankind. Humans have used the sun, water, wood, wind, and other natural resources to cultivate, heat, and power machinery since the beginning of time. In rural areas without access to electricity, individuals utilized small windmills to produce electricity as late as the 1920s. The wind has been used in rural Indian agricultural methods to separate the grain from the chaff and sun heat for drying. Interest in wind power declined after oil was found and exploited as an effective source of energy. The 1970s oil shortages altered the global energy landscape and garnered attention to alternative sources of energy, which opened the door for the reintroduction of the windmill as a source of electricity. India is emerging as a significant participant in this endeavor. Wind energy is today one of the most important methods of energy generation on the planet (Sreevalsan et al., 2010).
India is the third largest consumer of electricity in the world. In which the electricity produced by renewable energy is about 13% as of march 2022. India plans to produce 50% of its electricity from renewables by 2040 (Economic Times, 2022). As of December 2022, India had 63.3 GW of solar installed capacity and 41.92 GW of wind installed capacity (Central Electricity Authority, 2022). Many states, including Tamil Nadu, Madhya Pradesh, Gujarat, and Maharashtra, continue to use older wind turbines with capacities of less than 500 kW. According to studies, over 10% of all wind projects in India have a power rating of less than 500 kW, equating to approximately 3500 MW.
The majority of the wind turbines are located in Class I wind areas with high wind power potential. This indicates India’s significant repowering potential (Idam Infra, 2018).
In the re-powering process, farms with a high number of turbines will be replaced with a smaller number of turbines which are having higher capacity ratings and are more efficient. Furthermore, it relates to the removal and replacement of older, first-generation turbines that were built over a decade ago. This has often been done by constructing fewer turbines with higher capacities. Commercial wind turbines that are linked to the grid nowadays are multi-megawatt pieces of machinery with sophisticated operation and control systems. According to research done at Denmark’s Risoe Laboratory, the procedure of re-powering will improve the wind farm’s capacity and triple energy production while utilizing half the equipment. Another Leonardo Energy report discusses the re-powering endeavor for the issues listed below.
Due to capacity development, AEP rose from the same location and area of land without the need for new land.
The beauty of the sight is enhanced by the fact that there are less wind turbines than before. Following re-powering, the hub height is also increased.
A lower cost per unit of energy produced typically results from a greater array and individual turbine efficiency.
Modern wind turbines have a better esthetic look since they revolve at lower speeds.
Improved grid integration may emerge from improved power electronics and power quality from large modern turbines.
Since wind variables such as speed, direction, and turbulence is known, it is possible to anticipate the annual energy production of an existing location more accurately (Ahmed, 2016).
Several studies have been undertaken to investigate the influence of repowering on energy production and wind farm economics. Shaha et al. (2022) studied repowering feasibility in India. Studies by Lacal-Arántegui et al. (2020) and Martínez et al. (2018), have emphasized the technical and environmental benefits of repowering wind farms, such as greater efficiency, longevity, and reduced environmental effect. Another study, Paul and Prabu (2016), discovered that repowering an outdated wind farm in Coimbatore with 18 two-bladed turbines increased annual energy production (AEP) by 4.5 times and doubled CUF.
Other researchers Castro-Santos et al. (2016); Prabu and Kottayil (2015); Routray et al. (2021); Serri et al. (2018); Villena-Ruiz et al. (2018) investigated the effects of wind farm repowering on efficiency and the economy (Yacob et al., 2018), taking into consideration parameters such as interest rate, confidence level, and payback duration. The findings revealed that wind farm repowering resulted in a considerable rise in AEP and CUF, as well as a good return on investment. Some studies like Boopathi et al. (2020); Rajaram et al. (2021) have asses the repowering feasibility in Kayathar and integrating solar panels in the area. The hybrid plant was also discussed by Prashanth et al. (2018); Siddaraju et al. (2022)
Wake effect modeling (Shakoor et al., 2016) and tower height matching (Chen et al., 2013) have also been studied to enhance the performance of wind farms after repowering. The impact of the hub height variation on the wind farm parameter was also studied by various researchers (Syed et al., 2020; Vasel-Be-Hagh and Archer, 2017). The different ways of arranging the turbines in the wind farm with turbines placed in different locations and mix-matching the hub height of the turbines in the alternating rows were also studied by various researchers (Bhardwaj et al., 2021; Vyshnav et al., 2022; Yang et al., 2019). Overall, the literature indicates that repowering wind farms can result in considerable gains in energy production (Saha et al., 2021) and wind farm economy, and should be explored for wind turbines nearing the end of their useful life.
The study is done on a wind farm in Kayathar, Tamil Nadu having 32 turbines. The rest of the thesis is organized as follows. Section talks about the steps taken in the analysis, the site selection, and the definition of parameters used. The section talks about the resource assessment done in the wind farm and the performance indices of the existing wind farm. The reduction of turbines with high wake loss is discussed in section. Repowering of the wind farm with higher capacity machines is discussed in section. The section discuss the result obtained from the comparison of a repowered wind farm with the existing wind farm. Finally, Section summarizes the conclusions.
Methodology
According to the literature review, wind resource assessment is required to determine the wind potential at the location. WAsP software is the tool used for the analysis. WAsP can be used to calculate the wind farm’s energy output. After the wind resource assessment is done the turbines with higher wake loss are identified. The technique of identifying turbines with higher wake loss involves reviewing data from a wind resource assessment to determine which turbines have the highest wake loss. This can be accomplished by conducting simulations in WAsP and comparing the results to wind resource assessment wake loss data. After identifying the turbines with the highest wake loss, the next step is to modify the hub height of the identified turbines to further examine the wake loss. This is done by performing simulations with increasing hub heights and comparing the results to the existing wind farm’s wake loss data.
In addition, a study is being carried out by replacing the site’s 30 turbines with larger capacity machines. This is accomplished by conducting simulations in WAsP with different turbines and comparing the results to the existing wind farm’s parameters. Replacing the turbines with larger capacity machines can result in an increase in annual energy output, a decrease in wake loss, and an improvement in the capacity utilization factor. A comparison of the various cases based on annual energy produced, wake loss and capacity utilization factor can aid in determining the best course of action for replacing the turbines. The parameters used for the comparison are discussed below
Annual energy production
The annual energy production of a wind power plant (WPP) is critical in establishing the project’s economic viability. It is the overall quantity of electrical energy produced by a wind turbine over the course of a year, and accurate estimates of this value are required in order to make educated decisions about project design and operation. The wind resource at the installation site and the features of the wind turbine both affect the annual energy production (AEP). The Weibull distribution, a statistical model that identifies the frequency of various wind speeds at a specific area, can be used to describe wind resources. On the other hand, the power output of the wind turbine depends on wind speed and may be calculated using the power curve of the WPP.
AEP is computed by multiplying the power from the power curve for each wind speed by the frequency distribution of wind speeds received by the wind turbine and the number of hours in a year. As a result, the annual energy production may be expressed as follows:

where, 8760 = Number of hours in a year,
It is crucial to keep in mind that the accuracy of the annual energy output prediction is closely correlated with the precision of the wind resource characterization and the wind turbine power curve. Additionally, other elements like the wind turbine’s accessibility and the energy losses connected to the WPP’s electrical components must also be considered when calculating AEP. In conclusion, a wind power plant’s annual energy output is a crucial factor in the development, management, and economic assessment of wind energy projects. Making wise judgments and ensuring the project’s long-term success depend on accurate estimates of this value.
Capacity utilization factor
Many factors influence the output of power by a wind turbine generator at a certain location. These elements include the site’s mean wind speed and, more importantly, the wind turbine’s speed characteristics, which include cut-in, rated, and cut-out wind speeds, as well as the hub height. Wind turbine generators come in a variety of models, all of which have the same kW rating. Each of these wind turbines has its own set of specifications and operating conditions. The speed parameters influence the capacity factor at a certain site, which in turn influences the selection of the best Wind Electric Generator (WEG) for the location. The capacity utilization factor (CUF) is the most useful parameter for determining the WEG’s power generation efficiency. The CUF of a turbine is the actual yearly energy output divided by the theoretical maximum output, assuming the unit runs at its rated speed for the whole 8760 hours in a year. As a result, it is another way of expressing the turbine’s annual energy output.

Wake effect
Wind energy conversion comprises two processes: first, extracting kinetic energy from the wind and converting it to mechanical energy at the rotor axis, and second, converting it to usable energy. The wind farm’s wake effect can have a major impact on wind farm energy production and efficiency. It happens when wind turbines absorb wind energy, causing the wind speed to decrease and the airflow behind the rotor to become more turbulent. This altered wind flow has an impact on downstream wind turbine performance by lowering mean wind velocity and increasing turbulence (Shakoor et al., 2016).
Wind turbine wake is classified into two types, near wake and far wake, based on power losses and load. The near wake is the area immediately downstream of the wind turbine, often up to two or three rotor diameters, when the wind flow is directly influenced by the geometry of the turbine. The wind flow in this region is characterized by low mean velocity and high turbulence. The far wake is the region beyond the near wake, and it is often regarded as the area where the overall influence of the wind farm is the emphasis. Turbulence is a dominant factor in the far wake, and the wind flow is characterized by low mean velocity and high turbulence levels (Shakoor et al., 2016).
Far wake models are used to better understand the behavior of the far wake and its impact on wind farm energy production and loads. Far wake models are classified into two types: kinematic models and field and wake-added turbulence models. Kinematic models, such as the Larsen wake model, Frandsen’s wake model, and Jensen’s wake model, are based on the self-similar velocity profile. These models describe the evolution of the far wake and its impact on wind flow and energy generation using basic mathematical calculations. Field and wake-added turbulence models, on the other hand, account for both kinematic wake behavior and turbulence effects. These models offer a more complete description of the distant wake and its effect on wind flow and energy generation for wind farms (Shakoor et al., 2016).
The Park2 wake model, a kinematic model based on the Jensen single-wake model, is used by the WAsP program. (Figure 1) According to the Park2 model, the wake of a wind turbine spread linearly as the wind blows downstream from the turbine (Vasel-Be-Hagh and Archer, 2017). The wind speed at wind turbine j, which is located xji downstream of wind turbine i and has a rotor radius of r, can be expressed using the following equation:

Where u∞ is the free stream wind speed at the hub height level, and

Linear wake model (Chen et al., 2013).
The wake-influenced radius, or the area impacted by the wake produced by a wind turbine, is described by equation (4) at a specific location in the crosswind direction. The value of R denotes the radial separation from the rotor at which the wind turbine’s operation affects the wind speed in the wake region.

and R increases linearly with xji (Chen et al., 2013).
The wind farm wake effect must be considered both during the planning and design phases of a wind farm, as well as throughout its operation. This can aid in optimizing the wind farm’s energy production and overall efficiency. To alleviate the effects of the wake and improve wind farm performance, strategies such as repowering and wind farm layout optimization can be used.
Site selection
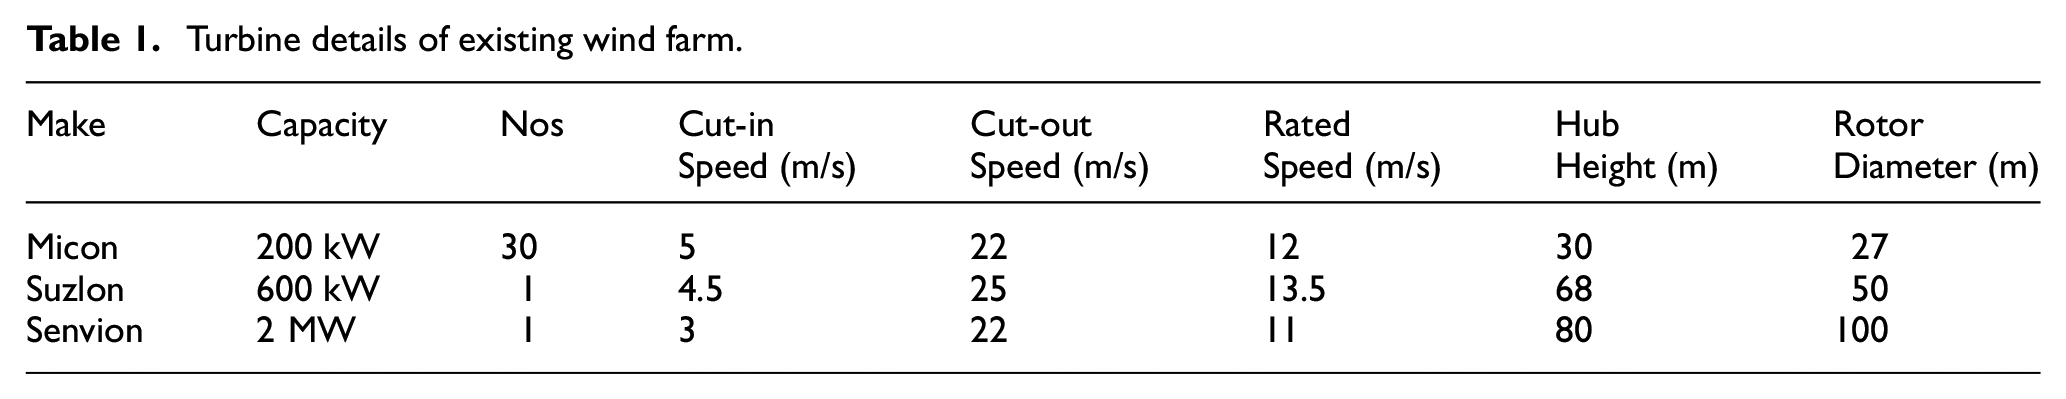
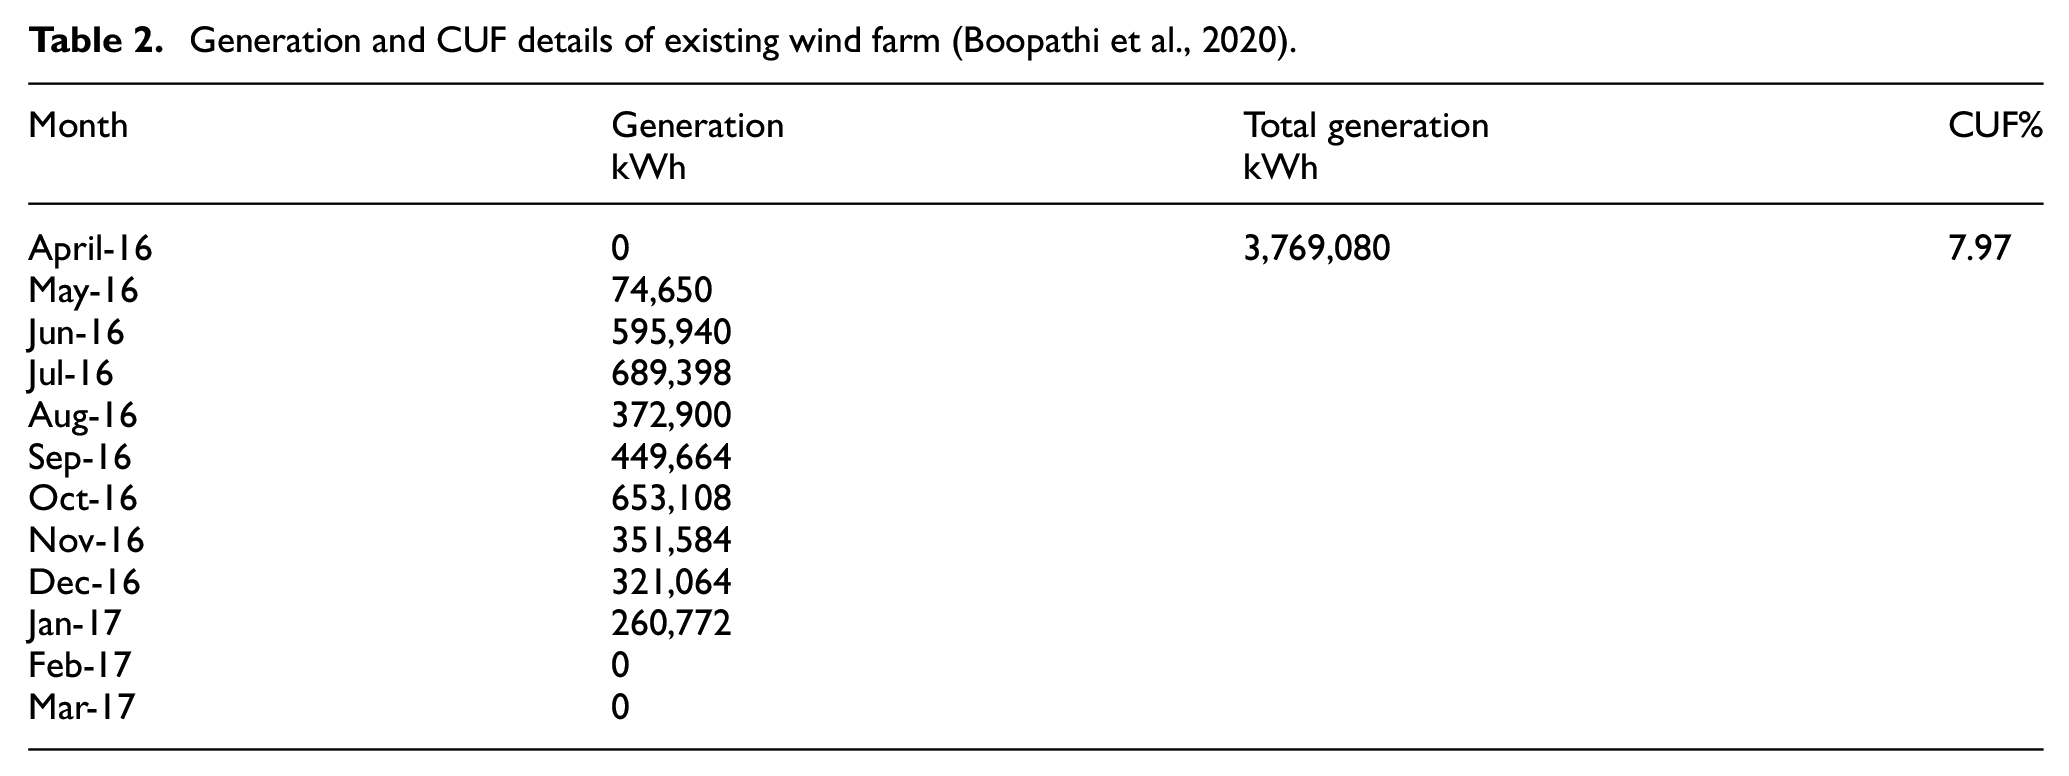
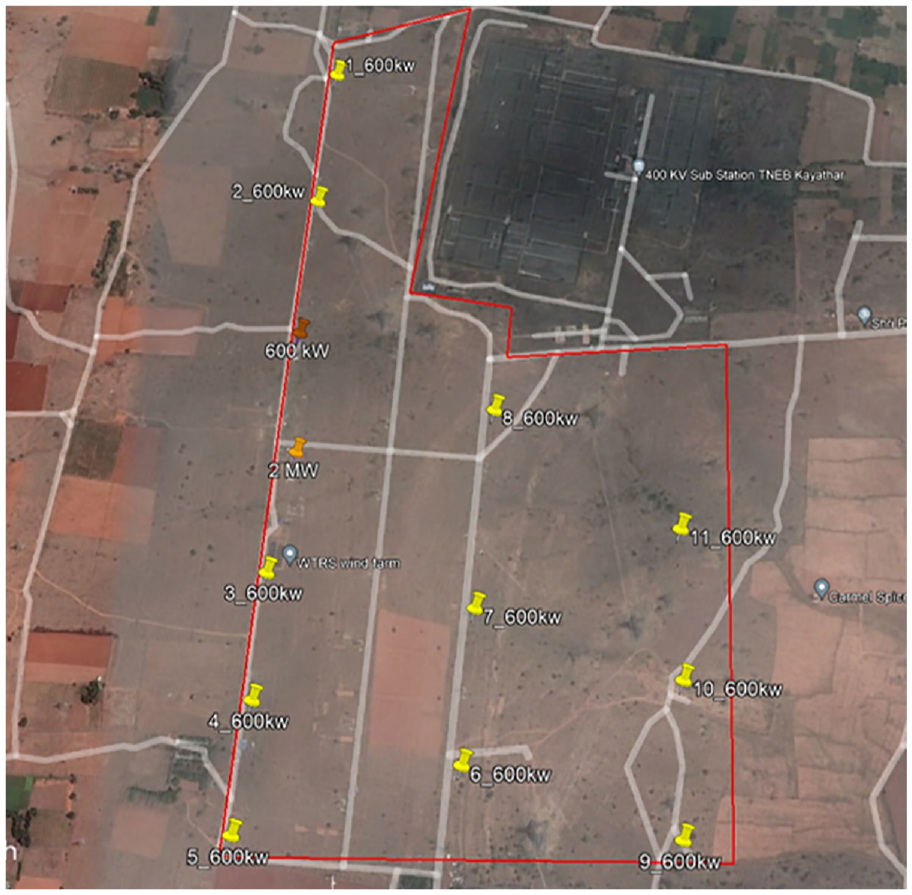
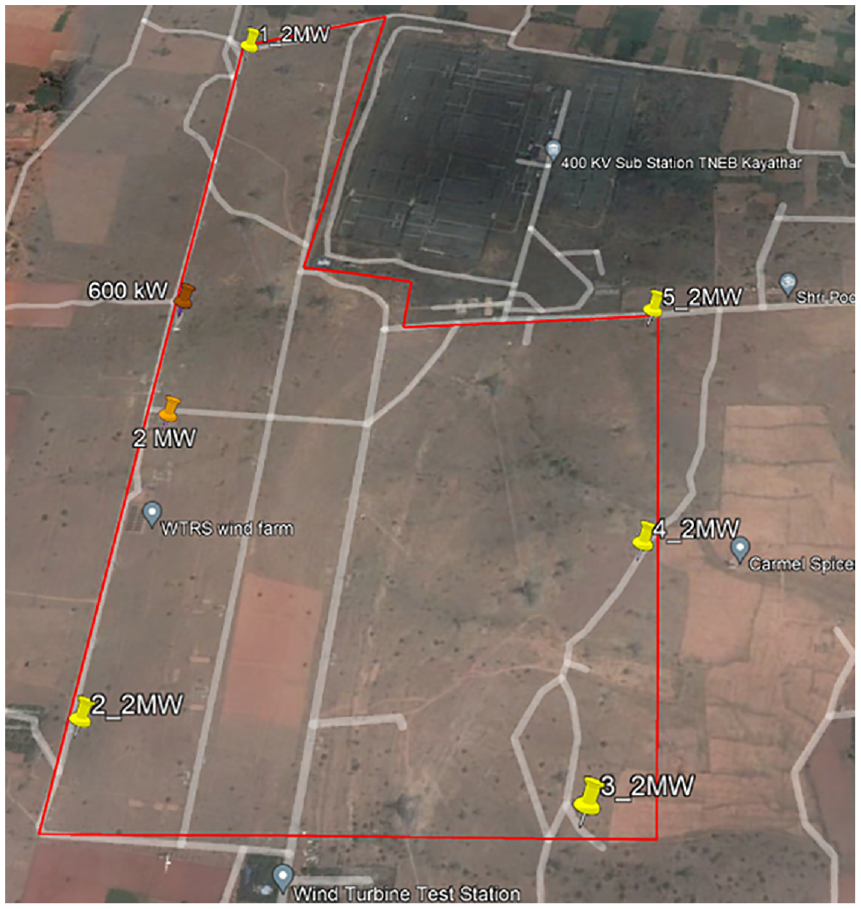
The Kayathar wind farm is located in the location 8°57′13.38″N, 77°43′12.47″E. The wind farm was commissioned in the late 1990s. The wind farm is conveniently located in the Tenkasi pass, at an elevation of 93 m above sea level and a 100-acre footprint. The natural terrain of the location, which is characterized by small trees and bushes, provides a consistent setting for the wind farm’s operation. Figure 2 shows the existing turbine’s location. The turbines are placed in a way that the turbines are facing the predominant wind direction most of the time, which is west. Wind data from NIWE was collected to support the study from April 2010 to May 2011. The data was used to acquire a thorough understanding of the wind patterns and potential energy generation in the area. Table 1 shows details such as turbine type, capacity, and power output for the existing turbines in the wind farm. The generation and capacity utilization of the existing wind farm for the period of 2016–2017 is shown in Table 2.
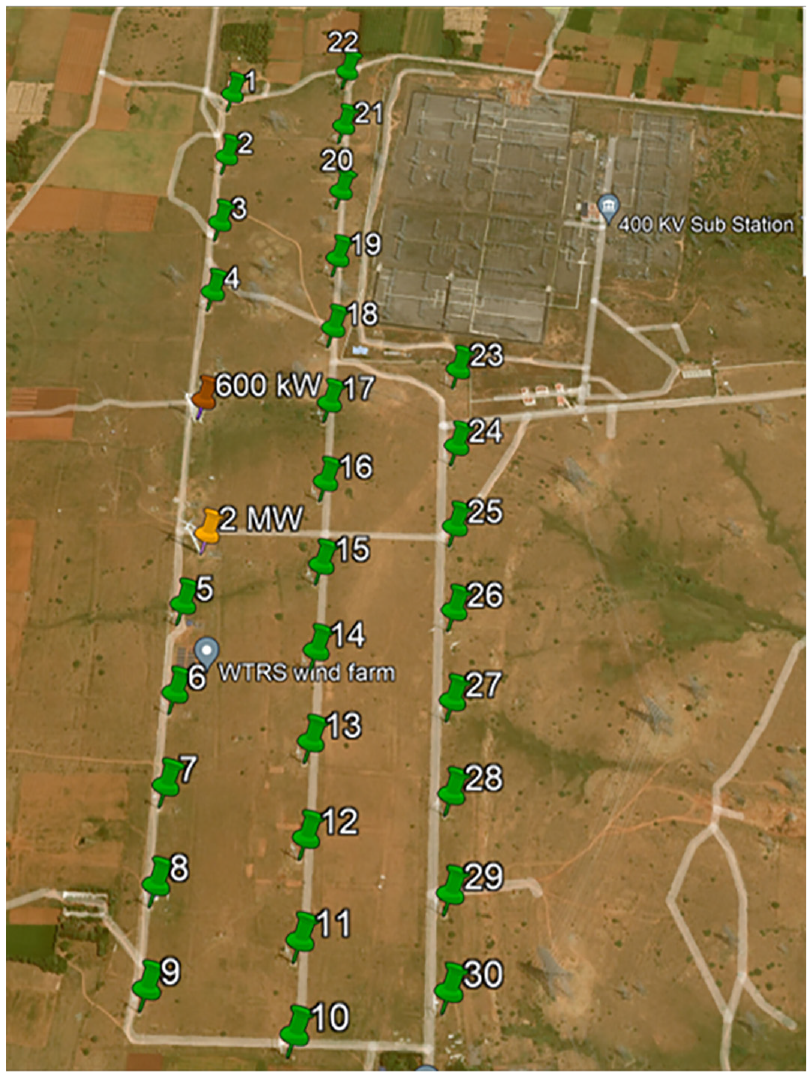
Location of turbines in the existing Kayathar Wind farm.
Turbine details of existing wind farm.
Generation and CUF details of existing wind farm (Boopathi et al., 2020).
Wind resource assessment using WAsP
Wind resource assessment is essential in the construction of wind energy projects because it gives critical information about wind conditions and potential at a specific location. The need for wind resource assessment is influenced by the following factors:
To assess potential of wind energy: Accurately assessing a site’s wind conditions and energy potential is crucial for determining the viability of a wind energy project.
Wind resource evaluation assists in optimizing the design and placement of wind turbines for maximum energy production.
To comply with regulations: Wind resource assessments are required in many countries as part of the permission process for wind energy projects.
Accurate wind resource assessment data can help acquire finance for wind energy projects by demonstrating a site’s wind energy potential.
In essence, wind resource assessment provides critical information for establishing profitability, optimizing design, securing funding, and assuring regulatory compliance for wind energy projects.
WAsP (Wind Atlas Analysis and Application Program) is a software application that is used in the wind energy industry to analyze and optimize wind energy production. It’s an essential instrument for estimating wind climate, wind resources, and wind farm energy output. The tool performs thorough wake loss analysis to ensure that wind energy is produced efficiently. This is accomplished by taking into account numerous parameters such as topography, wind direction, and atmospheric stability in order to accurately estimate wind flow around wind turbines and wind farms. The findings of the research can be used to improve the design and layout of wind farms, leading to greater energy production and efficiency.
A contour map depicting the natural elevation of the location is required to carry out the analysis using WAsP software. This map has been modified with the WAsP map editor, converted to UTM projections, and digitized. The map is then added to the WAsP software’s workspace through a Terrain analysis vector map. The contour map of the kayathar site is shown in Figure 3. The wind climate data is added after the vector map. The met station location is provided, and the observed wind climate data is included. The turbine locations and statistics are then added to the wind farm. The WAsP program performs all feasible computations after all turbines are added.
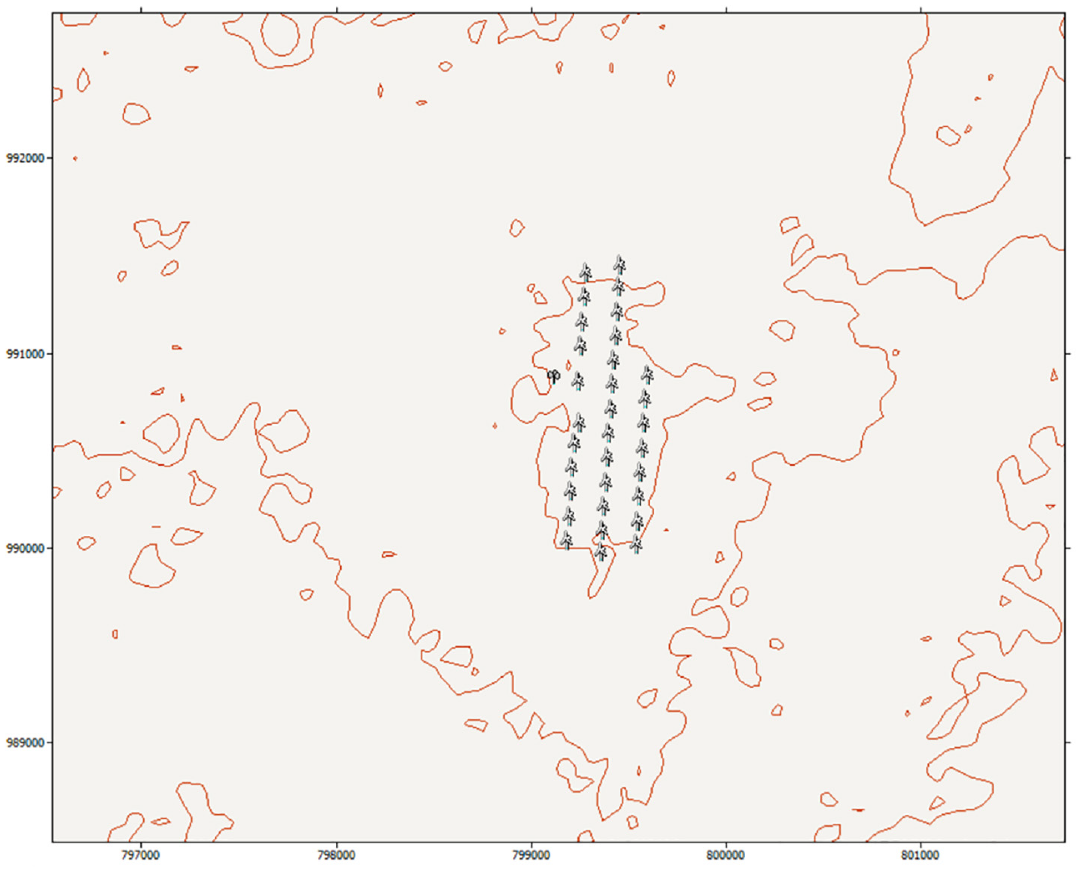
Contour map of the considered site.
WAsP analyzes each individual turbine in detail, including its mean wind speed, AEP, wake loss, and CUF. Table 3 shows the whole gross and net AEP, total wake loss, and CUF% of the entire wind farm. This is taken as the performance indices of the existing wind farm and used to compare with the repowered wind farms. Gross AEP is the entire amount of energy that a wind turbine can produce before accounting for the effects of wake, whereas net AEP is the amount of energy actually created by the wind turbine after accounting for the wake and other losses. Wake loss is the reduction in wind speed and energy that happens behind the turbines and impacts the operation of downstream turbines.
Performance indices of the existing wind farm.

The average wind speed in the investigated wind farm was 6.2 m/s, with the predominant wind direction being west. Figure 4 shows the site’s Wind Ross and Weibull distribution at 70m hub height. The wind power density in the site for 50 m and 70m height are 284 W/m2 and 352 W/m2 respectively. The wind farm included 32 wind turbines, including 30 Micon 200 kW turbines, one Suzlon 600 kW turbine, and one Senvion 2 MW turbine. The WAsP shows each turbine’s mean wind speed, AEP, wake loss, and CUF. The AEP of individual turbines is shown in Figures 5 and 6. The CUF of the plant was 25.5%, with a wake loss percentage of 2.45%. The wake loss of individual turbines can be obtained from the tool. This is shown in Figure 7. From the figure, it can be seen that 5 turbines had wake losses of more than 7%, and one had a wake loss of more than 10%. By altering the height of the turbines with significant wake loss, the feasibility of repowering the wind farm to reduce wake loss is being examined. This repowering could result in an increase in the wind farm’s energy production.

Wind rose and Weibull distribution at 70m hub height in Kayathar: (a) wind rose and (b) Weibull distribution.
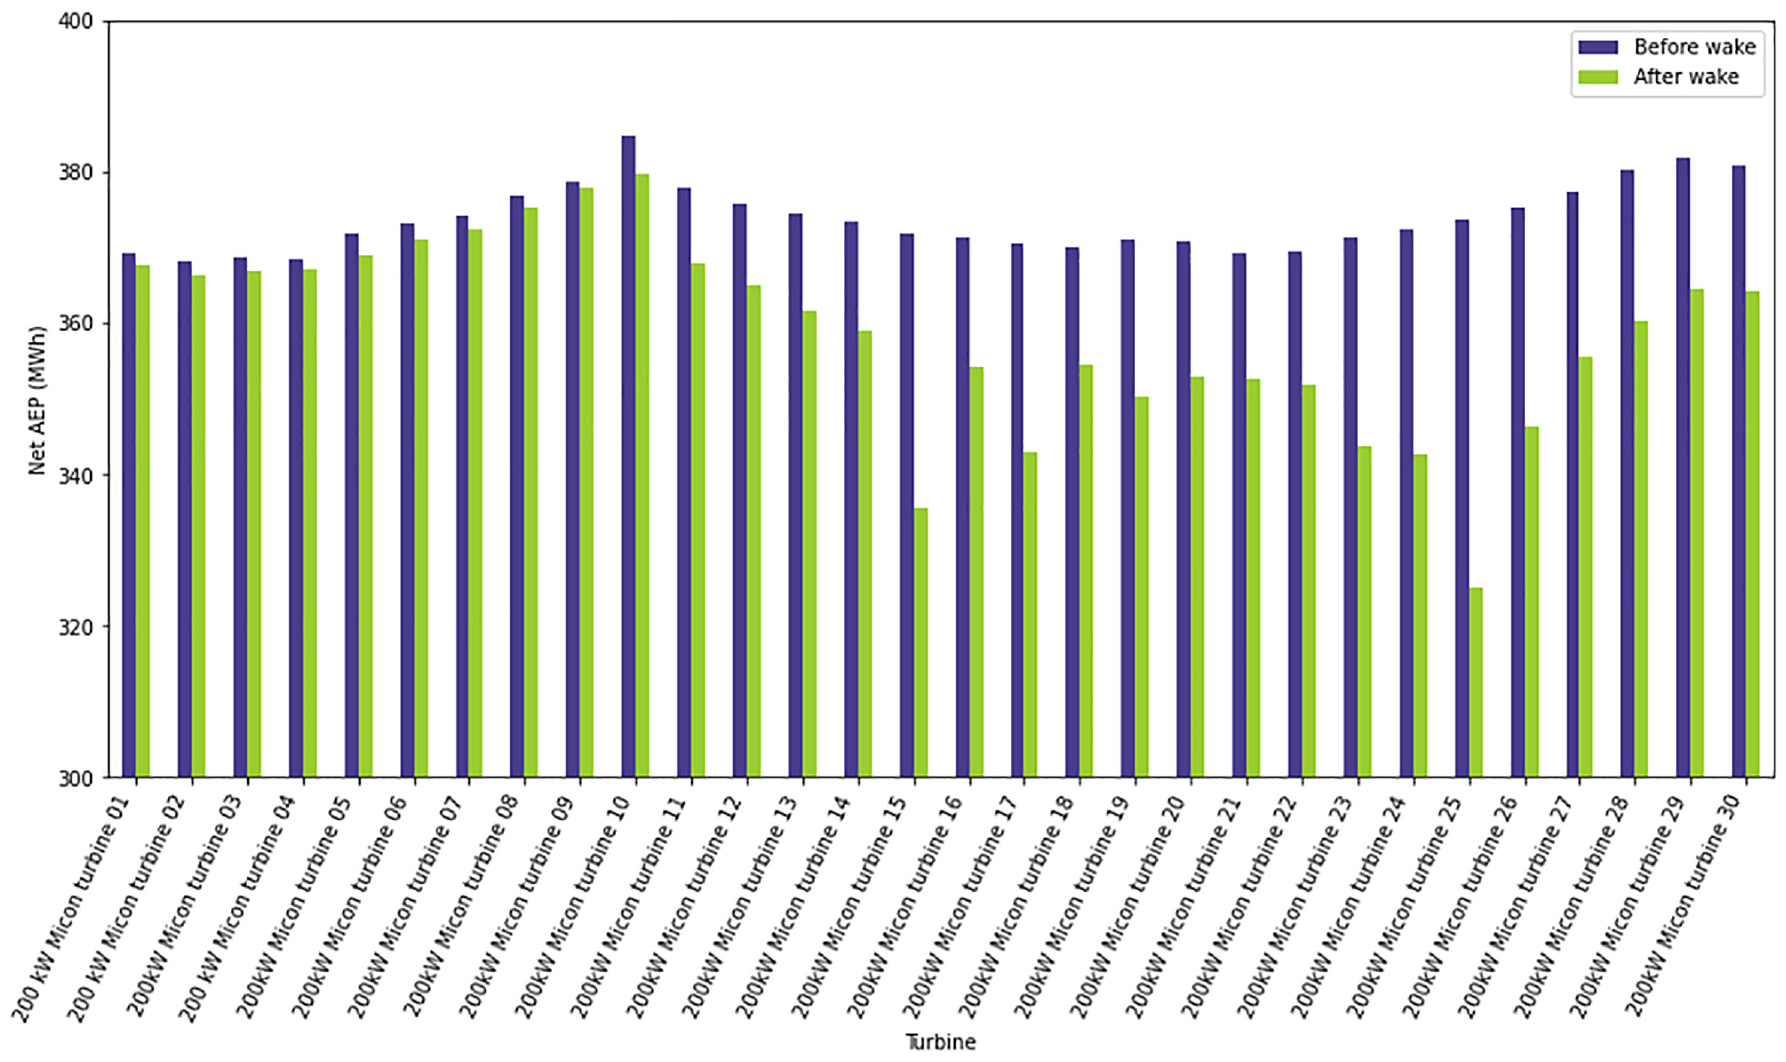
Annual energy production of 200 kW Micon turbines in the existing wind farm.
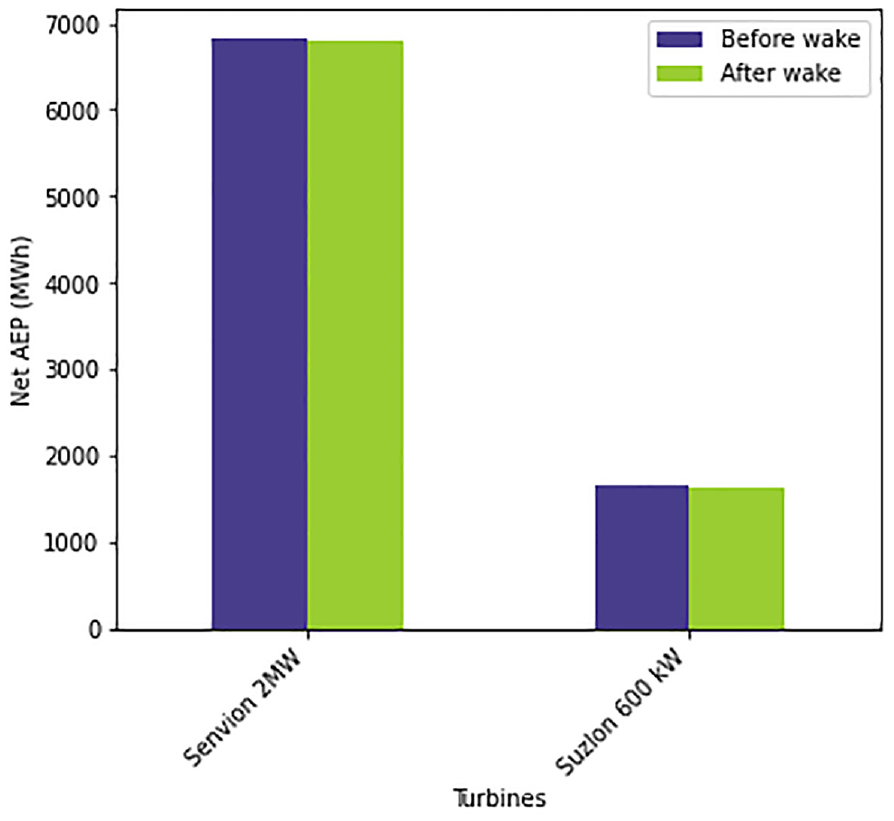
Annual energy production of 600 kW Suzlon and Senvion 2 MW turbines in the existing wind farm.
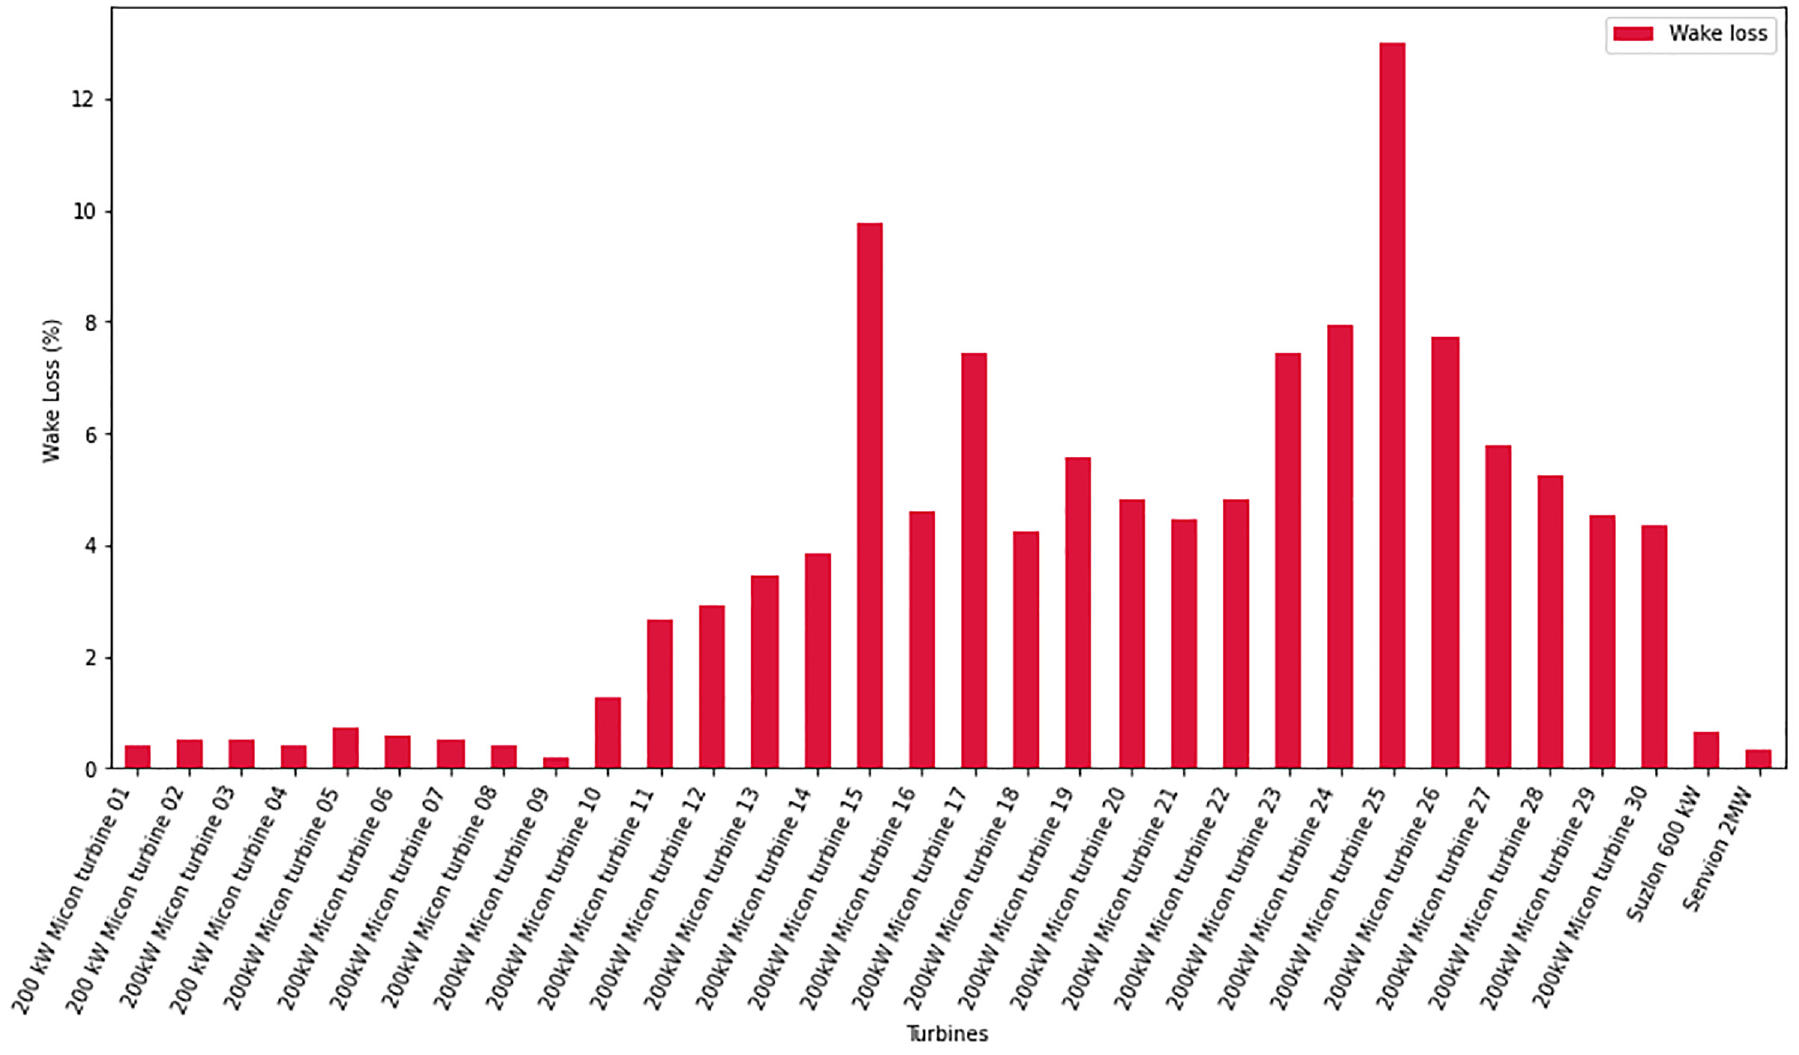
Wake loss of all turbines in the existing wind farm.
Reduction of wake loss by increasing the hub height of turbines
Wake loss is a reduction in wind speed and energy that happens behind a wind turbine and has an impact on downstream turbine performance. The wind energy industry is continuously looking for ways to improve wind farm efficiency and reduce the impact of wake losses on turbine energy generation. The higher wake loss caused by the interaction with the wake cone from the upstream turbine can cause the downstream turbine to age prematurely. This is because the downstream turbine’s efficiency is decreased by the slower wind speed in the wake cone, which increases the turbine’s rotational speed and causes mechanical stress. Furthermore, higher turbulence and vortex shedding in the wake cone can result in increased structural loads and strain on the turbine’s blades and other components, resulting in a shorter operational lifespan and an earlier need for maintenance and replacement. Furthermore, the reduced energy production caused by wake loss reduces the wind farm’s economic return, making it more difficult to justify investments in maintenance and replacement of aging turbines.
One possibility is to adjust the hub height of individual turbines. This strategy is especially important for turbines that suffer from significant wake losses When changing the hub height of the turbines it can cause either a reduction in wake loss or increase in wake loss.
Decrease in wake loss: Increasing the downwind turbine’s hub height reduces interaction with the upstream turbine’s wake cone. The upstream turbine’s wake cone limits wind speed and thus energy generation in the downstream turbine. Increasing the downstream turbine’s hub height makes it less influenced by the wake cone, resulting in less wake loss. As a result, less interaction from the upstream turbine’s wake cone leads to less wake loss in the downstream turbine.
Increase in wake loss: When the downstream turbine’s hub height is increased, it comes closer to the wake cone, increasing its interaction with the wake cone and thereby increasing wake loss. The wake loss is defined as the reduction in downstream turbine power production caused by the presence of the upstream turbine’s wake cone. This contact with the wake cone reduces the wind speed available to the downstream turbine, resulting in lower energy output and increased wake loss.
A study is conducted to investigate the possibility of partially repowering the plant by raising the hub height of the high wake-affected turbines.
Wake effect caused by 2 MW turbine
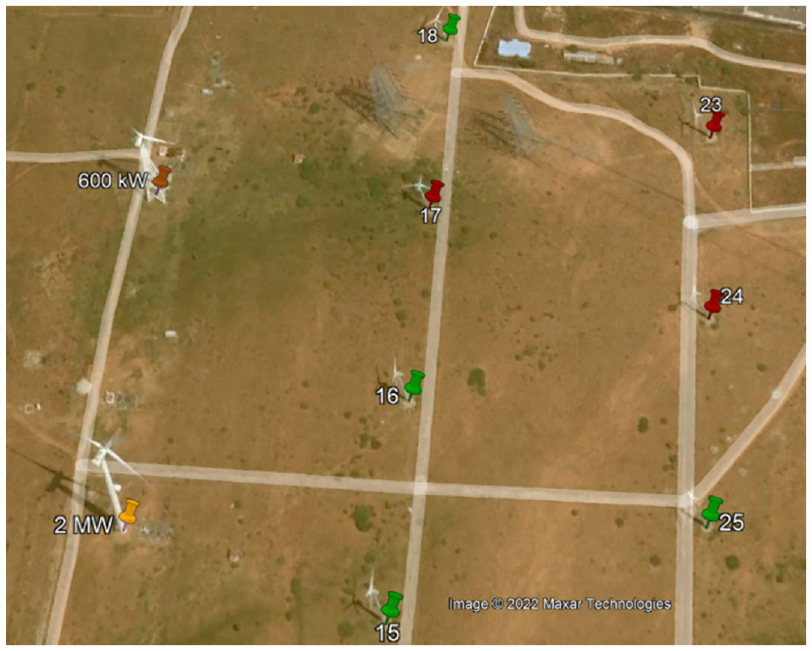
The turbine is located at 8°57′5.58″N, 77°43′16.70″E, when facing the west direction the turbine has Senvion 600 kW turbine to right and a 200 kW turbine to the right in the wind farm. The tower height of the 2 MW turbine is 80 m, while the rotor diameter is 100 meters. in order to find the wake region caused by this turbine the wake radius needs to be calculated. Equation (4) calculates the wake radius created by the 2 MW turbine. From the wake radius, the turbines that are affected directly by the wake of the turbine can be found. Figure 8 depicts the turbines affected by the wake of the 2 MW turbine. The wake cone has the greatest influence on turbines 15, 25, and 26.
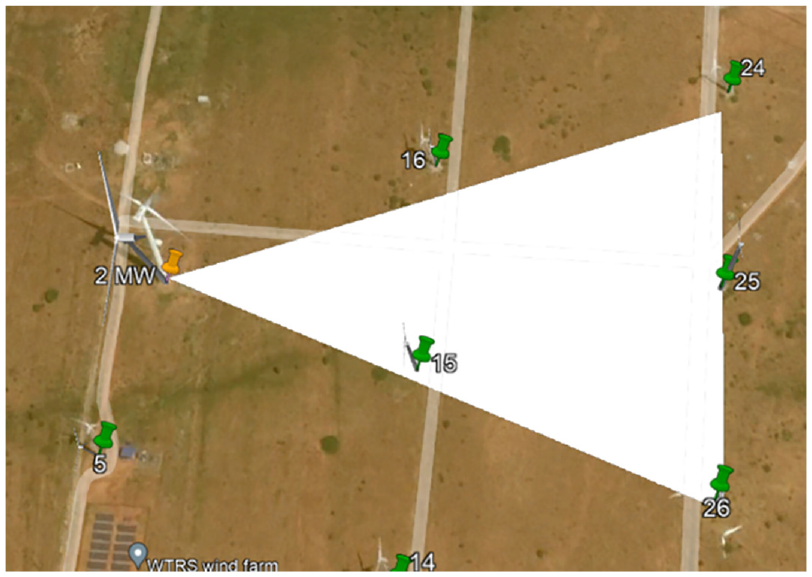
Wake effect caused by 2 MW turbine.
Turbines 15, 25, and 26 have a wake of 9.77%, 13.01%, and 7.72% respectively. The Hub height of these turbines is increased to 60m to study the wake loss.
Effect of changing the hub height of Turbine 25: Turbine 25 is a 200 kW turbine with a hub height of 30m. The turbine is located back of two other turbines, 2 MW and turbine 15, with distances of 325 and 180 m, respectively. This turbine has a wake loss of 13.01%. Using equation (4), the wake radius of the 2 MW turbine and turbine 15 at the site of turbine 25 is calculated to be 79 m and 43 m, respectively. With a tower height of 30 m, turbine 25 is susceptible to a combined wake from the two turbines ahead. The wake from turbine 15 becomes partial as the hub height of turbine 25 is increased to 60 m, but the wake from the 2 MW turbine remains complete. This reduces the wake loss of the turbine. The improved wake loss and the CUF of turbine 25 are shown in Figure 9(a). An improvement in the AEP of the wind farm can be seen as a result of this reduction in wake loss, as shown in Figure 9(b).
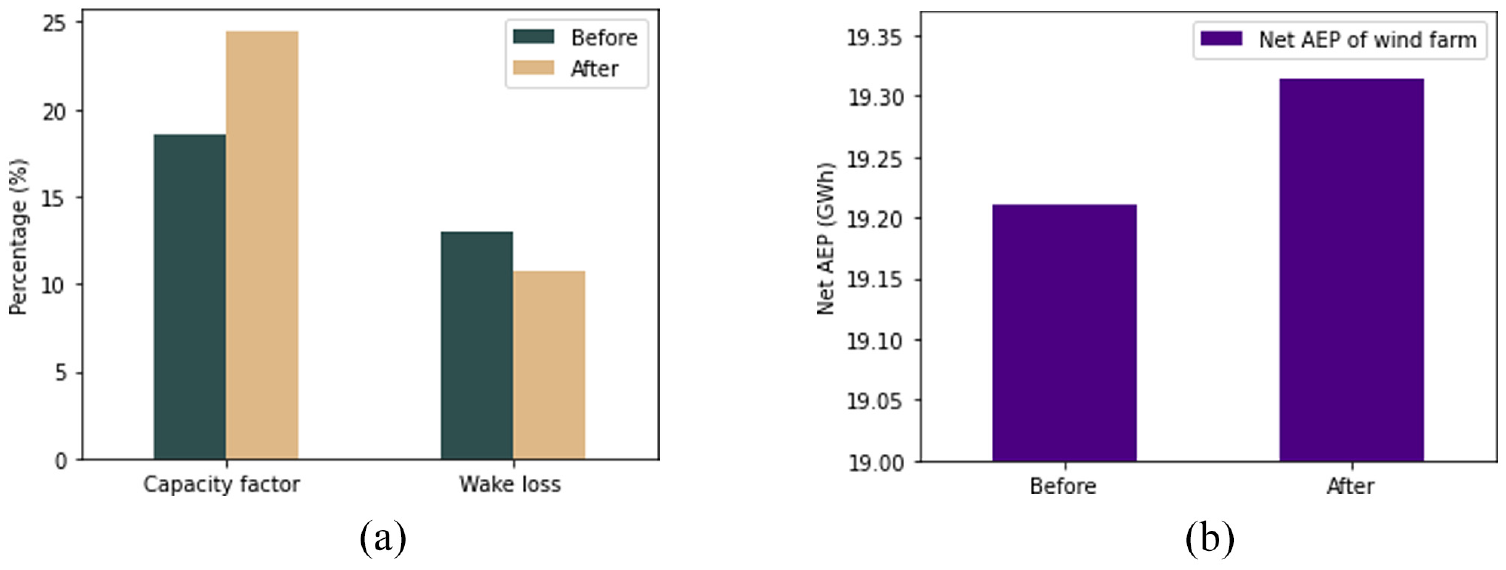
Analysis of increasing hub height of turbine 25 from 30 m to 60m: (a) change in the wake loss and CUF of turbine 25 before and after the hub height of the turbine increased from 30 m to 60 m and (b) the change in the AEP of the wind farm before and after the hub height of the turbine 25 increased from 30 m to 60 m.
The results indicate that raising the hub height of the turbine 25 from 30 to 60 m improved the wind farm’s performance. The wake loss of the turbine has been reduced to 10.72% from 13.01%, the turbine’s capacity utilization factor (CUF) has been raised to 24.5% from 18.5%, and the plant’s net AEP has grown from 19.211 GWh to 19.315 GWh. The overall wind farm’s wake loss remained the same in this case. Increasing a turbine’s hub height reduces turbulence and improves wind flow, resulting in increased energy production and overall wind farm efficiency.
Impact of changing Turbine 26's hub height: Turbine 26 is a 200 kW turbine with a 30 m hub height. The turbine has the 2 MW turbine and turbine 15 in the front when facing the west direction. The distance between the 2 MW turbine and Turbine 26 is 325 m, while 175 m separate Turbine 15 and Turbine 26. The short separation causes the wake of the turbine to increase. The wake loss for turbine 26 is 7.72%. The wake radius of the 2 MW turbine and turbine 15 at the turbine 26 site is 79 m and 43 m, respectively, according to equation (4). When the turbine is at hub height 30m, it experiences partial wake from both the front turbines, turbine 15, and the 2 MW turbine. When the hub height is altered to 60 m, the turbine experiences only partial wake from the 2 MW turbine but almost no wake from the turbine 15. This lowers the wake and raises the wind farm’s AEP. Figure 10(a) and (b). shows the result of changing the hub height of the turbine 26–60 m.
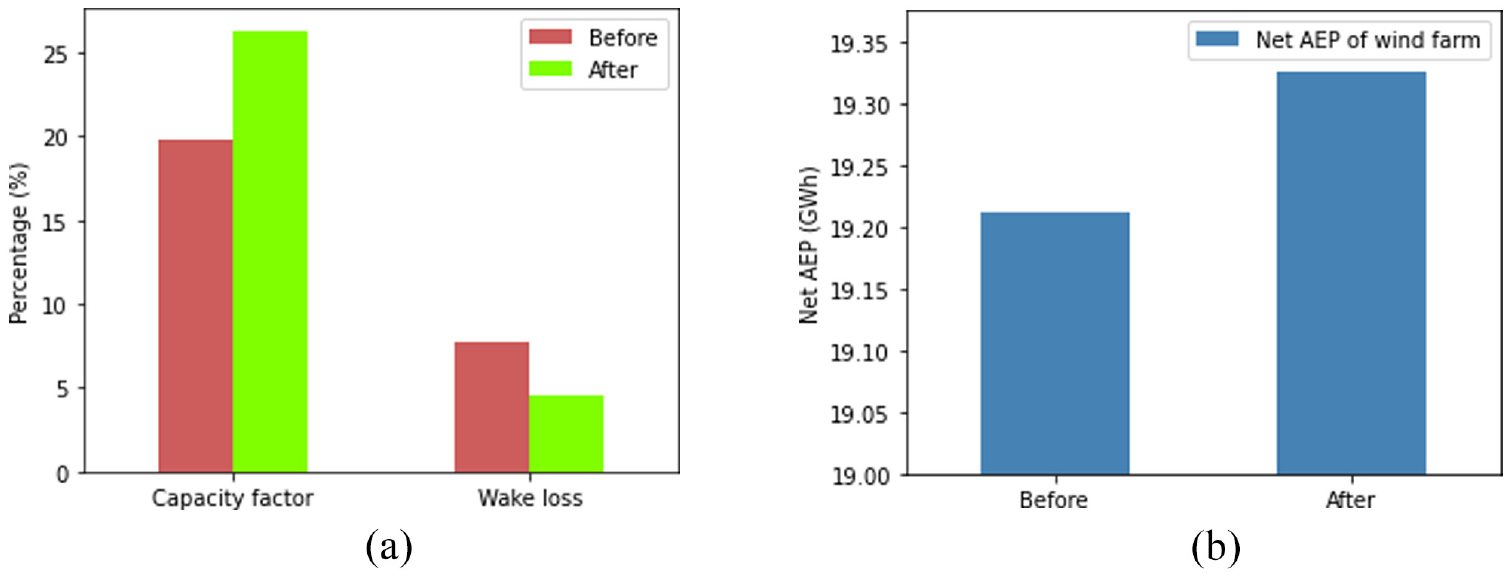
Analysis of increasing hub height of turbine 26–60m: (a) the variation of wake loss and CUF of the turbine 26 when the height of turbine is increased from 30 m to 60 m and (b) variation of net AEP of wind farm when turbine 26′s height is increased from 30 m to 60 m.
According to the results, altering the hub height of turbine 26 from 30 to 60 m improved the wind farm’s performance. The result shows that the wake loss was reduced to 4.56% from 7.72%, the CUF of the turbine increased to 26.3% from 19.8% and plant net AEP increased from 19.211 GWh to 19.325 GWh. The overall wind farm’s wake loss is reduced by 0.05% from 2.45% to 2.4% the same in this case. Increasing the hub height of a turbine decreases turbulence and improves wind flow, which leads to greater energy production and overall wind farm efficiency.
Effect of altering the hub height of Turbine 15: Turbine 15 has a tower height of 30 m and a power output of 200 kW. This turbine sits in between two turbines when facing the predominant wind direction, the 2 MW turbine in front and turbine 25 in the back. Turbine 15 has a wake loss of 9.77%. Because the distance between the 2 MW turbine and turbine 15 is 163 m, the wake radius of the 2 MW turbine at that distance is 64 m. As a result, at hub height 30 m, the turbine receives a minor wake impact from the 2 MW turbine. Turbine 25 in the back gets a combined wake from both the 2 MW turbine and turbine 15. Then the height is increased to 60 m, the turbine experiences full wake, increasing the wake loss. However, turbine 25, which lies behind the turbine and has a hub height of 30 m, now gets just partial wake from turbine 15, as opposed to full wake when the hub height of turbine 15 is 30 m. This minimizes turbine 25′s wake loss. Figure 11(a) depicts the wake loss of turbines 15 and 25 before and after the hub height modification. Figure 11(b) and (c) illustrate the total wake loss of the wind farm and net AEP before and after the adjustment in hub height, respectively.
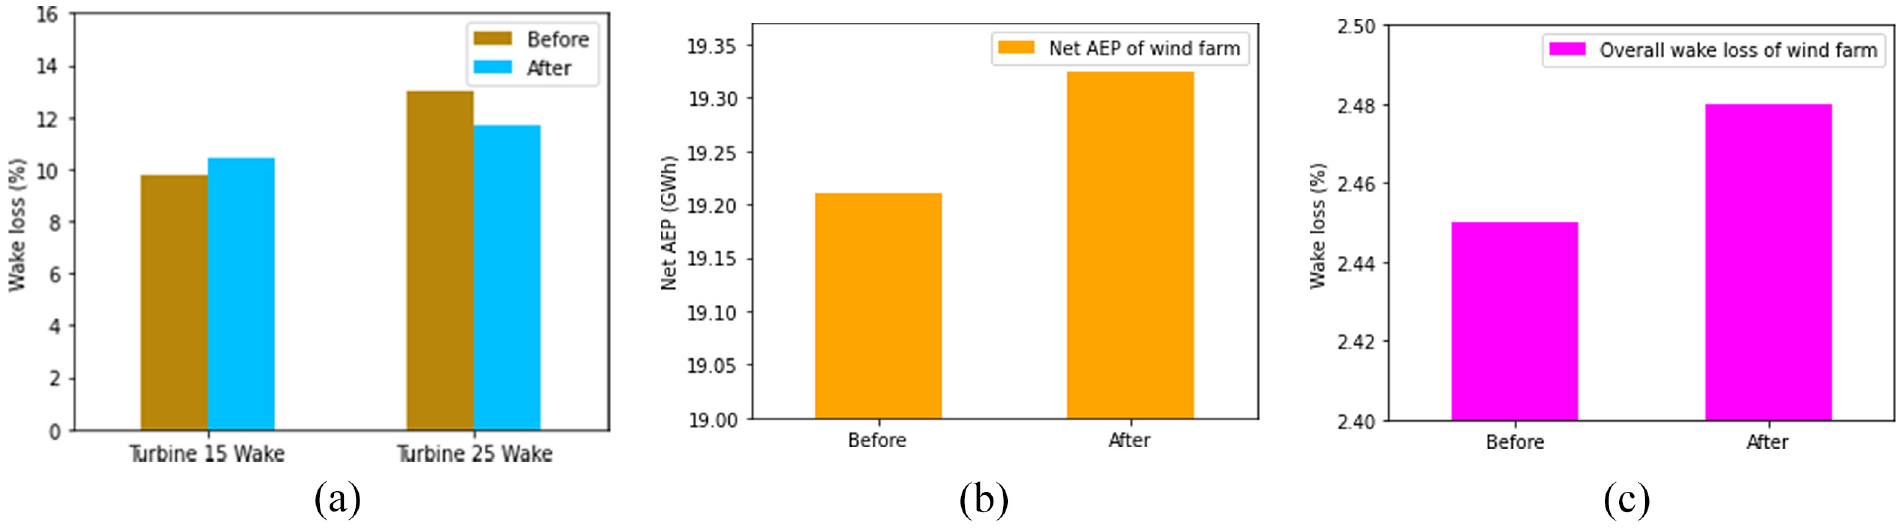
Analysis of increasing hub height of turbine 15–60 m from 30 m: (a) variation in the wake loss of turbines 15 and 25 when hub height of turbine 15 is increased to 60 m from 30 m, (b) difference in the overall wake loss of the wind farm when the height of turbine 15 is increased to 60 m from 30 m, and (c) difference in the wind farm’s net AEP when turbine 15′s height is increased from 30 to 60 m.
The study’s findings indicate that partial re-powering of the wind farm by raising the hub height of the turbine 15 from 30 m to 60 m has a substantial impact on the wake of the surrounding turbines. While turbine 15′s wake loss increased to 10.44% from 9.77%, turbine 25′s wake loss dropped to 11.69% from 13.01%, resulting in a slight rise in the wind farm’s total wake loss, from 2.45% to 2.48%. However, the net AEP (Annual Energy Production) increased to 19.31 GWh from 19.211 GWh, suggesting that the partial repowering enhanced total energy output. These findings show that when repowering wind farms, the trade-off between wake loss and energy output should be carefully examined. According to the findings, increasing the hub height of some turbines may increase the wake loss of others, but the overall impact on energy output can still be favorable.
Reducing the wake loss of other high wake affected turbines
Turbines 23, 24, and 17 are located behind the 600 kW turbine on the farm. The machines have a capacity of 200 kW each and a height of 30 m. They have a wake loss of 7.45% 7.95%, and 7.43% respectively. To evaluate the change in wake loss, the tower height of these turbines is extended to 60m. Figure 12 shows the other turbine with high wake loss.
Other turbines with high wake loss in the existing wind farm.
Effect of changing the hub height of turbines 23 and 24: These two turbines are located behind turbine 17 and the 600 kW turbine and have a hub height of 30 m. These turbines are 353 m away from the 600-kW turbine and 174 m away from turbine 17. The wake loss of the turbines is greater than 7%. Although the wake cone of the 600 kW has only a slight effect on the turbine’s wake loss. The wake loss of the two turbines is influenced by the total wake effect of both turbines in front. The wake loss decreases as the height of the turbines increases to 60 m from 30 m. Figure 13(a) to (c) depict the effect of changing the hub height of turbines 23 and 24 on the plant’s wake loss, CUF, and AEP.
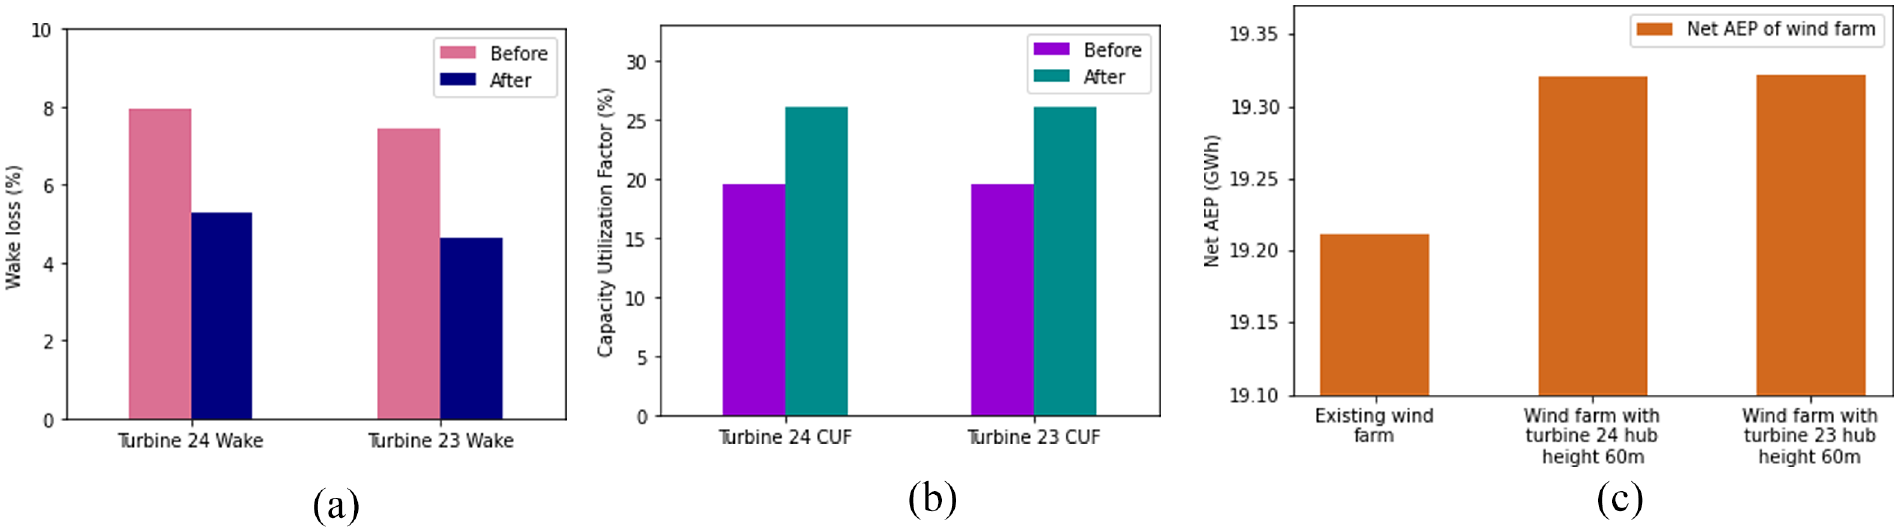
Analysis of increasing hub height of turbines 23 and 24–60m from 30 m: (a) change in the wake loss of turbine 23 and 24 before and after the hub height of the turbine increased from 30 m to 60 m, (b) change in the CUF of turbine 23 and 24 before and after the hub height of the turbine increased from 30 m to 60 m, and (c) comparison of the net AEP of the wind farm when the hub height of the turbines 23 and 24 is increased to 60 m from 30 m.
The results indicate that raising the tower height of turbines 23, and 24 from 30 to 60 m improved the wind farm’s performance. The result shows that when the hub height of turbine 23 is increased the wake of the turbine reduces to 4.63% from 7.45%. The CUF increased to 26.1% from 19.6% and the plant AEP increases to 19.332 GWh from 19.211 GWh. When the hub height of turbine 24 is increased the wake of the turbine reduces to 5.3% from 7.95%. The CUF increased to 26% from 19.5% and the plant AEP increases to 19.321 GWh.
Changing the hub height of turbine 17: Turbine 17 has a 30 m hub height and a power output of 200 kW. When facing the primary wind direction, this turbine is sandwiched between two other turbines: the 600 kW turbine in front and turbine 23 in the rear. The distance between them is 174 m. The wake radius of the 600-kW turbine at the position is 56 m. This is now partially affecting the wake loss of turbine 17. The turbine has a wake loss of 7.43%. The turbine experiences full wake when the height is increased to 60 m, increasing the wake loss. However, turbine 23, which is located behind the turbine and has a hub height of 30 m, now receives less wake from turbine 17, as opposed to wake when turbine 17′s hub height is 30 m. This reduces the wake loss of turbine 23. Figure 14(a) shows the wake loss of turbine 17 and turbine 23 before and after the hub height change. Figure 14(b) and (c) shows the total wake loss of the wind farm and net AEP respectively before and after the change in hub height.
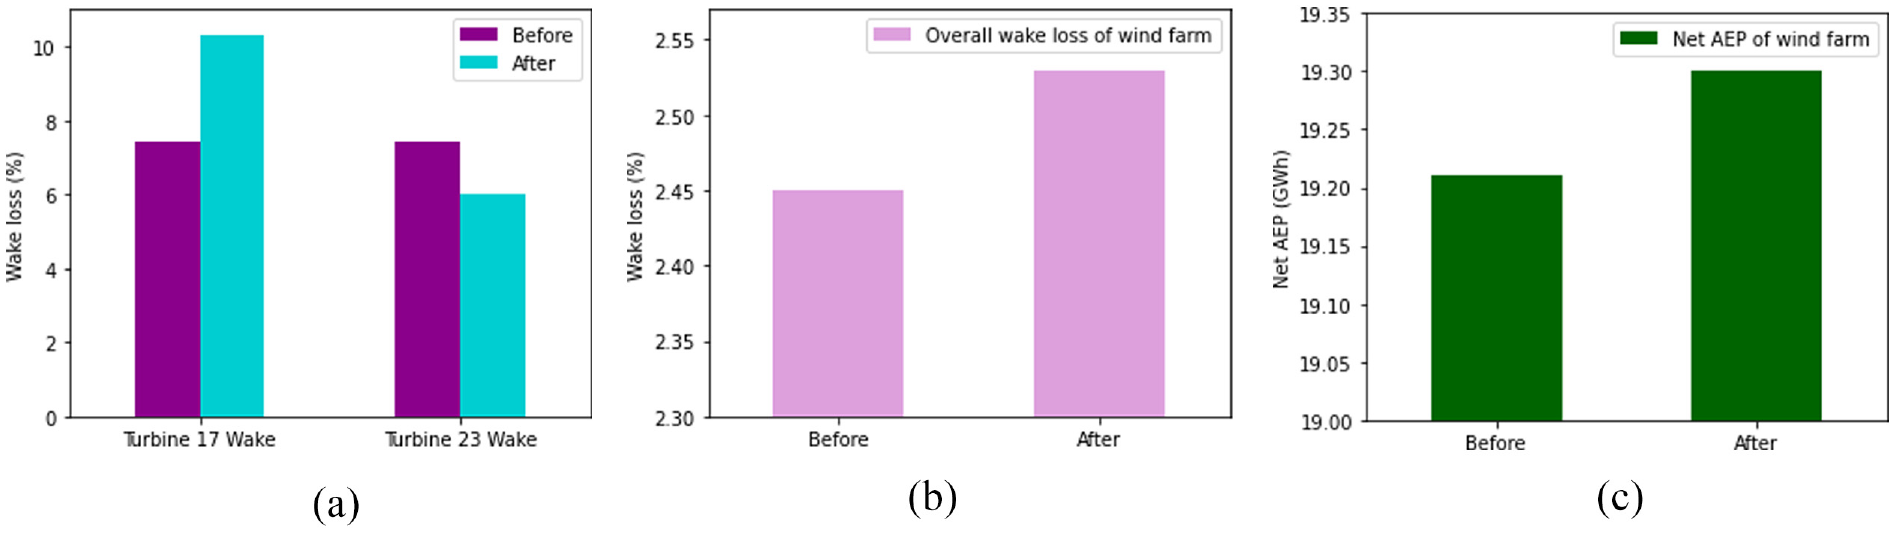
Analysis of increasing hub height of turbine 17–60m from 30 m: (a) variation in the wake loss of turbines 17 and 23 when hub height of turbine 17 is increased to 60 m from 30 m, (b) difference in the overall wake loss of the wind farm when the height of turbine 17 is increased to 60 m from 30 m, and (c) difference in the wind farm’s net AEP when turbine 15′s height is increased from 30 to 60 m.
The findings of a recent study on the impact of raising the hub height of turbine 17 provide new insights into the relationship between wake loss and energy production in wind farms. The study investigated the influence of one of the turbines (turbine 17) on the wake of the surrounding turbines and the wind farm’s overall energy production. According to the results, increasing the hub height of turbine 17 increased its wake loss from 7.43% to 10.3%, while decreasing the wake loss of turbine 23 from 7.45% to 6.23%. Due to the increase in turbine 17′s wake loss, the wind farm’s total wake loss increased from 2.45% to 2.53%. However, the analysis discovered that the wind farm’s net AEP increased to 19.3 GWh from 19.211 GWh, demonstrating that partial repowering had a favorable influence on overall energy output. These findings provide light on the intricate relationship between wake loss and energy output in wind farms, emphasizing the need of taking both aspects into account while repowering wind farms.
Changing the hub height of turbine 23, 24, 25, and 26
While changing the individual turbine’s hub height (Turbines 15, 17, 23, 24, 25, 26) the net annual energy production of the wind farm increased by an average value of 100 MWh. Changing the height of turbines 15 and 17 increases the production and also the overall wake loss percentage increases. Hence changing the hub heights of turbines 23, 24, 25, and 26 is more effective. The hub height of all these turbines is changed to 60 m from the previous value of 30 m and the combined effect is studied. Figure 15(a) shows the wake loss of individual turbines. The wind farm total wake loss and net AEP are shown in the Figure 15(b) and (c) respectively.
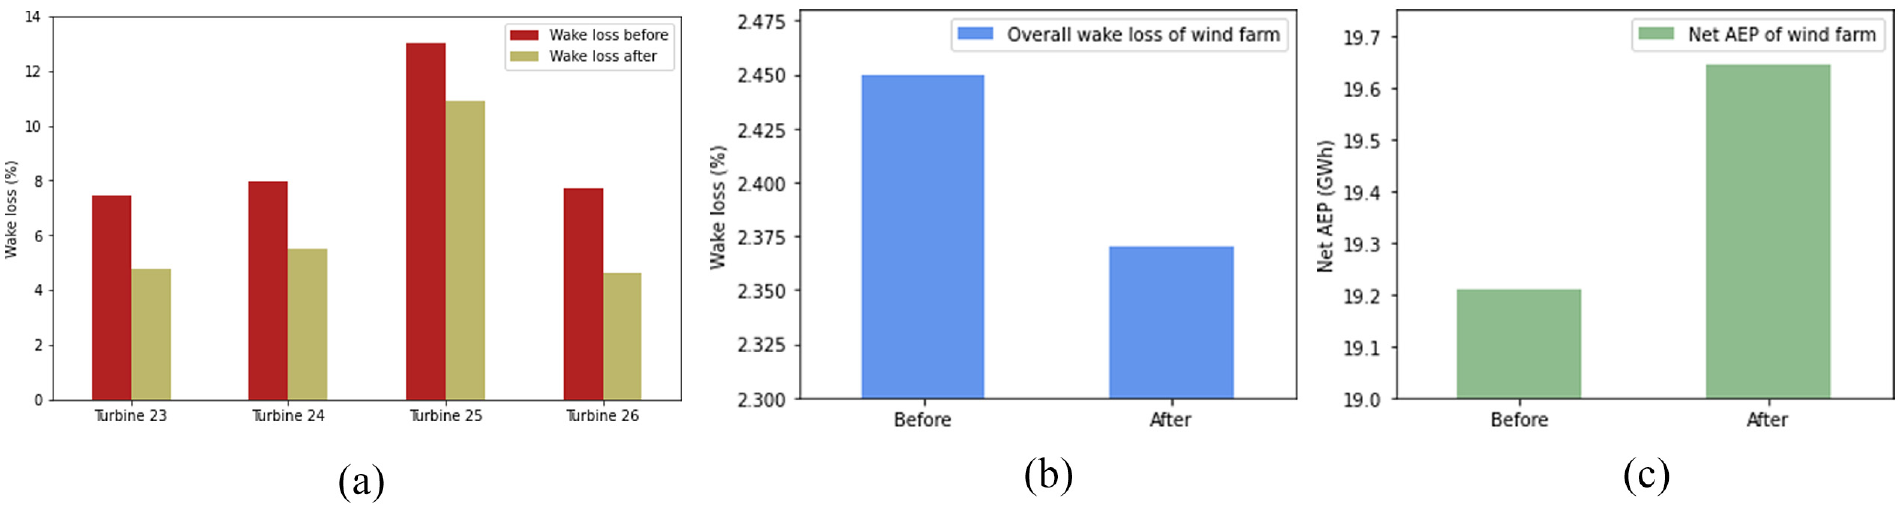
Analysis of increasing hub height of turbines 23, 24, 25, 26–60m: (a) comparison of the wake loss of the turbines when the hub height of the turbines 23, 24, 25, and 26 are increased to 60 m from 30 m, (b) variation in the total wake loss of the wind farm when the hub height of the turbines 23, 24, 25, and 26 are increased to 60 m from 30 m, and (c) variation in the AEP of the wind farm when the hub height of the turbines 23, 24, 25, and 26 are increased to 60 m from 30 m.
The result of the study of changing the height of turbines 23, 24, 25, and 26 shows that there is a considerable decrease in the wake loss of the individual turbines. The wake loss of turbine 23, 24, 25, 26 decreased to 4.8%, 5.51%, 10.92%, and 4.61% respectively from 7.43%, 7.95%, 13.01%, 7.72%. Total wake loss of the farm decreased from 2.45% to 2.37%. The net AEP increased to 19.646 GWh from 19.211 GWh.
The performance of other turbines in the same wind farm can also be impacted by changing the hub height of individual turbines in a wind farm. This highlights both the interdependence of the wind farm’s turbines and the necessity of using caution when making adjustments to a single turbine. While increasing a turbine’s hub height can reduce its wake loss, it can also cause an increase in wake loss for other turbines in the same farm. This can have a substantial impact on the wind farm’s overall energy production. Furthermore, increasing a turbine’s hub height might have economic and operational implications, such as the expense of upgrading the turbine construction and potential downtime during the modification process. As a result, changing the hub height of turbines should be done cautiously, taking into account potential trade-offs and inter-turbine interactions.
Analysis of repowering the existing wind farm
Re-powering in the context of wind energy is the process of replacing older, lower-capacity wind turbines with newer, higher-capacity turbines, typically with fewer turbines overall. A study of replacing the existing 30 turbines in the site with higher capacity machines ranging from 600 kW to 3 MW is done. The wind farm already has one turbine of capacity 600 kW and 2 MW each. These are not taken for the re-powering as these turbines are there for testing purposes.
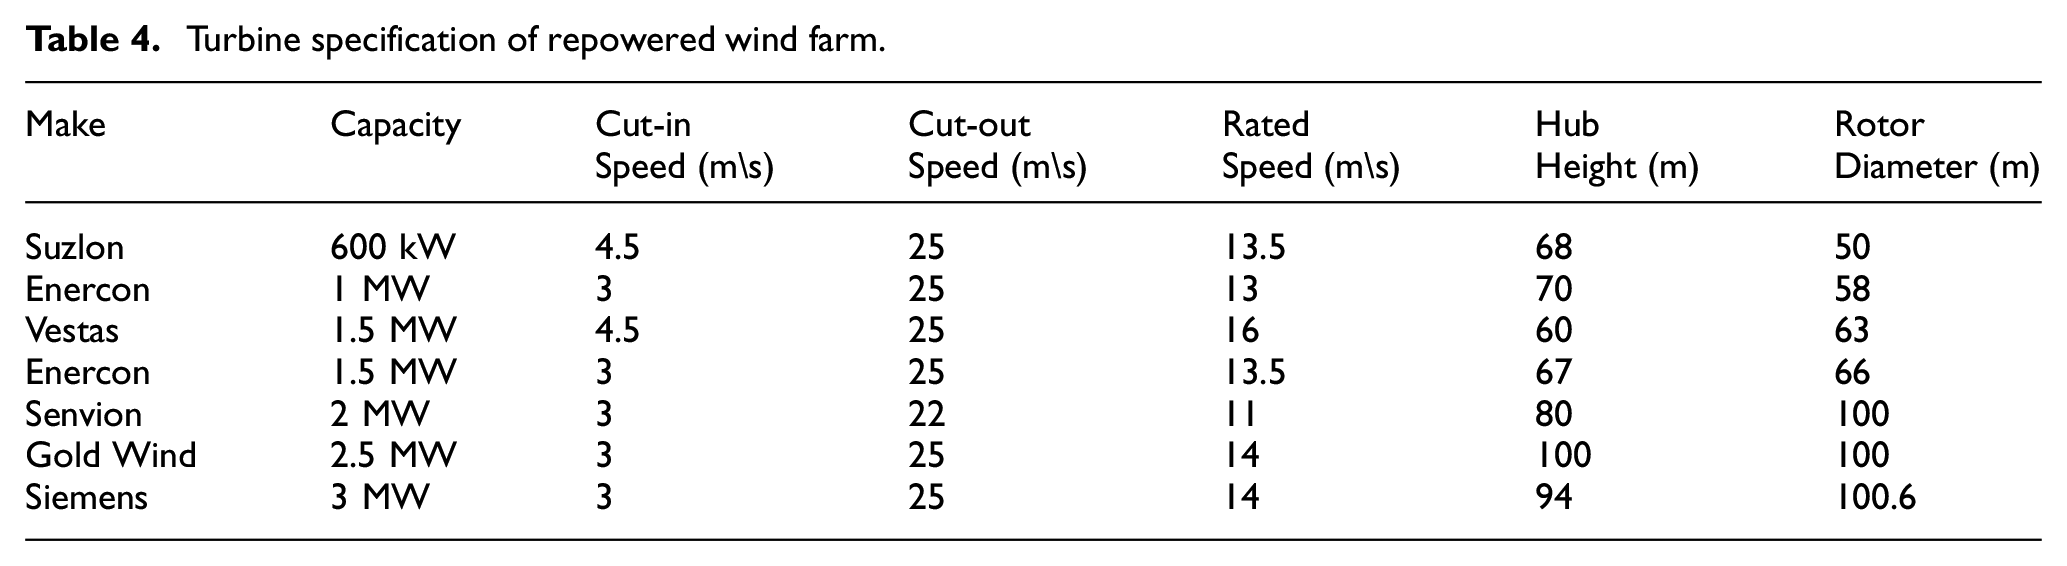
The spacing between the turbines of the re-powered wind farm must be studied in order to minimize the wake generated by the turbines in front. In India, wind farms are built perpendicular to the prevailing wind direction using the 5D × 7D arrangement (five times the rotor diameter in the same row and seven times the turbine diameter in the next row). The wind farm is re-powered with the turbines mentioned in Table 4. The turbine specifications (hub height) are taken as the default value. The wind farm’s area has been enlarged to 200 acres for this repowering purposes. As the capacity of the individual turbines increases, the number of machines in the farm reduces. On the basis of the wind farm’s net AEP and CUF, the repowered wind farm is compared to the existing wind farm.
Turbine specification of repowered wind farm.
Replacing the turbines 23 to 26 with 600 kW turbines
Previously the hub height of the turbines is altered to reduce the wake loss. Here, the turbines are changed to 600 kW turbines with a hub height of 68 m. This hub is chosen because it is the default hub height used in the software. As discussed before, as the hub height changes the interaction with the wake from the front turbines in these turbines reduces. Hence, the wake loss of these turbines decreases. Figure 16(a) shows the wake loss of individual turbines. The wind farm CUF and net AEP is shown in the Figure 16(b) and (c) respectively.
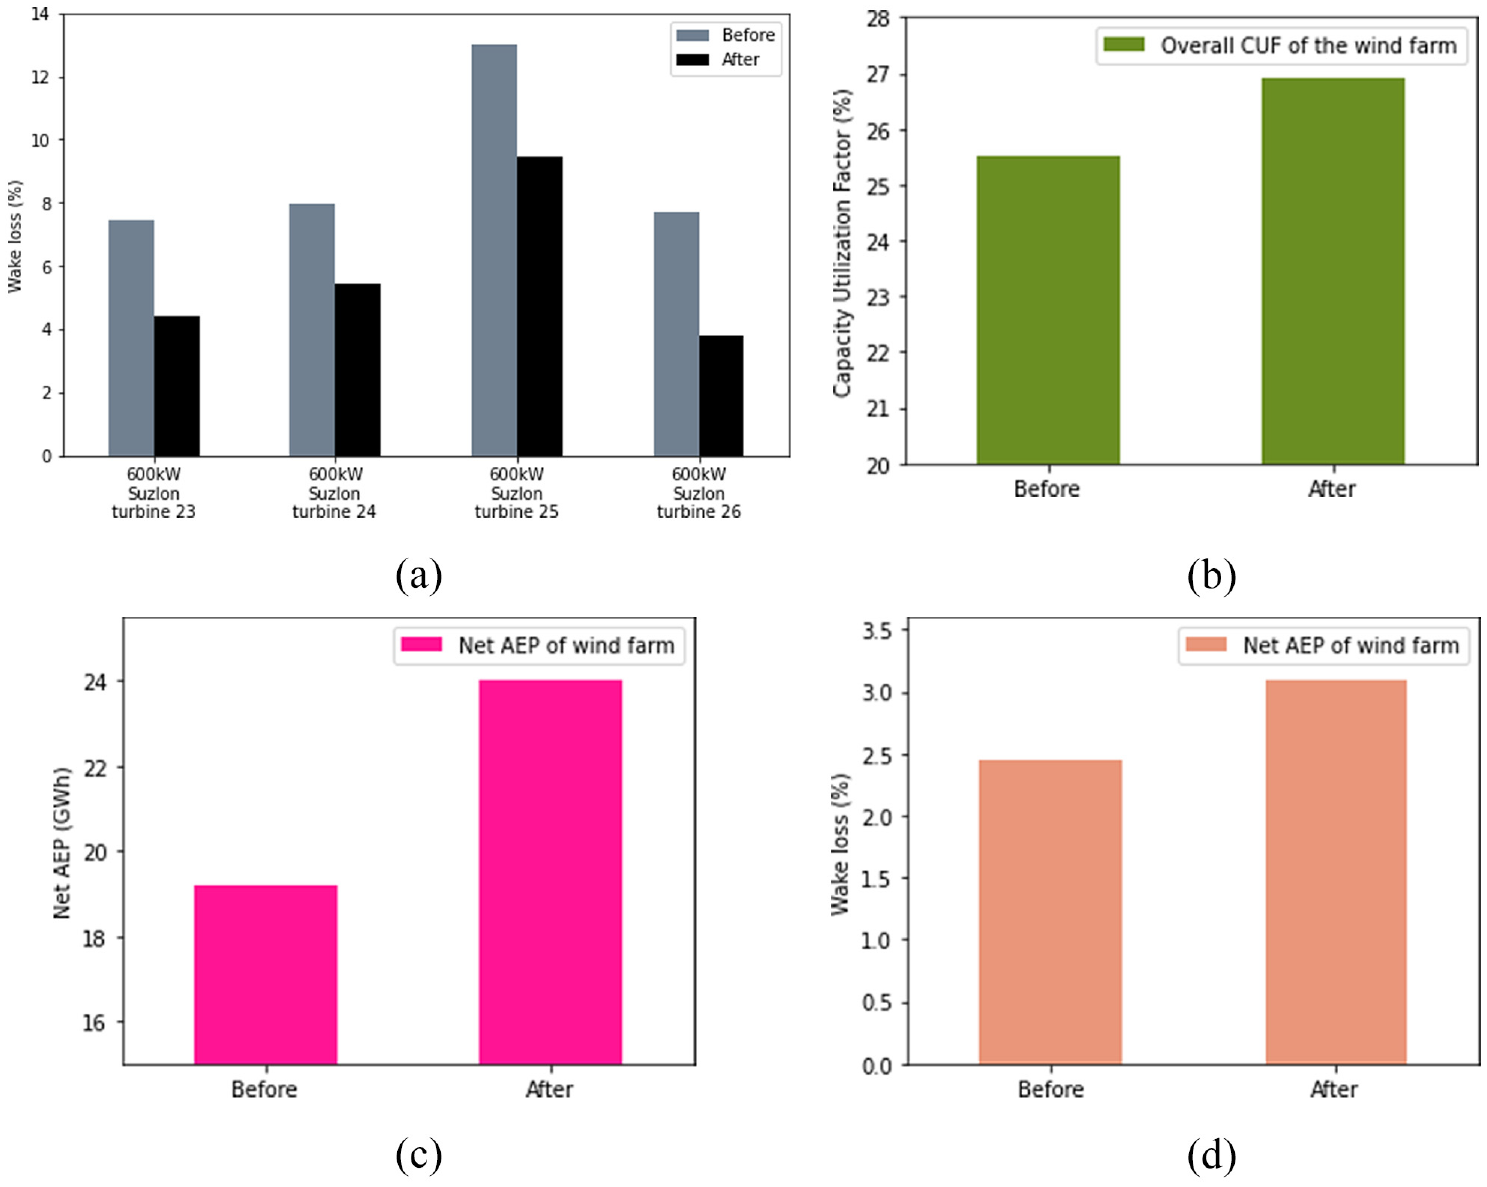
Result of replacing the 200 kW turbines 23, 24, 25, and 26 with 600 kW turbines: (a) changes in the wake loss of turbines 23, 24, 25, and 26 before and after repowering with 600 kW turbines, (b) variation in the CUF of the wind farm after repowering the turbines 23, 24, 25, and 26 with 600 kW turbines, (c) variation in the AEP of the wind farm after repowering the turbines 23, 24, 25, and 26 with 600 kW turbines, and (d) variation in the overall wake loss of the wind farm after repowering the turbines 23, 24, 25, and 26 with 600 kW turbines.
The result of repowering the turbines 23, 24, 25, and 26 with 600 kW machines shows that the wake loss of turbines decreased to 4.4%, 5.45%, 9.48%, and 3.81% respectively from 7.43%, 7.95%, 13.01%, 7.72%. The net AEP increased to 24.027 GWh from 19.211 GWh. The CUF of the wind farm increased to 26.9% from 25.5%. Although the AEP and the CUF of the wind farm increase and the wake loss of these individual turbines decrease, the total wake loss of the wind farm increases this is shown in Figure 16(d). Since the higher capacity machines have higher blade lengths, the interaction of the wake caused by these turbines on the other turbines increases. This increases the wake loss of other turbines. This increases the wake of the wind farm. Repowering of these turbines will cause more mechanical stress on the turbines. Thus repowering these turbines is not advisable. Also, the re-powering of these turbines will need more investment and the payback is much higher.
Repowering the wind farm with 600 kW turbines
In the analysis, the 30 turbines of capacity 200 kW each in the existing wind farm is replaced with 11 turbines of capacity 600 kW each. The 11 turbines are spaced 250 m on the same row and 350 m on the next row. Figure 17 shows the wind farm with eleven 600 kW turbines. Table 4 provides the turbine’s specifications of the 600 kW turbine used for the study.
Layout of wind farm with eleven 600 kW turbines.
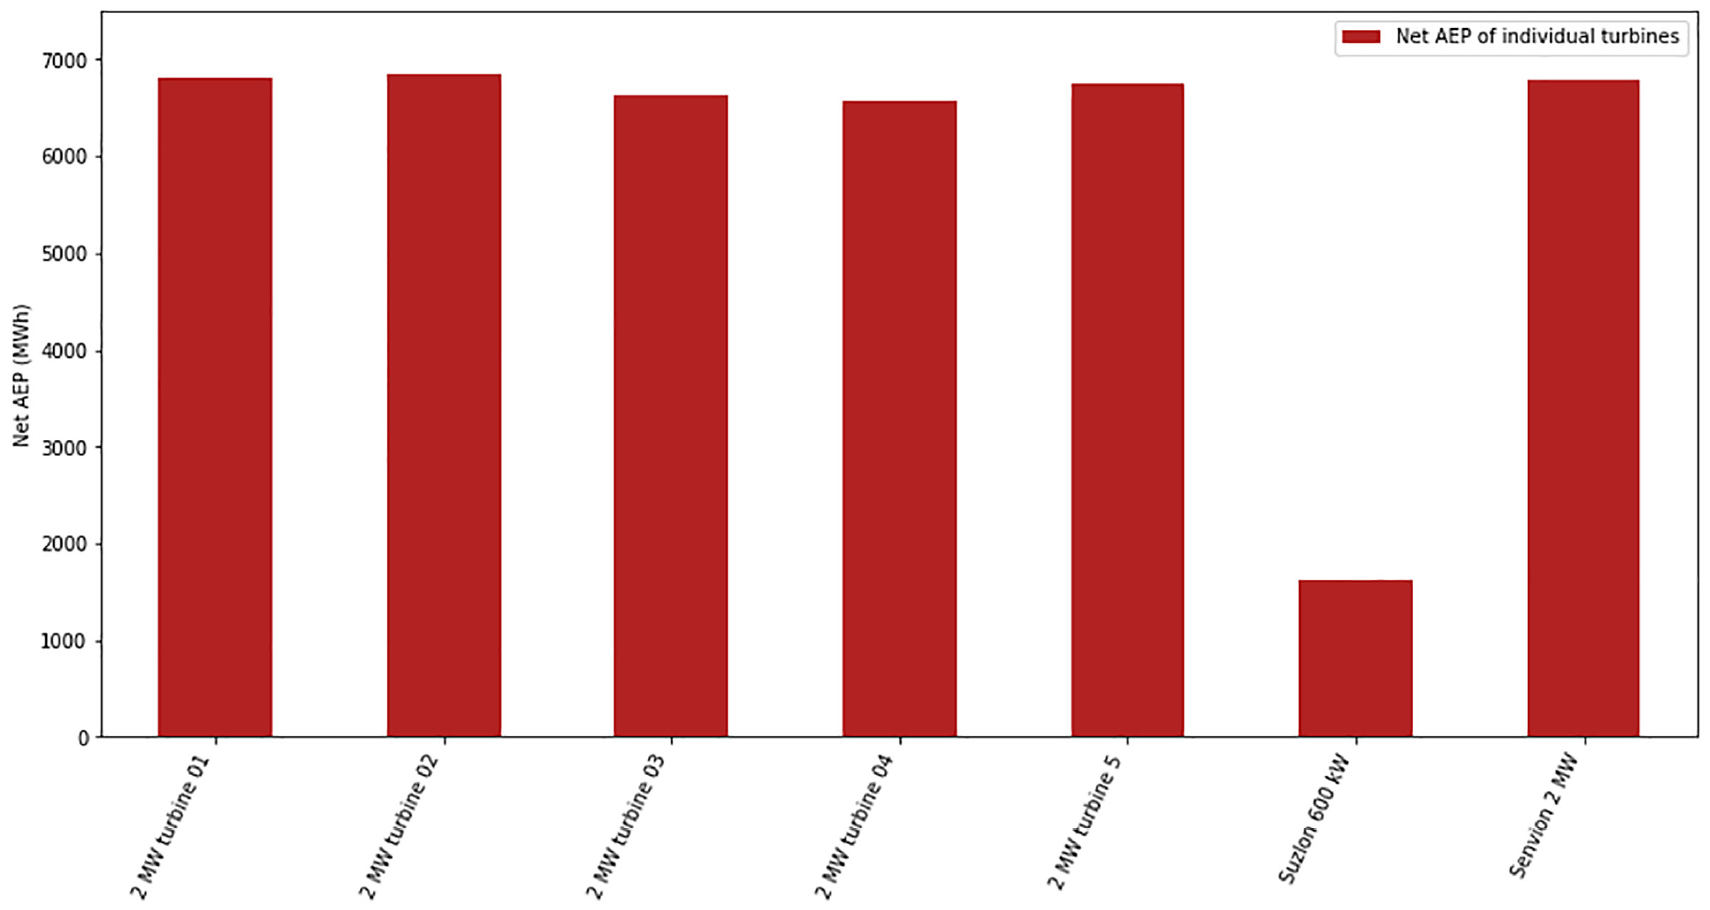
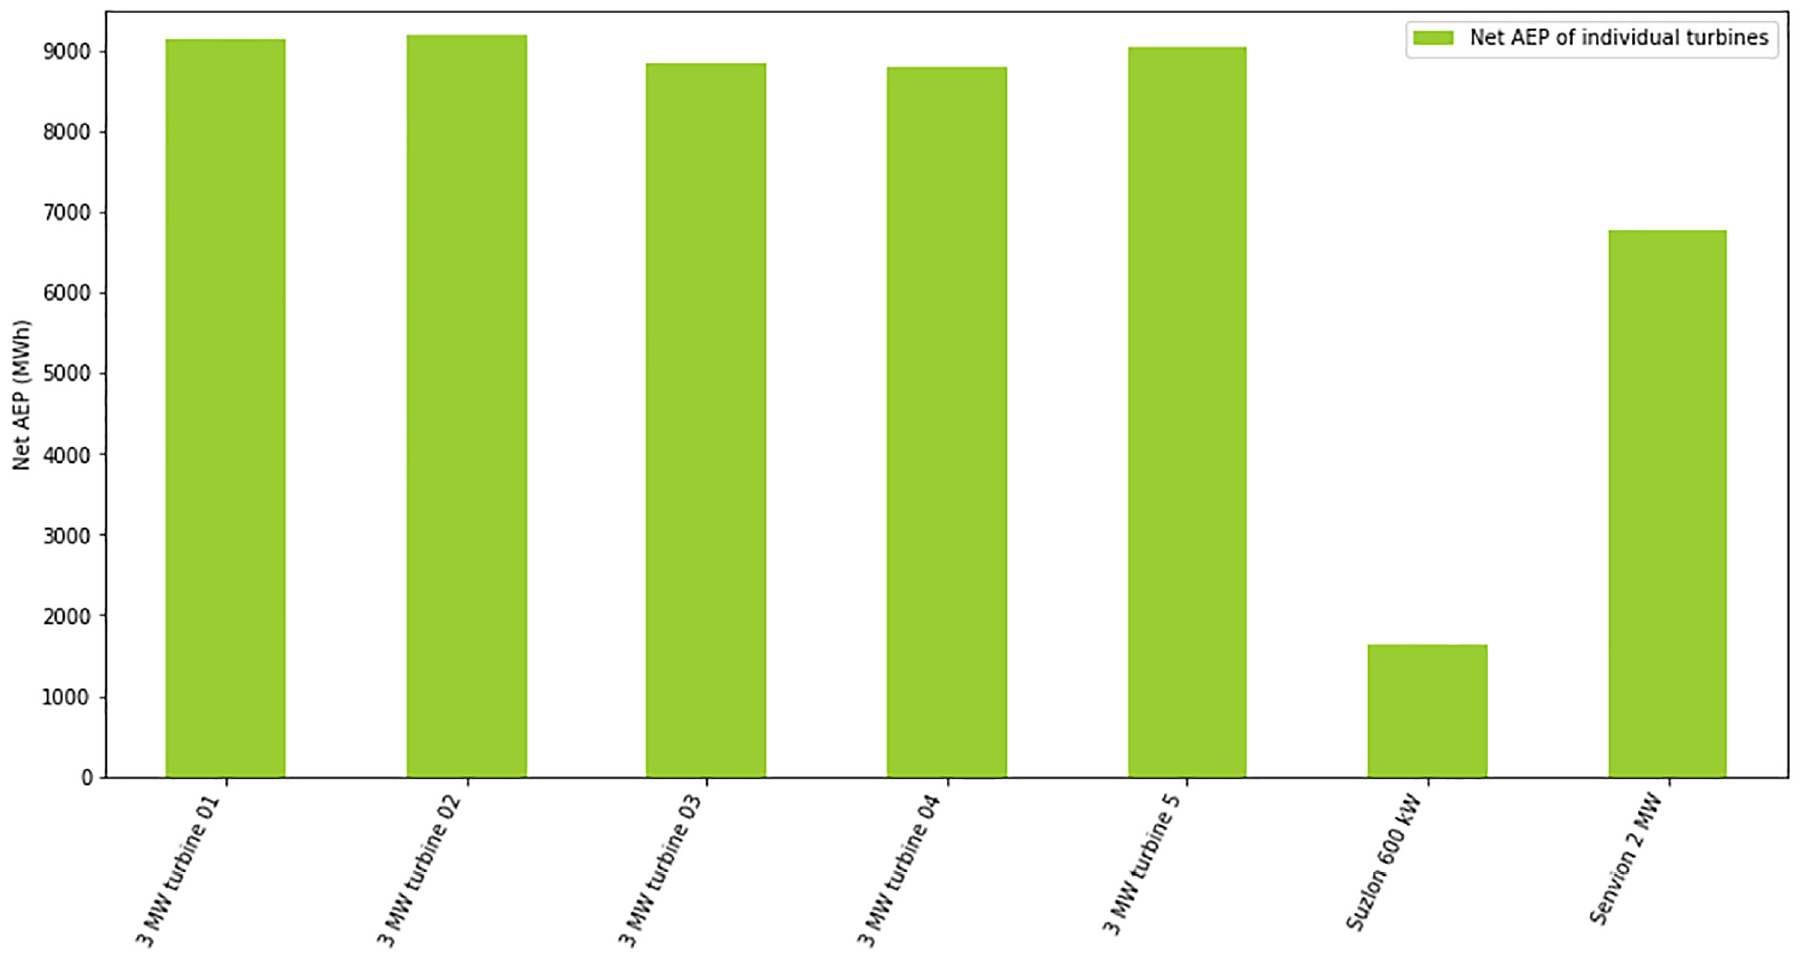
Since the power of the turbine and the hub height increased the wind farm now produces more energy. Figure 18 shows the AEP of each turbines in the wind farm. The individual 600 kW turbines in the repowered wind farm produces an AEP of around 1600 MWh and the 2 MW turbine makes around 6800 MWh annually. This contributes to the increase in net AEP from the wind farm. This is depicted in Figure 19(a).
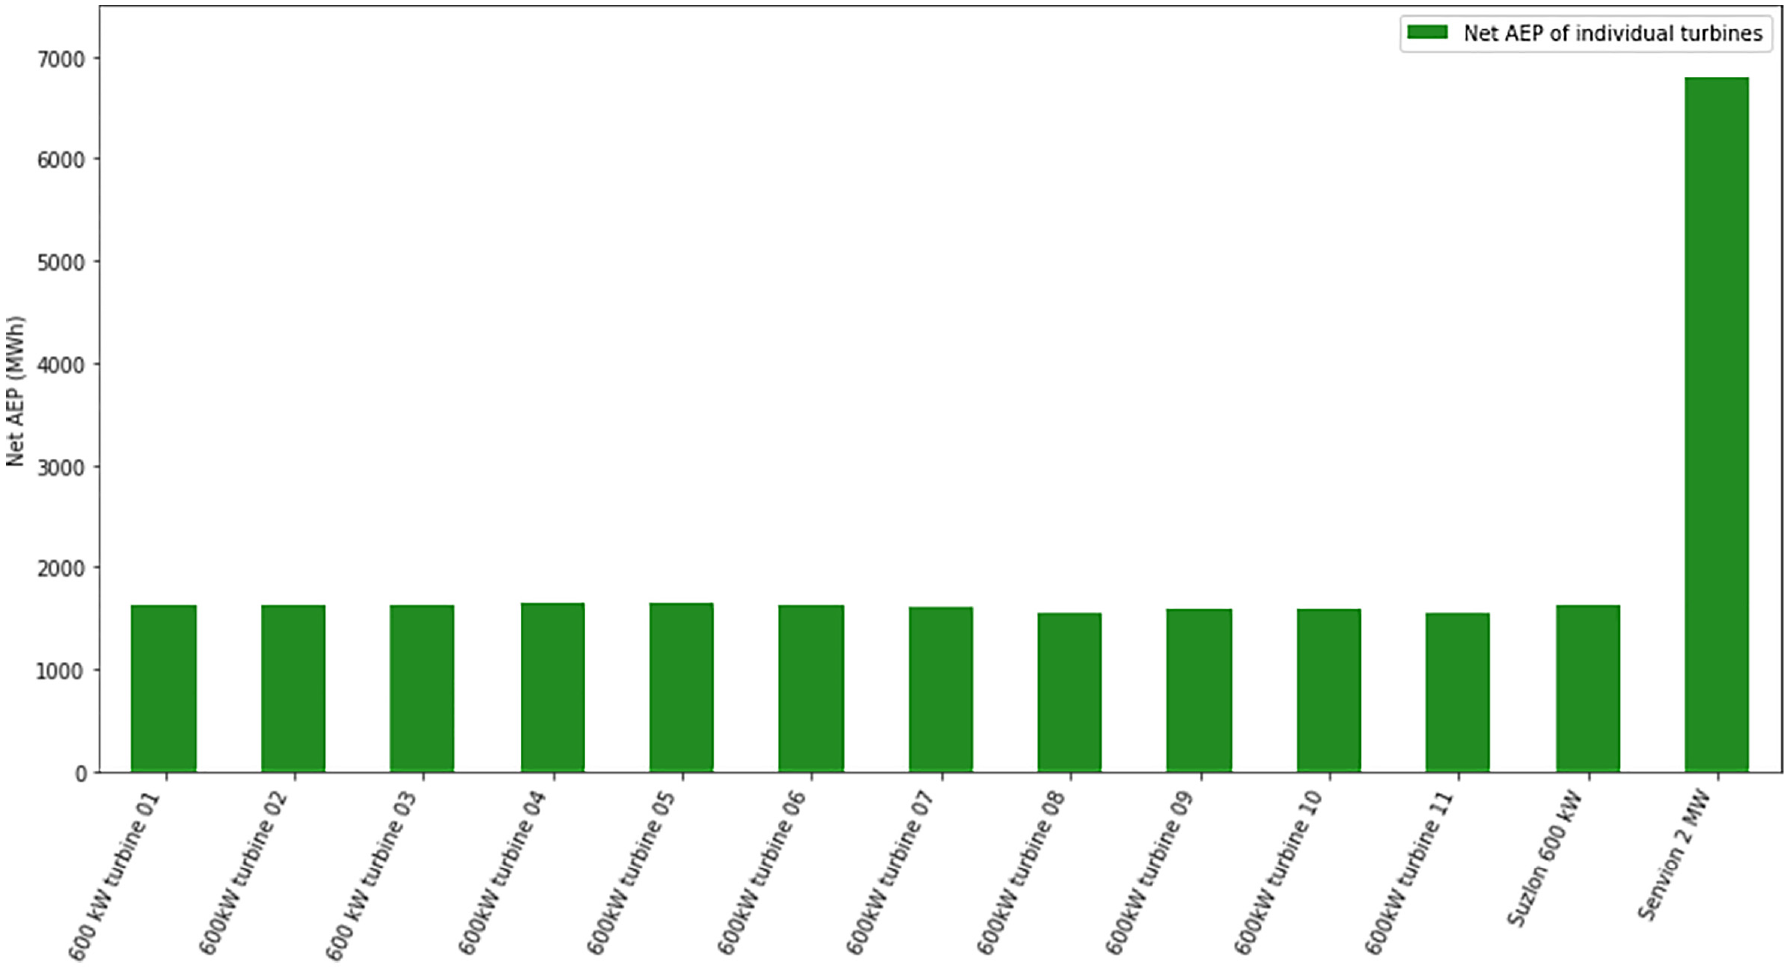
Net AEP of each turbines in the wind farm after replacing the thirty 200 kw turbines with eleven 600 kW turbines.
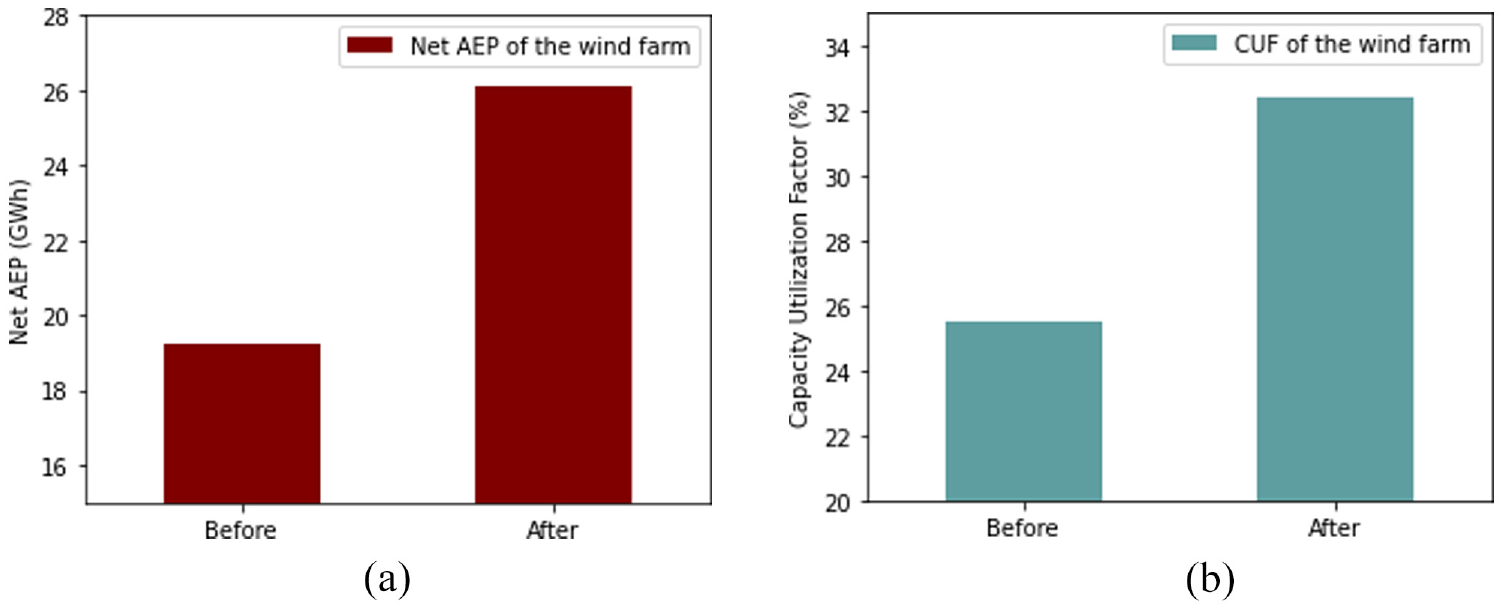
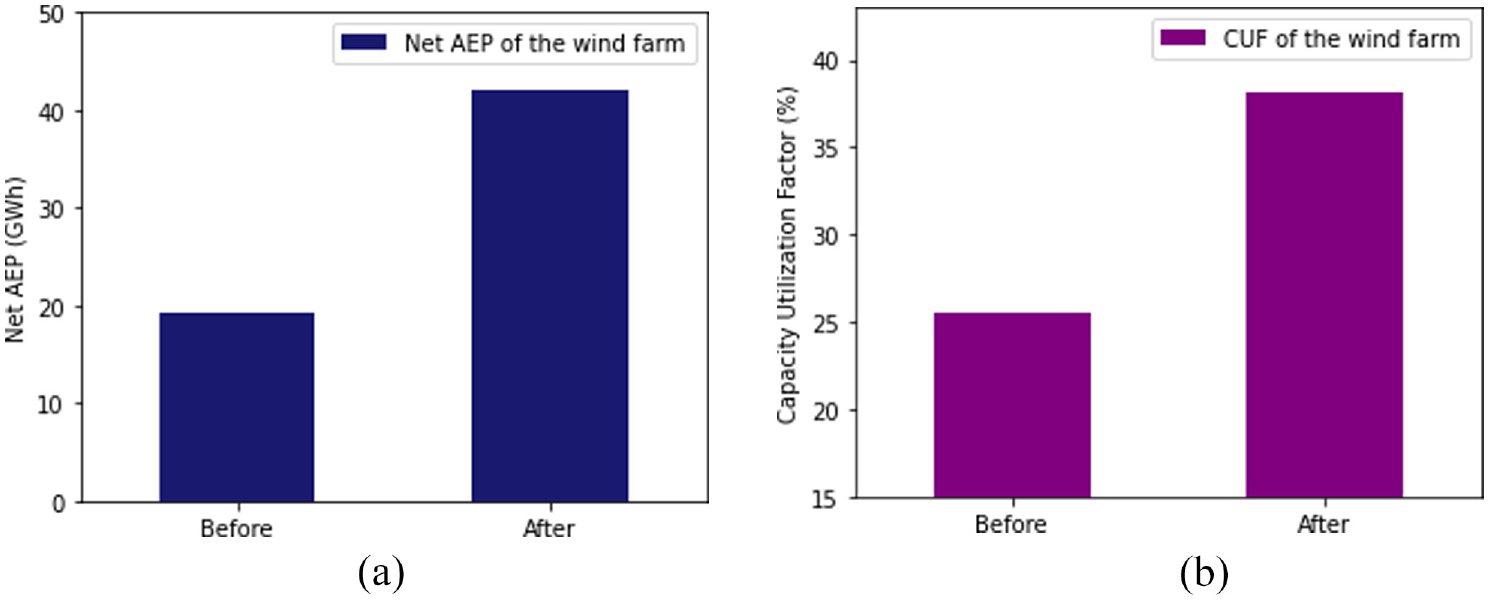
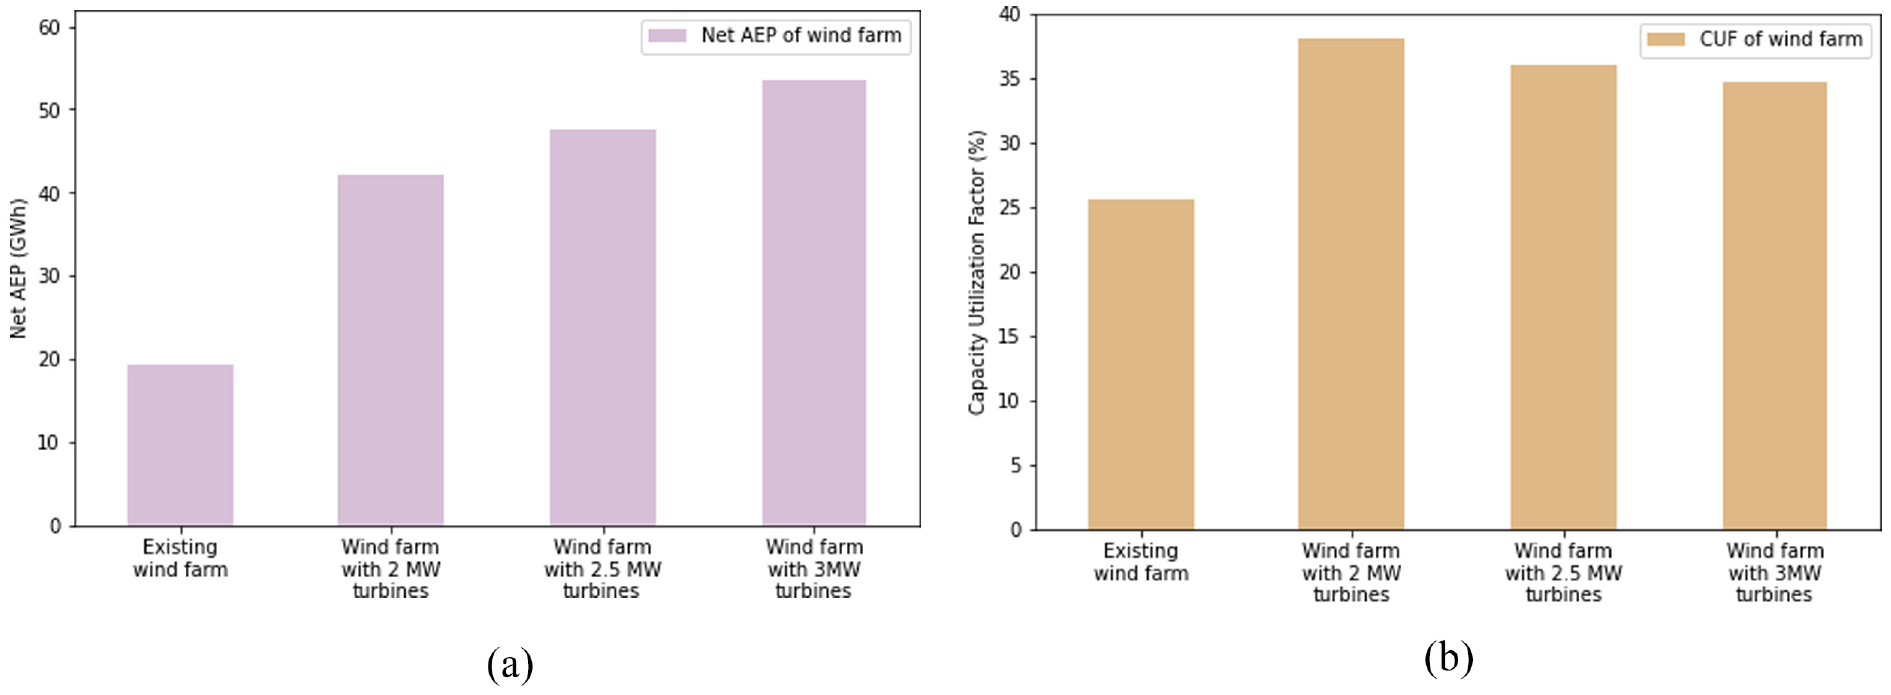
Result of repowering thirty 200 kW turbines in the existing wind farm with eleven 600 kW turbines: (a) AEP of the wind farm after replacing the thirty 200 kW turbines with eleven 600 kW turbines and (b) CUF of the wind farm after replacing the thirty 200 kW turbines with eleven 600 kW turbines.
The repowering of the wind farm with 600 kW turbines increased the wind farm’s performance. The wind farm’s AEP raised from 19.211 GWh to 26.124 GWh, while its CUF improved. After repowering, the CUF of individual turbines was approximately 30%, and the overall CUF of the wind farm increased from 25.5% to 32.4% as shown in Figure 19(b). This is owing to increased energy output as a result of the repowering project.
Repowering the wind farm with 1 MW turbines
For the analysis, the 30 wind turbines of 200 kW capacity each in the existing wind farm are replaced with nine turbines with 1 MW each. The turbine chosen for the analysis is made by Enercon. The specification of the turbine used are shown in Table 4. The rotor diameter of the turbine is 58 m. So in order to maintain the 5D × 7D configuration the wind farm could only accommodate 9 turbines. The spacing between the turbines is 290 m and 400 m on the same row and the next row respectively. The wind farm with nine 1 MW turbines is shown in Figure 20.
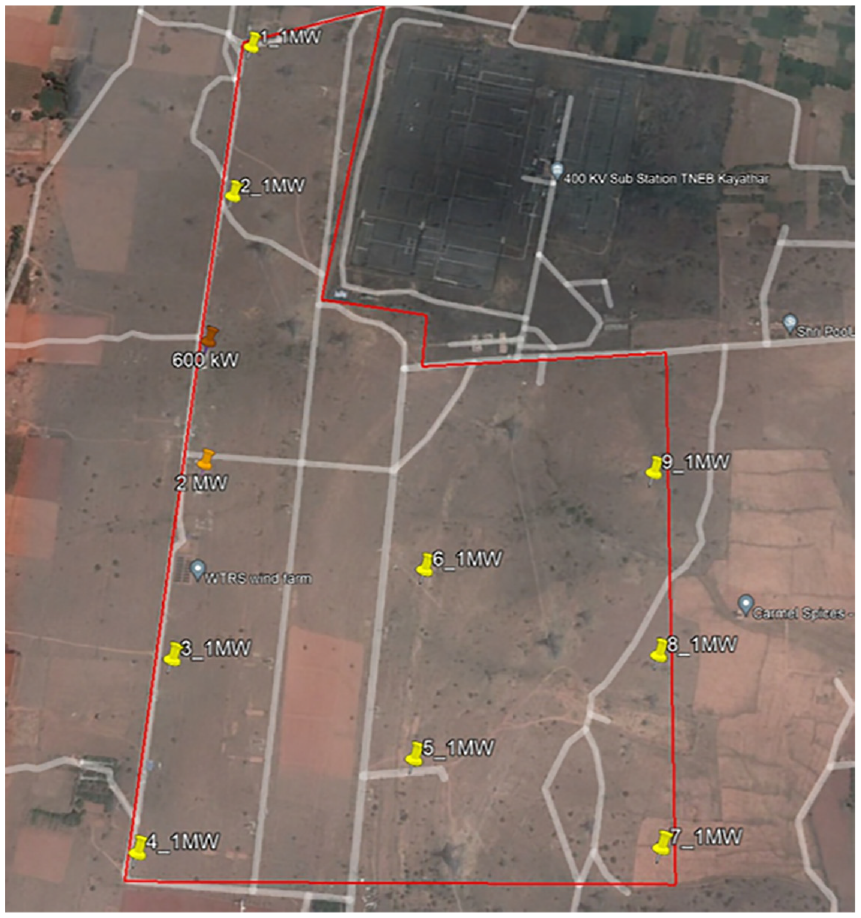
Layout of wind farm with nine 1 MW turbines.
As both the hub height and the power of the turbine increases the turbine produces more energy. This is shown in Figure 21. Each of the 9 turbines in the wind farm produces an annual energy of around 2600 MWh. As a result, the wind farm’s net AEP has increased. Figure 22(a) illustrates this.
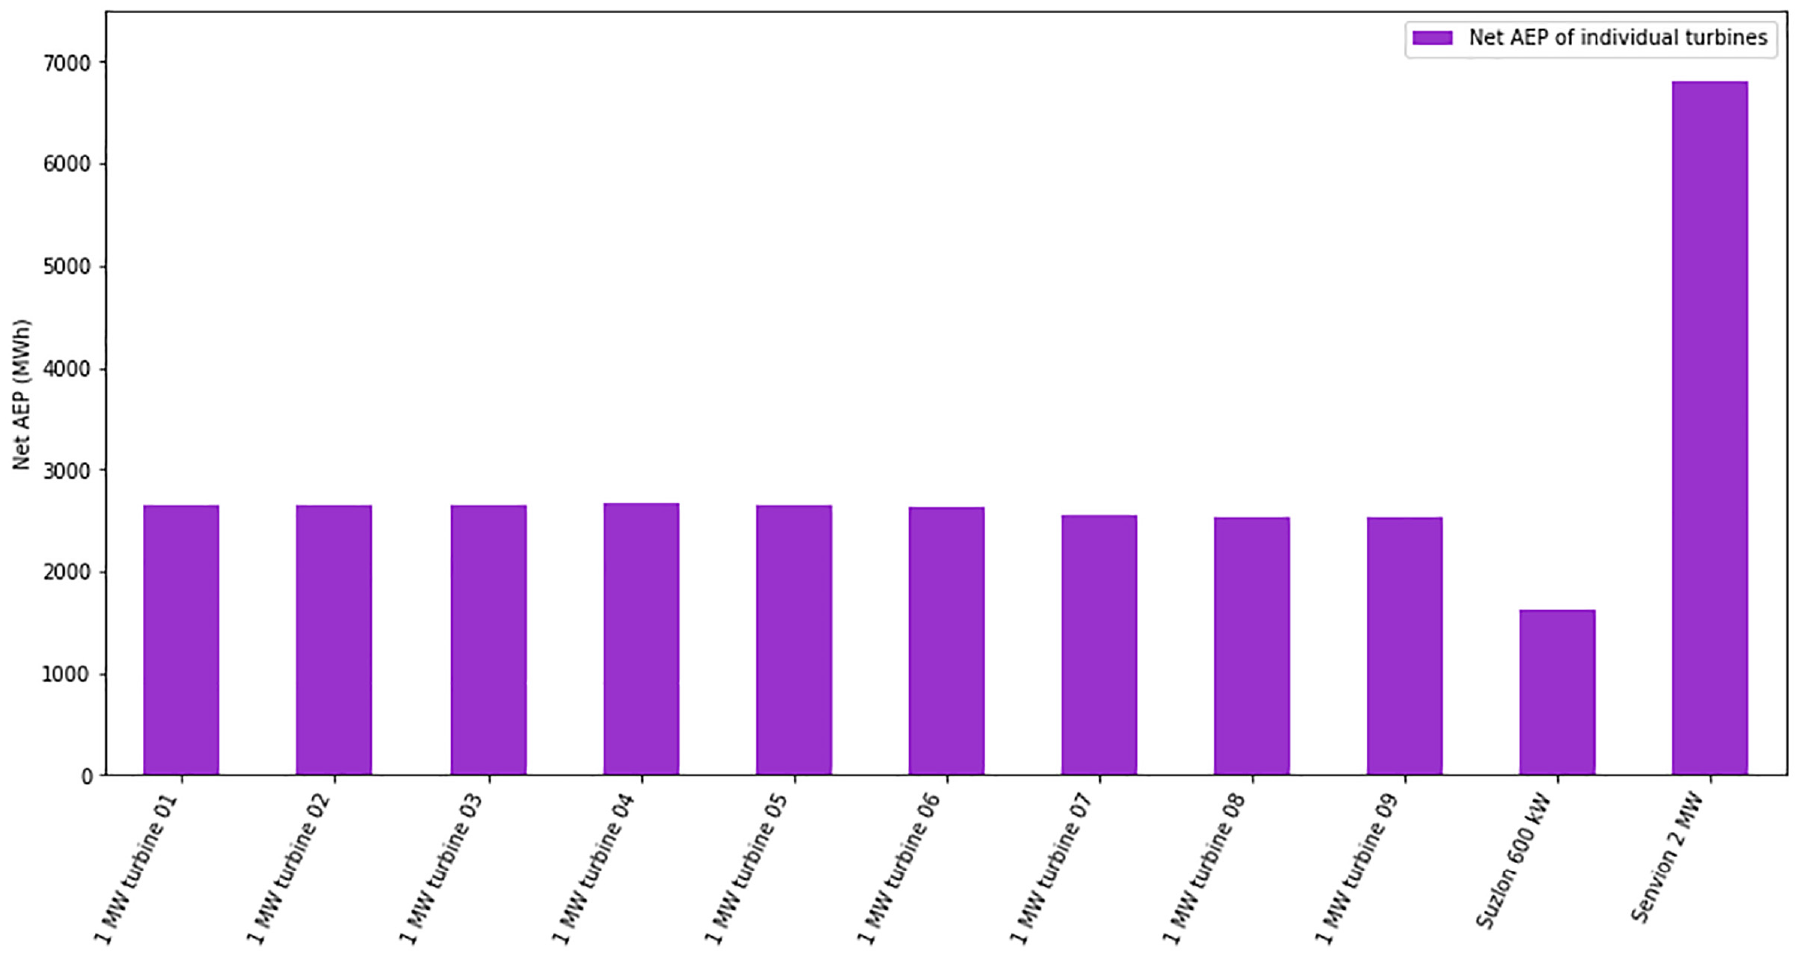
Net AEP of each turbines in the wind farm after replacing the thirty 200 kw turbines with nine 1 MW turbines.
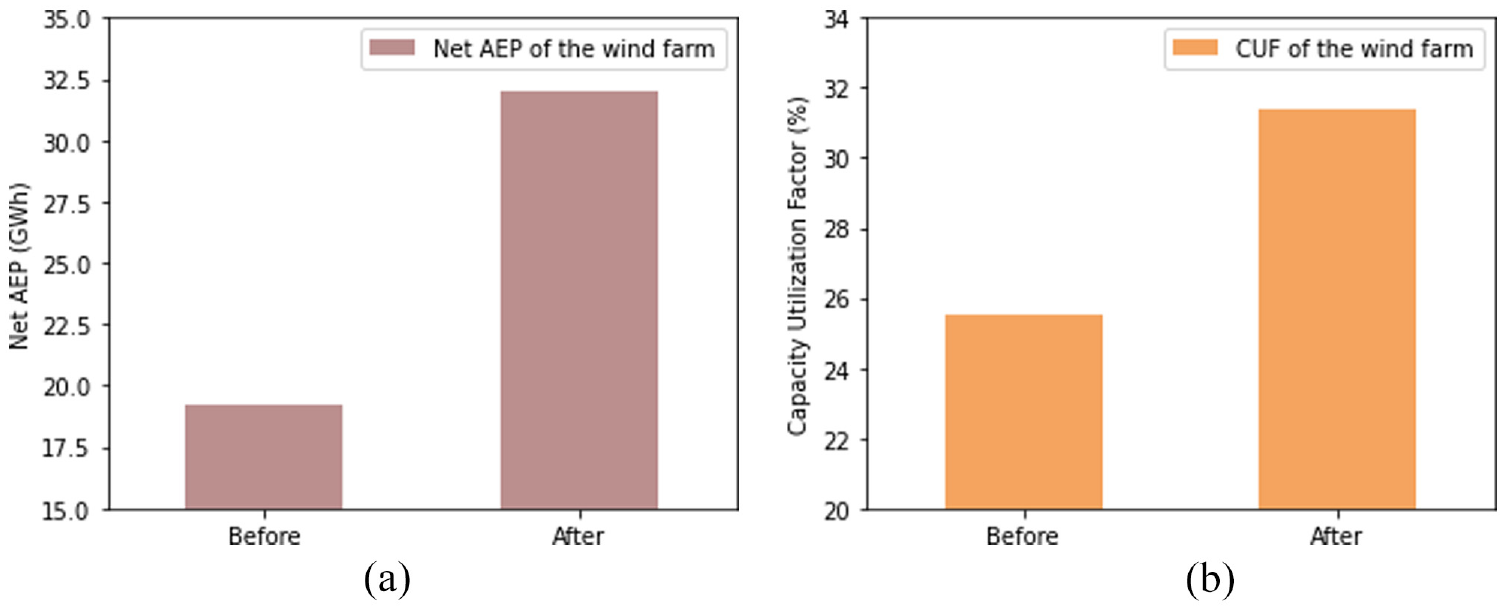
Result of repowering thirty 200 kW turbines in the existing wind farm with nine 1 MW turbines: (a) the wind farm’s AEP after replacing thirty 200 kW turbines with nine 1 MW turbines and (b) the wind farm’s CUF after replacing thirty 200 kW turbines with nine 1 MW turbines.
The wind farm’s net AEP increased from 19.211 GWh to 31.969 GWh. Since the hub height of the 1 MW and the 600 kW turbines are almost the same, the power available from the wind for the conversion is nearly the same. This causes the AEP produced by the 1 MW turbine to be lesser than its rated output. This caused the CUF of the turbines to be lesser than the previous case. The CUF of the turbines is around 30%. Thus the CUF of the wind farm is also lower. The CUF for the wind farm is displayed in Figure 22(b).
Although the CUF of the repowered wind farm is higher than that of the existing wind farm. When compared to the wind farm with 600 kW turbines, the CUF of the repowered wind farm with 1 MW turbines is lower. The CUF of the wind farm is 31.4%.
Repowering the wind farm with 1.5 MW turbines
The existing wind farm’s 30 turbines with a capacity of 200 kW each are replaced with eight turbines of 1.5 MW capacity each for analysis. Only 8 turbines could fit in the wind farm while maintaining the 5D × 7D arrangement. On the same row and the row after it, the distance between the turbines is 315 m and 440 m, respectively. Figure 23 depicts the wind farm, which has eight 1.5 MW turbines.
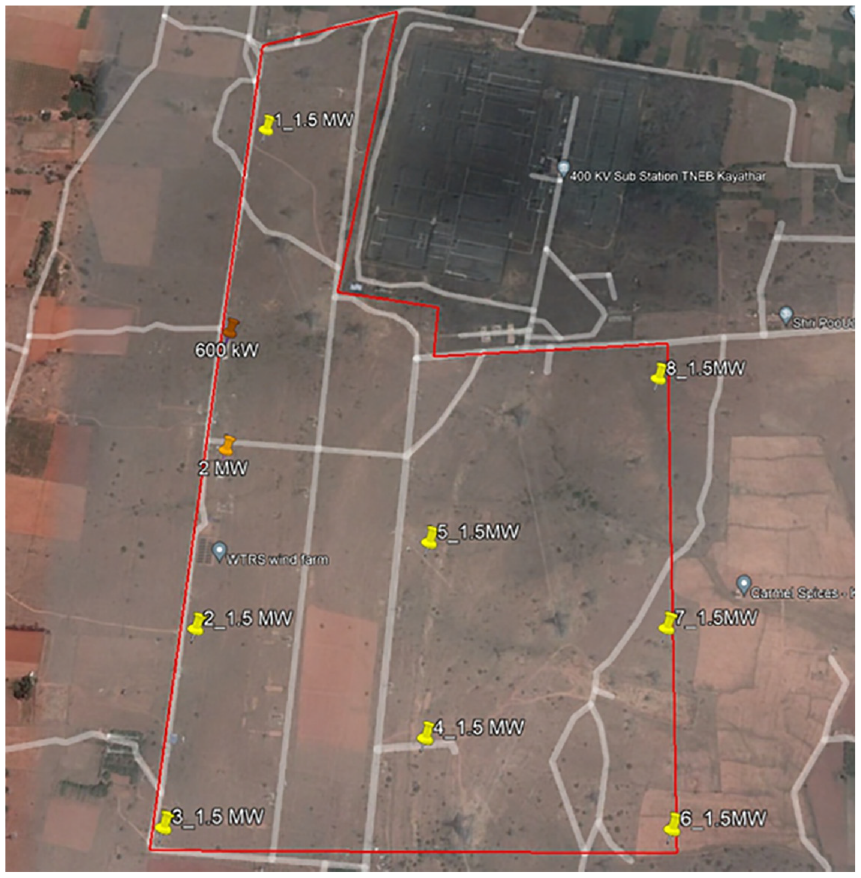
Layout of wind farm with eight 1.5 MW turbines.
Two different turbines of 1.5 MW capacity are used for the analysis. The turbines made by Vestas and Enercon have been selected for analysis. Table 4 provides information about the turbine’s specifications. These two turbines used have two different power curves. This affects the energy generation from the turbines.
Repowering the wind farm with Vestas 1.5 MW turbine
The turbine’s rated wind velocity is 16 m/s, which implies that the turbine only produces full power when the wind speed is 16 m/s. Additionally, the turbine’s hub height is 60 m, which reduces wind speed owing to shear effect. This in turn reduces the power available from the wind for conversion. Figure 24 shows the AEP of the individual turbines.
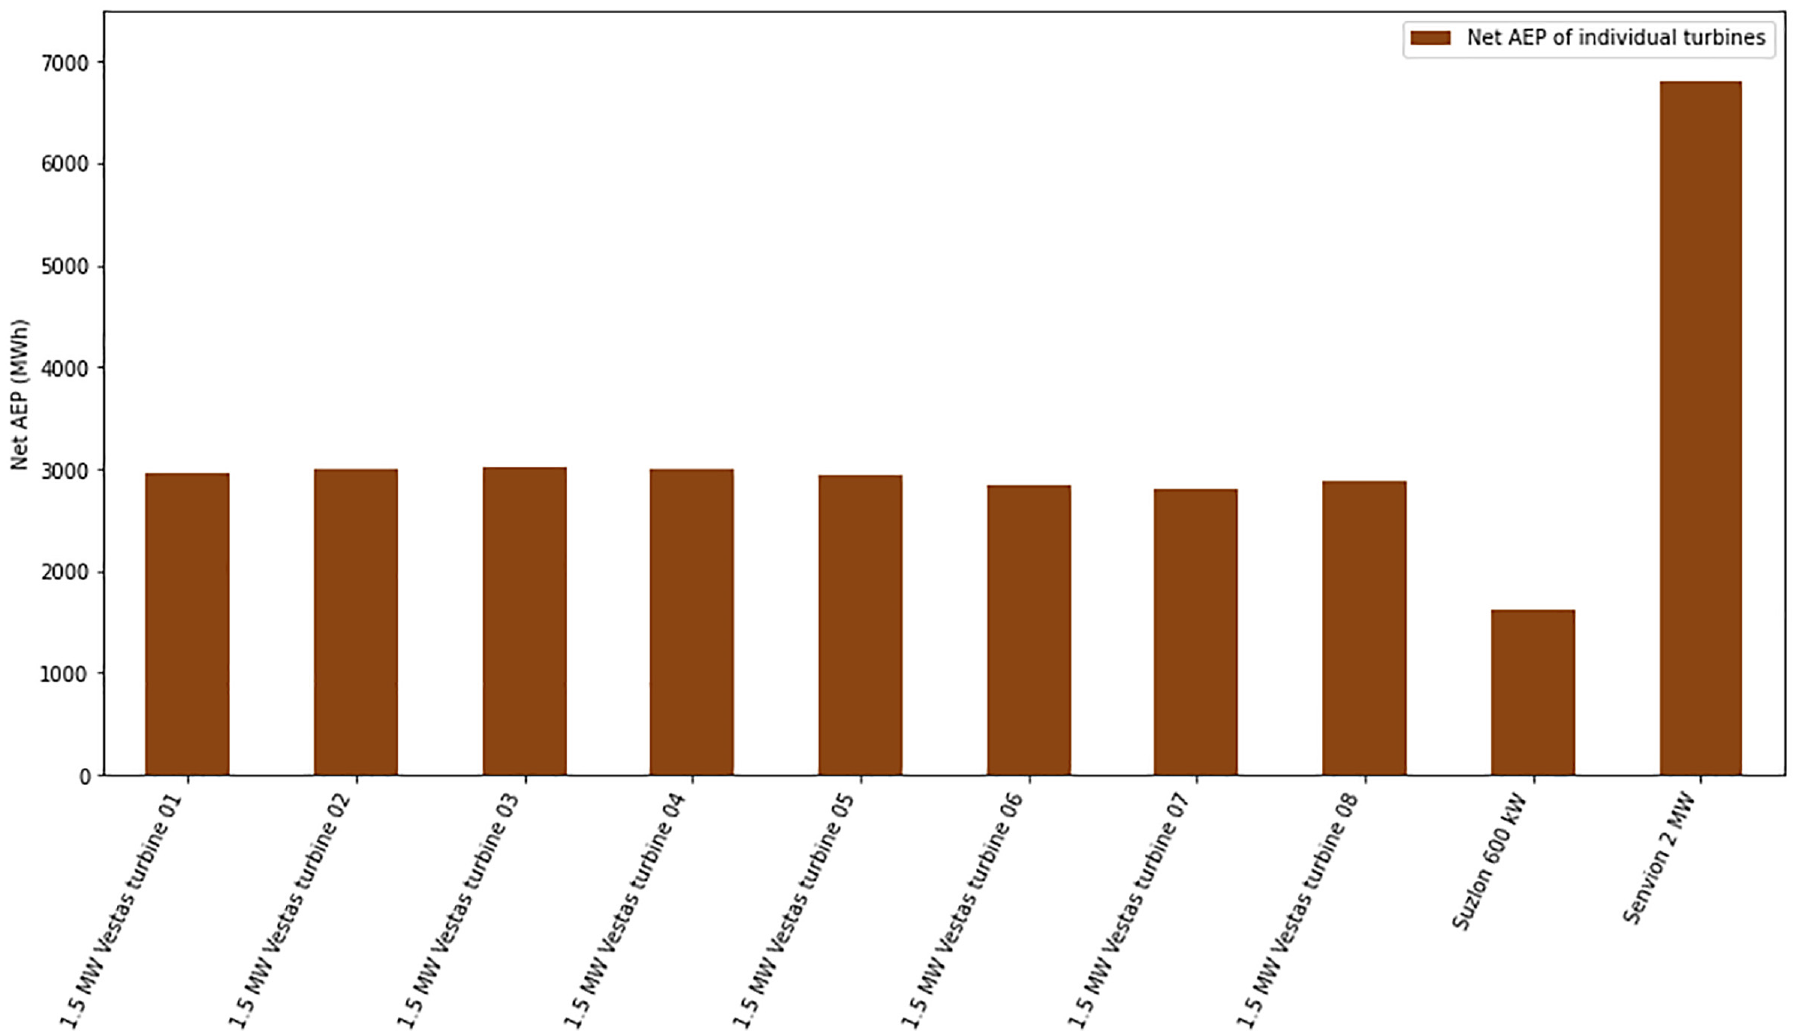
Net AEP of each turbines in the wind farm after replacing the thirty 200 kw turbines with Vestas 1.5 MW turbines.
Each of the wind farm’s eight turbines generates around 3000 MWh of energy each year. As a result, the wind farm’s net AEP has grown. The diagram 25(a) shows this.
Although the wind farm’s AEP increases, it is not the case with the CUF of the wind farm. The CUF of each turbine in the farm is only about 22%. This causes the CUF of the wind farm to be lower than that of the existing wind farm. The CUF of the repowered wind farm is 24.9% as shown in Figure 25(b). This is related to the turbine specifications and the decrease in the turbine’s hub height
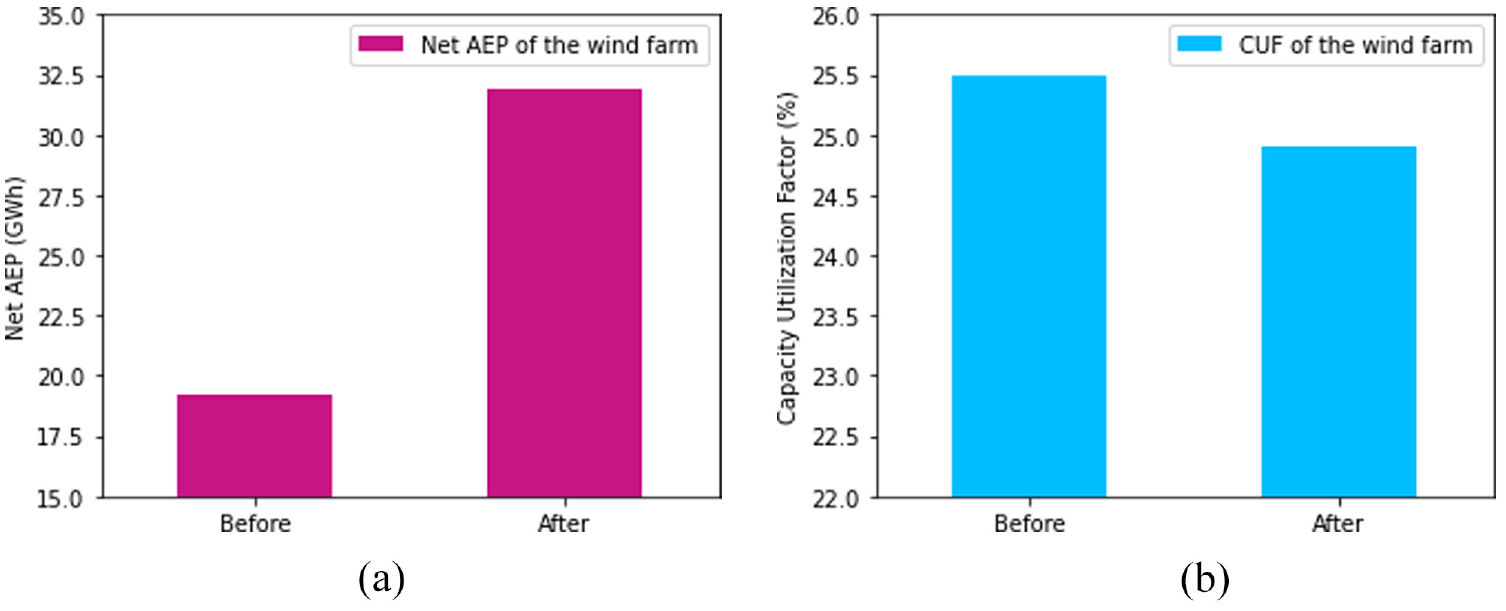
Result of repowering the thirty 200 kW turbines in the existing wind farm with eight Vestas 1.5 MW turbines: (a) AEP of the wind farm after replacing thirty 200 kw turbines with eight 1.5 MW Vestas turbines and (b) CUF of the wind farm after replacing thirty 200 kw turbines with eight 1.5 MW Vestas turbines.
Repowering the wind farm with Enercon 1.5 MW turbine
The turbine’s hub height is higher than the preceding one. This means that the wind speed at the height will be greater, as will the swept area of the turbine. Thus, the wind turbine can extract more energy from the wind. The power curve of the turbine is also different, with the rated speed being much lower. This increases the AEP production from the turbines. The energy production from each turbine is shown in Figure 26.
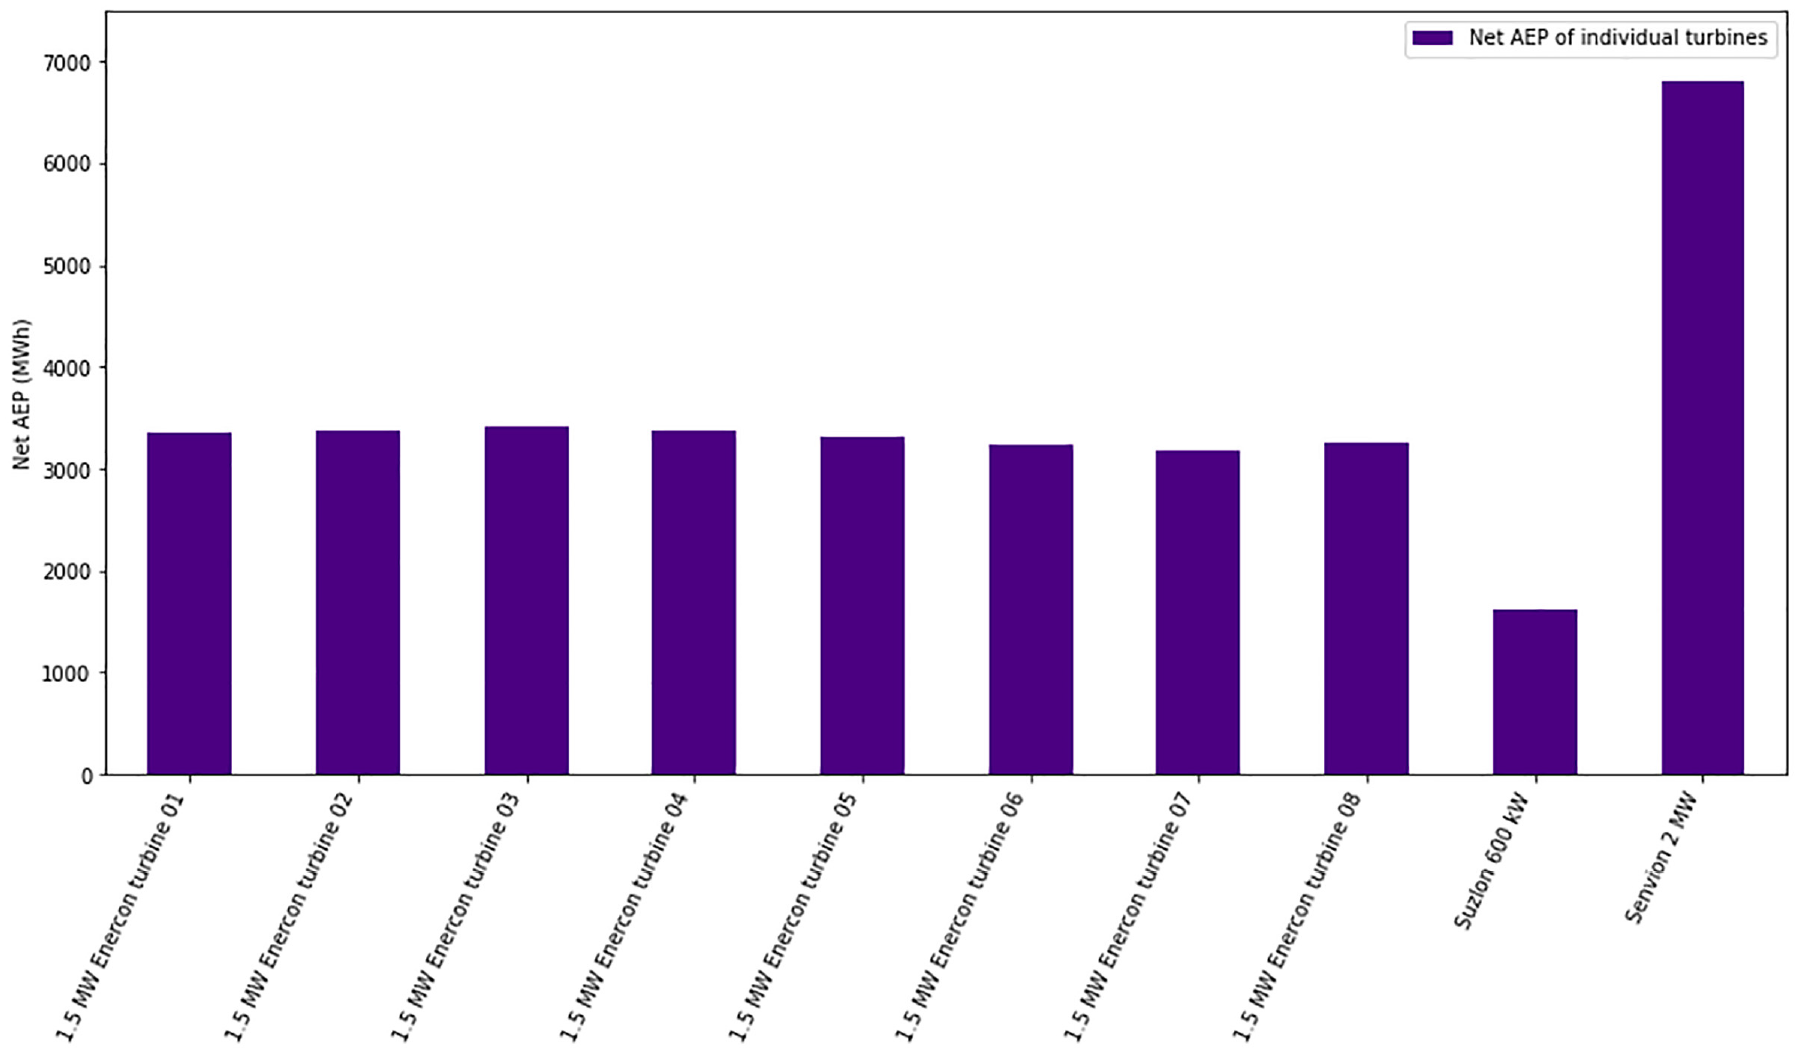
Net AEP of each turbines in the wind farm after replacing the thirty 200 kw turbines with Enercon 1.5 MW turbines.
The eight wind farm turbines produce about 3200 MWh of energy annually. The wind farm’s net AEP increased as a result. When compared with the previous wind farm the net AEP is greater. This is seen in the Figure 27(a).
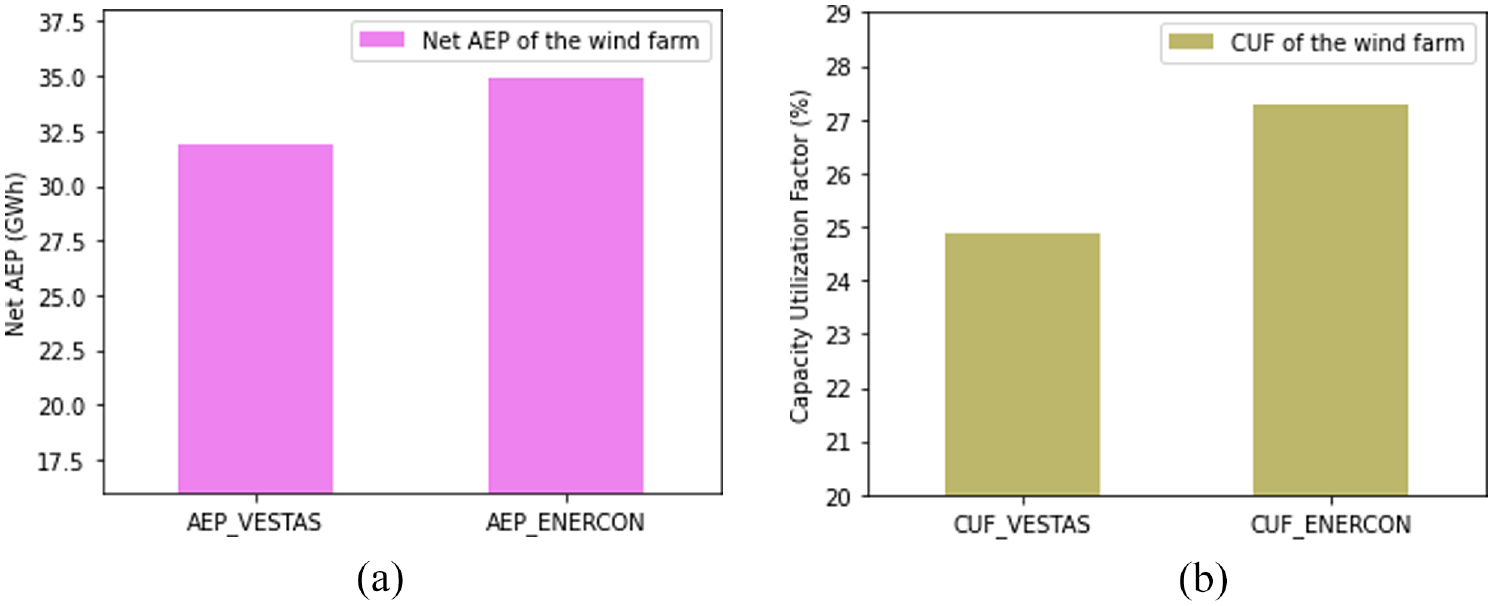
Result of repowering the thirty 200 kW turbines in the existing wind farm with eight Enecron 1.5 MW turbines: (a) comparison of the AEP of the wind farm with Enercon and Vestas 1.5 MW turbines after replacing the thirty 200 kw turbines and (b) comparison of the CUF of the wind farm with Enercon and Vestas 1.5 MW turbines after replacing the thirty 200 kw turbines.
This wind farm provides more energy than the wind farm with Vestas 1.5 MW turbines due to enhanced turbine characteristics. When compared to the previous wind farm, power generation has increased by roughly 3 GWh. This enhances the wind farm’s CUF. Individual turbines at the farm have a CUF of roughly 25%. Because of this, the wind farm’s overall CUF is greater than that of the wind farm with Vestas 1.5 MW turbines. The wind farm’s CUF is 27.3% as shown in Figure 27(b).
Repowering the wind farm with 2 MW turbines
A study is made on repowering the thirty 200 kW turbines in the existing wind farm with five 2 MW turbines. The Senvion turbine is used in this wind farm. The turbine’s rotor diameter, which is 100 m, determines the turbine spacing. 500 and 700 meters, respectively, separate the turbines in the same row from those in the row after it. Only 5 turbines could fit in the region due to the spacing. Figure 28 depicts the wind farm’s layout.
Layout of wind farm with five 2 MW turbines.
The hub height of the turbine is 80 m. This means the speed of the wind also increases and the power available for conversation is high. Figure 29 shows the net AEP of the individual turbines.
Net AEP of each turbines in the wind farm after replacing the thirty 200 kw turbines with five 2 MW turbines.
The individual turbines in the wind farm produce around 6600 MWh of electricity. This is majorly due to the increase in the hub height and swept area of the turbine. This increases the AEP of the wind farm even though the installed capacity is lesser than in the previous case. The net energy production of the wind farm is shown in Figure 30(a).
Result of repowering the thirty 200 kW turbines in the existing wind farm with five 2 MW turbines: (a) AEP of the wind farm after replacing thirty 200 kw turbines with five 2 MW turbines and (b) CUF of the wind farm after replacing thirty 200 kw turbines with five 2 MW turbines.
The wind farm’s net AEP becomes double that of the existing wind farm. The net AEP of this wind farm is 42.027 GWh. This is again around 10 GWh more than the previous case. Thus, the CUF of the wind farm also increases as shown in Figure 30(b). This case produces more energy per installed capacity of the wind turbine. It produces 4.25 GWh of energy per MW of installed capacity.
The CUF of this configuration is the highest among all the cases this is due to the higher generation. The CUF of the wind farm is 38.1%. As seen above the generation per MW is higher than in other cases. This is the reason for the increased CUF.
Repowering the wind farms with 2.5 MW and 3 MW turbines
The selected turbines for this study must fit in the area with a 5D × 7D configuration. Thus, the turbines selected have a rotor diameter of around 100 m, which keeps the distance between the turbines the same as in the last case. The layout of the two farms is also the same as in the previous case which is shown in Figure 28.
The number of turbines on the site also stays the same because the farm’s layout hasn’t changed. The net AEP generated by individual turbines the wind farms with 2.5 MW and 3 MW turbines is shown in the Figures 31 and 32 respectively.
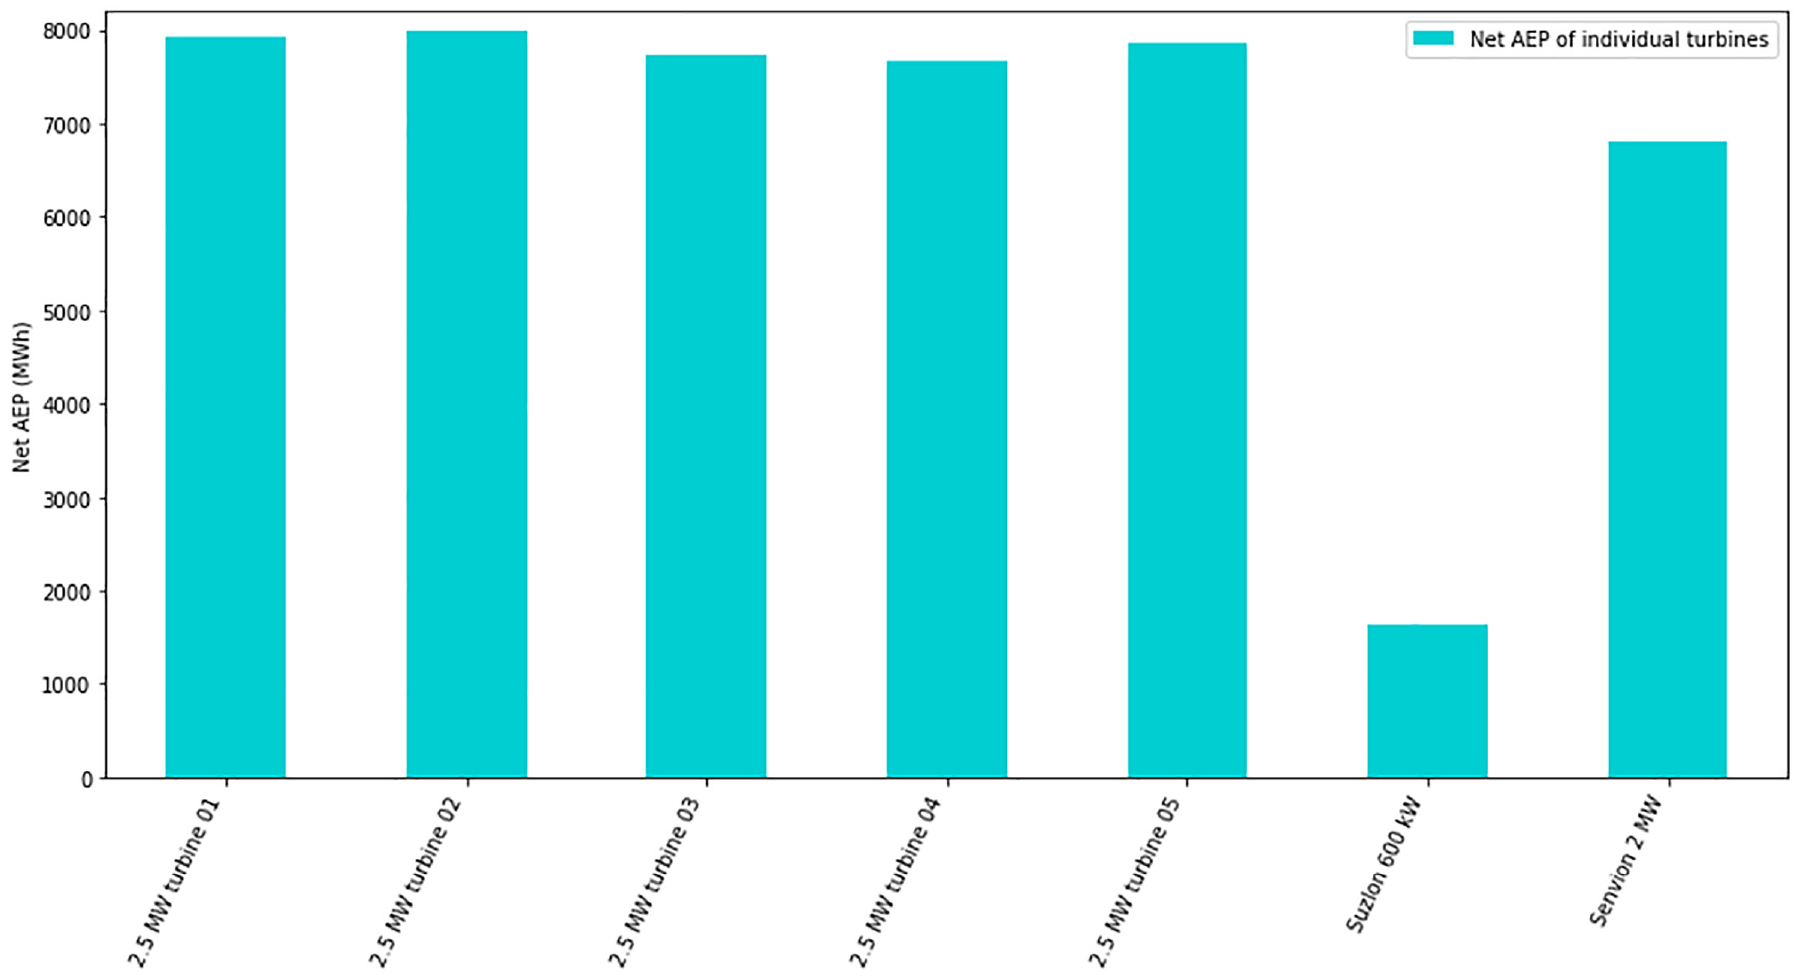
Net AEP of each turbines in the wind farm after replacing the thirty 200 kw turbines with five 2.5 MW turbines.
Net AEP of each turbines in the wind farm after replacing the thirty 200 kw turbines with five 3 MW turbines.
The annual production of each of the five turbines in the wind farm with 3 MW turbines is approximately 9000 MWh, as opposed to the individual turbine production of 7700 MWh in the wind farm with 2.5 MW turbines. This sums up to an addition in the net energy production from the wind farm. The net AEP of the wind farm with these turbines is shown in Figure 33(a).
The result of repowering the existing wind farm’s thirty turbines with 2.5 MW and 3 MW turbines: (a) comparison of net AEP of the wind farm after repowering the existing wind farm with 2.5 MW and 3 MW turbines and (b) comparison of CUF of the wind farm after repowering the existing wind farm with 2.5 MW and 3 MW turbines.
Because the capacity of these turbines raises both the turbine’s and the wind farm’s AEP. This rise in energy production is not related to the turbines’ power rating. As a result, the CUF of wind farms is lower. Individual turbine CUF in a wind farm with 2.5 MW turbine is around 36%, and in a wind farm with 3 MW turbine is around 34%. this is shown on Figure 33(b) This is even lower than the wind farm with 2 MW turbines. The CUF of the wind farms is 36% and 34% for 2.5 MW and 3 MW turbines, respectively.
Result and discussion
Several intriguing conclusions have emerged from the investigation of the repowering feasibility of the Kayathar wind farm. To begin, the wind resource assessment revealed that the site had a power density of 352 W/m2 at a height of 70 m and that the predominant wind direction was west, with an average wind speed of 6.2 m/s. These variables combined to make the site favorable for wind energy generation. The existing wind farm comprised of 30 turbines with a capacity of 200 kW turbines, one 600 kW turbine, and two 2 MW turbines, and produced 19.211 GWh per year with a wake loss of 2.45%.
In the study wakes of some turbines were found to be more than 7%. The feasibility of repowering the wind farm was investigated in order to reduce wake loss by modifying the hub height of particular turbines. The study discovered that altering the hub height of individual turbines resulted in a 2% drop in wake loss, although some turbines reported an increase in wake loss due to increased interaction with the wake from upstream turbines. The AEP of the wind farm increased by 2.26% due to a decrease in wake loss when the hub height of four turbines in the last row was altered at the same time.
The wind farm’s repowering feasibility was also investigated by replacing the turbines with larger capacity machines. According to the study, repowering the four turbines in the back row with 600 kW turbines resulted in a 29% increase in AEP, demonstrating that repowering is a more profitable alternative than simply increasing the hub height.
Finally, the study looked at repowering all 30 turbines with different capacity machines ranging from 600 kW to 3 MW. Since the energy production of turbines is dependent on both the hub height and the turbine characteristics, some of the turbines had a lower capacity utilization factor (CUF). To find the best case, a comparison based on many performance indices is required. Wind farms are compared based on metrics such as the Repowering Capacity Ratio (RCR), Repowering Energy Ratio (RER), Payback Period, and Levelized Cost of Electricity (LCoE). The wind farms are compared to the existing wind farm’s indices. These parameters can be calculated using the equations (5), (6), (7), (8) respectively.


Repowering capacity and energy ratio are the ratios of new wind farm capacity and energy production relative to an existing wind farm with thirty 200 kW wind turbines.

The term payback time refers to the number of years needed to return the initial capital investment. It is, in other words, the time frame at the conclusion of which the wind farm has generated enough net revenue to recoup its investment expenditures.

An energy-generating asset’s Levelized Cost of Electricity (LCOE) is defined as the average cost of installation and operation per unit of the total energy produced over an expected lifetime. The average minimum price at which the electricity generated by the asset must be sold in order to offset the overall costs of production over its lifetime is referred to as the Levelized cost of energy. The LCOE should be lower than the electricity selling price to the grid.
There are certain assumptions made in the calculation of Payback and LCOE. The initial investment is taken as 60,000 per kW (Idam Infra, 2018), which is common for India. The operating cost of the wind farm for every year is taken as 1% of the total initial investment. For calculating the LCOE the wind farm’s energy output degradation factor is taken as 0.5% every year.
Table 5 shows the comparison of wind farms with different turbines. The comparison is made on the above-mentioned parameters.
Comparison of the repowered wind farm.

The repowered wind farm with the 600 kW turbine has an increase in capacity of 10% and the energy production of the same is increased by 61%. The initial investment of the wind farm is considered to be 396,000,000. This gives an O&M cost of 3,960,000 each year. This gives payback in 7.55 years. The LCOE of this wind farm is 0.7913/ kWh.
The capacity of the wind farm with the 1.5 MW turbines is double that of the current wind farm. However, the energy ratio varies depending on the situation. In comparison to the other repowered wind farms, the one with Vestas 1.5 MW turbines has a lower energy ratio. This wind farm increased the generation by 2.13 times whereas the wind farm with an Enercon turbine increased the production by 2.41 times. This can also be seen in the payback period and the LCOE of the wind farms.
The repowered wind farm with the 2.5 MW turbine and 3 MW turbine has increased capacity and electricity generation. The LOCE of these wind farms is higher. Even the payback of the wind farm with 2.5 MW turbines is higher than the repowered wind farm with 2 MW turbine.
The repowered wind farm with five 2 MW turbines is the best case. Even though the capacity and energy generation are not higher than the other wind farms with higher capacity machines, the LCOE of the system is lower than in all the cases. This wind farm has only 1.6 times the capacity and 3.04 times the energy production. The wind farm’s payback period is 6.08 years based on 600,000,000 investment. This is lower than that of the wind farm with 2.5 MW turbines and only a bit higher than the wind farm with 3 MW turbines. But the LCOE is only 0.7489/kWh, which is the lowest among all the cases. Thus, this wind farm will give higher returns.
Conclusion
Repowering wind farms entail replacing older, inefficient turbines with newer, more powerful ones, which provides benefits such as higher energy output, reduced wake loss, and an extended wind farm lifespan. The future of repowering in India seems bright, with the government and corporate sector launching a number of programs to assist the expansion of renewable energy. India has set an ambitious goal of 450 GW of renewable energy capacity by 2030. Wind farm repowering can help to boost efficiency and lower energy costs, so contributing to this goal. Furthermore, the government is providing a variety of incentives, such as subsidies and tax breaks, to encourage repowering projects. Rising energy consumption, falling renewable energy technology costs, and the desire to reduce greenhouse gas emissions are all projected to fuel the rise of repowering in India.
The study is conducted on a wind farm with 32 turbines in the Kayathar site. The study emphasizes on the reduction of wake loss in the existing wind farm by altering the hub height of the machines and repowering the turbines with higher-capacity machines.
Around a 2% decrease in the wake loss of turbines was found when individually changing the turbine’s hub height. Changing the hub height increased the AEP by 2.26%. Repowering the 30 turbines is found to be profitable as the payback is lower. When the farm was repowered with five turbines of 2 MW capacity each, the LCOE was found to be lowest at Rs 0.75/kWh.
Footnotes
Declaration of conflicting interests
The author(s) declared no potential conflicts of interest with respect to the research, authorship, and/or publication of this article.
Funding
The author(s) received no financial support for the research, authorship, and/or publication of this article.