
Abstract
This paper investigates the effects of slots on wind turbine blade sections on the reduction of fluid loads on the airfoil in turbulent flows. The governing conversation equations were discretized using the finite volume method (FVM), numerically simulating an unsteady flow with a turbulent regime. It was found that slots at ΨA70° and high angles of attack (AOAs) improved the aerodynamic performance of the airfoil and delayed the stall by 2°. The Cl-Cd ratio was 31.49%, 79.22%, and 29.66% higher in the slotted airfoil than in the non-slotted one at an AOA of 18°, 20°, and 22°, respectively. Furthermore, slots with ΨA70° at AOAs of 20° and 22° substantially reduced lift and drag variations on the airfoil.
Introduction
The investigation of flow characteristics and efforts to diminish fluid loads and improve aerodynamic performance around turbine blades are problems concerning the flow of a fluid around an object. Turbine blades subjected to flows are bluff bodies (Belamadi et al., 2016). A large wake zone forms in the flow around a bluff body, leading to a substantial compressive drag. The wake size, flow separation (Pour Razzaghi et al., 2022), and stagnation pressure area (Siddappaji and Turner, 2022) can be reduced by controlling the flow, diminishing the loads on the object, particularly the drag (Gupta et al., 2006; Karbasian et al., 2016; Moshfeghi et al., 2017; Pellegrino and Meskell, 2013). Flow control is used for flows around chimneys, parallel suspension bridges, radar tower vibration alleviation, heat exchanger tubes, and high-rise structures. In general, flow control approaches for aerodynamic force reduction are classified into active and passive groups.
Active control (Gupta et al., 2022): It is implemented using external energy through different methods, for example, acoustic induction and jet blowing.
Passive control (Syawitri et al., 2022): The flow is controlled by modifying the bluff body shape, using auxiliary objects such as control plates and rods, or applying coarse elements on the bluff body.
Active control typically requires sophisticated equipment to provide external power for the control of the flow. Therefore, passive control is simpler and probably more affordable than active control.
The aerodynamic performance of horizontal-axis (HA) wind turbines was evaluated using a passive flow control method (straightened blades). The effects of the flow velocity on the aerodynamic force variations were studied. It was observed that the split location, relative angle between the split walls and free flow, and the relative position of the split end from the separation point were the main determinants (Mdouki, 2017). The aerodynamic characteristics of wind turbine airfoils were discussed, controlling the passive boundary layers using slots. The two-dimensional analysis of a modified S809 airfoil was carried out via computational fluid dynamics (CFD). It was found that slots would not necessarily improve aerodynamic performance. The results indicated that the independent use of the drag and lift to locate the slot would not be efficient, and changes concerning the target may be in the opposite direction (Shehata et al., 2017).
Pellegrino and Meskell (2013) evaluated vortex shedding from the wind turbine blade section at high attacks of angle (AOAs). The vortex shedding frequency fluctuation factor and the lift and drag coefficients during the generation of aerodynamic forces were studied. They showed that the Strouhal number varied from 0.12 to 0.16 for negative angles from −40° to −150° and varied from 0.11 to 0.15 for positive angles from 40° to 140°.
Gupta et al. (2006) simulated the dynamic stall of S809 airfoils using the modified Leishman-Beddoes method for wind turbine applications. The separation point shifted forward as the AOA increased, being stabilized at a point at high AOAs. The increased AOA raised the lift and drag coefficients, with good agreement between numerical and experimental results.
Karbasian et al. (2016) investigated the dynamic stall on an S809 airfoil. They demonstrated that the vorticity size around the airfoil declined as the reduced frequency increased. Also, at a given AOA, an increase in the reduced frequency raised the normal force coefficient (perpendicular to the airfoil chord line) and diminished the thrust (along the chord line). Shehata et al. (2017) studied passive flow control to enhance the aerodynamic performance of airfoils in the Wells turbine. They found that passive control raised the moment coefficient on the airfoil by nearly 40%. Mdouki (2017) investigated the passive control of a separated laminar wake flow on an S809 wind turbine airfoil using slots. The system was modeled numerically using the Reynolds-averaged Navier–Stokes (RANS) method in ANSYS Fluent. They demonstrated that slots could not necessarily lead to a sentential increase in the lift coefficient and a substantial reduction in the drag coefficient.
Beyhaghi and Amano (2017) studied the aerodynamic performance improvement of cambered airfoils with deep narrow slots on the leading edge. They investigated whether the drag force could be diminished by applying narrow slots near the leading edge of the NACAS4412 airfoil. It was demonstrated that such slots would help improve blade aerodynamic performance.
Xie et al. (2013) numerically and experimentally evaluated flow separation on slotted S809 airfoils using CFD based on the k–ω SST turbulence model. The lift and drag coefficients were calculated at AOAs of 0°, 10°, 15°, and 20°. It was found that the separation zone enlarged as the AOA increased, being maximized at an AOA of 20°. A rise in the AOA at 15° and 20° increased the lift coefficient and reduced the drag coefficient.
Moshfeghi et al. (2017) studied the influence of slots on the flow separation reduction of wind turbine airfoils via the DES turbulence model. They showed that slots with a width as large as 2% and 4% of the chord line length could maximize the lift. For these two slotted airfoils, the average rise in the lift coefficient was reported to be 68.5% and 55.8% at AOAs of 17°, 20°.
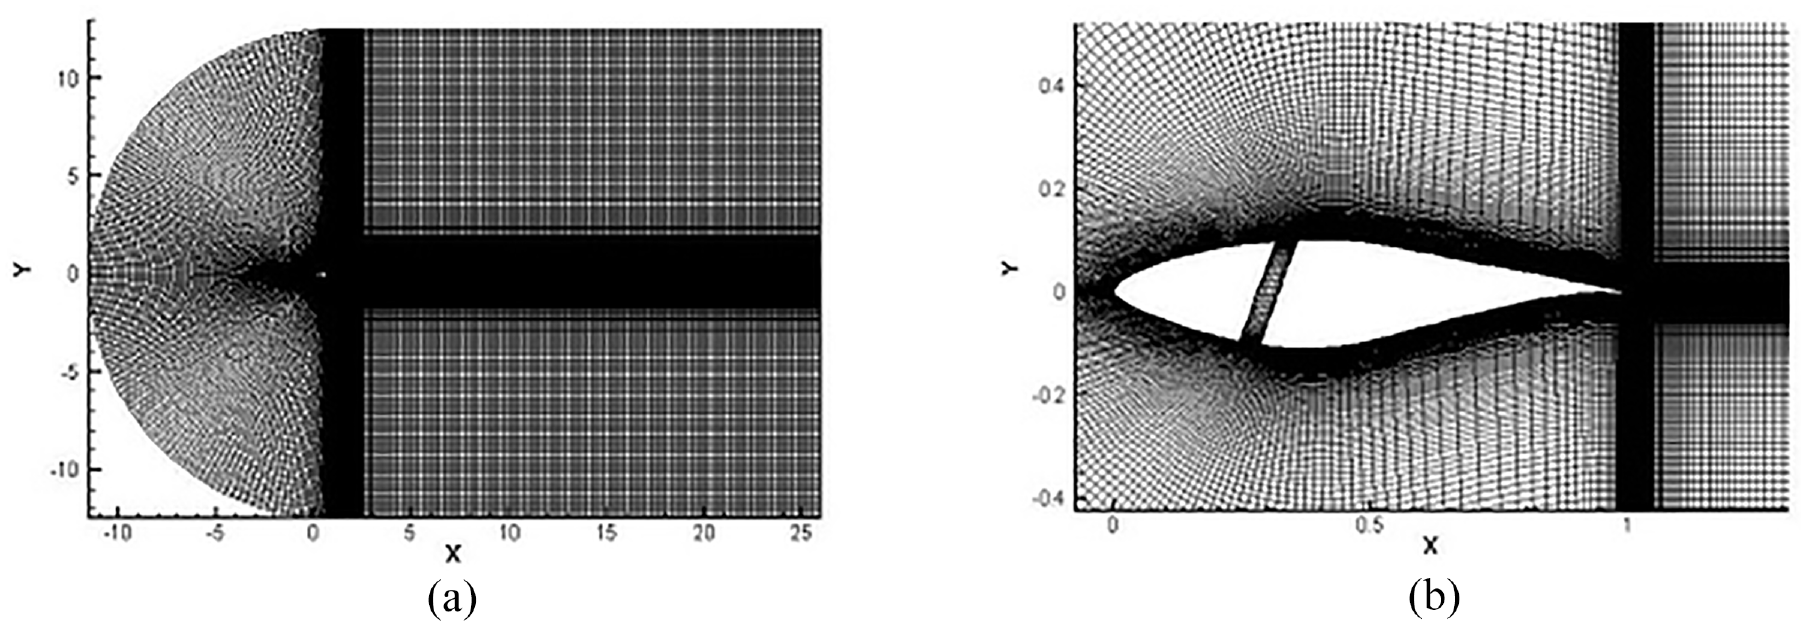
The present study applied a slot on the blade section of an S809 airfoil for flow control. The flow pattern obtained from numerical simulations was used to explain the aerodynamic behavior of the blades under slot control. Figure 1 depicts the computational domain for both slotted and non-slotted S809 airfoils.
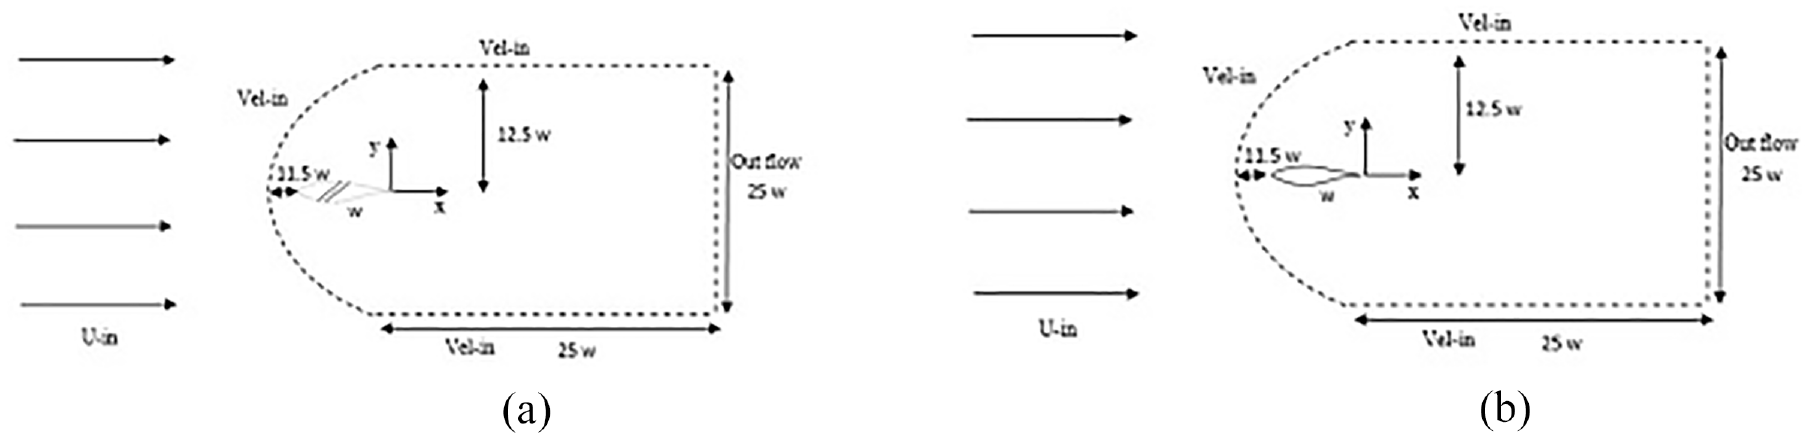
The computational domain for both slotted and non-slotted S809 airfoils: (a) slotted airfoil, and (b) non-slotted airfoil.
The upstream distance of the blade (i.e. the distance between the inlet boundary and the leading edge) and the downstream distance (i.e. the distance between the trailing edge and outlet boundary) were set to 11.5 and 25 W, respectively (W denotes the blade length, with a unit blade width; Belamadi et al., 2016). The slot width was set to 0.04 W, and the slot angles included Ψ = 20°, 45°, and 70° (Belamadi et al., 2016). In the present research, all parameters are dimensionless with W (airfoil chord length).
The Reynolds and Strouhal numbers are major determinants of fluid behavior and the average flow values. The forces on the blades play a key role in flow behavior and vortex shedding behind the blades. Figure 2 shows the position of the blade under the free flow, velocity components, and aerodynamic forces on the blade.
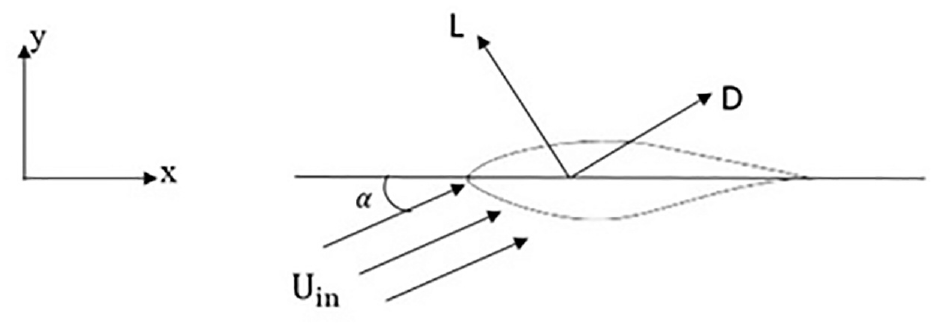
The position of the blade under the free flow.
Here, U and V denote the horizontal velocity component (in the x-direction) and vertical velocity component (in the y-direction), respectively, while α represents the AOA, that is, the angle between the blade axis and free flow.
Materials and methods
Governing equations
Governing equations of laminar flow
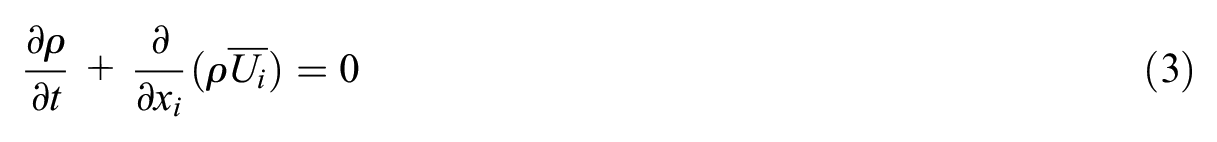
This study modeled the system at a Reynolds number of 106 under a turbulent regime. However, the governing equations of laminar and turbulent regimes are provided here. The continuity and Navier-Stokes equations of unsteady laminar flows in the Cartesian coordinate system are written as equations (1) and (2).


For two-dimensional systems, i, j = 1 and 2, where 1 and 2 represent horizontal and vertical directions (x- and y-axis), respectively.
Governing equations of turbulent flow
For turbulent flows, the instantaneous values are decomposed into average and oscillatory components. Reynolds averaging is applied to the continuity and momentum equations. The Reynolds-averaged continuity and momentum equations for unsteady turbulent flows in the Cartesian coordinate system are given by equations (3) and (4).

Reynolds averaging leads to unknown terms (
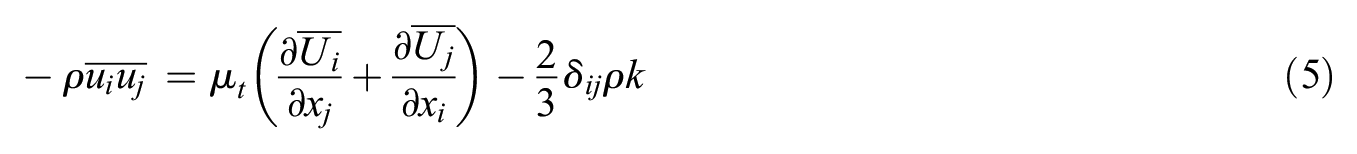

Where
Boundary conditions
To solve the flow domain, the governing equations (i.e. the continuity and Naiver-Stokers equations) were discretized in a two-dimensional form with constant properties in the computational domain using finite volume methode (FVM). Then, the numerical simulations were carried out for an unsteady, turbulent flow. The boundary conditions included the input velocity and outflow, with the solid boundaries (top and bottom airfoil surfaces and slot surfaces) being assumed as walls.
Blade modeling using the k–ω SST model and validation
To validate the model, the results obtained for the S809 airfoil at Re = 106 and AOA = 0°, 10°, 16°, 18°, and 20° were compared to earlier numerical and experimental reports based on the k–ω SST model for unsteady flows (Gupta et al., 2006; Karbasian et al., 2016; Moshfeghi et al., 2017; Pellegrino and Meskell, 2013). The aerodynamic characteristics of wind turbine airfoils with a steady flow regime were studied in earlier works (Belamadi et al., 2016). Since the flow was unsteady at Re = 106, the steady flow analysis led to a maximum error of 10%, as shown in Figure 3.

The lift and drag coefficient for non-slotted airfoil under different AOA: (a) drag coefficient and (b) lift coefficient.
Additionally, variations in results compared to other numerical simulations are attributed to the use of different turbulence models (Gupta et al., 2006). The best agreement in results occurs when the same turbulence model is used. For example, the difference with reference (Pellegrino and Meskell, 2013) is less than 5% in all parameters. Comparing results with only experimental work indicated a maximum error of 8% and 5% in the lift and drag coefficients at an AOA of 20° and 18°, respectively (Somers, 1989). This acceptable level of difference between experimental and numerical simulations based on unsteady Reynolds-averaged Navier-Stokes (URANS) results has been reported in previous numerical works (Malekzadeh et al., 2017; Nazari et al., 2009; Sohankar and Etminan, 2009). The numerical model was found to be in good agreement with the experimental and numerical results of Somers, as shown in Figure 3.
Mesh size and time step
The analysis of the mesh size is crucial in numerical works. The mesh size near the solid boundaries is a determinant in URANS turbulence models in which boundary conditions are applied to the solid boundaries without wall functions. Numerical models should be independent of the grid. The numerical grid and the number of cells would have strong effects on the outputs and computational time. To evaluate grid independence and time step contributions, a total of six grids were implemented on the slotted-section blade domain, as shown in Table 1. The flow on the slotted blade was evaluated at R = 106.
Details related to investigated meshes.
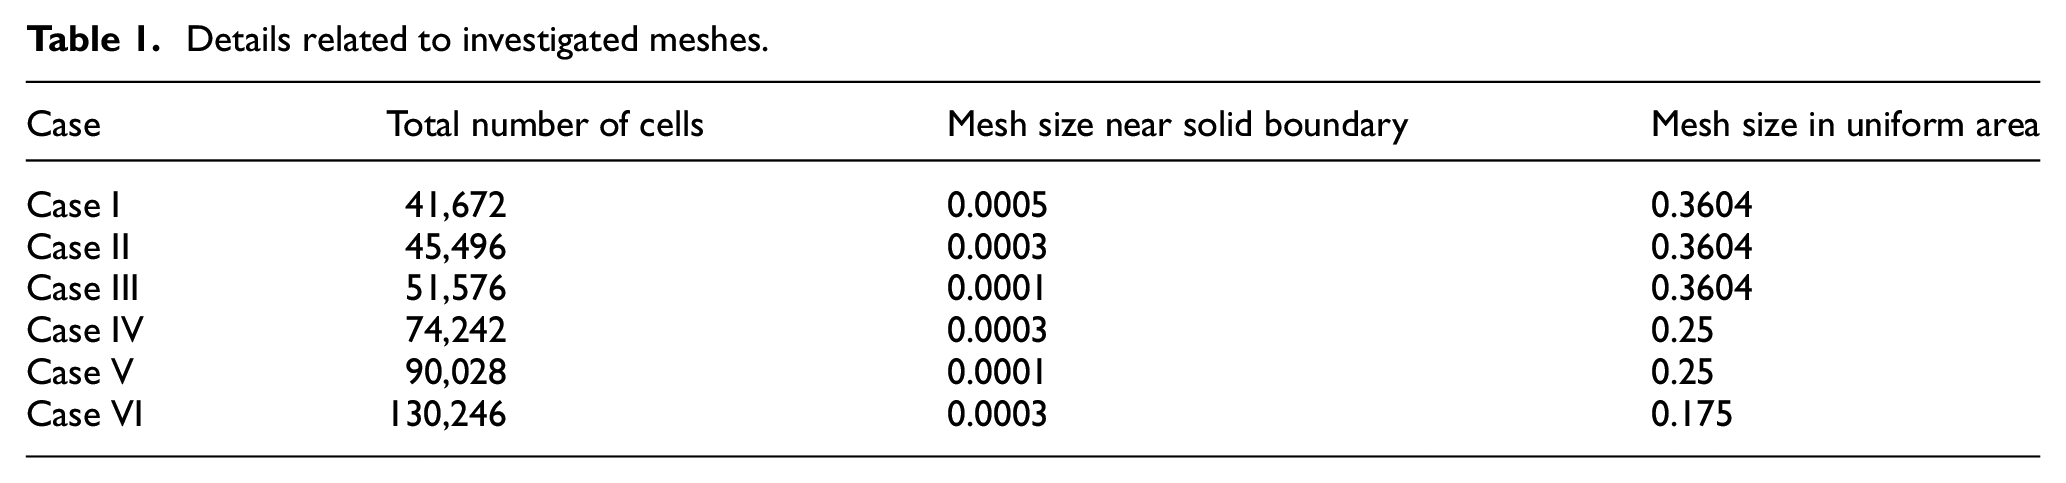
Based on the previous experiences and researches of the first author of this paper, in the flows with the phenomenon of separation and vortex shedding, the turbulent kinetic energy is greatly increased, and flow simulation for such phenomena requires special attention (Malekzadeh et al., 2017; Nazari et al., 2009). For this purpose, the study of the grid and the time step has been carried out at AOA 18, which includes the phenomenon of stall and flow separation. According to previous works, such a grid is fully responsible for the rest of the flow patterns that are less complex (Malekzadeh et al., 2018; Nazari et al., 2009).
Figure 4(a) and (b) illustrate the proposed numerical grid.
Mesh details: (a) mesh details in the uniform region and (b) mesh details in the non-uniform region.
According to Tables 1 and 2, the mesh size was reduced from 0.0005 to 0.0003 and 0.0001 in two steps, while the mesh size in the uniform area was fixed to 0.3604 (Case I, Case II, and Case III). The lift and drag coefficients and Strouhal number were extracted and compared at dt = 0.0005 and dt = 0.0025. The optimal mesh size near the solid boundaries was found to be 0.0003. It should be noted that in this optimal mesh size (0.0003), most cells near the solid boundaries were in the vicinity of y+ < 5, and all cells were positioned at y+ < 10. Also, in this optimal mesh size, it has been tried to position a node in the laminar sublayer near the solid boundary, as shown in Figure 5. Once the mesh size near the solid boundaries was 0.0001, all the cells were positioned in the laminar sublayer. However, the computation speed became excessively high, leading to numerical instability in the outputs since the cells were excessively small. A boundary layer consists of three zones: laminar zone (y+ < 5), logarithmic (overlapping) zone (5 < y+ < 30), and external zone (y+ > 30). For low-Reynolds turbulence models that simulate wall boundary conditions directly without a wall function, it is required that the first cell near the solid boundary be in the laminar sublayer. As shown in Figure 5, most cells were positioned below y+ < 5 at a mesh size of 0.0003 near the solid boundary.
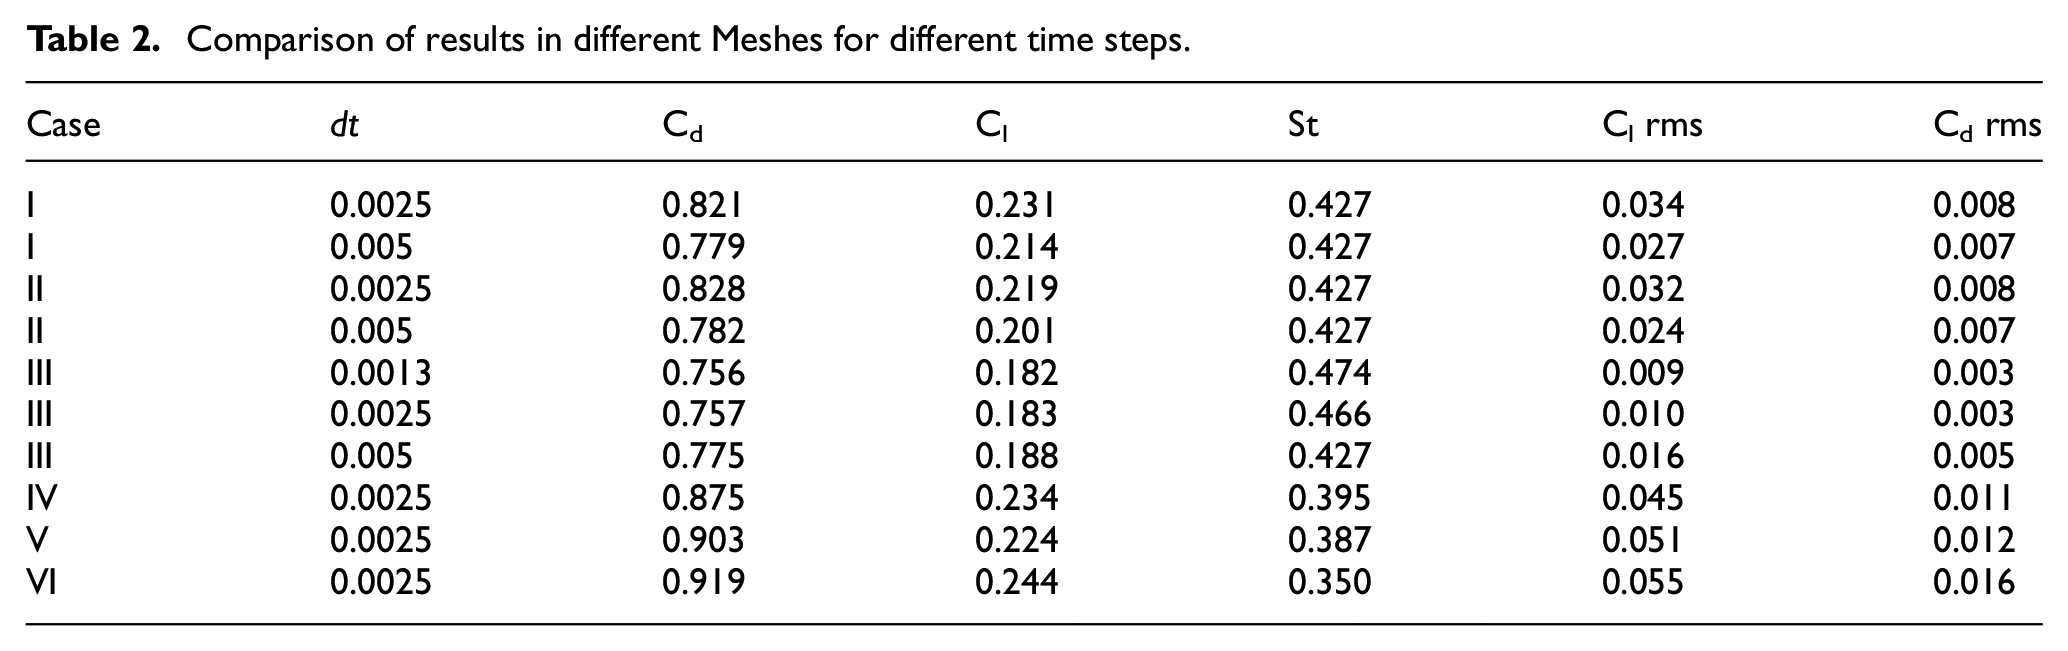
Comparison of results in different Meshes for different time steps.

y+ of the first node around the airfoil in different meshes based on the mesh size near the solid boundary.
A comparison of Cases I and II showed that the lift coefficient, drag coefficient, and Strouhal number changed by 5%, 6%, and 7% at dt = 0.0025, respectively. The root-mean-square (RMS) of the oscillating force factor was 40%. The mesh size adjacent to the solid boundary in Case V was the same as that in Case III. The mesh size in the uniform zone was diminished by 30%, leading to 74% more control volumes. A comparison of Cases III and V revealed that the lift and drag coefficients increased by 19% and 22% at dt = 0.00025, respectively. The Strouhal number rose by 16%, with the oscillating force factor RMS being 25%. It was found that higher performance could be achieved using smaller meshes.
At dt = 0.0025, the grid size in Case V is reduced by 50% (from 0.0003 to 0.00015) compared to Case IV near the solid boundary, while the grid size in the far region is unchanged. Under these conditions, the change in the amount of Cd, Cl, and St is 3.2%, 4.3%, and 2%, respectively. Also, the change in fluctuation parameters was observed below 10%, which is acceptable. It should be noted that all URANS models do not perform well in predicting the RMS coefficients of lift and drag forces (Nazari et al., 2009). For this reason, fluctuating parameters are rarely checked in many references for grid analysis.
A 30% reduction in the size of the cells in the uniform region in Case VI compared to Case IV and a 75% increase in the number of cells in Case IV, showed that in the time step dt = 0.0025, the change in all parameters except RMS of lift and drag force coefficients are below 4%. Therefore, type IV grid is selected as the most appropriate grid for all simulations in this research.
To check the time step, three time-steps of 0.005, 0.0025, and 0.0013 have been investigated for the type III grid. Reducing the time step from 0.0025 to 0.0013 in the type III grid has caused less than 1% change in all parameters, see Tables 1 and 2. Therefore, the time step of 0.0025 has been used in this research.
Results
The simulations were carried out for the non-slotted and slotted airfoils with slot angles of Ψ = 20°, 45°, and 70° at AOAs of 0°, 10°, 16°, 18°, 20°, and 22°.
Flow pattern on the non-slotted airfoil
Figure 6(a) and (b) plot the instantaneous and average streamlines around the non-slotted airfoil at AOAs of 0°, 10°, 16°, 18°, 20°, and 22°. At an AOA of 0°, the flow leaves the trailing edge without separation. A comparison of instantaneous and average streamlines implies a steady flow pattern (Figure 6, AOA = 0°). As the AOA increased to 10°, the streamlines at the front atop the airfoil near the trailing edge separated, forming a vortex in the vicinity of the trailing edge (Figure 6, AOA = 10°). A further increase in the angle of attack causes the flow separation point on the airfoil to occur earlier. Therefore, at larger angles of attack, a larger quasi-steady vortex region is seen on the upper surface of the airfoil. Looking closely at the instantaneous streamlines, a very weak vortex shedding can be seen to the right of the downstream separation region.
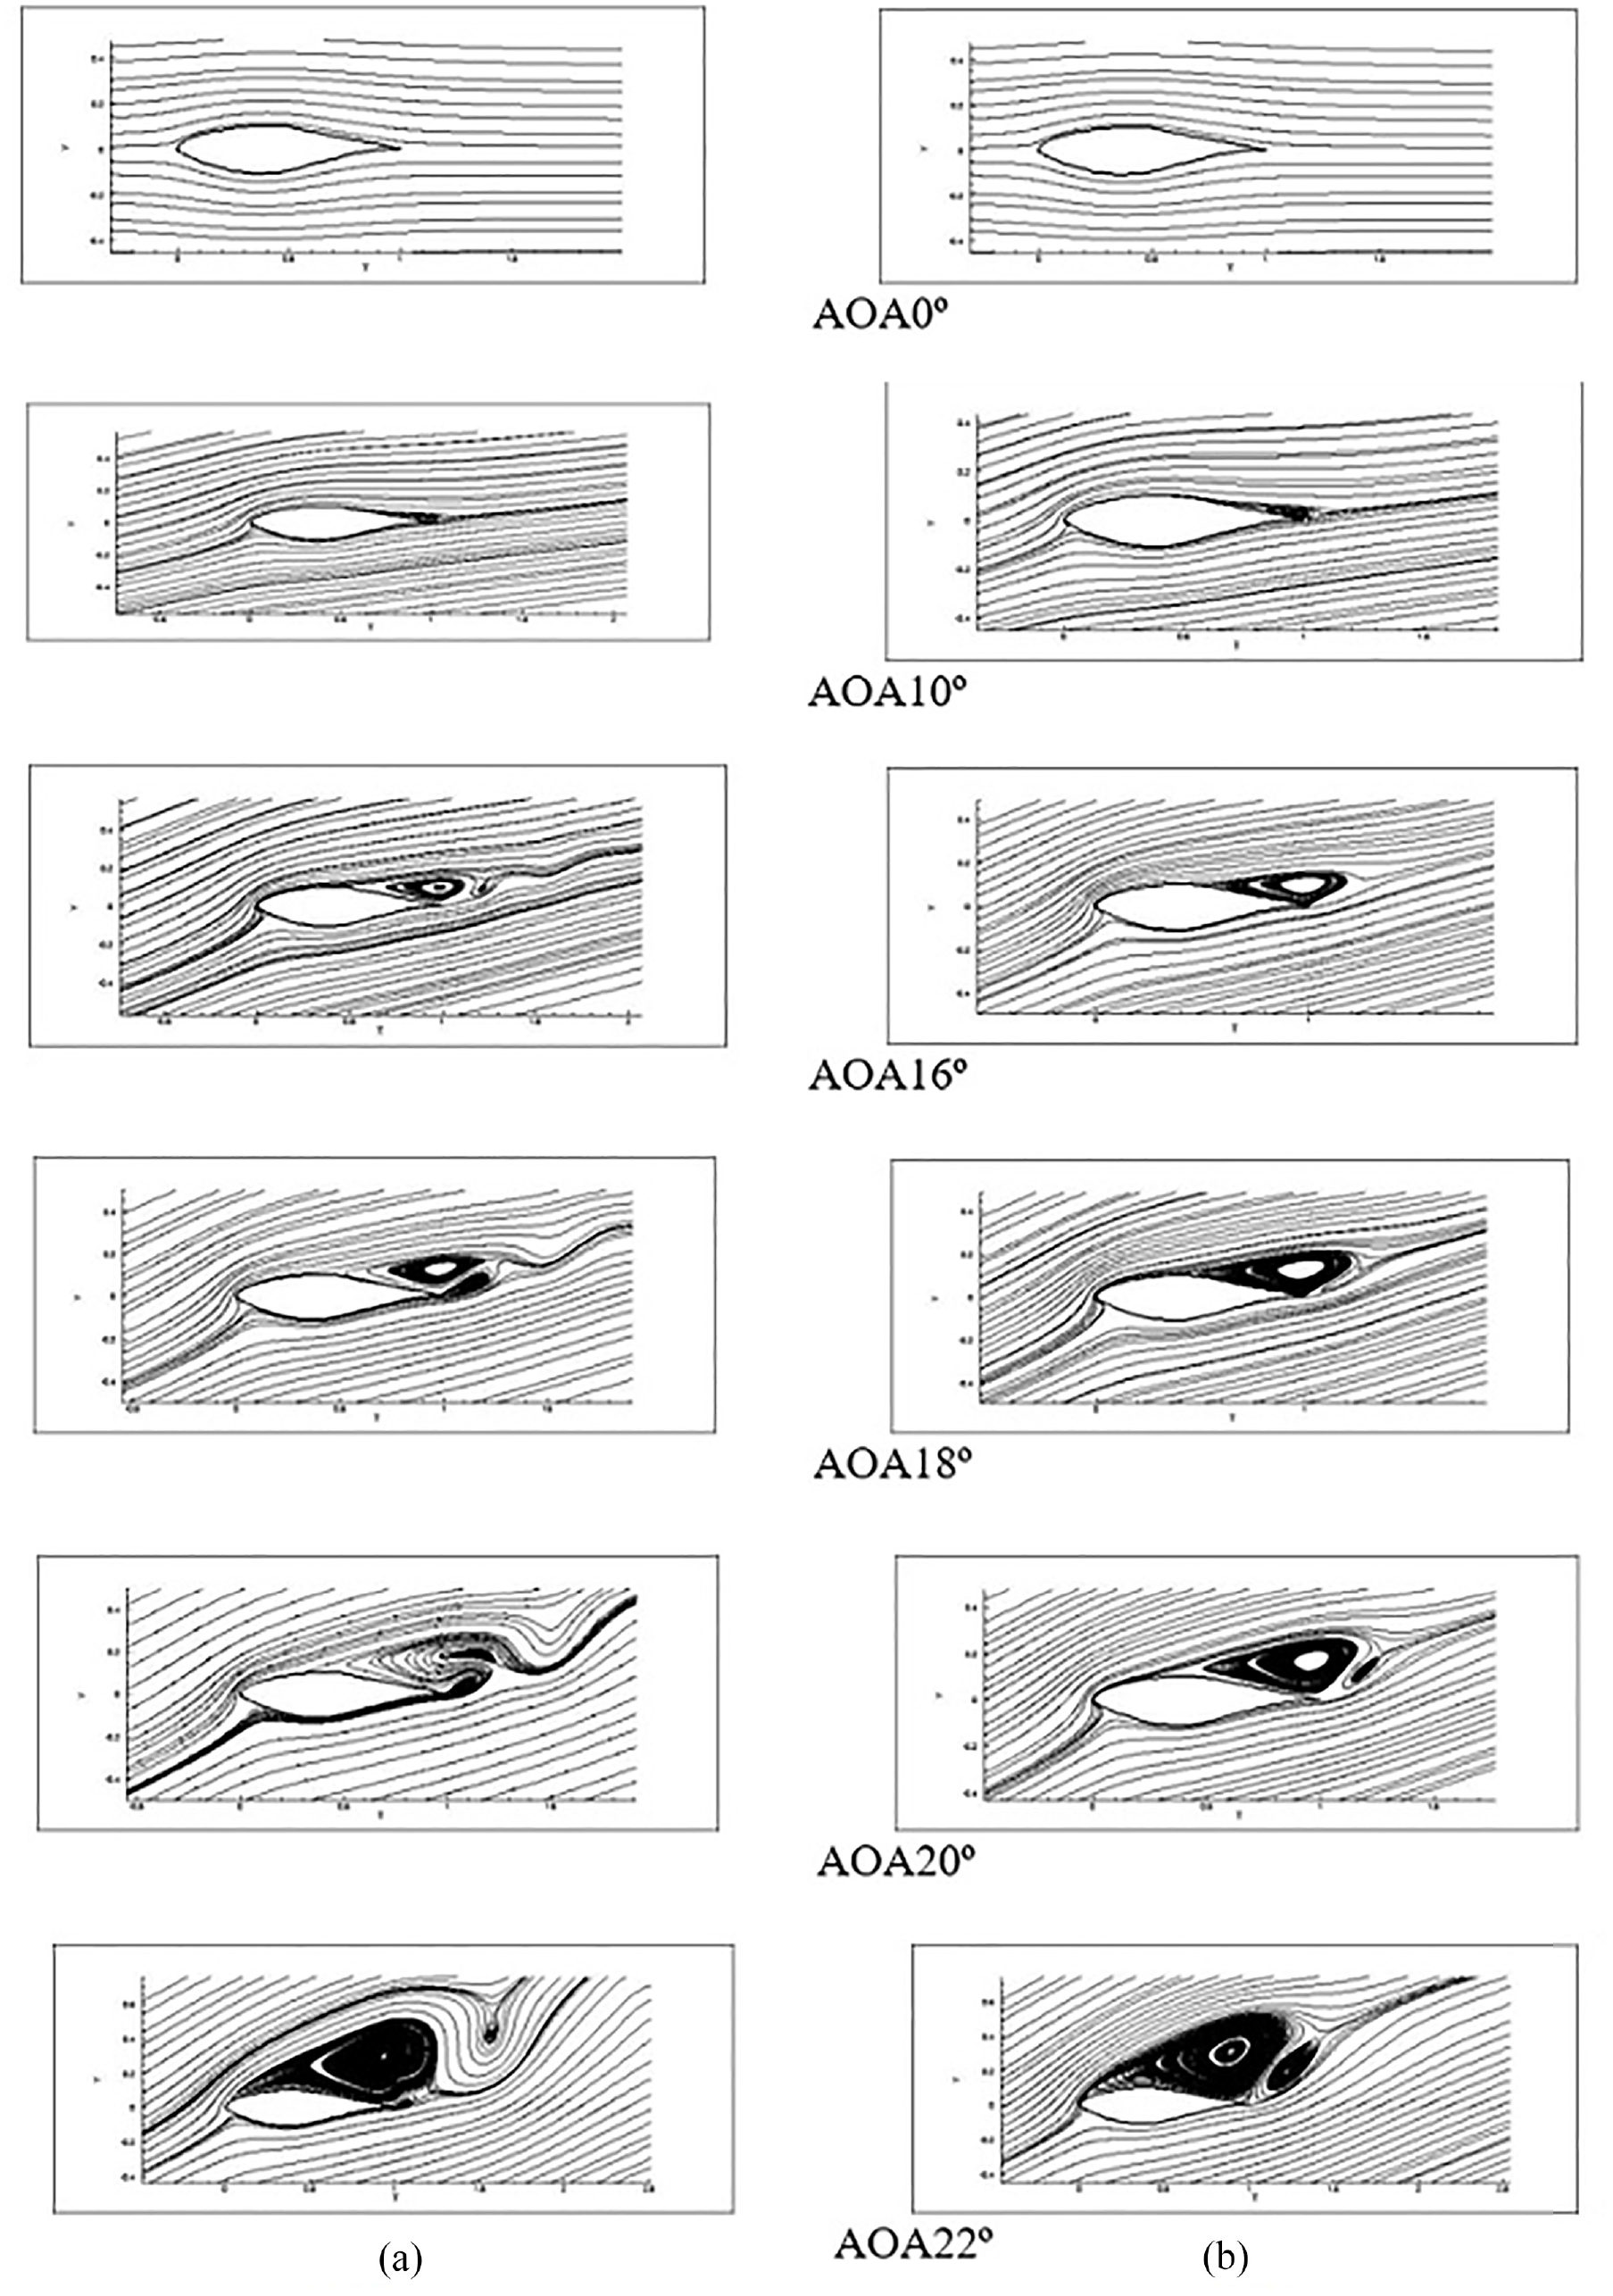
(a) The instantaneous streamlines around the non-slotted airfoil at AOAs of 0°, 10°, 16°, 18°, 20°, and 22° and (b) the average streamlines around the non-slotted airfoil at AOAs of 0°, 10°, 16°, 18°, 20°, and 22°.
Figure 7 depicts the instantaneous vorticity contours on the non-slotted airfoil. Vortex shedding and von Karman vortex path were observed at an AOA of 16°. The flow separation location on the top surface of the airfoil shifted toward the upstream as the AOA increased. The separation began atop the leading edge at an AOA of 22° (Figure 6, AOA = 18°, 20°, and 22°).

Instantaneous vorticity contours for a non-slotted airfoil under different AOA.
Based on the vorticity contours at high AOAs, a rise in the AOA enlarged the vortices, leading to greater rotations (Figure 7).
Flow pattern on the slotted airfoil
For the airfoil without a slot, a strong vortex shedding develops at the angle of attack AOA = 18, which is the onset of the stall phenomenon on the non-slotted airfoil. To control this phenomenon, a slot is created on the airfoil as follows. Through the streamlines on the non-slotted airfoil, a line was drawn from the stagnation zone to the vorticity center. This line intersected the main airfoil axis at x = 0.265. The main slot axis is line x = 0.265, and Ψ is the angle between the slot axis and y-axis. The slot width was 0.04 of the blade length, as shown in Figure 8. According to the created slot, four flow patterns were seen for the airfoil with a slot as shown in Figure 8.

Average and instantaneous streamlines at different AOAs and different airfoil slot angles.
The first flow pattern at an AOA of 0° was observed for all the slotted airfoils at slot angles of 20°, 45°, and 70°. The streamlines were attached to the leading edge and left the trailing edge without separation. This was a steady flow. The second flow pattern was observed at AOA = 10°, 16°, and 18° for Ψ = 20°, 45°, and 70°. The streamlines were attached to the leading edge. They separated at the edge of the sharp end of the slot due to the difference between the slot flow and upstream flow, forming a quasi-steady vortex on the top surface of the airfoil without separation. Furthermore, another vortex formed on the right side of the trailing edge surface with periodic shedding. The third flow pattern was captured at an AOA of 20° and slot angles of 20°, 45°, and 70°. The streamlines separated from the leading edge and formed a steady vortex on the top surface upstream of the airfoil, as shown in Figure 8. The fourth flow pattern was identified at an AOA of 22° and slot angles of 20°, 45°, and 70°. The streamlines separated above the leading edge atop the slot edge, forming large and small vortexes on the upper surface of the airfoil. Figure 9 plots the average pressure contours on instantaneous streamlines and instantaneous vorticity contours at ΨA70° and different AOAs. A vortex is a low-pressure area. The pressure is lower when the vortex is larger. An increase in the AOA changed the flow pattern, reducing the pressure of the vortex area. As the angle of attack increases from AOA = 0 to AoA = 22, different flow patterns are formed on the airfoil and the flow separation point and the location and size of the vortices are changed. As can be seen in Figure 8, with the increase of the angle of attack to 22, the place of flow separation is closer to leading edge of the airfoil and the size of the formed vortices becomes larger. This can be seen in the average pressure contours in Figure 9. As the angle of attack increases, the vortices formed become larger and the average pressure decreases near the leading edge of the airfoil.

The average pressure contours on instantaneous streamlines and instantaneous vorticity contours at ΨA70° and different AOAs.
Aerodynamic forces
Figure 10(a) plots the average lift coefficient at different AOAs and slot angles for the non-slotted airfoil. The stall occurred at AOA = 20° for the non-slotted airfoil. A rise in the AOA from 20° to 22° reduced the lift coefficient, changing the flow pattern from pattern 3 into pattern 4. The lift coefficient dramatically changed as the AOA increased from 0° to 10°. This is explained by the change in the flow pattern from pattern 3 into pattern 4 (steady into unsteady flow).

The average lift and drag coefficients at different AOAs and slot angles for the non-slotted airfoil: (a) the average lift coefficient and (b) the average drag coefficient.
For the slotted airfoil with a slot angle of 20°, the stall occurred at an AOA of 16°. A rise in the AOA from 0° to 10° altered the lift coefficient due to the change in the flow pattern from pattern 1 into pattern 2. The stall at ΨA45° occurred at AOA = 20°. An increase in the AOA from 20° to 22° reduced the lift coefficient due to the change in the flow pattern from pattern 3 into pattern 4. The rise in the AOA from 0° to 10° changed the lift coefficient due to the change in the flow pattern from 1 into 2.
The stall for the airfoil with a slot angle of 70° occurred at an AOA of 20°. An increase in the AOA from 0° to 10° changed the lift coefficient due to the flow pattern change from 1 into 2. An increase in the AOA from 20° to 22° diminished the lift coefficient due to a flow pattern change from 3 into 4. The average lift coefficient was larger at a slot angle of 70° and AOAs of 18° and 20° than the non-slotted airfoil and slotted airfoils with other slot angles under different AOAs. The average lift coefficient of the airfoil with a slot angle of 70° at AOAs of 18° and 20° was 7.35% and 8.64% greater than that of the non-slotted airfoil at the same AOAs.
As can be seen in Figure 10(a), for the airfoil without a slot, the stall phenomenon occurs very sharply (Sharp stall behavior), while with the flow control by the slot, a softer behavior (soft stall) is seen in the stall phenomena (AOA20, ψ45). As the slot angle increases, a sharper behavior can be seen in the stall phenomenon (70ψ). Such control on the stall phenomenon by the slot angle on the airfoil can have different applications on the airfoil in different turbines.
Figure 10(b) plots the average drag coefficient at different AOAs for the non-slotted airfoil and slotted airfoil with different slot angles. The drag coefficient increased in both airfoils as the AOA increased, regardless of the slot angle. At a slot angle of 20°, a rise in the AOA from 18° to 20° substantially changed the drag coefficient due to the flow pattern change from 2 into 3. The airfoils with slot angles of 45° and 70° experienced the stall at an AOA of 20°, and a rise in the AOA to 22° dramatically raised the average drag coefficient due to the change in the flow pattern from pattern 3 into pattern 4. For the slotted airfoil with a slot angle of 70, the drag coefficient was larger than that in the non-slotted airfoil at AOAs of up to 16°. At AOAs above 16°, however, the average drag coefficient of the non-slotted airfoil was smaller than that of the slotted one. This suggests that the slot with an angle of ΨA = 70° led to a 0.09%, 63.72%, and 33.44% smaller drag coefficient than the non-slotted airfoil at AOAs of 18°, 20°, and 22°, respectively. The stall in the slotted airfoil with a slot angle of 70° occurred at an AOA of 20°. It reduced the average drag coefficient at AOAs of 20° and 22°.
Figure 11 plots the Cl-Cd ratio at different AOAs for the non-slotted airfoil and slotted airfoil with different slot angles. The aerodynamic performance of an airfoil improves when the Cl-Cd ratio rises. At an AOA of 10°, the non-slotted airfoil had a larger Cl-Cd ratio. However, the angle at which the wind flow reached the blade could not be controlled. For the slotted airfoils, the Cl-Cd ratio increased as the AOA increased until the stall occurred, with a larger Cl-Cd ratio at larger slot angles. However, the Cl-Cd ratio decreased upon the stall; it was smaller at larger slot angles due to the change in the flow pattern. The pre- and post-stall Cl-Cd ratio of the slotted airfoil with a slot angle of 70° (stall at AOA = 20°) was 31.49%, 79.22%, and 29.66% larger than that of the non-slotted airfoil at AOAs of 18°, 20°, and 22°, respectively. It was observed that the slot with an angle of 70° improved the aerodynamic performance of the airfoil at high AOA angles (i.e. 18°, 20°, and 22°) before and after the stall.
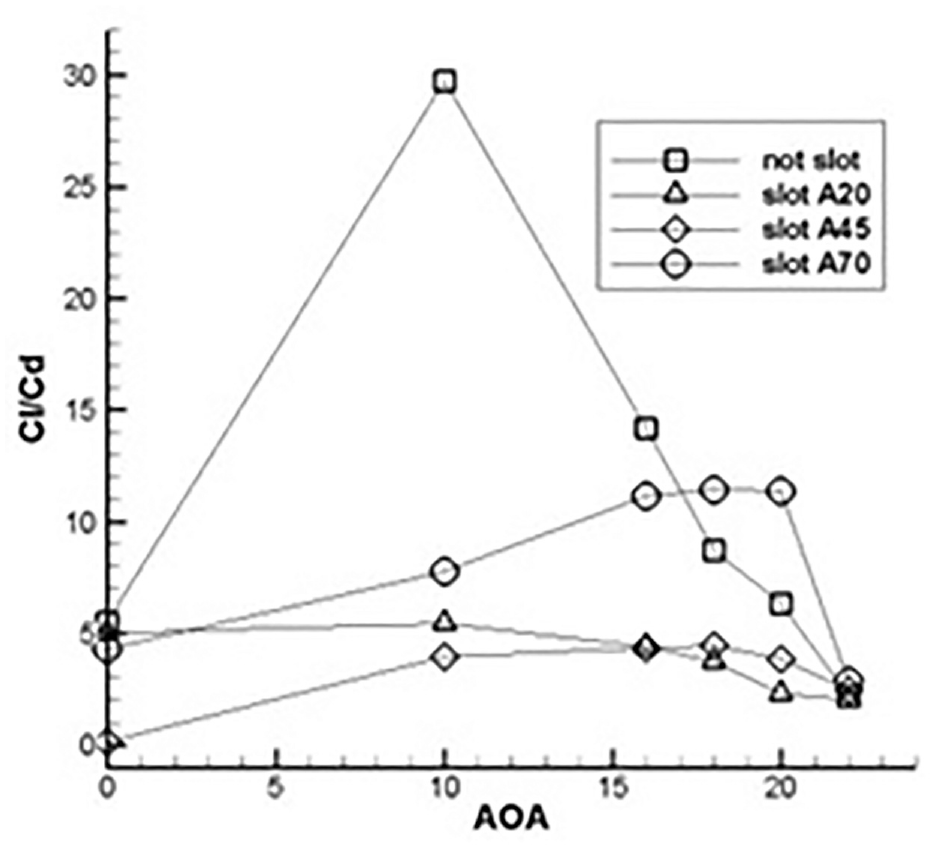
The Cl-Cd ratio at different AOAs for the non-slotted airfoil and slotted airfoil with different slot angles.
Figure 12 depicts the average pressure coefficient for the slotted airfoil at a slot angle of 70° for different AOAs. As can be seen, the average pressure coefficient varied from −10 to 1. To improve the clarity of the diagram, the pressure coefficient was plotted in the range of [−6, 1]. The solid and dashed lines represent the average pressure coefficient on the top and bottom surfaces of the airfoil. As can be seen, the pressure coefficient was almost the same on the bottom surface of the leading edge, on the bottom surface, and on top of the trailing edge (blue, green, and black lines, respectively). The stall at an AOA of 20°–22° arose from the reduced pressure coefficient on the top surface of the leading edge.

The average pressure coefficient for the slotted airfoil at a slot angle of 70° for different AOAs.
Oscillating forces
According to Figure 13(a) and (b), the oscillating forces were zero on the non-slotted airfoil at AOAs of 0° and 10° and on the slotted airfoil at an AOA of 0° due to the steady flow pattern. For the non-slotted airfoil, an increase in the AOA from 18° to 20° raised the lift and drag coefficients due to the change in the flow pattern from pattern 2 into 3. The oscillating lift and drag coefficients dramatically increased as the AOA increased from 20° to 22° due to the change from flow pattern 3 into flow pattern 4.

The coefficients of oscillating forces in different AOAs and on the different slot angles and non-slotted airfoil: (a) the coefficients of oscillating lift forces and (b) the coefficients of oscillating drag forces.
The oscillating lift and drag coefficients substantially rose as the AOA increased from 10° to 16° on the airfoil with slot angles of 20° and 45°. As the angle of attack increases, flow instabilities increase and larger vorticities are formed behind the airfoil (Figure 14). By increasing the rotational particles of the fluid inside the flow, the turbulence inside the flow increase and strong vortex shedding with large vortices develops behind airfoil, see Figure 14.

Instantaneous vorticity contours for slotted airfoils under different AOA.
Due to the change from flow pattern 3 into flow pattern 4, the oscillating drag and lift coefficients underwent a dramatic decrease as the AOA rose from 20° to 22° at slot angles of 20° and 45°.
The oscillating lift and drag coefficients were found to be lower on the non-slot airfoil than on the slotted one at low AOAs. However, at a slot angle of 70° and AOAs of 18° and 20° (improved aerodynamic performance), the oscillating lift and drag coefficients decreased. The oscillating lift coefficient at a slot angle of 70° declined by 88.18% and 99% at AOAs of 20° and 22°, respectively. Furthermore, the oscillating drag coefficient reduced by 77.53% and 86.48% at AOAs of 20° and 22°, respectively.
Strouhal number
Figure 15 plots the Strouhal number for the non-slotted airfoil and the slotted airfoil with slot angles of 20°, 45°, and 70° for different AOAs. Based on equation (2), the Strouhal number is directly related to the vortex shedding frequency (inversely related to the vortex shedding period). A smaller Strouhal number implies a larger vortex shedding period, with a longer time required for vortex formation (smaller vortex frequency); hence, vorticity forms at a lower rate.
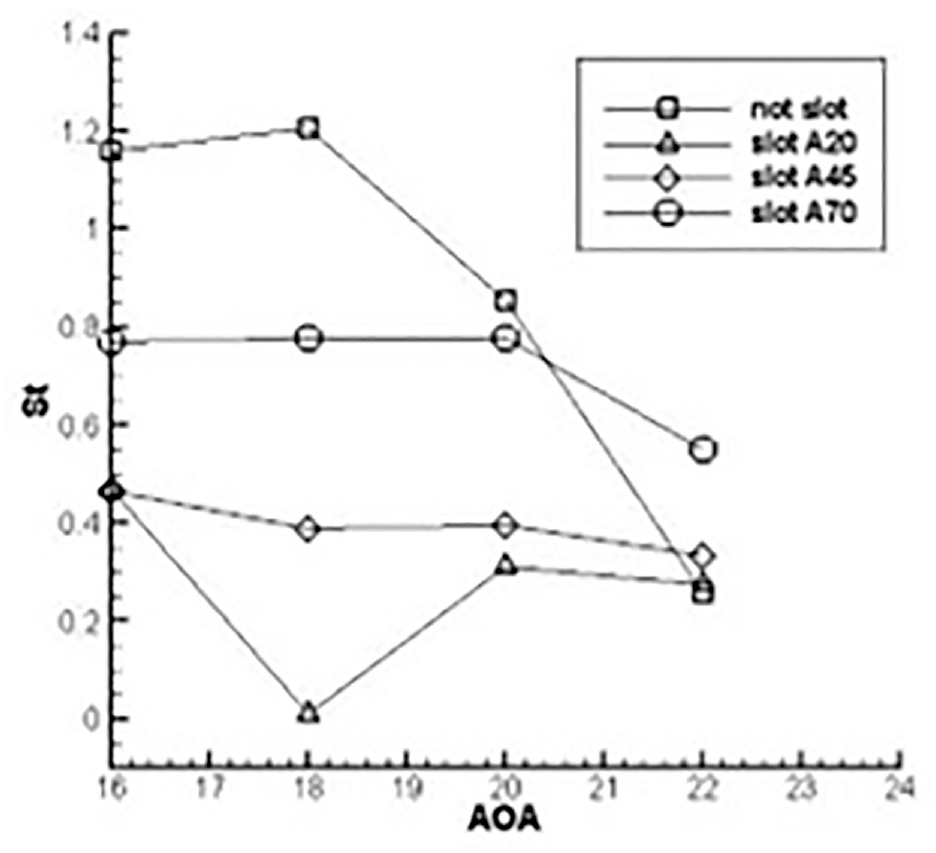
The Strouhal number for the non-slotted airfoil and the slotted airfoil with slot angles of 20°, 45°, and 70° for different AOAs.
As can be seen in Figure 15, the Stall phenomenon causes a sharp decrease in the Strouhal number in all airfoils. This means that the onset of stall leads the vortices behind the airfoil forms and shed with a slower rate. Of course, as mentioned before, this significant reduction in the Strouhal number is more visible at higher slot angles in which the sharp stall phenomena occurs.
Discussion and conclusion
This paper explored the effects of slots in the wind turbine airfoil section on the reduction of fluid loads on the blade in turbulent flow regimes using the k–ω SST turbulence model. To validate the k–ω SST model, the results obtained for the S809 airfoil were compared to earlier numerical and experimental reports. Then, the flow on the slotted airfoil at Re = 106 was studied. The numerical simulations were performed for an unsteady turbulent flow regime. The maximum lift coefficient difference for the non-slotted airfoil was observed at an AOA of 19°, which arose from the stall. The numerical model of the non-slotted airfoil was found to be in good agreement with earlier experimental results (Shehata et al., 2017). The streamlines on the non-slotted airfoil underwent no separation at an AOA of 0°, and a rise in the AOA resulted in flow separation. Vortex shedding and von Karman vorticity were observed at an AOA of 16°. The vorticity contours of the non-slotted airfoil at high AOAs indicated that the vortex size increased as the AOA increased, leading to a greater rotation.
The pressure of the vortex area is lower when the vortex is larger. A rise in the AOA and the change in the flow pattern reduced the pressure of the vortex area. The stall on the non-slotted airfoil occurred at an AOA of 20°. For airfoils with slot angles of 20°, 45°, and 70°, the stall occurred at an AOA of 16°, 20°, and 20°, respectively. The airfoil with a slot angle of 70° and AOAs of 18° and 20° had the largest average lift coefficients.
The stall on the airfoils with a slot angle of 70° and AOAs of 20° and 22° arose from the pressure reduction on the upper surface of the leading edge. An increase in the AOA raised the drag coefficient in both slotted and non-slotted airfoils due to an unsteady flow and the flow pattern change.
The drag coefficient of the airfoil with a slot angle of 70° was larger than that of the non-slotted airfoil at AOAs of up to 16°; however, at AOAs above 16°, the non-slotted airfoil had a greater drag coefficient than the slotted one. This suggests that the slot with an angle of 70° would lead to smaller average drag coefficients on the slotted airfoil than those on the non-slotted one at AOAs of 18°, 20°, and 22°. At an AOA of 10°, the non-slot airfoil had the largest Cl-Cd ratio; however, the angle at which the wind flow reached the blade could not be controlled. The airfoil with a slot angle of 70°, which experienced the stall at an AOA of 20°, had larger pre- and post-stall Cl-Cd ratios than the non-slotted airfoil at AOAs of 18°, 20°, and 22°. The airfoil slot with an angle of 70° improved aerodynamic performance before and after the stall. The oscillating lift and drag coefficients on the non-slotted airfoil were lower than on the slotted one at small AOAs. However, the oscillating lift and drag coefficients of the airfoil with a slot angle of 70° with improved aerodynamic performance were observed to have declined at AOAs of 20° and 22°.
Footnotes
Declaration of conflicting interests
The author(s) declared no potential conflicts of interest with respect to the research, authorship, and/or publication of this article.
Funding
The author(s) received no financial support for the research, authorship, and/or publication of this article.