
Abstract
The impact of an innovative trailing-edge flap (blended TEF) on the aerodynamic performance of small-scale horizontal-axis wind turbines is numerically and experimentally studied. The blended TEF is characterized by both the pressure surface of the hinged TEF and the suction surface of the morphed TEF. The wind speed, rotational speed, and power coefficient of four wind turbines were measured in a wind tunnel. The results show that the wind turbines with the morphed and hinged blades were respectively the easiest and hardest to start, and respectively had the lowest and highest output axial thrust. Moreover, the wind turbines with the hinged and blended blades were found to have the lowest and highest output power, respectively. Compared with the original wind turbine, the wind turbine with the blended blade respectively resulted in additional power and thrust increases of 130.95% and 113.49% at the wind speed of 1.29 m/s.
Keywords
Introduction
Wind energy is a clean, renewable energy with broad development prospects (Kozlova and Overland, 2022). As the main devices used to capture wind energy, wind turbines, especially their power output, have attracted substantial attention from researchers (Giguere and Selig, 1997; Leung et al., 2010; Simic et al., 2013; Wright and Wood, 2004; World Health Organization, 2018).
Trailing-edge flaps (TEFs) can alter the camber of the airfoil, which increases the aerodynamic performance of the wind turbine (Abbott and Von Doenhoff, 2012; Spera, 1998). Furthermore, they can alleviate the loads on the wind turbine structure (Barlas and Van Kuik, 2007; Van Wingerden et al., 2008), control stall (Cairns et al., 2008; Pechlivanoglou et al., 2010), and mitigate the blade-root bending moment (Bergami and Poulsen, 2015) and fatigue loads (Bernhammer et al., 2016).
Jawahar et al. (2018, 2022) experimentally and numerically studied the aerodynamic performance and aeroacoustic characteristics of a NACA 0012 airfoil fitted with hinged and morphed TEFs. Zhuang et al. (2020) investigated the effect of a morphed TEF on the aerodynamic load control of a large-scale wind turbine blade profile. Qian et al. (2023) investigated the aerodynamic performance of morphed TEFs to reduce the unsteady loads on an FFA-W3-241 airfoil under dynamic stall conditions. Giammichele et al. (2024) designed, developed, and tested an innovative morphed TEF system to improve the performance of a wind turbine blade airfoil. Other scholars have investigated the aerodynamic performance of wind turbine blades fitted with morphed or hinged TEFs (Ali et al., 2021; Akhter et al., 2023; Horcas et al., 2022; Mansi and Aydin, 2022).
According to the extant literature, there has been no combined morphed and hinged TEF study. Thus, an innovative TEF (blended TEF) for small-scale wind turbine blades is introduced in this study. The blended TEF is characterized by both the pressure surface of the hinged TEF and the suction surface of the morphed TEF.
The contributions of this research are summarized as follows.
The impact of the blended TEF on increasing the aerodynamic performance of a small-scale wind turbine rotor is numerically and experimentally studied.
The results are obtained from a more reliable numerical simulation at real rotational speeds.
Experimental setup and procedure
Experiments were conducted in the wind tunnel facility of the Kunming University of Science and Technology, as shown in Figure 1. The inlet wind speed (V ∞ ) was measured by an anemometer, and the rotational speed (ω) of the wind turbine was monitored using a laser tachometer. The experimental section is the central component of the wind tunnel, where turbulence is about 1%. The relative ranges of 60 wind speed data collected at 0.96, 1.17, and 1.38 m/s are 1.01%, 1.58%, and 1.18%, respectively. The flow uniformity and turbulence level inside the wind tunnel are within the acceptable limits.
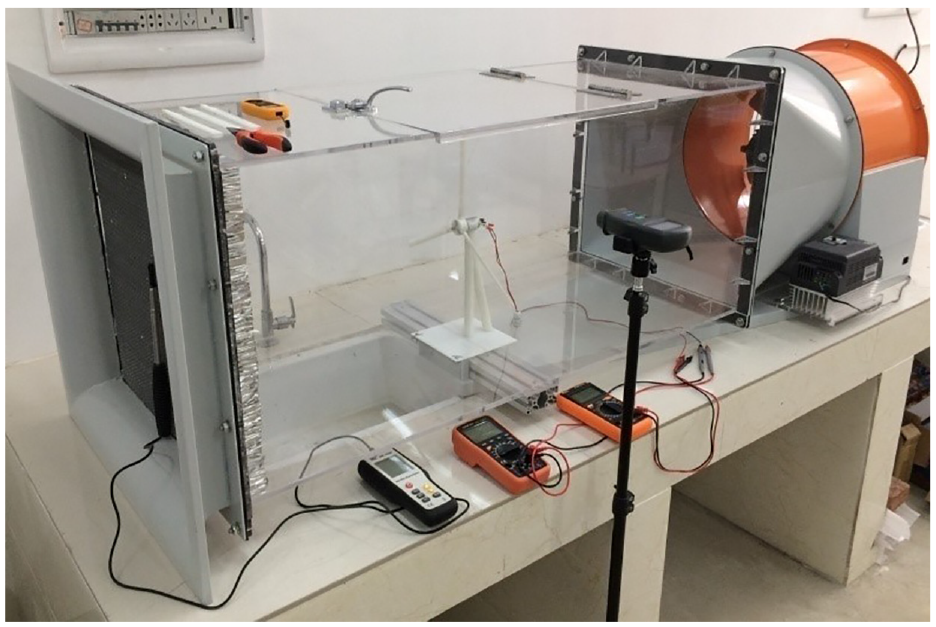
Wind tunnel facility.
The physical model of the original wind turbine was derived from the National Renewable Energy Laboratory (NREL) Phase II wind turbine (Simms et al., 1999), and had a scale of 1:25. The blade profile was the NREL S809 airfoil, and the constant fixed pitch angle (θ), chord length (c), and rotor radius (R) were 12°, 18 mm, and 202 mm, respectively.
The TEF parameters include the flap length (b), flap angle (β), and flap extension (l), as shown in Figure 2. The change in the vertical coordinate of the airfoil (Δy) of the TEF is calculated as
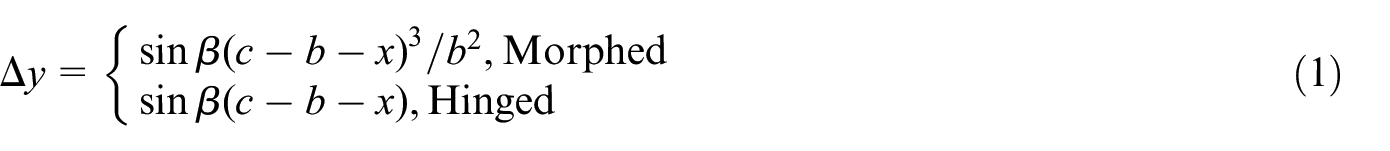
where x is the horizontal coordinate of the airfoil.

Blades with different TEFs.
According to previous research (Yin et al., 2024), in this study, β, the relative flap length (b/c), and the relative flap extension (l/R) were respectively set to 30°, 0.3, and 0.3.
The hub was a cylinder with slots and bolt holes, and bolt holes were also included at the blade root. The generator was fixed to the top of the tower, and the base was fixed at the wind tunnel floor. The hub and blades were made of curable resin material, as shown in Figure 3. Furthermore, it should be noted that the effects of the nose and tower were ignored in this study.
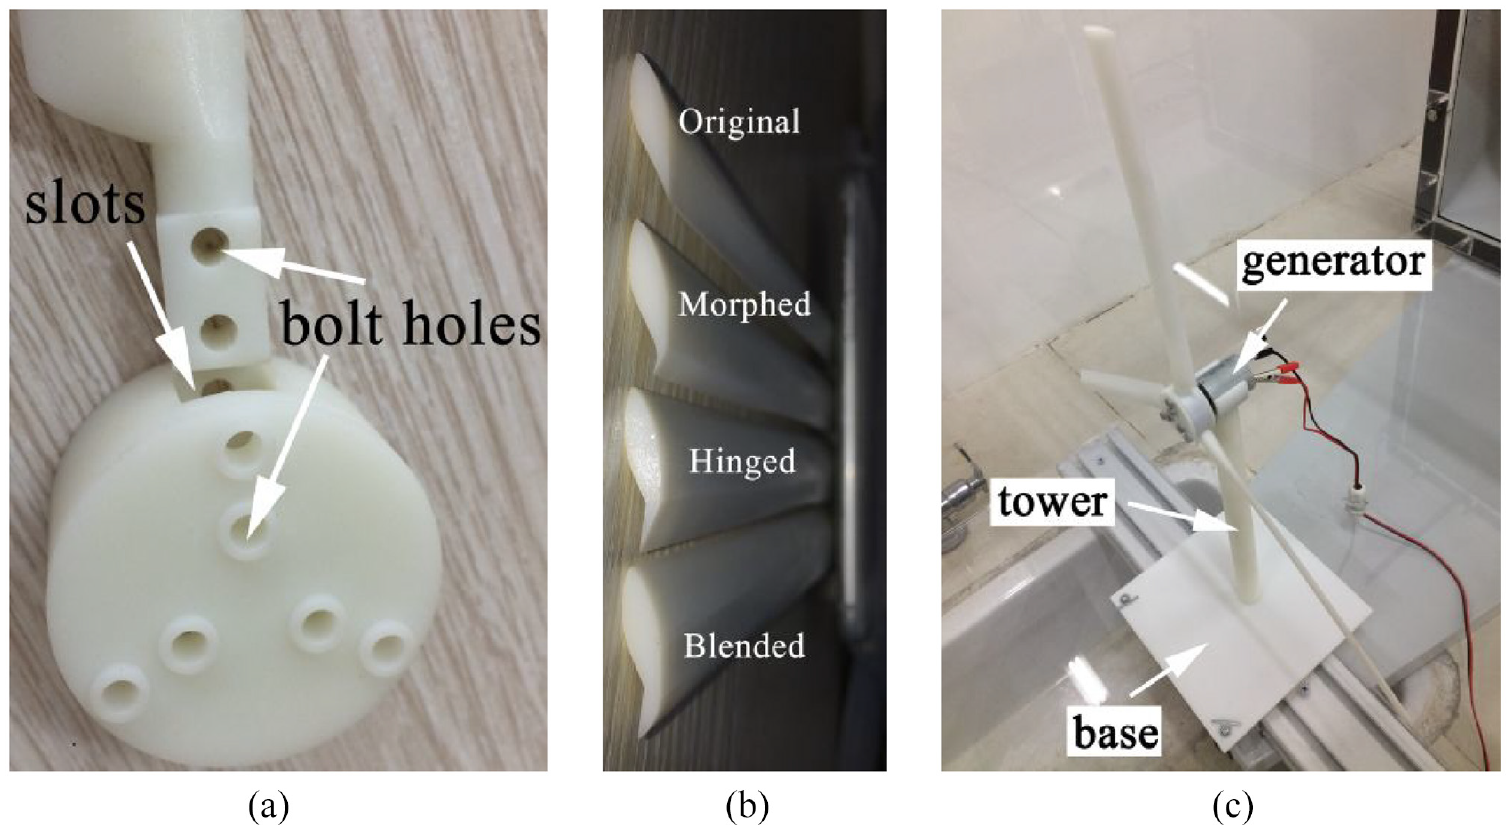
Wind turbine model: (a) hub and blade root, (b) blade, and (c) overall model.
The output voltage (U) and current (I) were measured by a multimeter. The maximum load in the circuit was controlled by adjusting the resistance. All the measurement data were collected every 1 s for a period of 60 s, and the averaged value was taken. The experimental power coefficient (C P -EXP) of the wind turbines is calculated as

where ρ is the air density.
Numerical simulation methodology
Solution method
The steady-state viscous incompressible flow was numerically analyzed via computational fluid dynamics (CFD) using a finite volume solver. The continuity and Reynolds-averaged Navier–Stokes (RANS) equations were considered as the governing equations. The turbulence model was the four-equation transition shear stress transport (SST) model (Langtry and Menter, 2009), and the Semi-Implicit Method for Pressure Linked Equations (SIMPLE) algorithm was applied for the coupling of velocity and pressure. The convergence criterion was set to 1.0 × 10⁻⁵ for the residual value of continuity. The torque coefficient (C M ), power coefficient (C P ), and thrust coefficient (C T ) deduced from the CFD investigation are calculated as
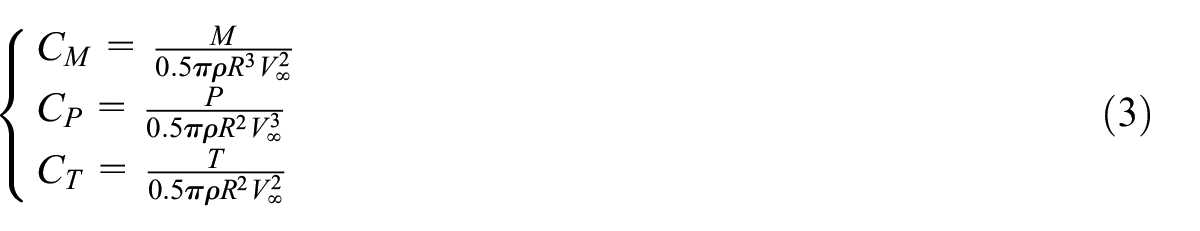
where M, P, and T are the torque, power, and thrust from the wind turbines, respectively.
Grid generation
The computational domain was a cuboid, the size of which (500 × 500 × 1200 mm) was that of the actual wind tunnel. The rotation domain was a cylinder with a diameter of 2.2 R and a thickness of 0.16 R, and was located in the middle, as shown in Figure 4. The rotor surface and the stationary domain surface were both set as nonslip walls, and the former was revolved with the cylindrical rotation domain. The surfaces at which the rotation and stationary domains coincided were applied as the interface surfaces. The multi-reference frame (MRF) approach was employed.

Computational domain and boundary conditions.
Figure 5 displays the unstructured high-quality hexahedral grids of the computational domains. The y+values on most of the surface of the blade were less than 1.

Unstructured high-quality hexahedral grids of the computational domains: (a) stationary domain and (b) blade tip.
Figure 6 presents the variation of C P as a function of the number of grid elements. When the latter was greater than 4.27 × 10⁶, the maximum variation of C P was less than 0.75%. Therefore, the number of grid elements was set to 4.27 × 10⁶ for all cases.

Grid independence test.
CFD validation via an experiment
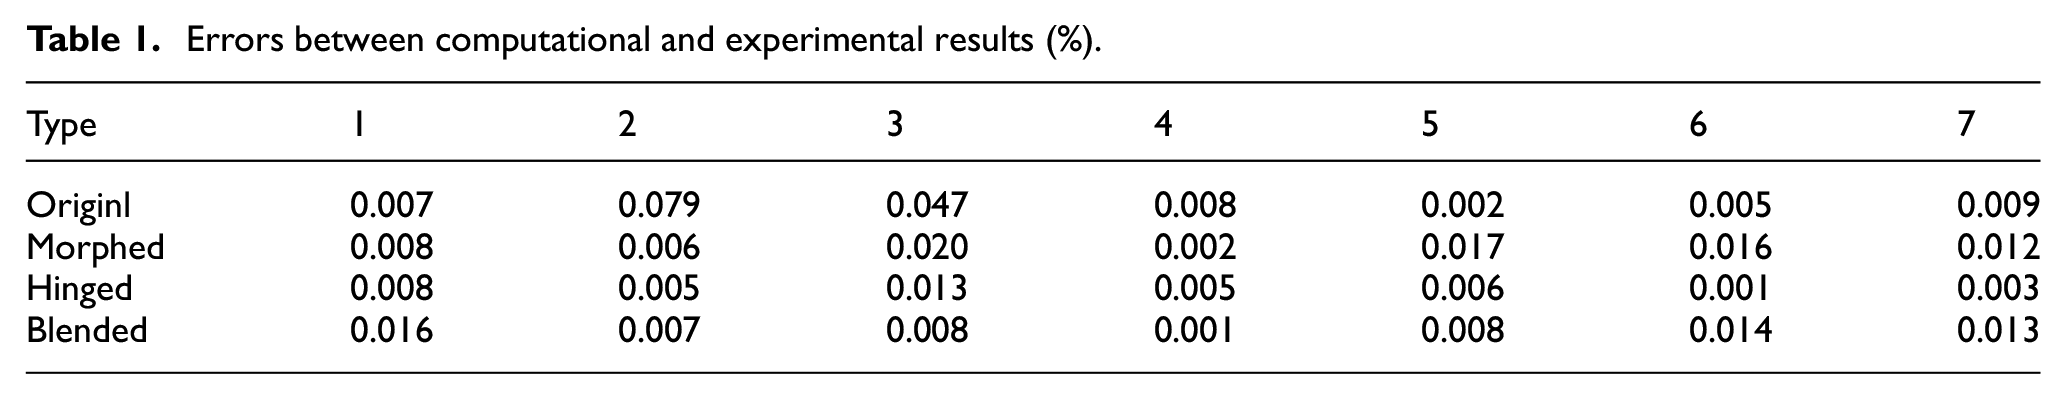
Figure 7 presents the C P values of the four different wind turbine blades in the computational and experimental studies. For all the cases, C P was found to increase and then decrease with the increase of the tip speed ratio (TSR) (λ0). In addition, the computational results were slightly higher than the experimental results, with a maximum error value of almost 0.08%. The errors in experiments are shown in Table 1.
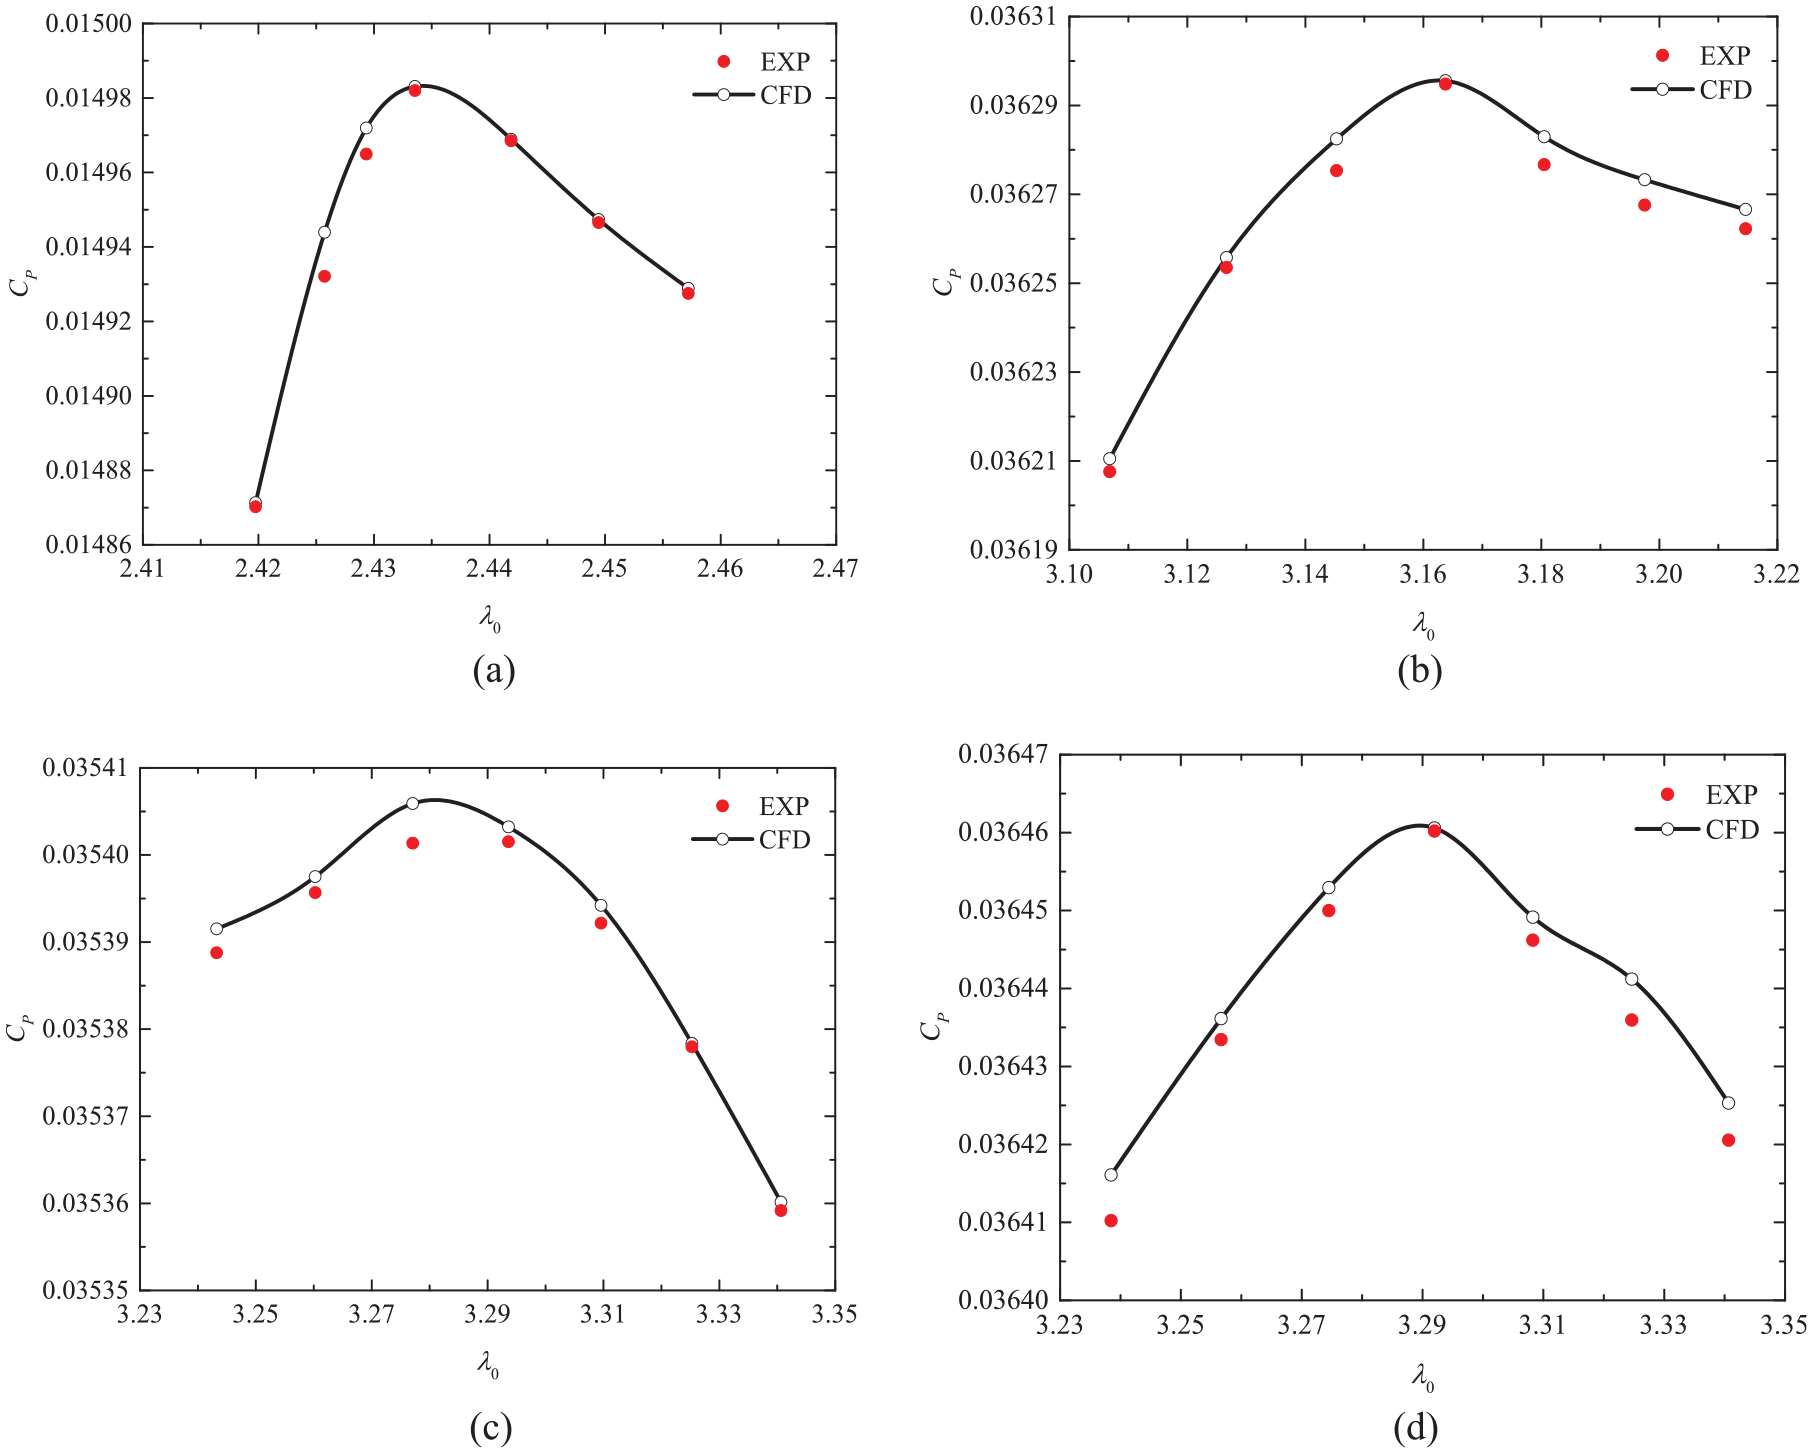
Power coefficients at different TSR values: (a) Original, (b) Morphed, (c) Hinged, and (d) Blended.
Errors between computational and experimental results (%).
Results and discussion
Power and thrust coefficients
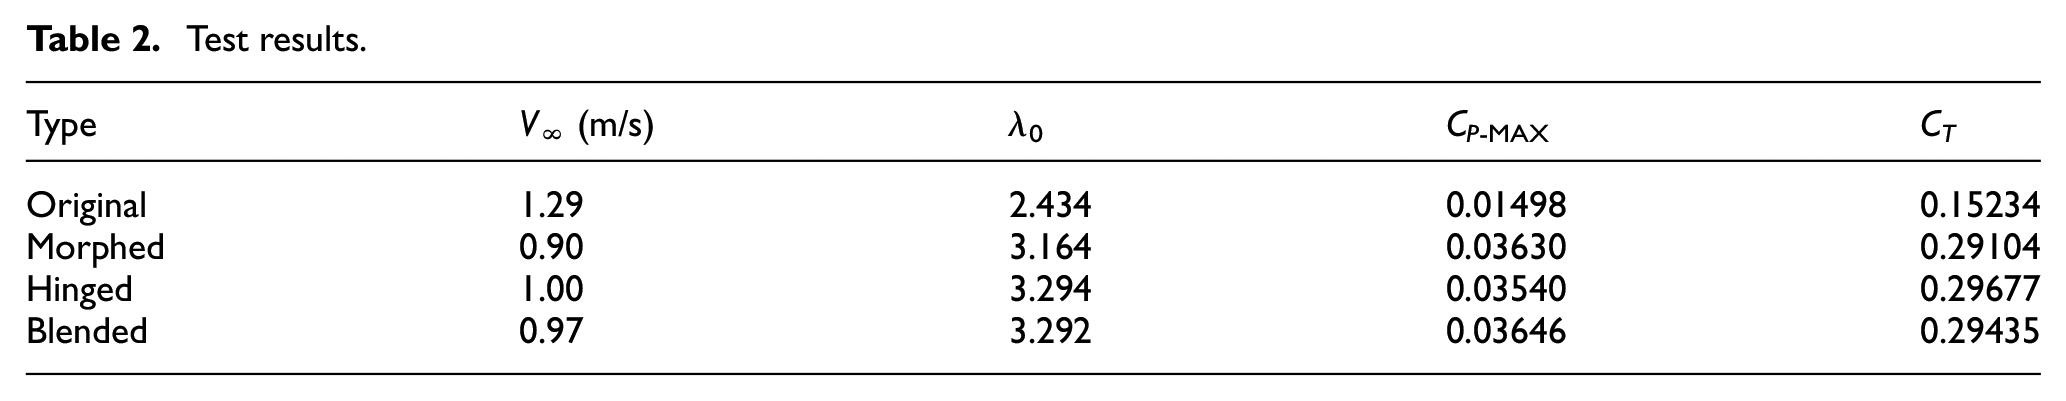
Table 2 reports the maximum C P (C P -MAX) and the optimal V ∞ , optimal TSR, and optimal C T of the original, morphed, hinged, and blended blades. As compared to the original blade, the morphed, hinged, and blended blades all had a lower optimal V ∞ and optimal TSR, as well as a higher C P -MAX and optimal C T . Among the three TEF blades, the morphed and hinged blades respectively had the lowest and highest optimal wind speeds, the optimal TSR, and the optimal C T . Moreover, the hinged and blended blades respectively had the lowest and highest C P -MAX values. This indicates that the wind turbines with the morphed and hinged blades were respectively the easiest and hardest to start, and respectively had the lowest and highest output axial thrust. Moreover, the wind turbines with the hinged and blended blades respectively had the lowest and highest output power.
Test results.
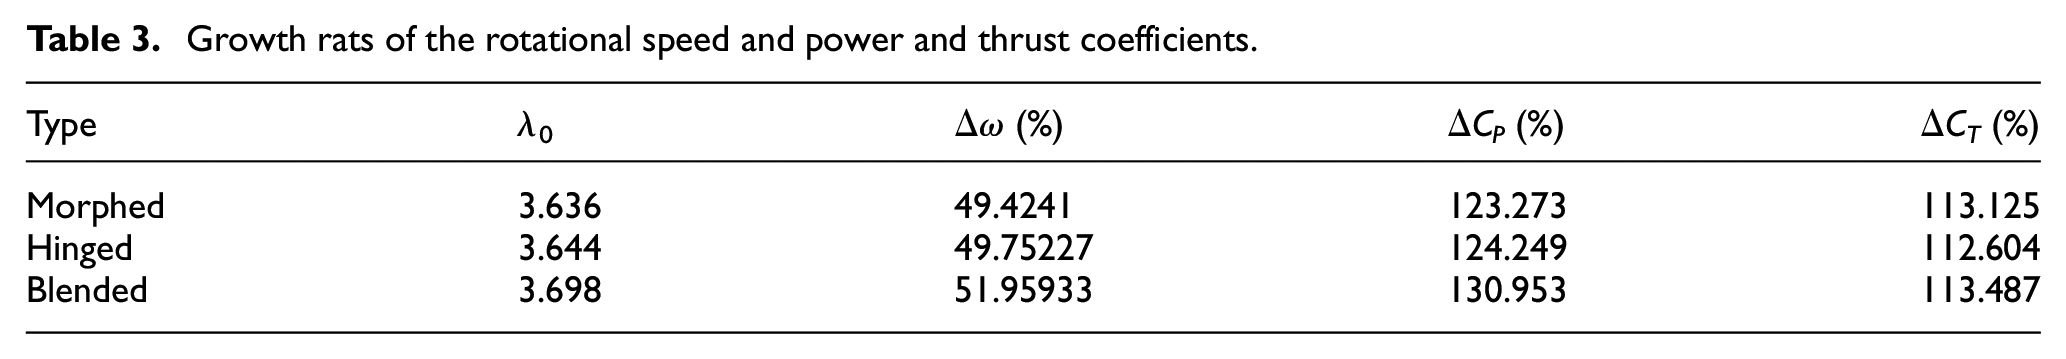
For better comparison, all subsequent analyses were performed at V ∞ = 1.29 m/s, which corresponds to the C P -MAX value of the original wind turbine. For the morphed, hinged, and blended wind turbines, the C P value was in the decreasing stage. Table 3 reports the growth rates of the rotational speed (Δω), power coefficient (ΔC P ), and thrust coefficient (ΔC T ) of the morphed, hinged, and blended blades as compared with those of the original blade. The morphed and blended blades respectively had the lowest and highest Δω and ΔC P values, while the hinged and blended blades respectively had the lowest and highest ΔC T values. The ΔC P value of the blended blade was 6.7% greater than that of the hinged blade, while the ΔC T value of the blended blade was only 0.88% greater than that of the hinged blade. This demonstrates that the wind turbine with the blended blade could increase power while suppressing the increase of the axial thrust.
Growth rats of the rotational speed and power and thrust coefficients.
Pressure coefficient
Figure 8 exhibits the distributions of the static pressure coefficient (C p ) on the four spanwise sections (r/R = 0.6, 0.7, 0.8, and 0.9). The non-dimensional parameter C p is expressed as
where p is the static pressure on the surface of the wind turbine blade.

Comparison of the static pressure coefficient distributions on the four spanwise sections: (a) r/R = 0.6, (b) r/R = 0.7, (c) r/R = 0.8, and (d) r/R = 0.9.
It is evident from the figure that, compared to the original blade, the TEFs resulted in a higher pressure coefficient on the pressure surface, excluding the area around x/c = 0.2–0.4, and a lower pressure coefficient on the suction surface.
Regarding r/R = 0.6 and the pressure surface, the blended and hinged blades respectively had the highest and lowest pressure values around x/c = 0–0.15, the morphed and blended blades respectively had the highest and lowest pressure values around x/c = 0.15–0.75, and the morphed and hinged blade respectively had the highest and lowest pressure values around x/c = 0.75–1. Regarding r/R = 0.6 and the suction surface, the morphed, hinged, and blended blades almost had the same pressure values, excluding the area around x/c = 0–0.4, where the hinged blade had the highest pressure value, and the area around x/c = 0.9–1, where the blended and morphed blades respectively had the highest and lowest pressure values.
Regarding r/R = 0.7 and the pressure surface, the blended and morphed blades respectively had the highest and lowest pressure values around x/c = 0–0.15, and the morphed and blended blades respectively had the highest and lowest pressure values around x/c = 0.15–0.75. Moreover, the hinged and blended blades almost had the same pressure values around x/c = 0.75–1, which were respectively higher and lower than that of the morphed blade around x/c = 0.75–0.95/0.95–1. Regarding r/R = 0.7 and the suction surface, the morphed, hinged, and blended blades almost had the same pressure values, excluding the area around x/c = 0.1–0.8, where the morphed and blended blades respectively had the highest and lowest pressure values, and the area around x/c = 0.8–1, where the hinged and blended blades respectively had the highest and lowest pressure values.
Regarding r/R = 0.8–0.9 and the pressure surface, the morphed, hinged, and blended blades almost had the same pressure values, excluding the area around x/c = 0–0.05, where the blended and hinged blades respectively had the highest and lowest pressure values, and the area around x/c = 0.2–0.75, where the morphed and blended blades respectively had the highest and lowest pressure values. The hinged and blended blades almost had the same pressure values around x/c = 0.75–1, which were respectively higher and lower than that of the morphed blade around x/c = 0.75–0.95/0.95–1. Regarding r/R = 0.8–0.9 and the suction surface, the blended and hinged blades respectively had the highest and lowest pressure values around x/c = 0–0.1, and the morphed and blended blades respectively had the highest and lowest pressure values around x/c = 0.1–1.
In general, for r/R = 0.8–0.9, the pressure increase around x/c = 0.75–0.95 on the pressure surface and the pressure decrease around x/c = 0.1–1 on the suction surface may increase the work done by the wind turbine blade, which would increase Δω and ΔC P , as shown in Table 3. For r/R = 0.6, the pressure decrease around x/c = 0–0.15 on the pressure surface and the pressure increase around x/c = 0–0.4 on the suction surface may cause the hinged blade to have the lowest ΔC T . For r/R = 0.6–0.9, the pressure increase around x/c = 0–0.15 on the pressure surface and the pressure decrease around x/c = 0.4–0.8 on the suction surface may cause the blended blade to have the highest ΔC T .
Flow field
Streamline
Figure 9 presents the static pressure coefficient contours superimposed with streamlines around the wind turbine blades on the two spanwise sections (r/R = 0.8 and 0.9). It is evident that, compared to the original blade, the TEFs resulted in a higher pressure coefficient around the pressure surface and a lower pressure coefficient around the suction surface. Regarding the trailing edge around the pressure surface, the high-pressure areas of the hinged and blended blades were almost at consistent positions, while that of the morphed blade was closer to the trailing edge; this is consistent with the change in C p , as shown in Figures 8(c) and (d). This may be because the pressure surfaces of the hinged and blended blades have the same shape, which is different from that of the morphed blade. Regarding the pressure around the suction surface, although the morphed and blended blades had the same suction surface shape, the low-pressure areas of the hinged and blended blades were almost at consistent levels, with larger zones than that of the morphed blade.

Comparison of the static pressure coefficient contours superimposed with streamlines around the wind turbine blades on the two spanwise sections: (a) r/R = 0.8 and (b) r/R = 0.9.
The TEFs led to streamline separation near the flap center around the pressure surface. Moreover, they alleviated the degree of streamline separation around the suction surface and moved the streamline separation center to the trailing edge. Regarding the trailing edge around the pressure surface, the streamline separation centers of the hinged and blended blades were almost at consistent positions, while that of the morphed blade was closer to the trailing edge; this corresponded to the change in the high-pressure areas. Regarding the suction surface, for the hinged and blended blades, the positions where the streamline was separated from the blade surface were almost the same, and were closer to the trailing edge than that of the morphed blade. The streamline separations of the morphed and hinged blades respectively occurred at the earliest and latest at the trailing edge.
Wake turbulent kinetic energy
Figure 10 displays the wake turbulent kinetic energy contours around the wind turbine blades on the two spanwise sections (r/R = 0.8and 0.9). Due to the TEFs, the characteristic double peak wake flow was mixed, the turbulent core region was transferred to the pressure side, and the turbulent kinetic energy was intensified. The turbulent core regions of the hinged and blended blades were almost at the same positions, and were larger and closer to the trailing edge than that of the morphed blade. The morphed and hinged blades respectively had the smallest and largest turbulent kinetic energy values and zones, which corresponded to the position of the streamline separations at the trailing edge on the suction surface, as shown in Figure 9. This indicates that the pressure surface of the hinged blade can increase the wake turbulent kinetic energy and mix the wake flow to remove the flow separation, while the effect of suction surface of the morphed blade is the opposite.
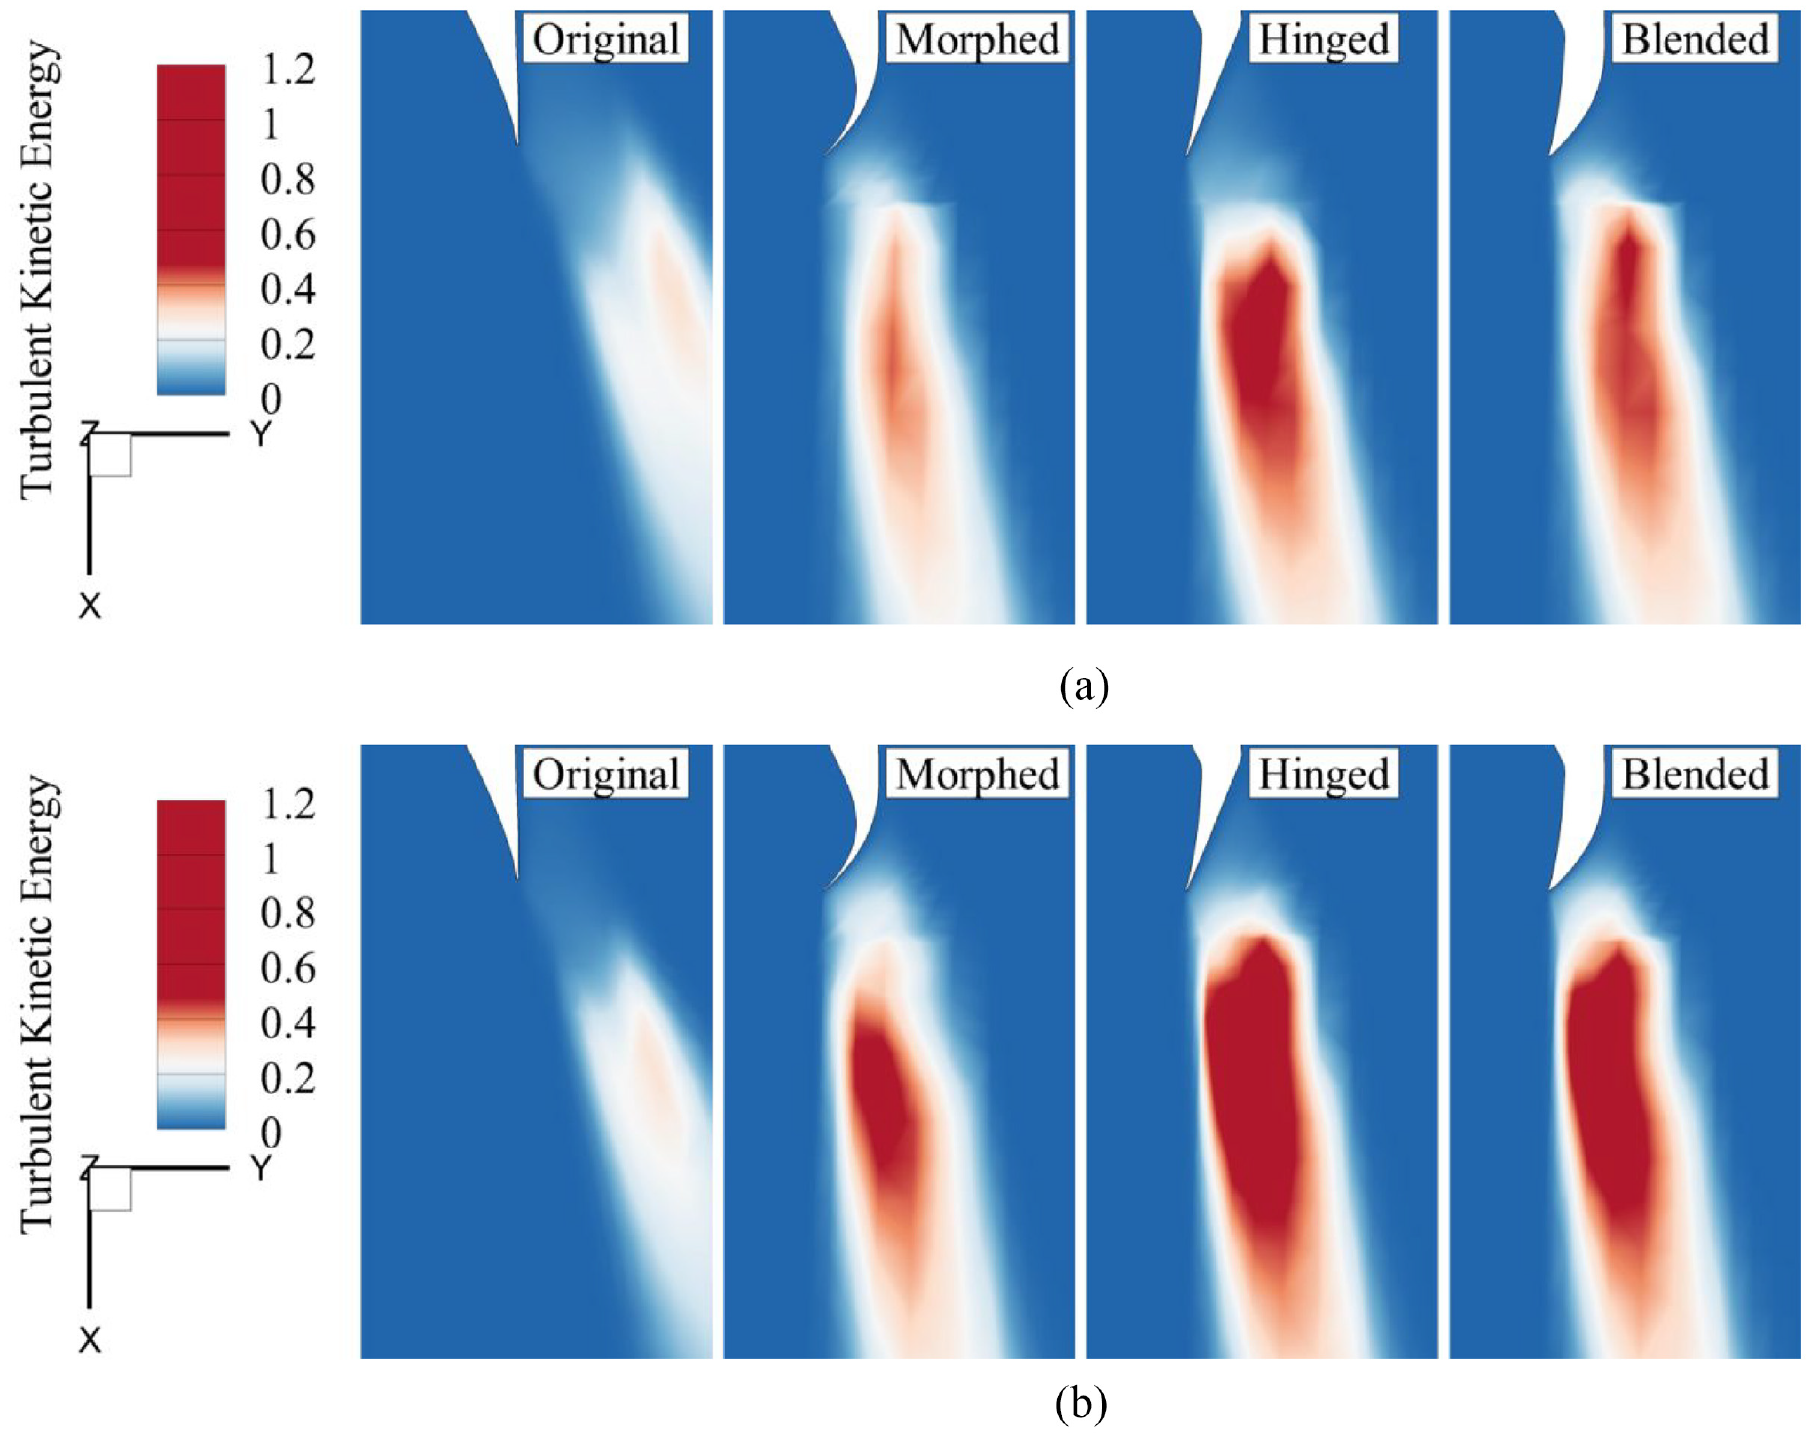
Comparison of the wake turbulent kinetic energy contours on the two spanwise sections.
Vortex
Figure 11 shows the contours of the Q-criterion (Q = 0–3.0 × 10⁴ s−2) for the wind turbine blades on the two spanwise sections (r/R = 0.8 and 0.9). Regarding the pressure side, the TEFs reduced the leading-edge vortex, resulting in a separating vortex and a bound vortex (near the trailing edge) near the flap center. Regarding the suction side, the TEFs delayed the leading-edge vortex separation and brought it close to the suction surface, enlarged the trailing-edge vortex core region, and resulted in a bound vortex on the flap. Moreover, due to the TEFs, the trailing vortex was larger and was further transferred to the pressure side. The separating vortex and the bound vortex of the hinged and blended blades at the pressure side were almost at consistent positions, while those of the morphed blade were closer to the trailing edge; this was consistent with the position of the streamline separations at the flap center on the pressure surface, as shown in Figure 9. The bound vortexes of the morphed and blended blades on the suction surface were almost at the same positions, while that of the morphed blade was larger and closer to the trailing edge; this corresponded to the turbulent core regions, as shown in Figure 10. This indicates that the suction surface of the morphed blade can decrease the bound vortex and delay the vortex separation, while the effect of the suction surface of the hinged blade was the opposite. The hinged and blended blades almost had the same trailing vortex scales, while that of the morphed blade was the largest. This indicates that the pressure surface of the hinged blade can reduce the trailing vortex.
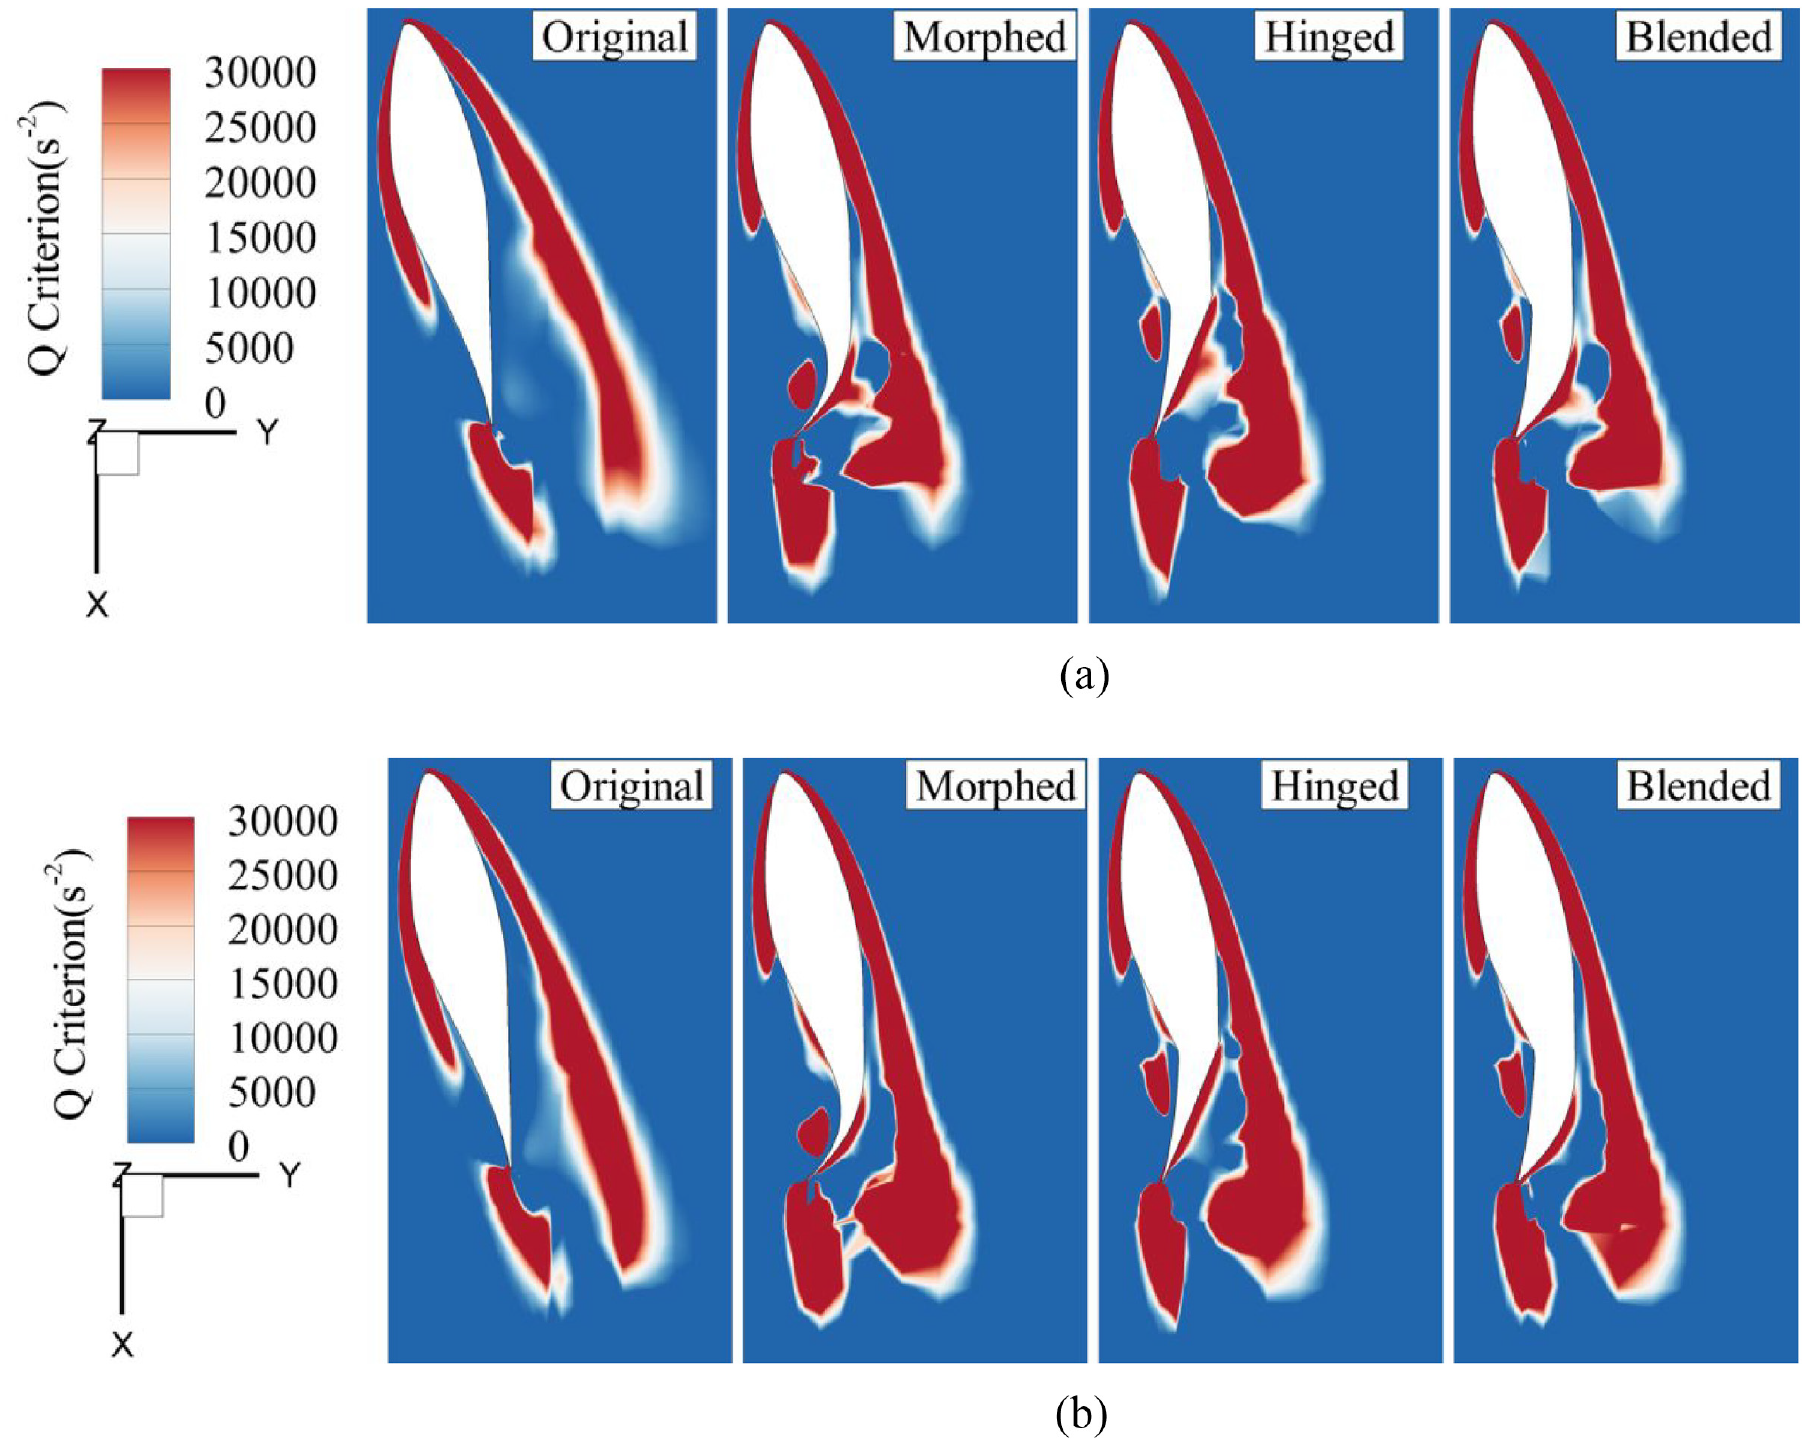
Comparison of the Q-criterion contours on the two spanwise sections: (a) r/R = 0.8 and (b) r/R = 0.9.
Conclusion
The influences of different TEFs on the performance of a wind turbine were investigated in this research. The main conclusions are summarized as follows.
The wind turbines with the morphed and hinged blades were respectively the easiest and hardest to start, and respectively had the lowest and highest output axial thrust. The wind turbines with the hinged and blended blades respectively had the lowest and highest output power.
The wind turbine with the blended blade could increase power while suppressing the increase of the axial thrust. Compared with the original wind turbine, this respectively resulted in additional power and thrust increases of 130.95% and 113.49% at V ∞ = 1.29 m/s.
For r/R = 0.6–0.9, the blended blade mainly increased the pressure around x/c = 0–0.15 on the pressure surface and decreased the pressure around x/c = 0.4–0.8 on the suction surface.
The static pressure coefficient contours superimposed with streamlines around the hinged and blended blades were almost at consistent levels.
The pressure surface of the hinged blade could increase the wake turbulent kinetic energy and reduce the trailing vortex, while the effect of the suction surface of the morphed blade was the opposite.
The suction surface of the morphed blade could decrease the bound vortex and delay the vortex separation, while the effect of the suction surface of the hinged blade was the opposite.
Footnotes
Appendix
Author contributions
Rui Yin: Data curation, Investigation, Visualization, Writing - original draft. Jian-Bin Xie: Writing - review & editing. Ji Yao: Software.
Declaration of conflicting interests
The author(s) declared no potential conflicts of interest with respect to the research, authorship, and/or publication of this article.
Funding
The author(s) disclosed receipt of the following financial support for the research, authorship, and/or publication of this article: The work described in this paper is funded by the National Natural Science Foundation of China (No. 11862024) and the Scientific Research Fund Project of the Education Department of Yunnan Province (No. 2023J1324). The authors are grateful for their financial support.
Data availability
Data will be made available upon reasonable request.