
Abstract
The use of deflector plates around vertical axis wind turbines is an effective method for enhancing the power characteristics of these rotors. This study investigates how varying the number of deflector plates can improve the power characteristics of a three-bladed Darrieus turbine with straight blades, utilizing computational fluid dynamics for analysis. For this purpose, 6, 8, and 10 flat plates are considered and distributed around the rotor with an inner diameter to rotor diameter ratio of 1.6 and an outer diameter to rotor diameter ratio of 8.8. All calculations have been performed at a free-wind speed of 6 m/s and tip speed ratios (TSR) of 0.5, 1.5, and 2.5. The numerical code used for a case without deflector plates has been validated against available data, yielding a reasonable agreement. The results demonstrate a significant impact of deflector plates on the power characteristics of the three-bladed Darrieus turbine. Incorporating deflector plates around the wind rotor greatly enhances the airflow directed into the rotor, leading to an improved velocity field around the blades. The findings indicate that the configuration with eight deflector plates achieved the highest performance. At TSR values of 0.5, 1.5, and 2.5, the mean power coefficient for this optimal case increased by 456.7%, 102.9%, and 287.7%, respectively, compared to the case without deflector plates.
Introduction
Humans have developed devices such as wind turbines to capture wind energy and convert it into electricity. Based on the rotation axis, wind turbines are categorized into two groups: vertical axis and horizontal axis (Li et al., 2021). A vertical axis wind turbine rotates about a shaft that is perpendicular to the ground surface, with the rotor axis oriented vertically, allowing the turbine to operate independently of wind direction (Yan et al., 2021). This type of turbine includes two variations: the Darrieus and Savonius turbines. The Darrieus turbine offers higher performance limits but has poor self-starting ability (Huang et al., 2023). Numerous researchers have explored this turbine type to enhance its performance and address its weaknesses. Several studies have been conducted to refine previous designs and eliminate their shortcomings. Among previous studies, altering the shape of the airfoil section (Tirandaz and Rezaeiha, 2021), using guide vanes (Yahya et al., 2021), implementing channels (Mauro et al., 2019), employing combined Savonius and Darrieus rotors (Tantichukiad et al., 2023), designing spiral blades (Sun et al., 2023), and incorporating flow-diverting plates (Chen et al., 2024) are some of the efforts made to enhance power characteristics. However, the use of flow deflector plates alongside the Darrieus turbine has received less attention. Iliev (2023), in a combined numerical and experimental study, investigated the effect of flat guiding plates on the performance of a drag-type vertical axis wind turbine. In this study, flat plates were uniformly arranged around the rotor at various angular orientations to shield the passive area, reduce negative torque, and minimize the turbine’s sensitivity to wind direction. The experimental results indicated that the maximum power coefficient reached 0.144 when four flat plates with an optimal length of 280 mm were positioned at 0° relative to the wind direction. However, the numerical results showed that the highest power coefficient was achieved in a case with six flat plates. Shahizare et al. (2016) conducted a two-dimensional numerical study using unsteady CFD simulations to explore how different shape ratios of omnidirectional guide vanes (ODGV) affect the power features of Darrieus type vertical axis wind turbines. The results indicated that an optimized design with a shape ratio of 0.55 could enhance the power coefficient by up to 48% and the torque coefficient by up to 58% compared to the baseline model that did not include guide vanes. Ansaf et al. (2023) conducted a numerical study to evaluate the efficiency of an H-type Darrieus wind turbine fitted with fixed flat guiding walls. The research focused on four key geometric parameters, including the inner and outer horizontal and vertical distances of the guiding walls. It examined their impact on the aerodynamic behavior of the wind turbine. Through two-dimensional CFD simulations, the researchers discovered that optimizing the configuration of the guiding walls could significantly enhance power output, increasing it by up to 177% compared to the base case. In a two-dimensional numerical study, Sathiyamoorthy et al. (2021) studied the effect of omnidirectional guide vanes on the power characteristics of a vertical axis wind turbine with S1046 airfoil blades. The key parameters in this simulation included the presence or absence of the guide vanes and their respective angles. The results indicated that the power coefficient for the turbine equipped with guide vanes increased to approximately 0.45, while this value was 0.391−0.392 without guide vanes. This indicates an approximate 15% improvement in the power coefficient due to the implementation of the guide vanes. Wong et al., 2018a conducted a three-dimensional study investigating the effect of the deflector on the performance of a vertical axis wind turbine with NACA0021 blades. The study focused on effective parameters, including the deflector position, placement angle, and length. The results demonstrated a 47.1% improvement in the torque coefficient compared to the scenario without the deflector. Li et al. (2020) studied a straight-blade Darrieus wind turbine featuring a curved-outline wind-gathering device. The results revealed that the starting torque coefficient increased by 14.8% compared to the conventional case. Jiang et al.(2020) placed a flow deflector between two turbines of different dimensions. It was found that the flow deflector increased the rotor’s output power by 38.6% compared to the scenario without it. Jin et al. (2018) examined how the parameters of upstream deflectors affect the output power of vertical axis wind turbines. Their findings revealed that selecting the appropriate deflector parameters can significantly enhance the performance of these turbines. Chong et al. (2019) examined the effectiveness of a cross-axis wind turbine with an integrated deflector. They measured the turbine’s torque at various deflector and blade pitch angles. Their study revealed that the proposed design achieved a 2.8-fold increase in power output compared to the conventional H-type vertical axis wind turbine. Takao et al. (2009) presented an experimental study to address the efficiency of a vertical axis wind turbine equipped with a directed guide vane row. The study focused on two key geometric parameters of the guide vane system: the setting angle and the gap between the rotor blade and the guide vane and analyzed their effects on power and torque coefficients. The experiments conducted in a wind tunnel demonstrated that adjusting the setting angle had a significant influence on the turbine’s performance. In particular, a setting angle of 45° yielded a peak power coefficient of approximately 0.205. This value was about 1.8 times greater than that of the turbine without guide vanes, confirming that optimizing the geometry of the guide vane system can substantially enhance rotor performance. Salleh et al. (2020) studied the effect of deflector position and height on a two-bladed Savonius turbine. They found that optimal deflector placement doubled the maximum power coefficient (CPmax = 0.26) compared to the case without deflectors, mainly by reducing negative torque through improved flow control. Guo et al. (2020) introduced a Savonius wind turbine equipped with a rear deflector and a passive positioning system, allowing the deflector to maintain an optimal orientation automatically. The results indicated that reducing the length of the deflector and increasing its radial distance from the center of rotation decreased the power coefficient. Specifically, when the deflector was positioned at a distance equal to 0.82 times the turbine diameter, its effect on the power coefficient under the examined operating conditions was less than 3%. (Wong et al., 2018) showed that employing a deflector can greatly enhance the output power of the Savonius turbine. In their experiment, the five-bladed rotor achieved the highest power coefficient increase of 7.4% compared to the test without a deflector when it was optimally positioned. Furthermore, simulations of the two-bladed turbine indicated a 33% improvement in the mean power coefficient. Mandal et al. (2024) studied a Savonius turbine that was enclosed in a cylindrical cowling with different coverage levels. Their findings indicated that the rotor with 80% coverage achieved a maximum power coefficient of 0.22, while the unshrouded rotor only reached 0.16. Rus (2012) investigated the Savonius turbine with a wind concentrator. The results of this study indicated that, without a wind concentrator, two-bladed and two-stage rotors offered the best performance. Furthermore, equipping single-stage rotors with wind concentrators led to an efficiency increase of 10%–20%. Storti et al. (2019) examined the effect of deflector plates on the performance of the Savonius turbine. The results indicated a 30% improvement in performance. Moreover, at a wind speed of 4 m/s, power generation was successfully achieved with the turbine deflector, while no power output was recorded in the configuration lacking the deflector. Kalluvila and Sreejith (2018) investigated how to improve the efficiency of the Savonius rotor by installing guide vanes around it. Their findings showed that the maximum power coefficient was 28% greater than that of the traditional setup. This research illustrated that incorporating guide vanes significantly reduced negative torque, thereby enhancing the turbine’s efficiency, even in low wind speeds and high turbulence environments. Manganhar et al. (2019) studied the power features of a Savonius wind turbine equipped with a flow accelerator and guide vanes. Their results indicated that incorporating a deflector enhanced the wind flow around the rotor. Adding upper and lower-end plates helped concentrate the flow within the rotor region, improving the power coefficient from 0.125 to 0.218. Mosbahi et al. (2019) investigated the effect of a newly designed deflector system on the performance of a helical Savonius hydrokinetic turbine. Without the deflector, the maximum power coefficient was 0.125 at TSR = 0.7. The addition of the deflector increased the power coefficient to 0.14, reflecting a 12% improvement in energy efficiency. The results highlight the positive impact of deflectors on turbine performance in low-velocity water flows. Alexander and Santhanakrishnan (2017) studied the effect of fixed blades on the Savonius rotor. The results indicated that the induction speed around the rotor increased by 65%. Additionally, reducing the number of fixed blades resulted in decreased coherence of the internal flow structure of the rotor and increased current leakage in the stator. Gaden and Bibeau (2010) numerically investigated how the diffuser affects the performance of the Savonius water turbine. The turbine with the diffuser configuration generated 3.1 times more power than the turbine without the diffuser. Salim et al. (2015) experimentally studied the effect of guide vane design on increasing the performance of the Savonius rotor and reported a maximum performance increase of 65.89%. Korprasertsak and Leephakpreeda (2016) designed a wind speed booster using a vertical axis rotor to operate at low wind speeds. Their report indicated that the flow booster significantly improved the performance of the vertical axis turbine.
Motivation of the present study
Given the scarcity of studies on the performance of Darrieus turbines with wind deflector plates and the absence of definitive results regarding their effectiveness, this study aims to fill this research gap. A two-dimensional numerical analysis is performed on a straight-bladed Darrieus rotor featuring three blades, evaluated at 0.5, 1.5, and 2.5 TSR values. This range of TSR values is particularly noteworthy because Darrieus turbines generally perform poorly under these conditions. The objective is to analyze the effects of deflector plates on rotor performance while preserving the omnidirectional feature of vertical axis wind turbines. To the authors’ knowledge, this topic has not been examined in the existing literature. The detailed findings provide essential insights into the aerodynamic characteristics and potential efficiency gains from deflector systems.
Problem statement and numerical procedure
The present study uses the CFD technique to investigate the impacts of a deflector plate number on the power characteristics of a three-bladed Darrieus wind turbine. The considered Darrieus rotor has three straight blades having NACA0018 airfoil. The deflector plates are assumed to be flat plates with a 2 mm thickness and distributed around the rotor in a circular pattern. Three different deflector plate numbers (N), including 6, 8, and 10, are evaluated and compared with each other and with the base case without a deflector. The inner diameter of deflectors (D3) and the outer diameter of deflectors (D4) are fixed and equal to 1.6D1 and 8.8D1, respectively. The free-wind speed is assumed to be a fixed value of 6 m/s corresponding to the Reynolds number of 3.286 × 10⁵ based on the rotor diameter. Moreover, the influence of the deflector plates on the considered rotor has been evaluated at three TSR values of 0.5, 1.5, and 2.5. Figure 1 and Table 1 show a schematic of the rotor and deflector plates and supplementary information of the current study, respectively. Schematic of a three-bladed Darrieus rotor with deflector plates. Geometric parameters of rotor and deflector plates.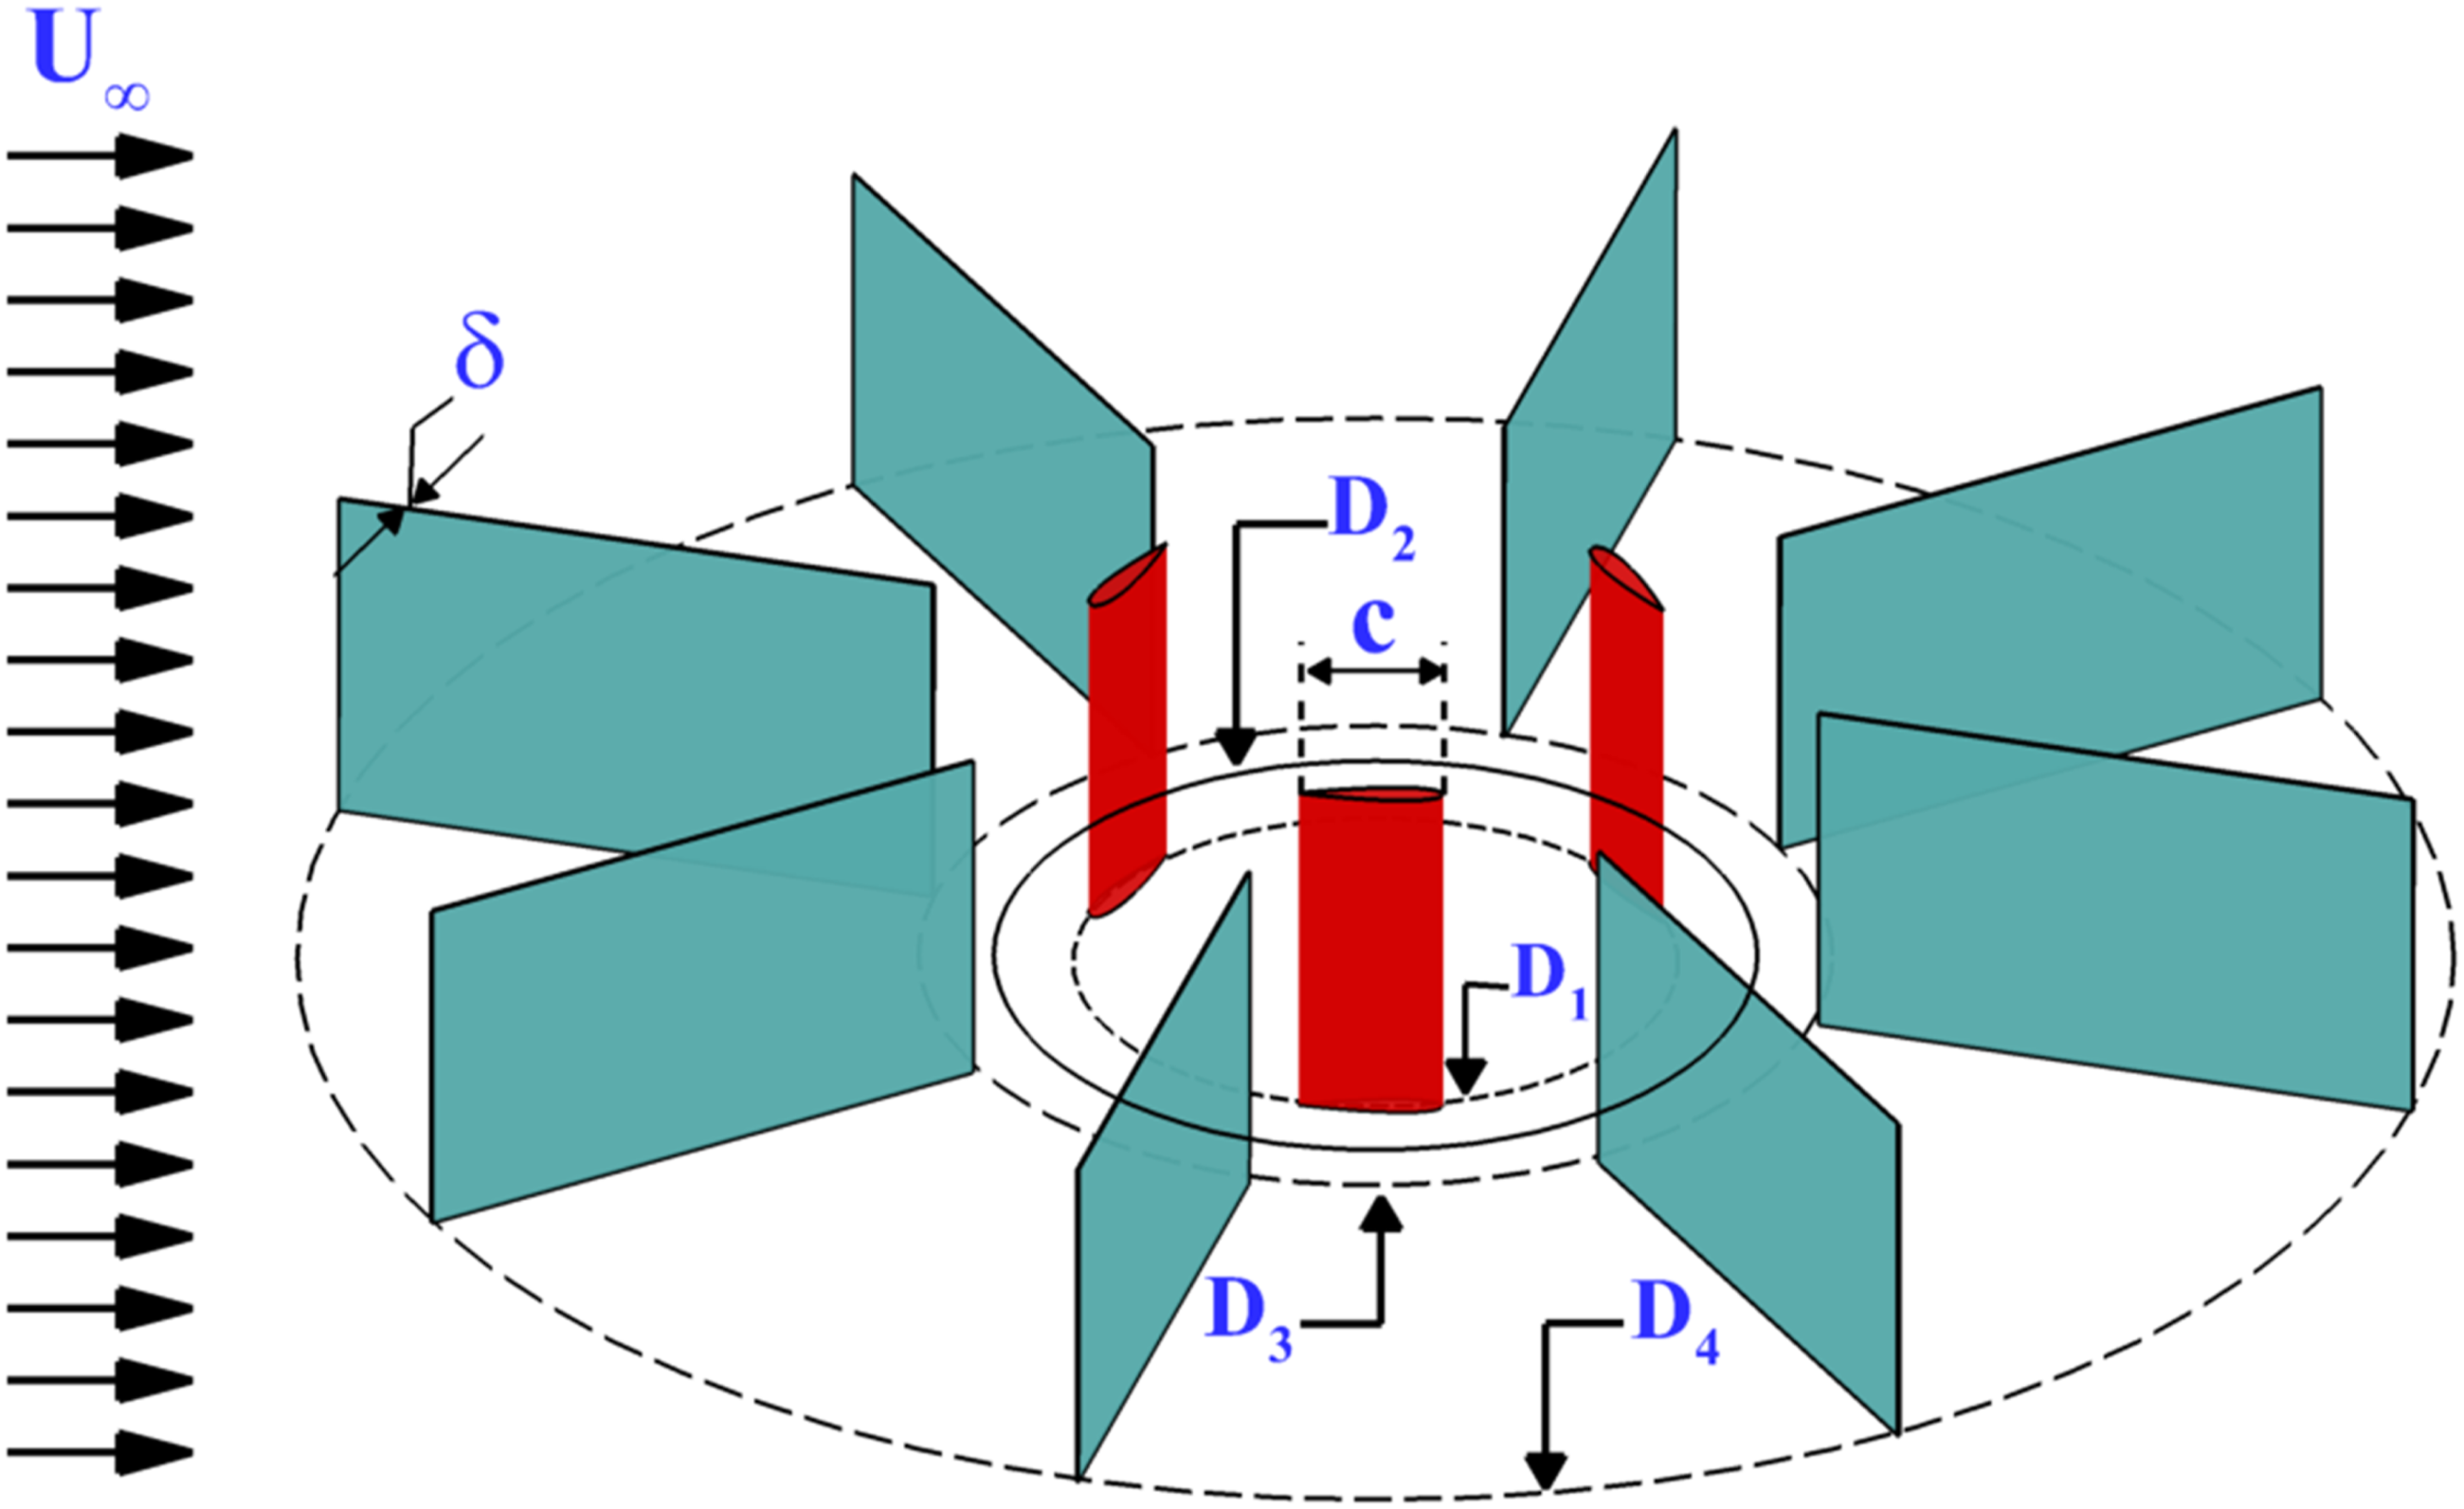

This study assesses the rotor performance in the presence of deflector plates two-dimensionally. To enable this, some assumptions have been made. For instance, it is assumed that the height of the rotor is sufficiently larger than the rotor diameter to ignore the effects of tip vortices. In addition, the deflector plates’ height is large enough compared to the rotor height. Furthermore, the rotor and deflectors are considered sufficiently far from the ground to avoid horseshoe vortex effects. A two-dimensional computational domain, as shown in Figure 2, is designed to simulate the problem under consideration. The considered flow domain has a rectangular shape with two distinguishable zones: a rotating circular zone around a rotor and a stationary zone far from the rotor. To avoid any boundary effects on the rotor performance, the dimensions of the physical domain for all cases with deflector plates are considered large enough, having 144D1 in the streamwise direction and 96D1 in the lateral direction. These dimensions correspond, respectively, to 16.74D4 and 5.58D4, which are close to those applied by previous studies (Ansaf et al., 2023; Sathiyamoorthy et al., 2021). The center of the rotor is located at 48D1 from the inlet section and 48D1 from side boundaries. Computational flow domain applied in the present study.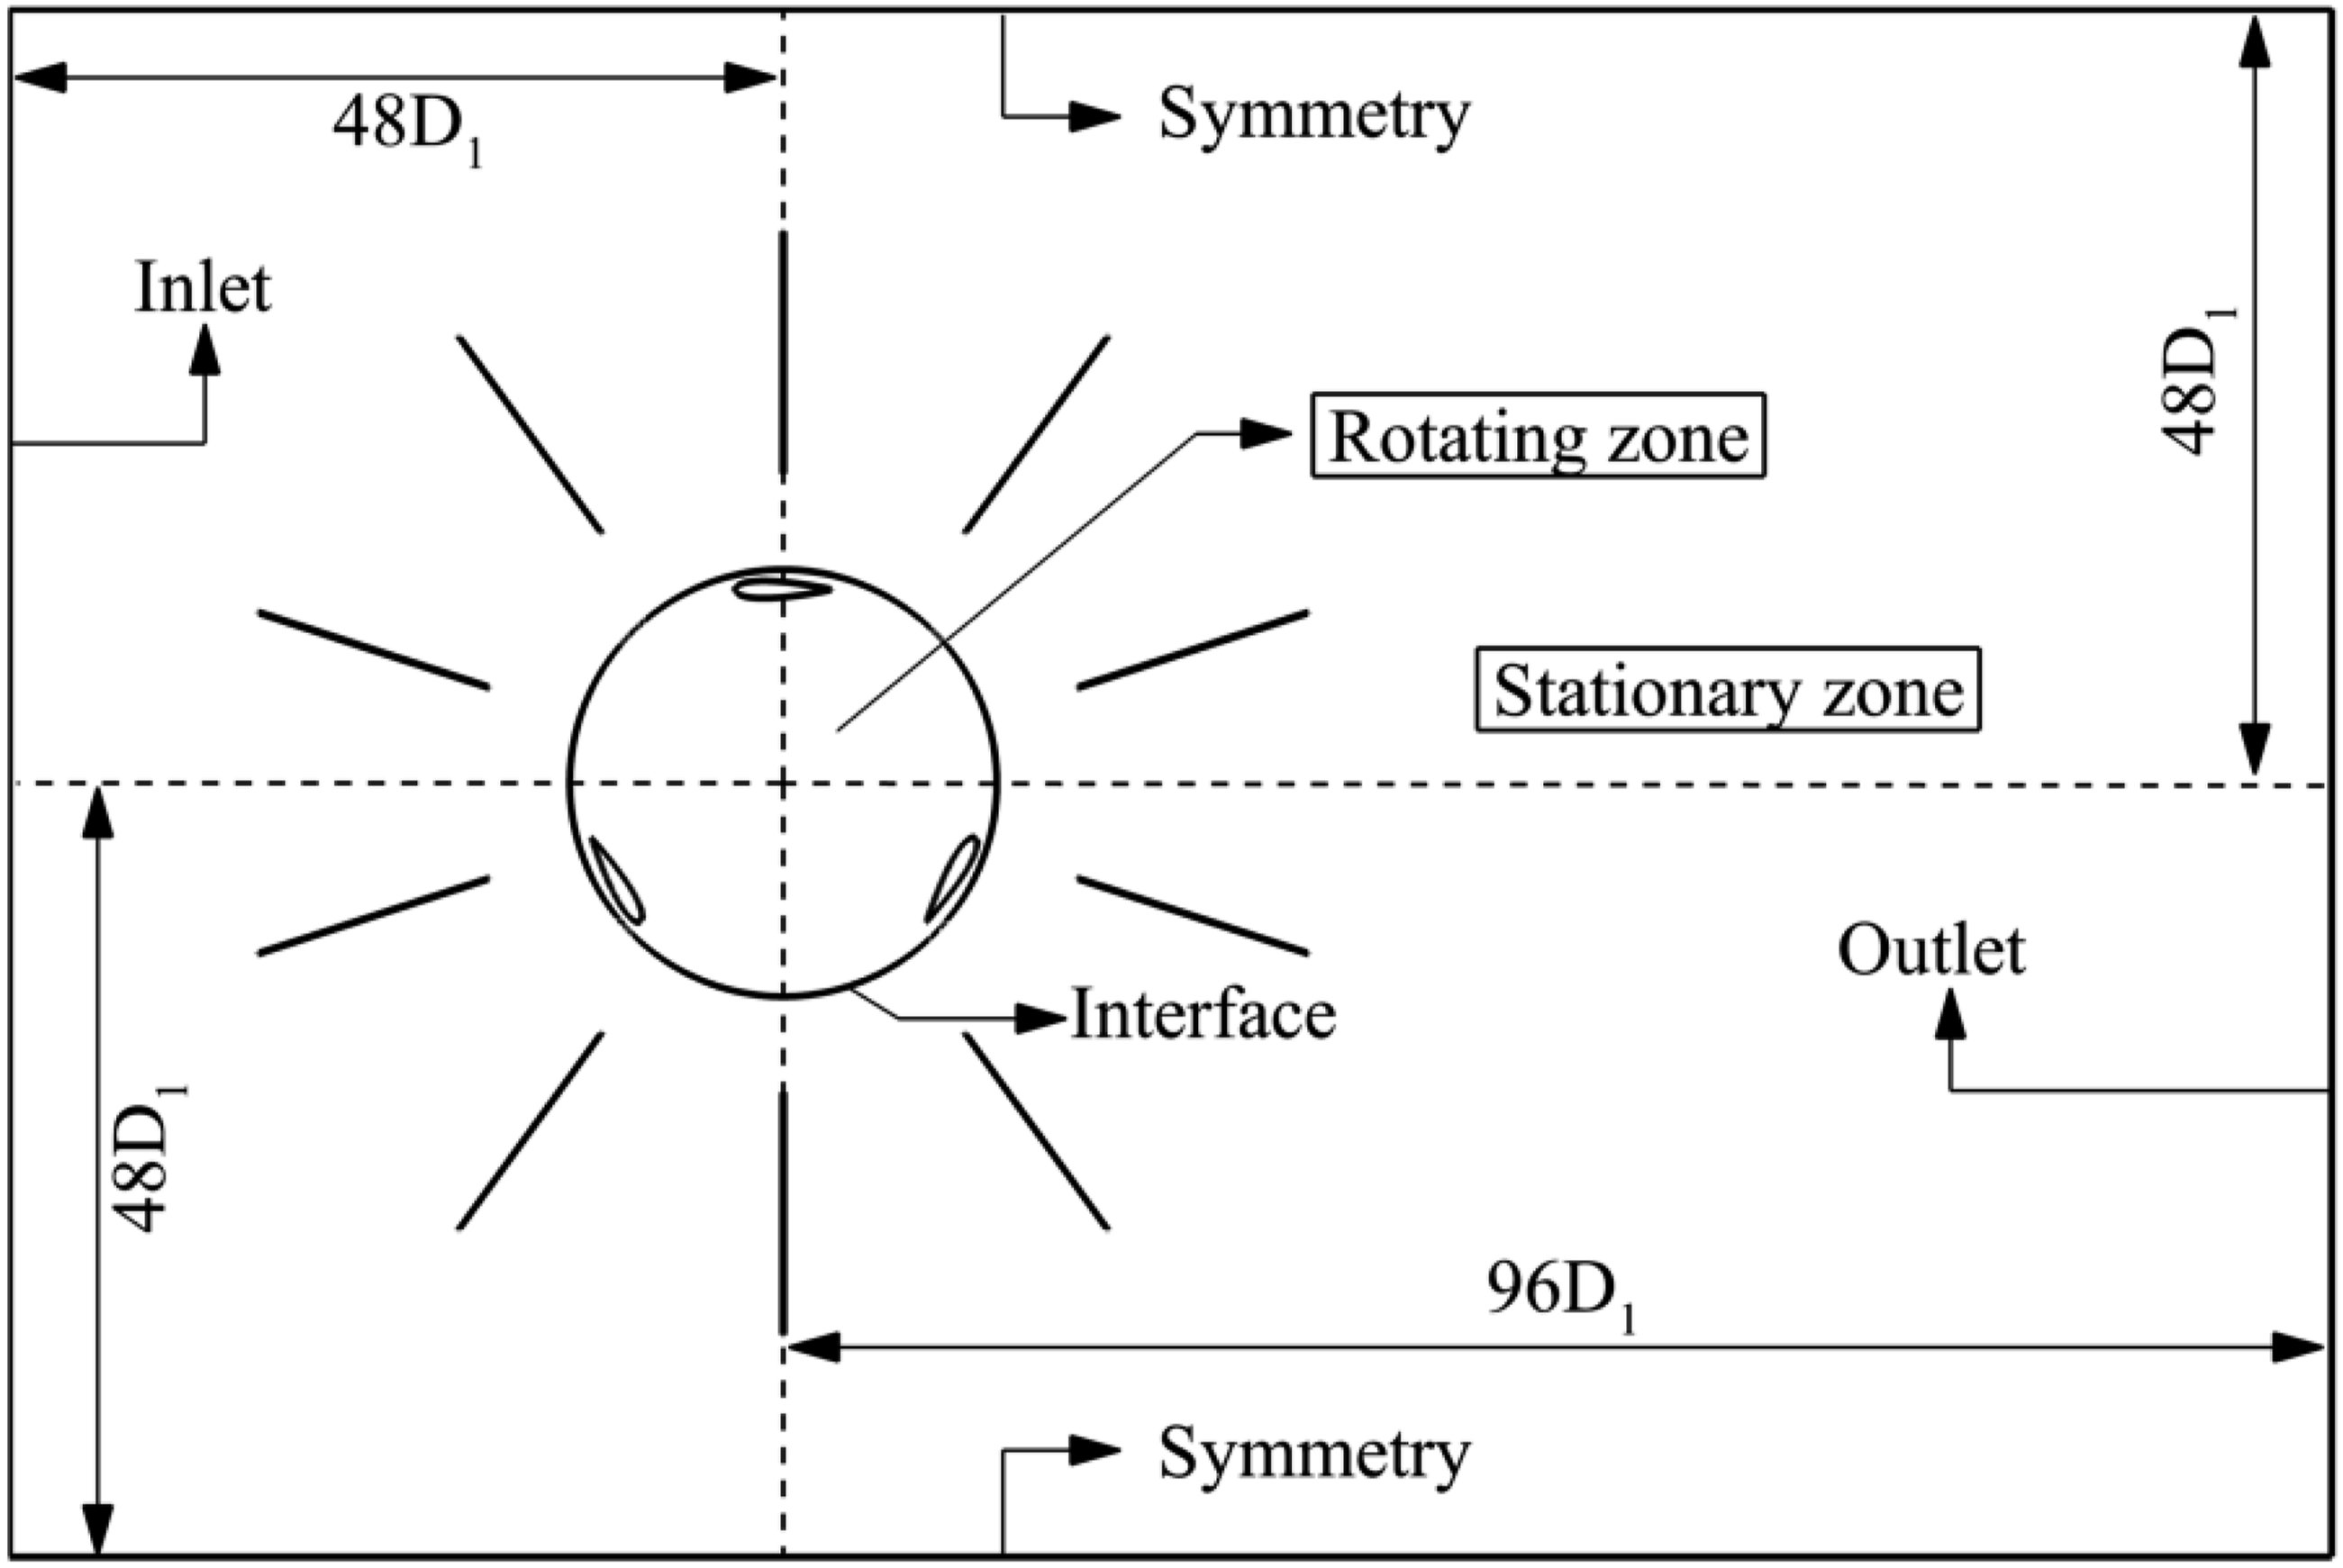
A uniform wind speed of 6 m/s, accompanied by a turbulence intensity of 5%, is assumed at the inlet section. The outlet section is assigned a pressure boundary condition with zero gauge pressure. Symmetric conditions are applied at the side boundaries. A sliding mesh interface boundary condition is established between the rotating and stationary zones. Additionally, a no-slip boundary condition is enforced on the surfaces of the blades and deflector plates.
To study the aerodynamic characteristics of the rotor with and without deflector plates, the Unsteady Reynolds Averaged Navier-Stokes (URANS) equations are used (Asadi and Hassanzadeh, 2022):

To model turbulent flow within the physical domain, the SST k-ω model is utilized. This model combines the standard k-ε and k-ω models and is recommended by most previous studies. The equations related to this turbulence model are stated below (Asadi and Hassanzadeh, 2021):

In the above equations, the first represents the turbulence kinetic energy (k), and the second indicates the specific dissipation rate (ω).
All advection and diffusion terms have been discretized to compute the governing equations, utilizing second-order upwind and central differencing models, respectively. Additionally, a second-order implicit method is employed to discretize the time derivatives. The SIMPLE algorithm (Patankar, 2018) couples the velocity and pressure fields. The convergence criterion for all equations is set to 10-8. To assess the performance of the Darrieus rotor, common relationships such as power coefficient, torque coefficient, and TSR are used as follows (Asadi and Hassanzadeh, 2024):


Some simulations were run on a computer equipped with Intel Xeon Gold 6248 processors (2.5 GHz, 24 threads) and 16 GB RAM. Others were conducted on an Intel Xeon E5-2690 v3 (2.6 GHz, 20 threads) with 16 GB RAM, for typical cases (e.g., 1,036,153 grid cells, 90,000 time steps, 1,800,000 iterations). On average, these simulations required 1 week of CPU time on five threads and 4 weeks of CPU time on 20 threads, respectively.
Sensitivity to grid distribution in the computational domain
The quality of the computational grids used, especially in areas that directly impact numerical simulation results, is very important. To ensure sufficient solution accuracy, it is necessary to assess various grid resolutions throughout the computational domain, confirming that the final results are not dependent on mesh refinement. In this study, an analysis of grid independence was conducted for a conventional rotor without flat plate deflectors, followed by a sensitivity analysis for two rotor types, one with and one without flat plate deflectors. The purpose of this analysis is to verify that simulation results remain relatively unaffected by grid resolution, indicating grid independence. To achieve this, several grid resolutions were simulated individually under the same flow conditions for each scenario, and the differences in CP outputs were measured. Once the difference between consecutive grid resolutions was found to be less than 2%, the final grid was chosen. The detailed grid distribution across the computational domain is illustrated in Figure 3, showing that the grid is finely resolved in critical areas, such as near the rotor surface, blade surfaces, and trailing edge, to maintain computational accuracy, while coarser resolutions are applied in low-activity regions, like far-field zones, to decrease computational costs. Details of grid distributions inside the physical domain and around the blade and deflector plates.
As shown, fully unstructured grids have been utilized in the rotating zone and around the deflector plates to cover the region surrounding the blades and deflector plates effectively. Meanwhile, structured grids have been employed in the far field to reduce computational time and cost. Additionally, to maintain a maximum y+ of less than one, boundary grids featuring 20 inflation layers have been established around the blades, with the height of the first layer being 7.5 × 10⁻⁵ times the chord length of the blades. The initial challenge in grid distribution within the physical domain is determining an appropriate grid count on the blades. For this purpose, 300, 600, and 1200 grids under TSR = 1.5 are tested on each upper and lower blade surface for the rotor without deflector plates, with 16, 20, and 24 inflation layers, respectively. Figure 4 illustrates the changes in torque coefficient throughout a complete rotor cycle. Conversely, Table 2 displays the same rotor cycle’s mean power coefficient values and maximum y+ values. The results show that the torque coefficient variations for the 600 and 1200 grids align closely, whereas employing 300 grids on each side of the blades leads to a deviation in the torque coefficient variation compared to the 600 grids. The mean power coefficients differ by 5.64% between 300 grids with 24 inflation layers and 600 grids with 20 inflation layers. However, the difference between 600 grids with 20 inflation layers and 1200 grids with 16 inflation layers is under 1%. This indicates that using 600 grids on both the upper and lower sides of the blades with 20 inflation layers yields accurate results, achieving a maximum y+ of 0.882. Thus, this result is applied across all other simulations. Variations of torque coefficient in one completer rotor cycle for various grid numbers on the blades for N = 0. .Effects of the number of grids on each blade on the mean power coefficient and maximum y+ for N = 0 at TSR = 1.5.

Effects of the number of grids on the interface on the mean power coefficient for N = 0 and 10 at TSR = 1.5.

Sensitivity to flow domain size
The dimensions of the computational domain must be sufficiently large to prevent any boundary effects on the results. To clarify this significant issue, this study compares three domain sizes for the rotor with N = 0: 18D1 × 12D1, 36D1 × 24D1, and 54D1 × 36D1, while maintaining a TSR of 1.5. Figure 5 illustrates the torque coefficient variations for these three domain sizes across one rotor cycle. Notably, there are substantial differences between the small and moderate domain sizes, whereas the torque values at all azimuth angles show negligible variations between the moderate and large domain sizes. Additionally, Table 4 shows a 4.93% error in mean power coefficients when comparing the small and moderate domain sizes, which decreases to 1.94% between the moderate and large domain sizes. Therefore, to minimize computational time and costs, a domain size of 36D1 × 24D1 is chosen for the case with N = 0. However, it should be noted that for all cases with N ≠ 0, a computational domain size of 144D1 × 96D1 is selected, close to the applied domain sizes in similar previous studies (Ansaf et al., 2023; Sathiyamoorthy et al., 2021) based on the outer diameter of the deflector plates. Variations of torque coefficient in one complete rotor cycle for various flow domain sizes at N = 0 and TSR = 1.5. Effects of flow domain size on the mean power coefficient for N = 0 at TSR = 1.5.

Sensitivity to rotating zone diameter
Another factor influencing the results is the diameter of the rotating zone. This study assesses different rotating zone diameters: 1.1D1, 1.5D1, and 2.0D1 for N = 0, and 1.1D1 and 1.5D1 for N = 10 at TSR = 1.5. The results for both scenarios are illustrated in Figure 6 and Table 5. Analyzing the variations in the torque coefficient over a complete rotor cycle reveals that for N = 0, the data associated with the three rotating zones are closely aligned. The mean power coefficients indicate the same values for 1.1D1 and 1.5D1 and 0.32% between 1.5D1 and 2.0D1. Therefore, the rotating zone diameter of 1.1D1 is used for N = 0. For N = 10, despite minor differences in torque coefficients at specific azimuth angles between 1.1D1 and 1.5D1, the mean power coefficients show only a 0.37% difference. Consequently, 1.1D1 is also chosen for N = 10 and applies to all cases with N ≠ 0. Variations of torque coefficient in one completer rotor cycle for various rotating zone diameters at N = 0 and 10 under TSR = 1.5. Effects of rotating zone diameter on the mean power coefficient for N = 0 and 10 at TSR = 1.5.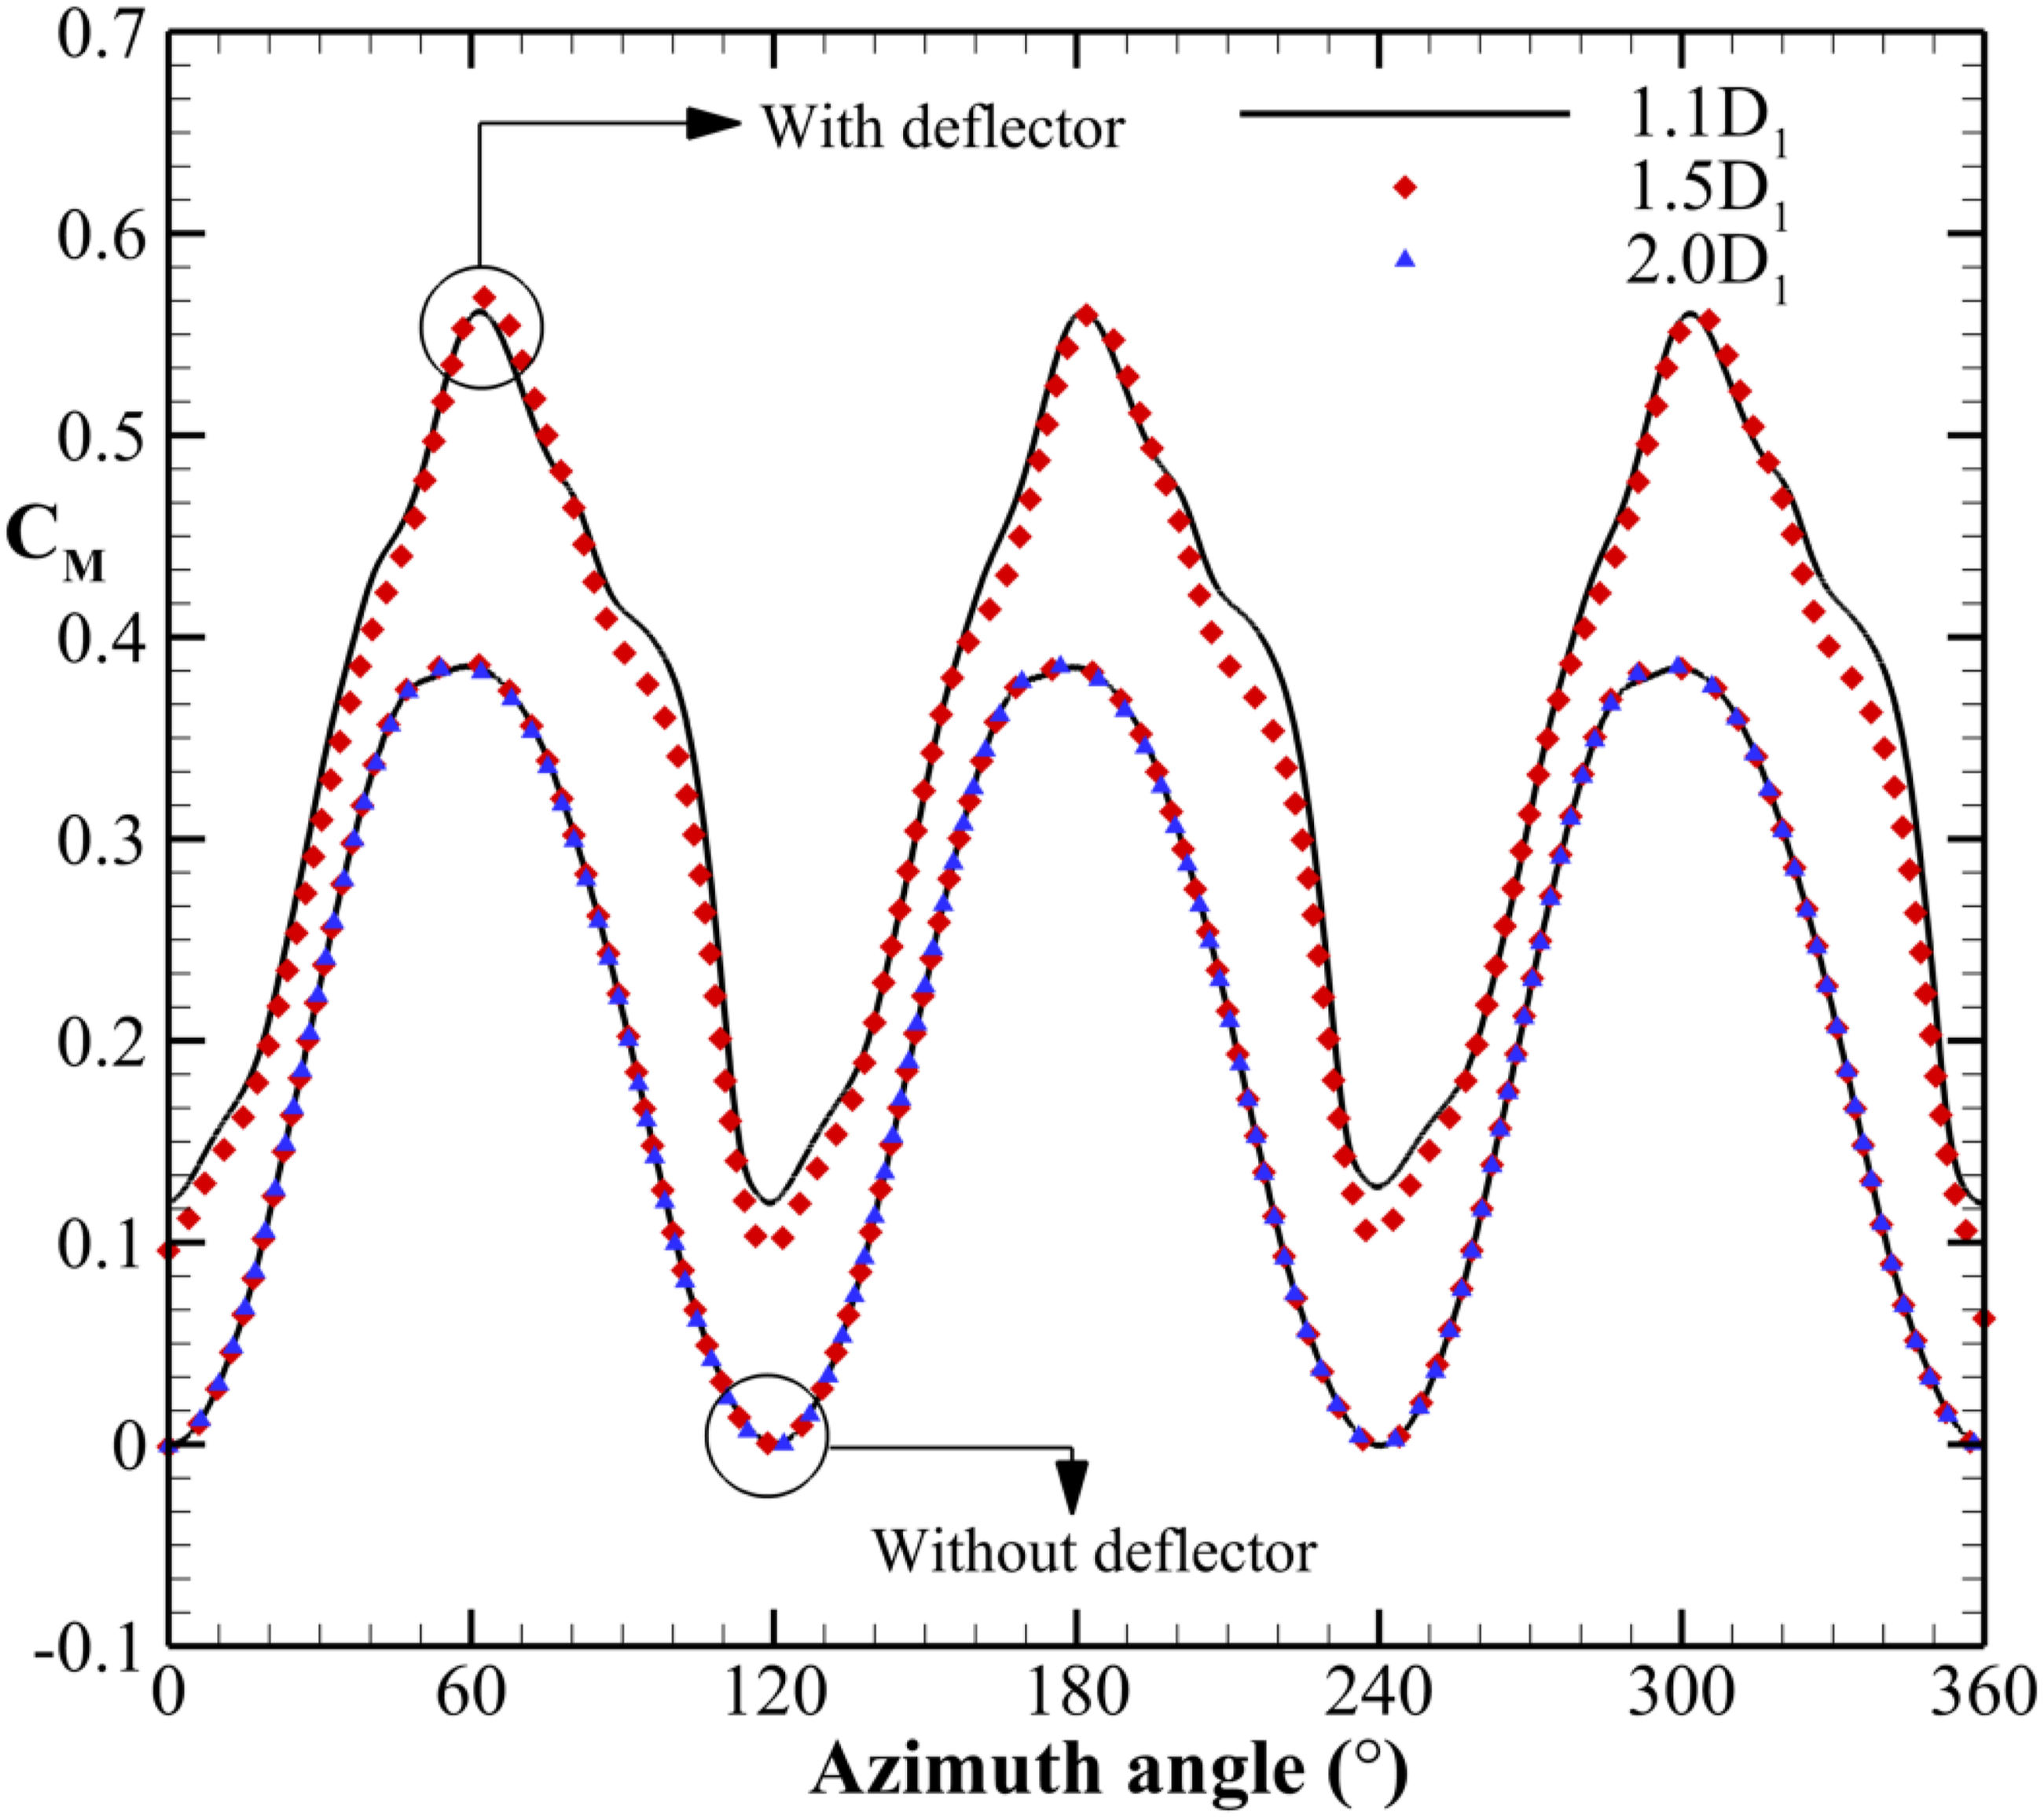

Sensitivity to time step size
The size of the time step has a significant impact on computational time and costs. In a wind turbine simulation, the time step size is typically selected as a specific fraction of the rotor’s revolution, referred to as the azimuthal increment. This study conducted a sensitivity analysis to determine an appropriate time step size, considering three azimuthal increments of 0.2°, 0.4°, and 1.0° for both scenarios with and without deflector plates under TSR = 1.5. Figure 7 illustrates the variations in torque coefficient over one rotor cycle for both scenarios at the three azimuthal increments. The results reveal that using a 1.0° azimuthal increment significantly alters the results for both cases compared to a 0.4° increment. However, the discrepancies in torque coefficient variations are minimized between the 0.4° and 0.2° azimuthal increments in both scenarios. Furthermore, based on the mean power coefficients shown in Table 6, it is noted that for N = 0, there is a 6.70% deviation between 1.0° and 0.4° and a 1.63% deviation between 0.4° and 0.2°. The corresponding errors for N = 10 are 11.86% and 1.30%. Therefore, an azimuthal increment of 0.4° has been used for all cases, both with and without deflector plates. Variations of torque coefficient in one complete rotor cycle for various azimuthal increments at N = 0 and 10 under TSR = 1.5. Effects of time step on the mean power coefficient for N = 0 and 10 at TSR = 1.5.

Validation
The analysis of the results obtained in this study provides a thorough validation of the numerical method employed. Specifically, the results for the parameter N = 0 are systematically compared with data extracted from previous research in the field. This critical examination is visually represented in Figure 8, where the mean power coefficient is plotted as a function of TSR. In Figure 8, the horizontal axis represents the TSR values, while the vertical axis indicates the corresponding mean power coefficients. The data points from this study are clearly illustrated alongside those from previous studies, allowing for direct visual comparison. Upon analyzing the data, it becomes apparent that the results from this study demonstrate a notable alignment with the findings reported in earlier research. This close agreement validates the numerical method used and reinforces the consistency of the results across studies. Overall, Figure 8 provides a comprehensive illustration of the relationship between the mean power coefficient and TSR, highlighting the reliability and accuracy of the findings in this current investigation when compared to established data (Acosta-López et al., 2023; Bangga et al., 2021; Elkhoury et al., 2015). Validation of mean power coefficient at different TSR values for N = 0 with available experimental and numerical data.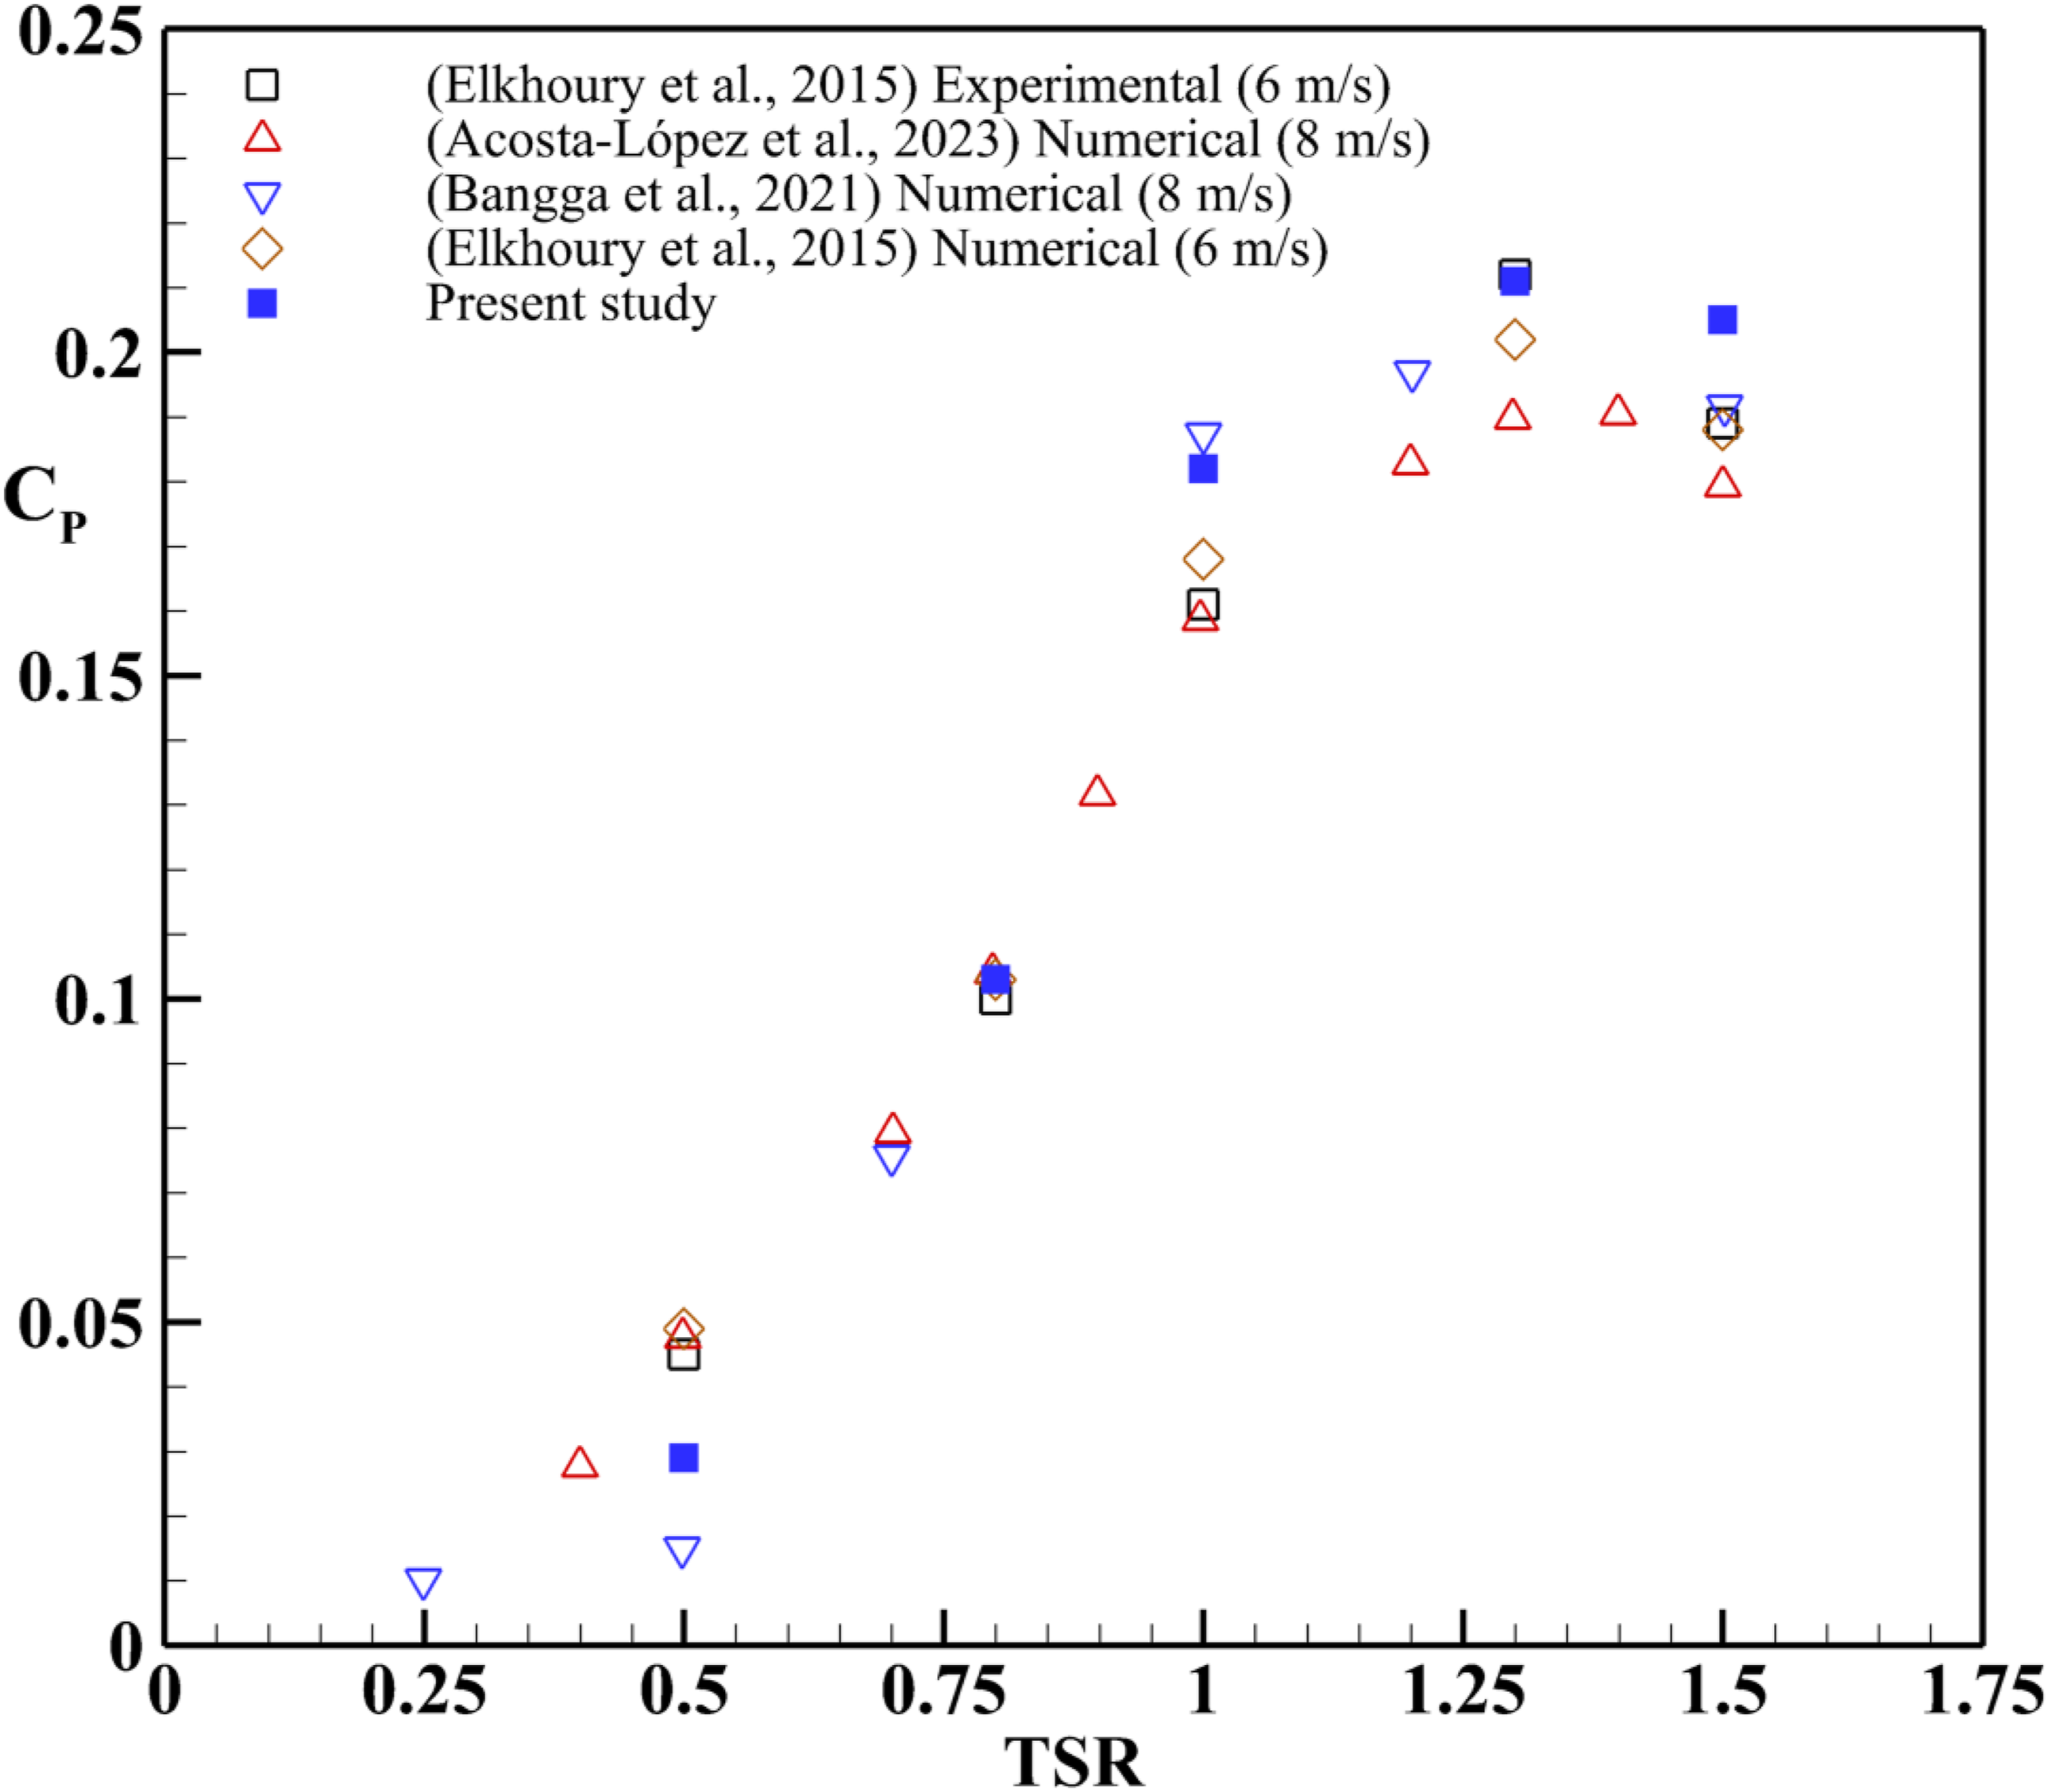
Investigating quasi-steady condition and the mean data calculation process
To ensure the results are sufficiently accurate, verifying the convergence of the numerical solution outcomes is essential. To achieve this, the variations of instantaneous and mean power coefficients over several cycles have been separately assessed for scenarios with and without deflector plates. Figures 9(a) and (b) illustrate the changes in instantaneous and mean power coefficients at TSR = 1.5 for N = 0 and 10, respectively. In the case of N = 0, 20 consecutive revolutions are analyzed. It is observed that following initial fluctuations in the power coefficient, the rotor displays a cyclic instantaneous behavior, as shown in Figure 9(a). Further analysis of the mean power coefficient during each revolution indicates that after the 13th revolution, deviations in the mean power coefficient decreased to less than 2%. However, the data for the 20th revolution is collected for N = 0 to enhance accuracy. Time histories of instantaneous power coefficient at TSR = 1.5; (a) N = 0 and (b) N = 10.
In the case of N = 10 and TSR = 1.5, as illustrated in Figure 9(b), the quasi-steady condition becomes complicated due to the high level of interactions between the approaching flow and the deflector plates. This means additional consecutive revolutions are necessary to achieve a quasi-steady condition with deflector plates. Thus, the solution is extended up to 100 revolutions, as shown in Figure 9(b). To minimize computational costs, the first 50 revolutions are computed with an azimuthal increment of 1.0°, while the azimuthal increment for the subsequent 50 revolutions is set at 0.4°. Regarding the second set of 50 revolutions, it is evident that averaging for a single rotor cycle does not yield an accurate power coefficient due to substantial variations among the cycles. Consequently, averaging over 20 consecutive revolutions results in a consistent mean power coefficient. Therefore, this averaging method is applied to all cases with N ≠ 0. It is essential to note that the number of averaging revolutions is significantly influenced by the TSR, resulting in varying numbers of revolutions used to average the power characteristics at different TSR values. A similar approach was employed by Kerikous and Thévenin (Kerikous and Thévenin, 2019).
Results and discussions
This study compares the performance of a Darrieus wind turbine with deflector plates against a baseline case across three different TSR values: 0.5, 1.5, and 2.5. To enhance understanding of the turbine’s performance with deflector plates, the instantaneous fields of normalized velocity magnitude and the instantaneous fields of normalized vorticity magnitude are analyzed. Furthermore, the torque distribution throughout a complete revolution relative to the azimuth angle is illustrated.
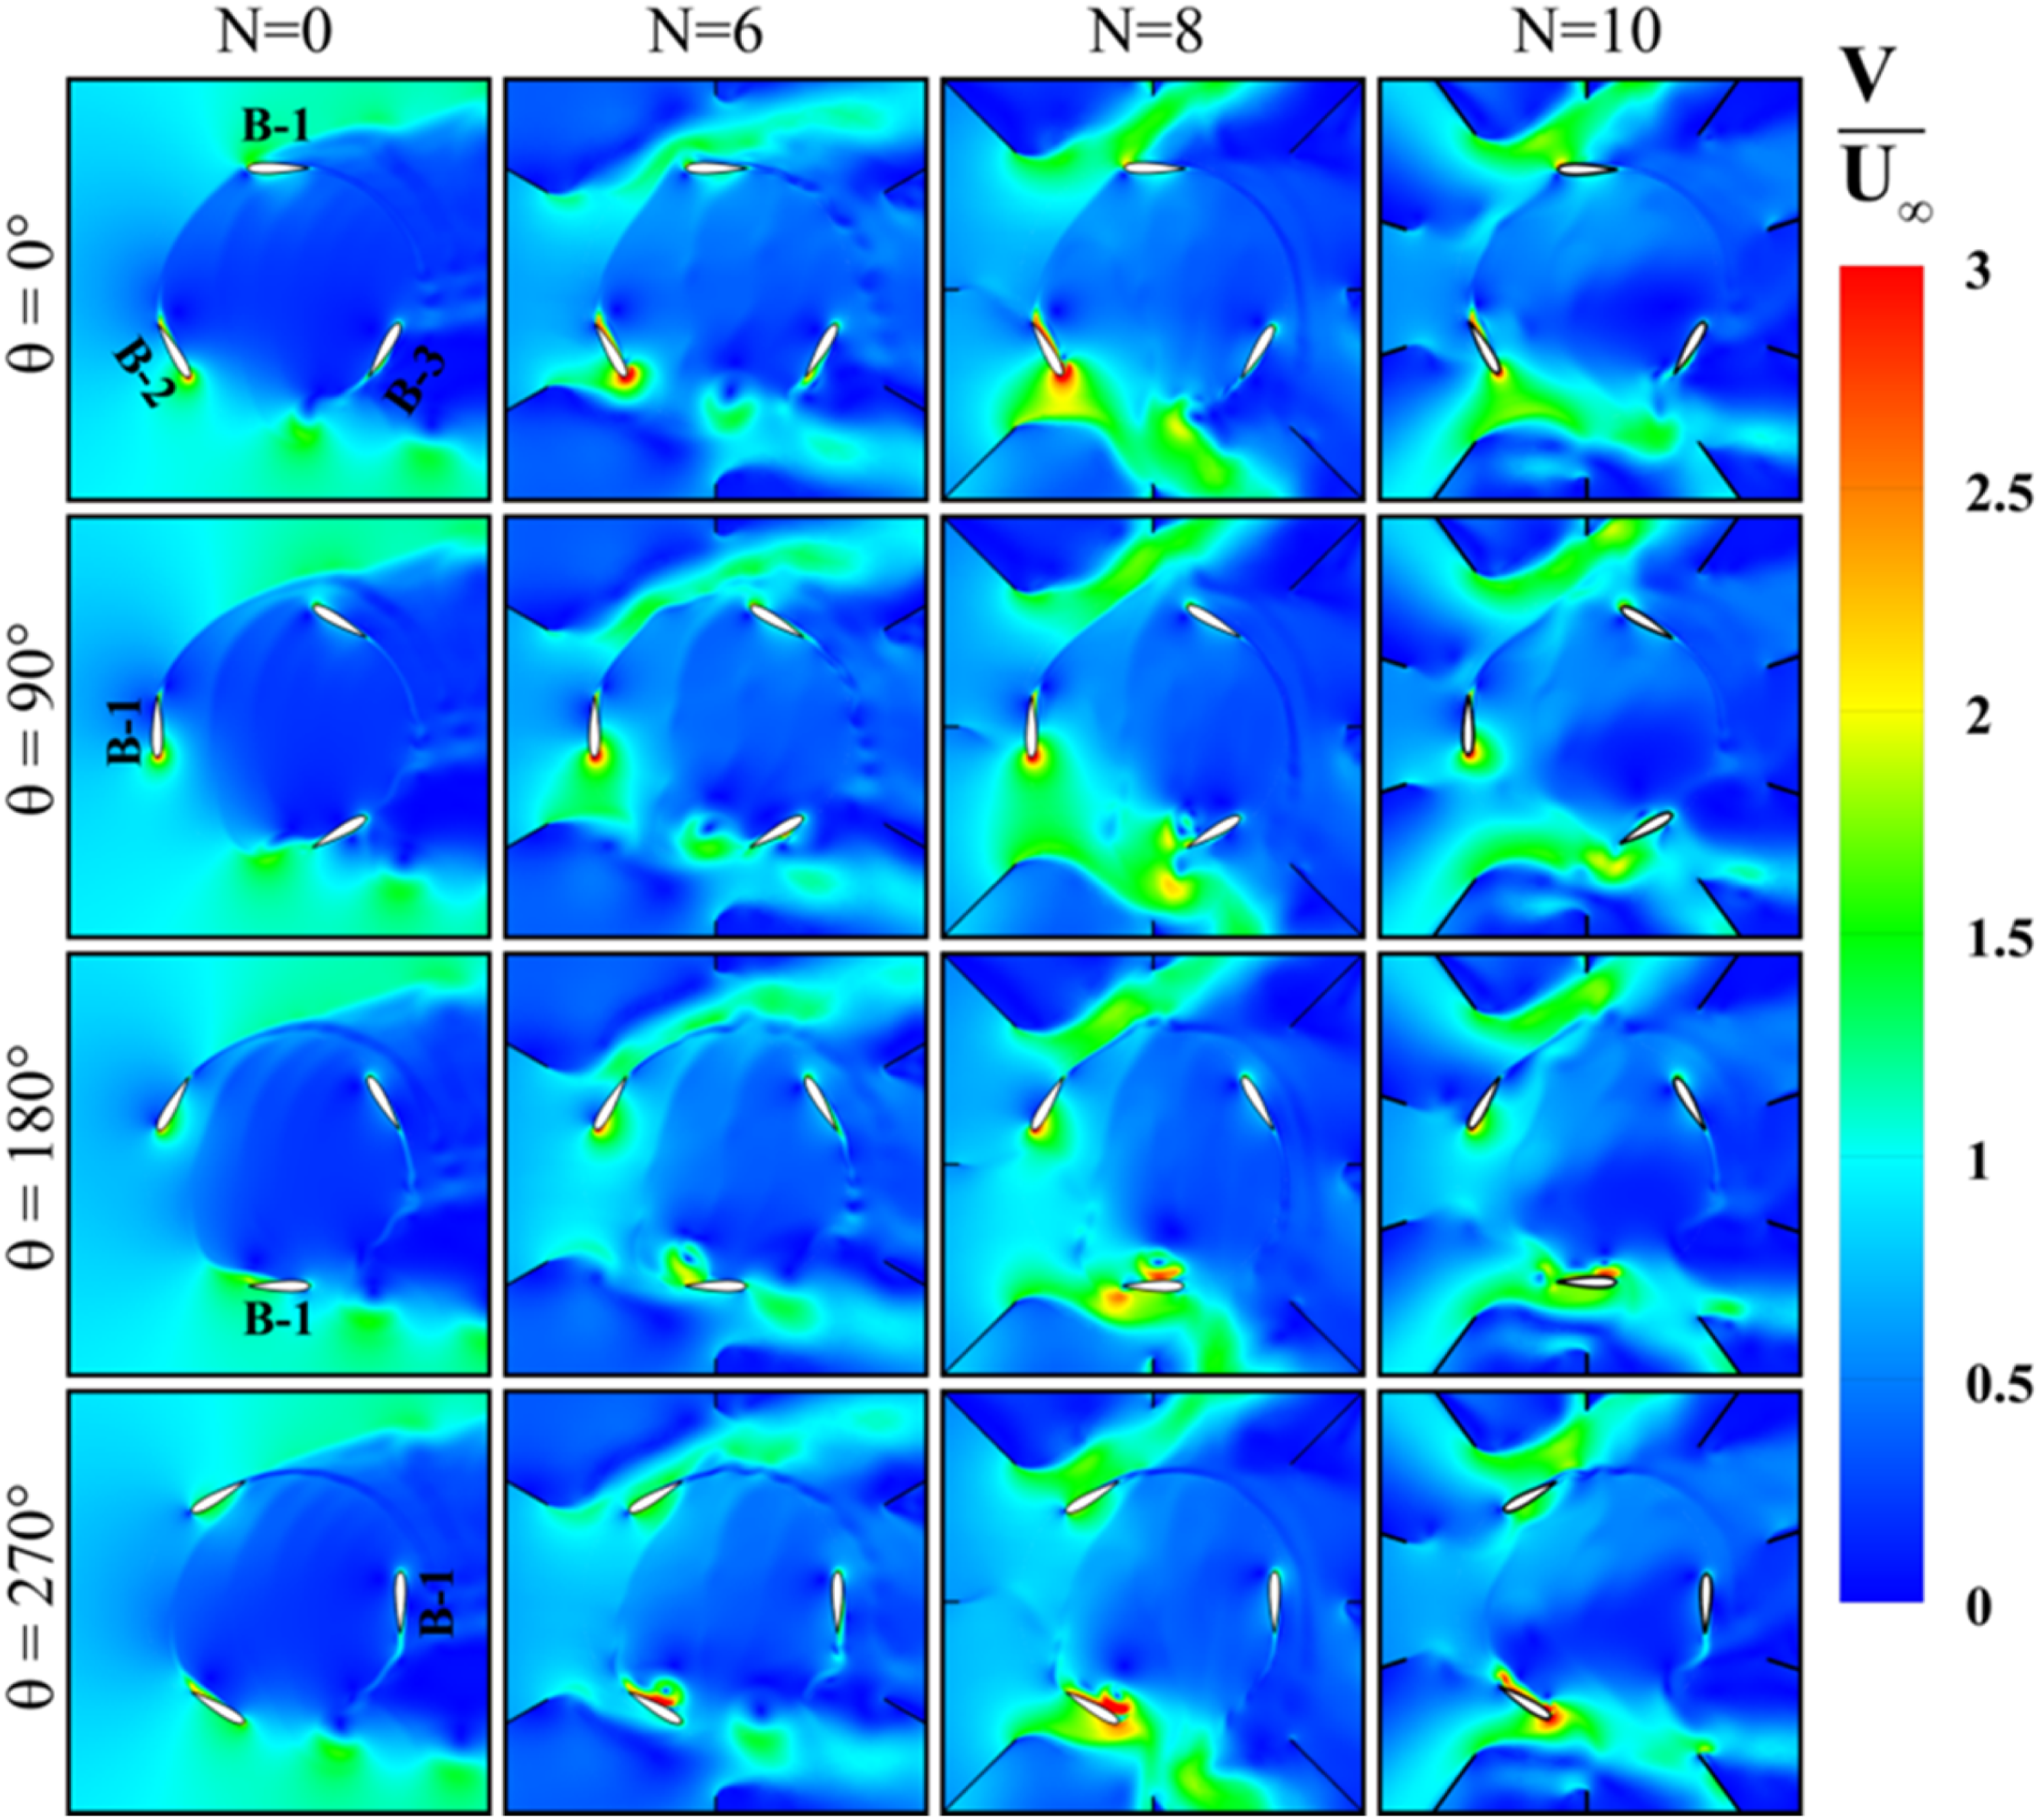
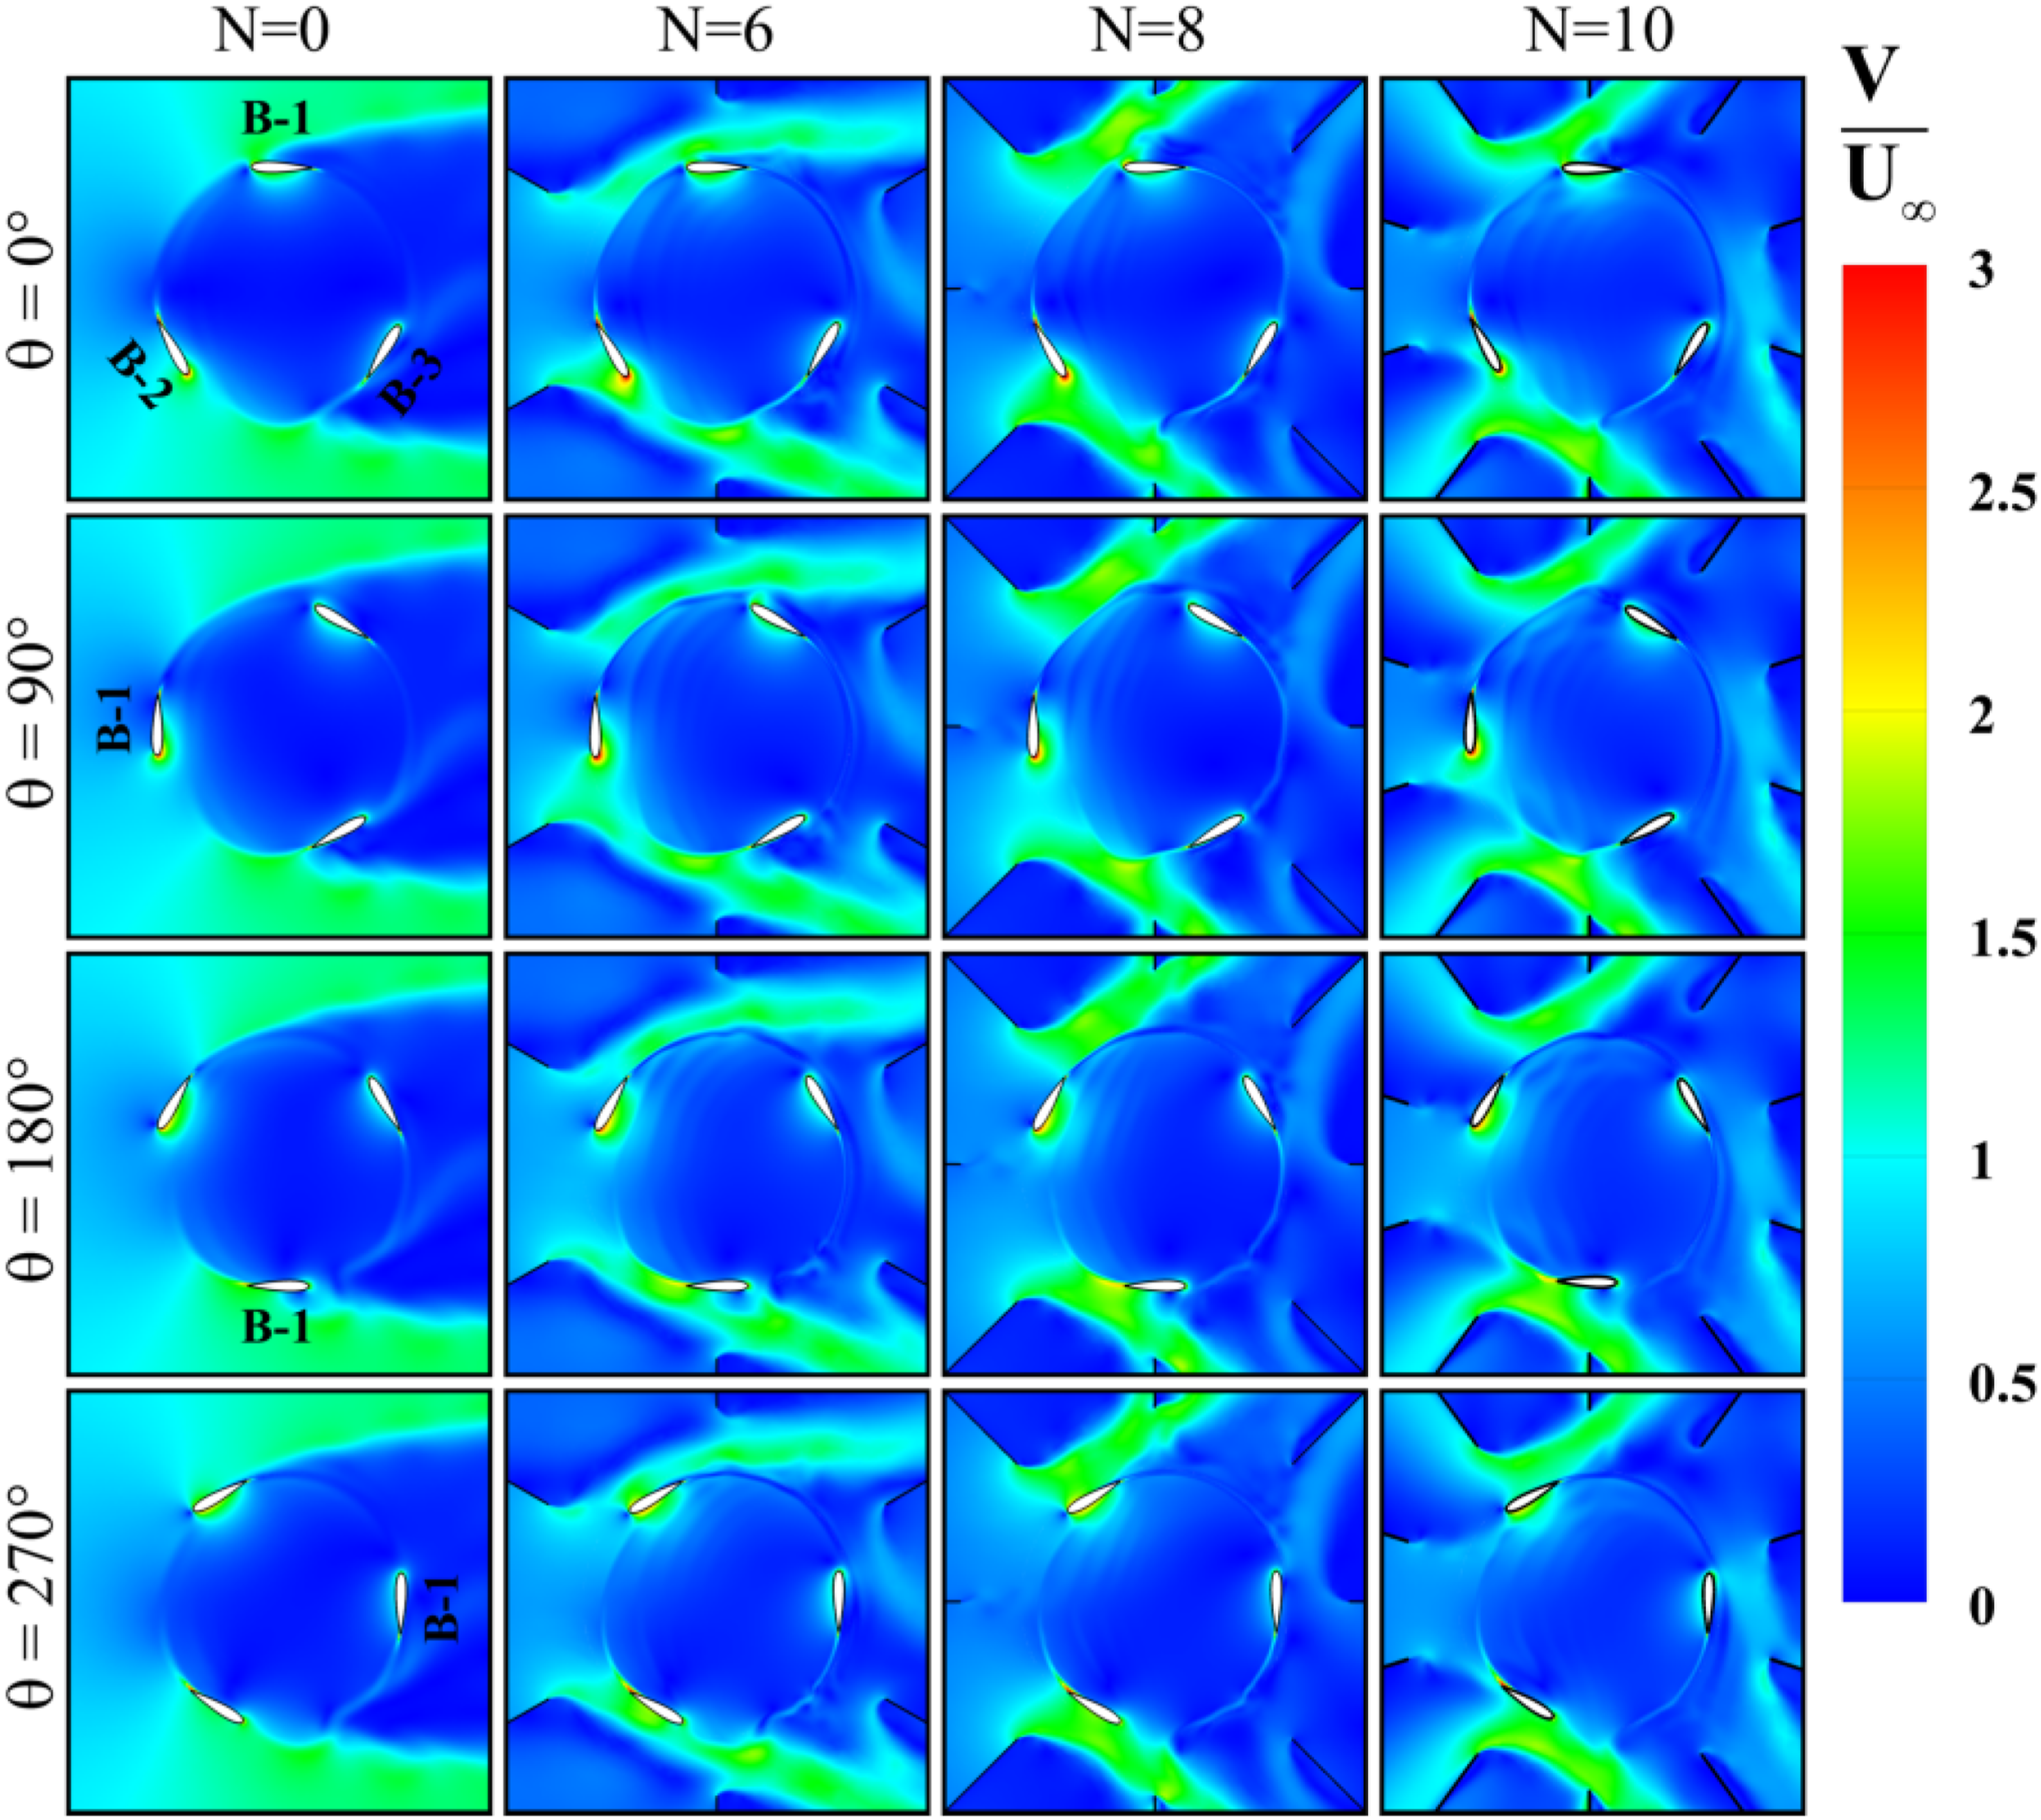
Figures 10−12 compare the instantaneous fields of normalized velocity magnitude for TSR values of 0.5, 1.5, and 2.5 at selected azimuth angles, including 0°, 90°, 180°, and 270°, for a conventional rotor with and without deflector plates. In this context, the velocity magnitudes are normalized using free-wind speed. The main function of deflector plates installed around the turbine is to enhance incoming airflow and guide it towards the turbine blades. This is especially beneficial in regions with low wind potential, where Darrieus turbines encounter significant challenges in self-starting. Darrieus turbines struggle with self-starting due to low driving torque at reduced wind speeds and increased resistance during the initial rotation phase. Deflector plates assist by boosting airflow velocity in the blade area and minimizing flow separation, which in turn decreases the wind speed needed to start rotation, thereby aiding in self-starting. Deflector plates mainly enhance the rotor’s power characteristics in regions with adequate wind potential. At all azimuth angles, compared to the case without deflector plates (N = 0), deflector plates around the rotor significantly improve the velocity field inside the rotor. It is known that at a low TSR value, the fluid rotating zone around the rotor, developed by rotor revolution, is weak. Therefore, the injected airflow into the rotor remains high regardless of the number of deflector plates. Increasing the TSR value enhances the fluid rotating zone around the rotor; hence, the amount of injected airflow into the rotor diminishes correspondingly. In this situation, most of the airflow captured by the plates is deflected sideways, as shown in Figure 13. With this background, as shown in Figures 10–13, the velocity field inside the rotor increases inversely with the TSR, regardless of the azimuth angle or the number of deflector plates. For all TSR values and azimuth angles, the momentum transfer within the rotor peaks at N = 8, indicating this configuration’s superior performance in redirecting the incoming flow into the rotor compared to the others. At a zero azimuth angle, the first and second blades move through a higher velocity field in all cases where N ≠ 0 compared to the case with N = 0. At a 90° azimuth angle, while the velocity field around the third blade is poor for N = 0, a significant improvement in the velocity field around this blade is observed for the cases with deflector plates. By tracking the rotor position up to 180°, it is evident that the flow around the second and last blades improves significantly for cases with N ≠ 0 compared to the scenario with N = 0. At a 270° azimuth angle, the second blade performs optimally when deflector blades are used, unlike a case without these plates. Consequently, using flat deflector plates around a conventional three-bladed Darrieus rotor enhances the velocity field surrounding specific blades, depending on the azimuth angle, regardless of the number of deflector plates and TSR values involved. Instantaneous fields of normalized velocity magnitude at selected azimuth angles for N = 0, 6, 8, and 10 under TSR = 0.5. Instantaneous fields of normalized velocity magnitude at selected azimuth angles for N = 0, 6, 8, and 10 under TSR = 1.5. Instantaneous fields of normalized velocity magnitude at selected azimuth angles for N = 0, 6, 8, and 10 under TSR = 2.5. Instantaneous fields of normalized vorticity magnitude at selected azimuth angles for N = 0, 6, 8, and 10 under TSR = 0.5.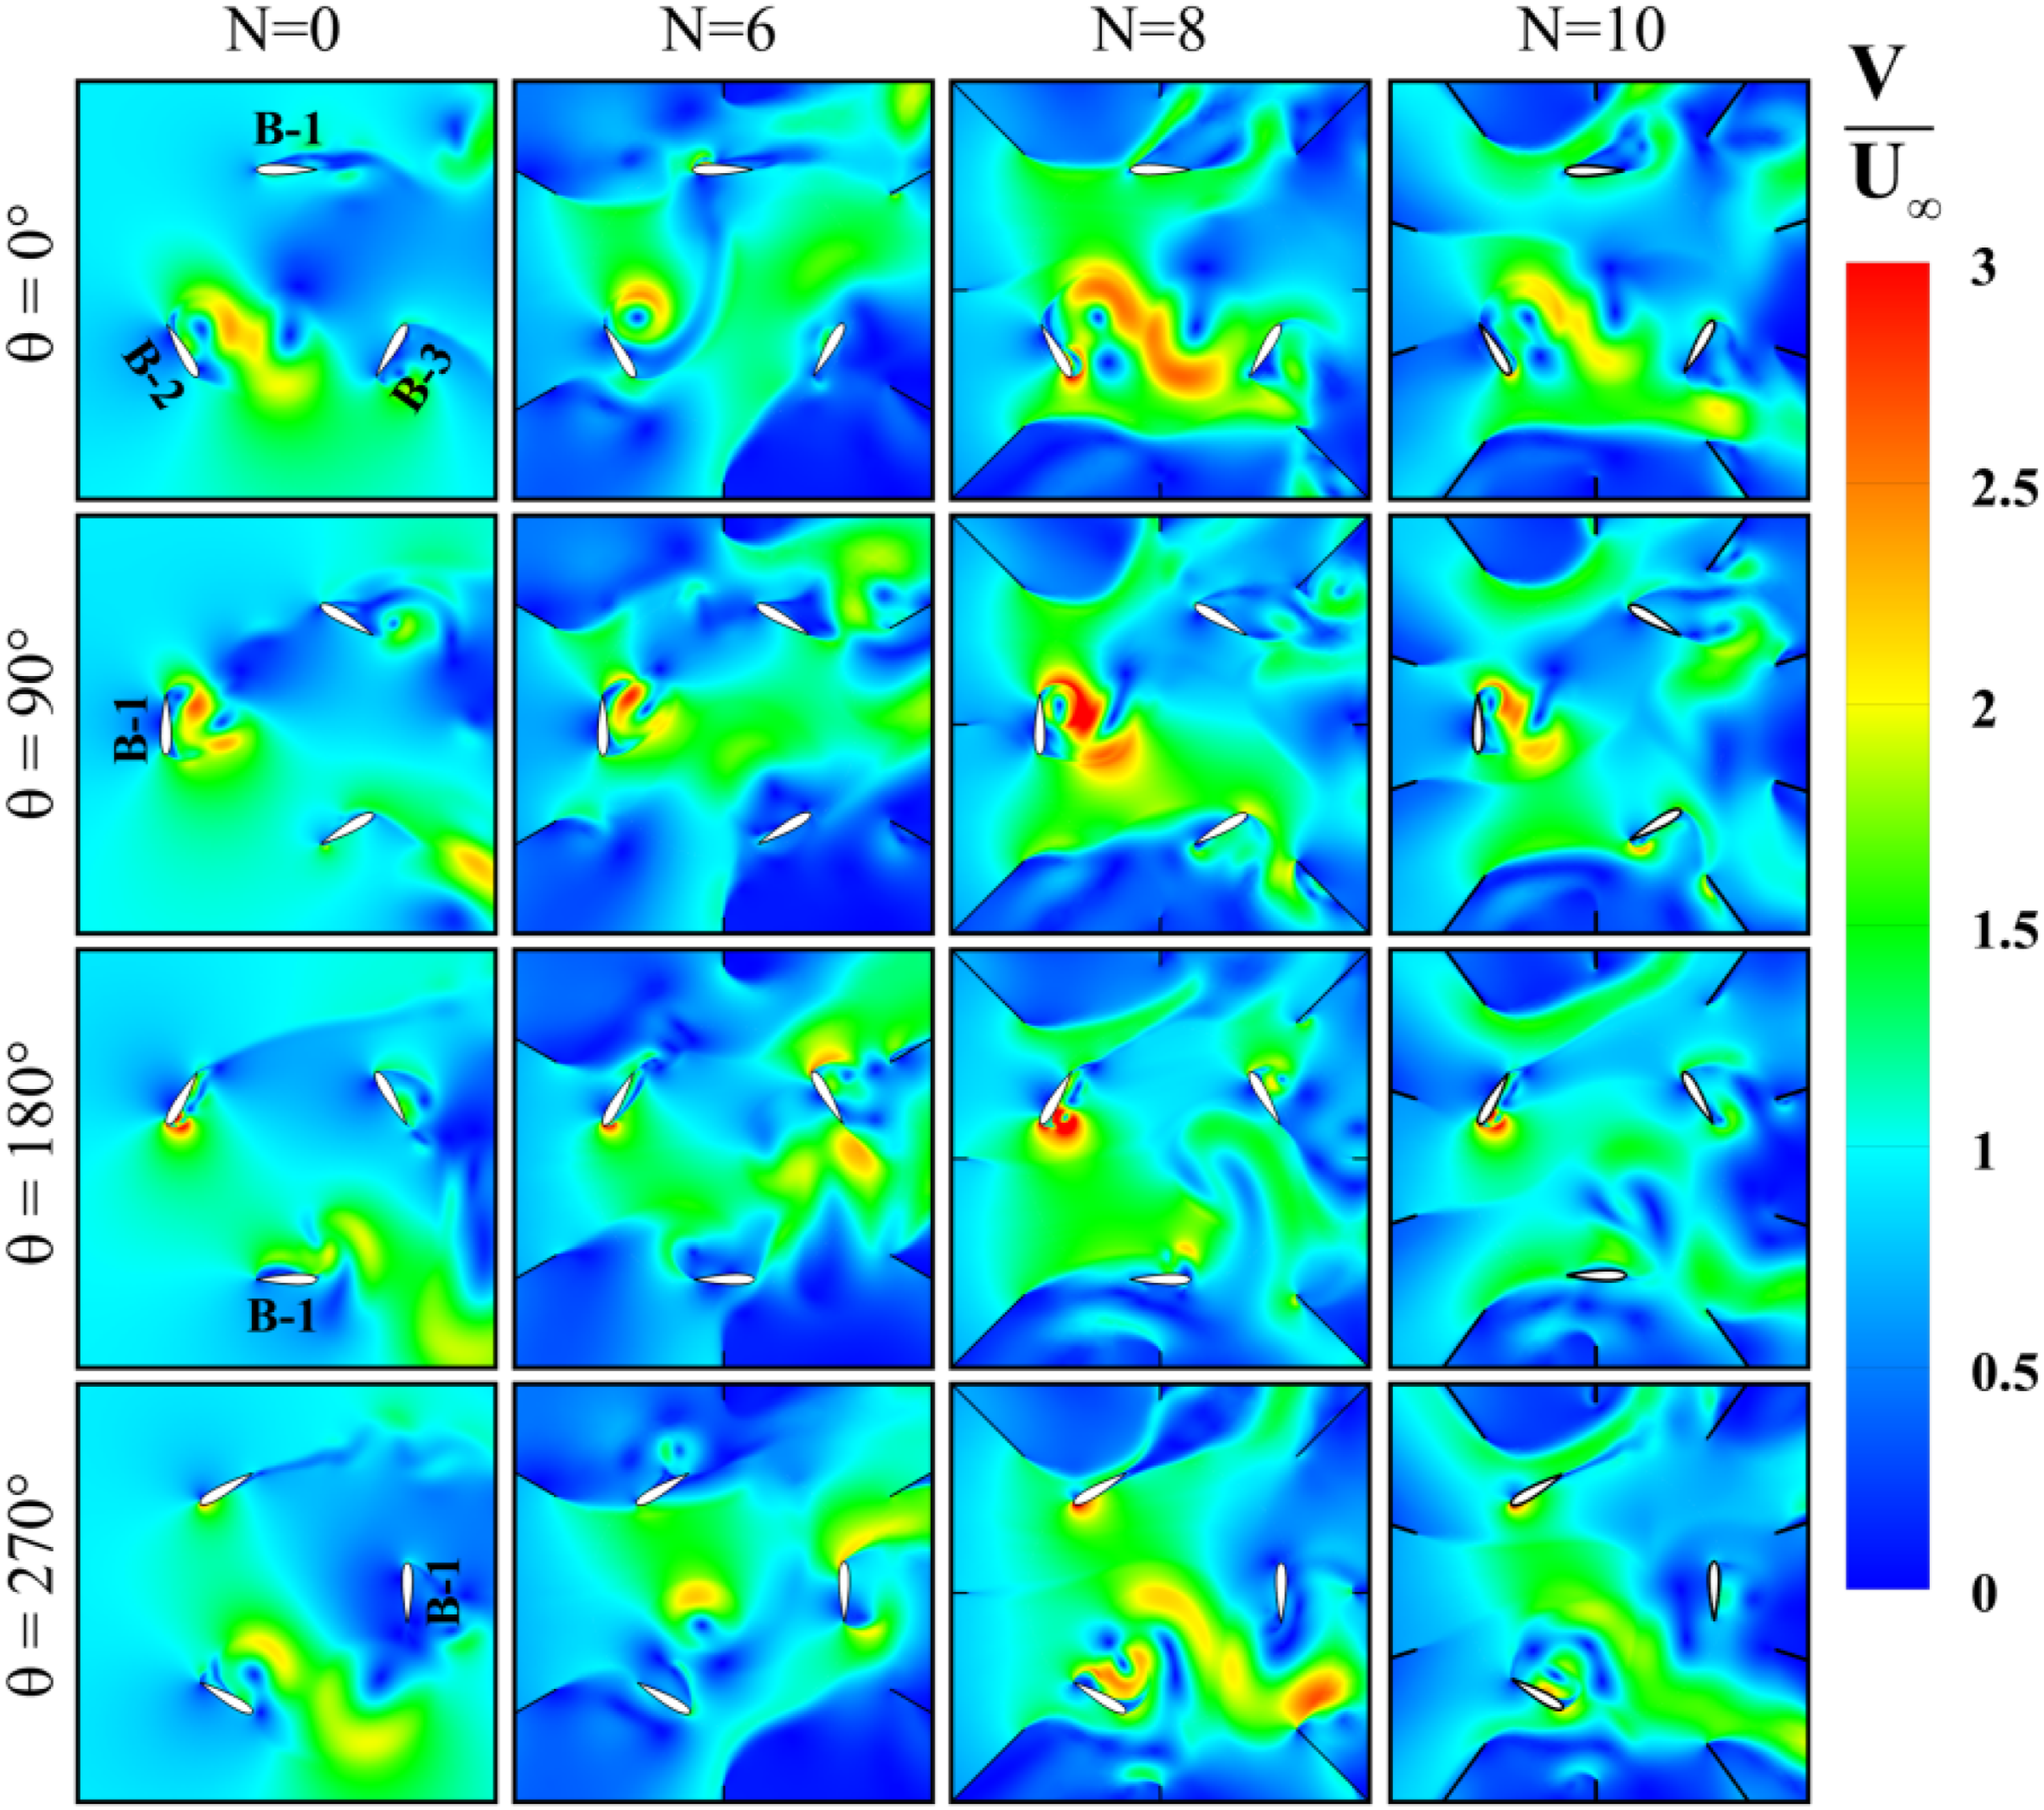
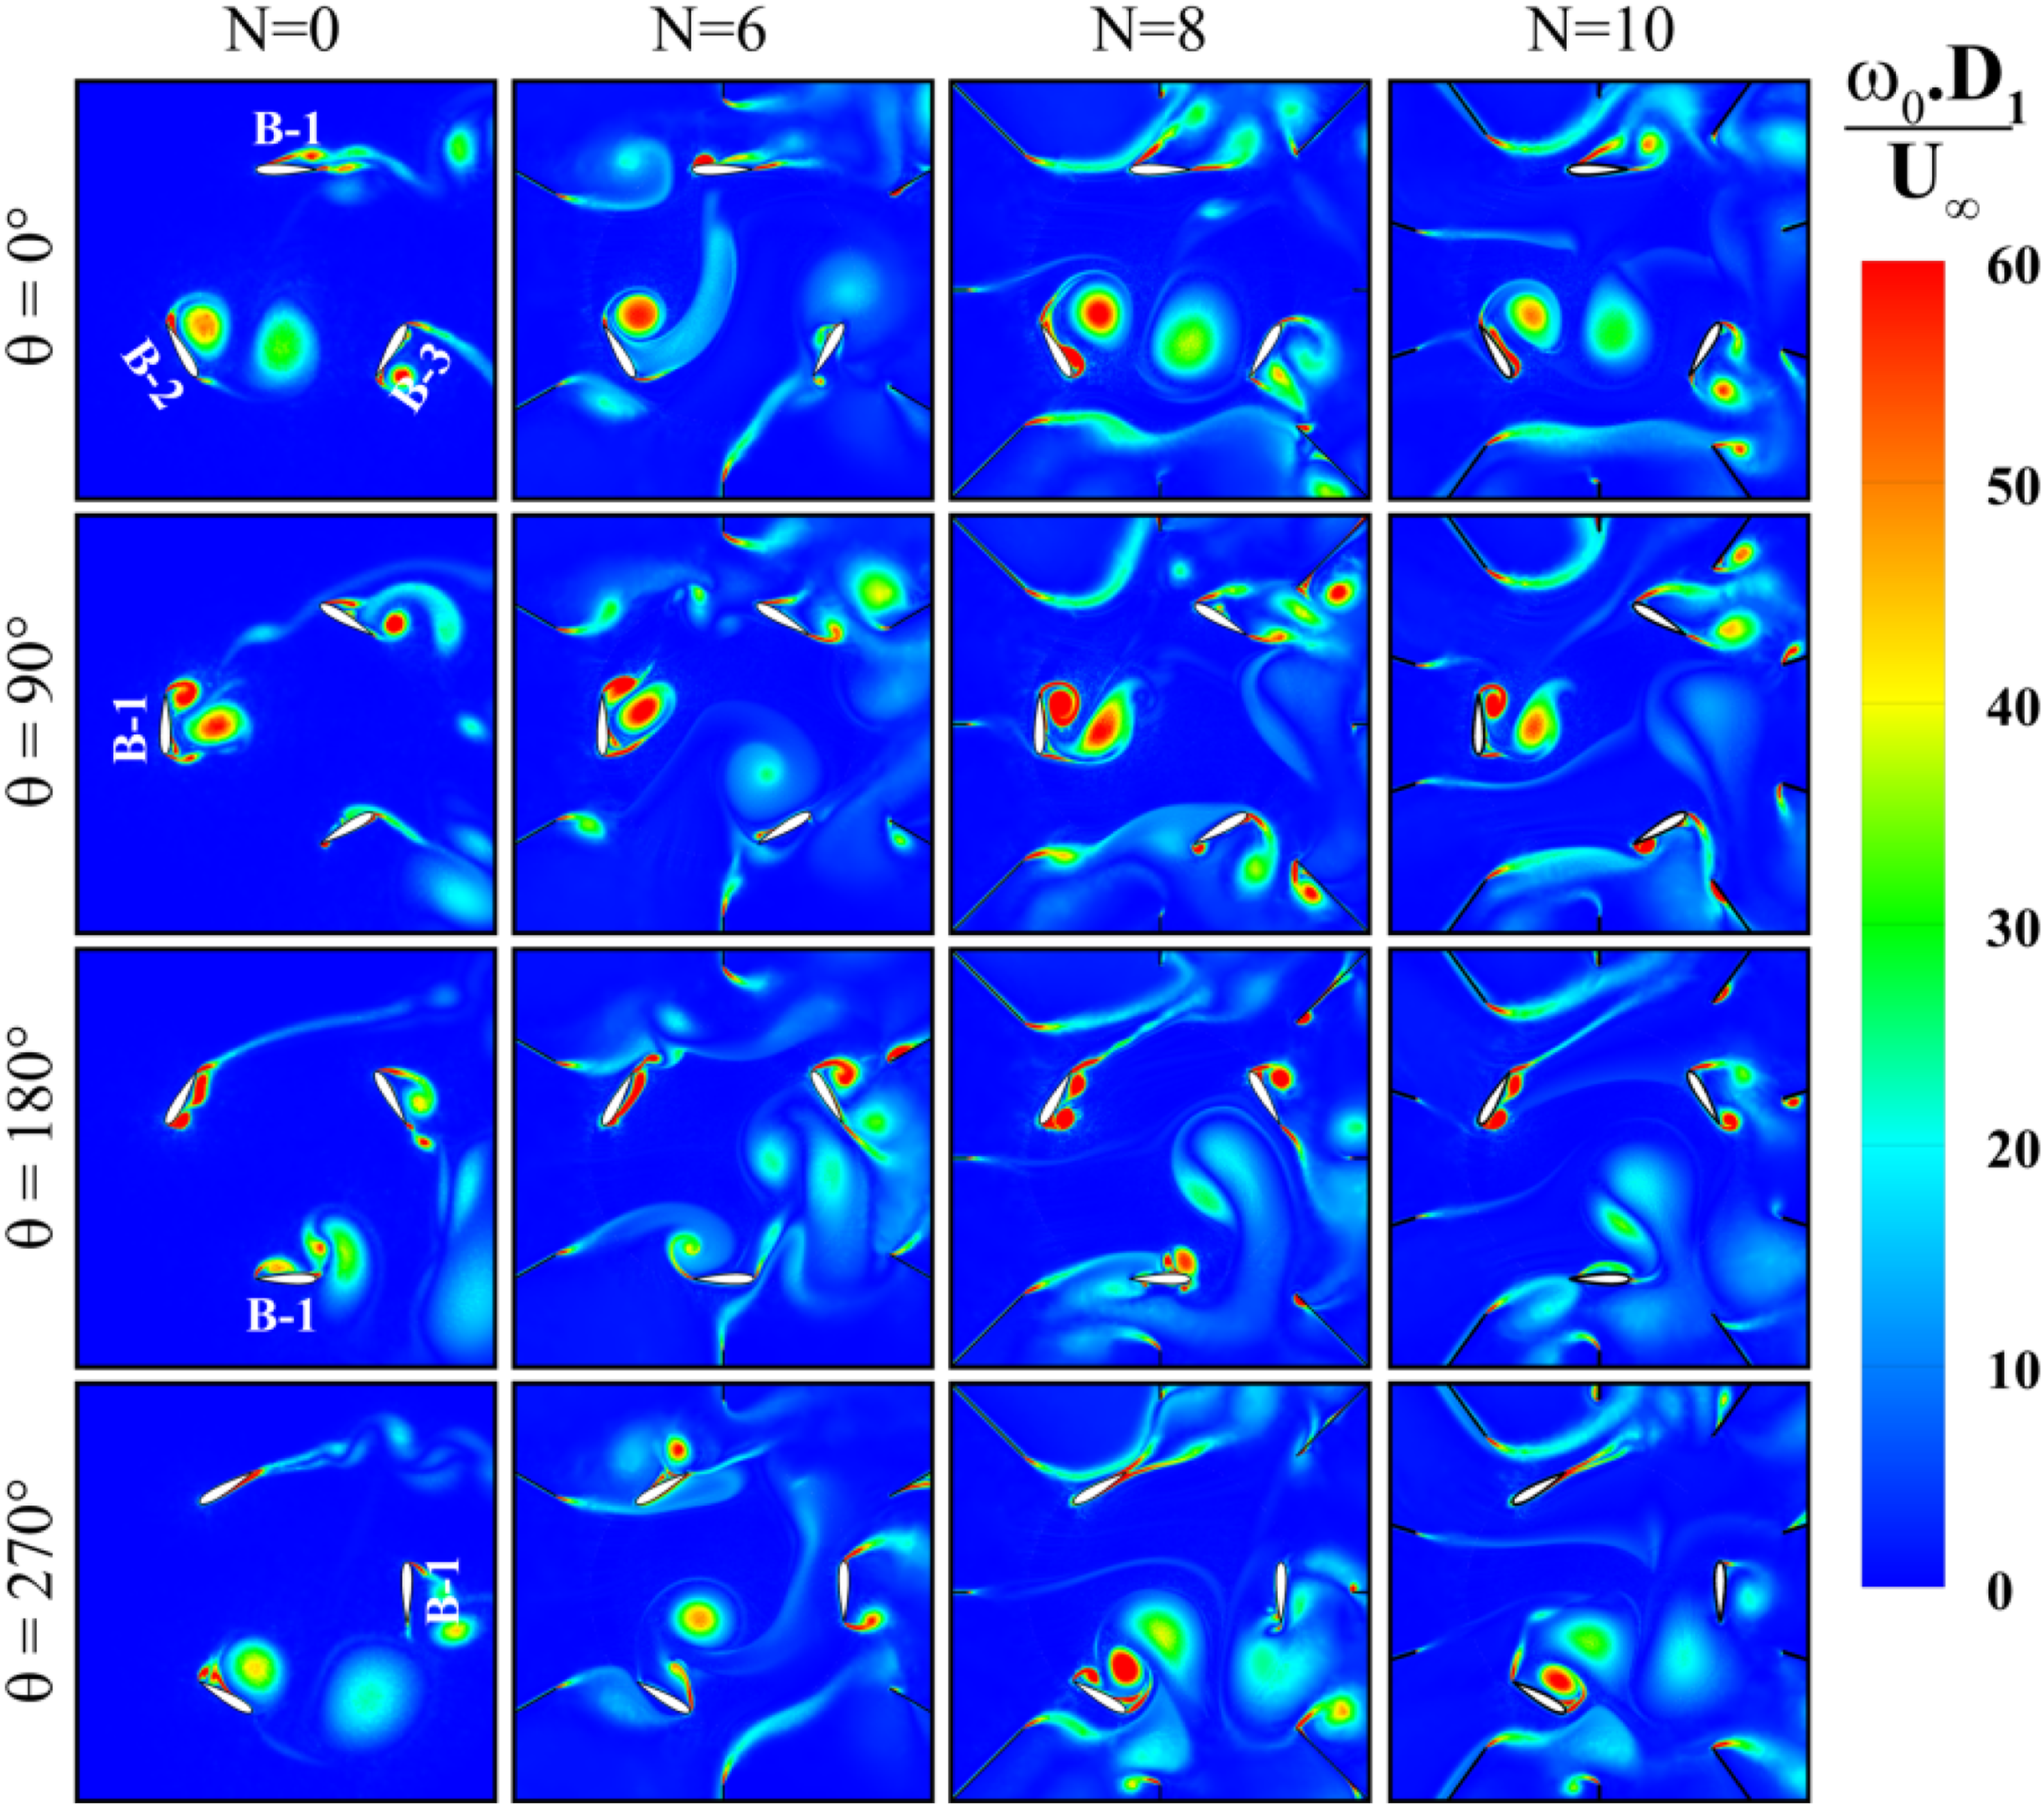
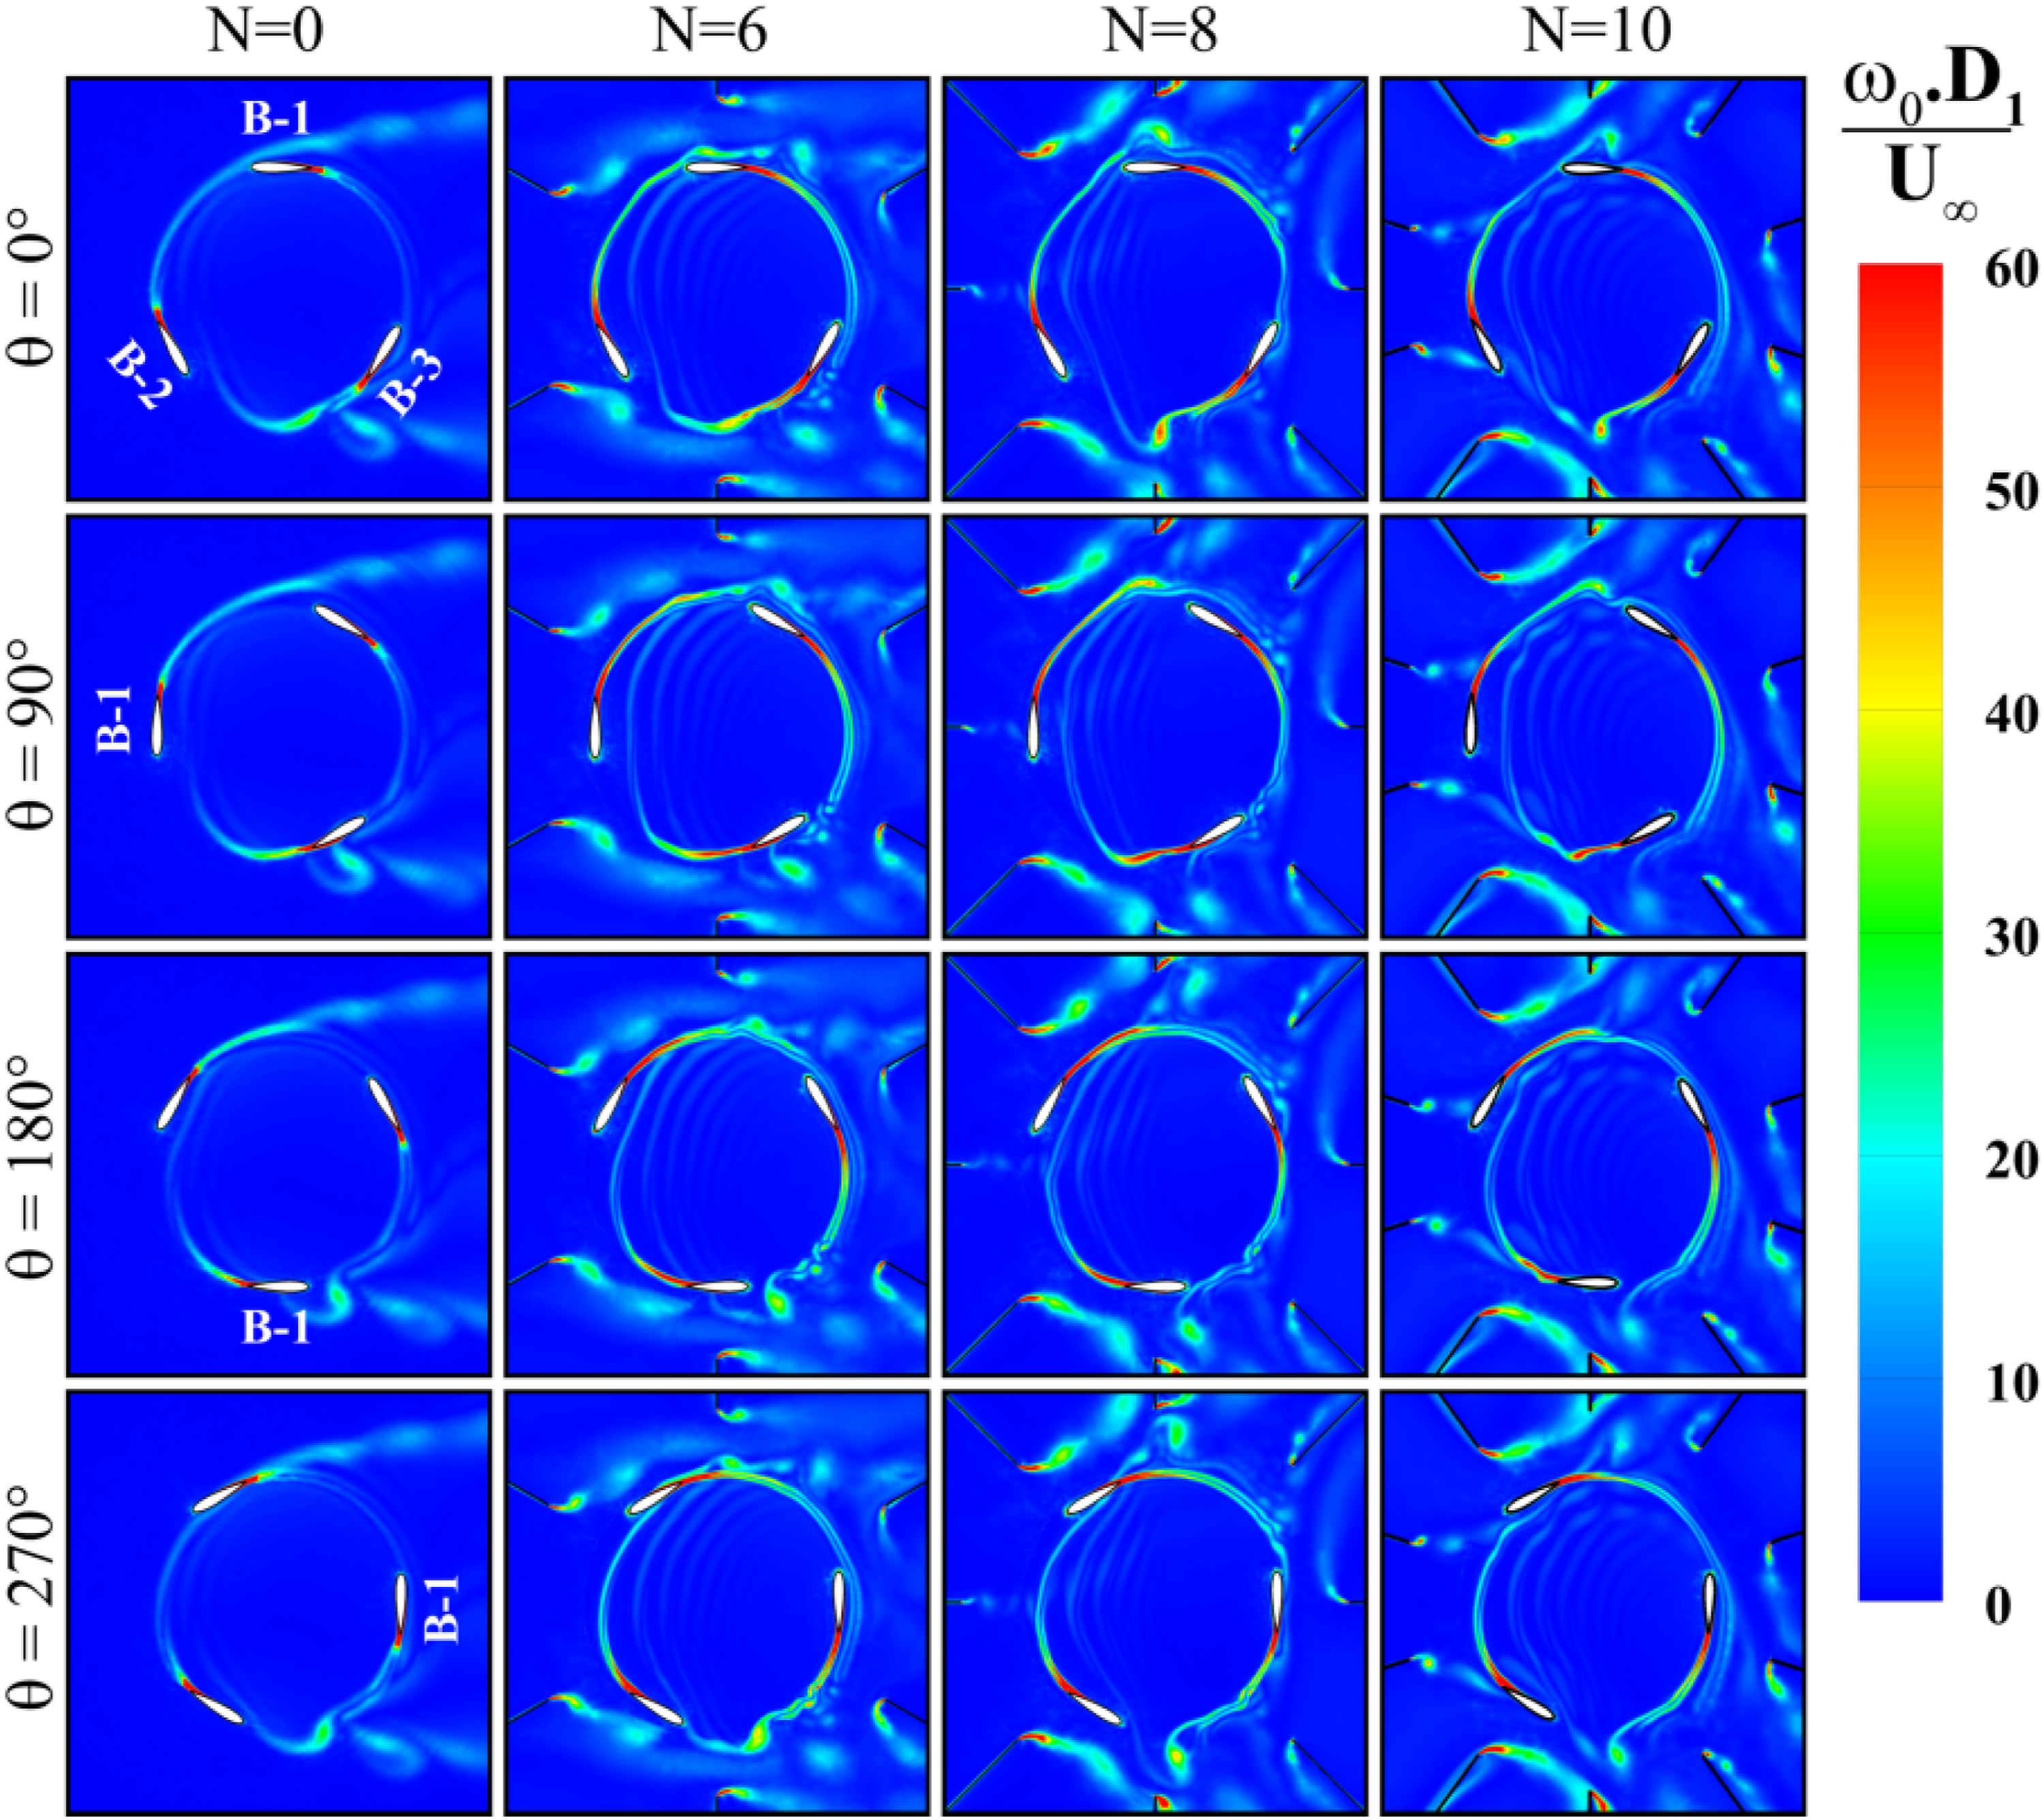
Figures 13–15 depict the instantaneous fields of normalized vorticity magnitude for TSR values of 0.5, 1.5, and 2.5 at azimuth angles of 0°, 90°, 180°, and 270° for a conventional rotor with and without deflector plates. Notably, the vorticity magnitudes are normalized based on the rotor diameter and free-wind speed. The data analysis indicates that the rotor’s vorticity field increases when deflector plates are utilized. This rise in the vorticity field for cases with N ≠ 0 results from greater airflow injected into the rotor. As a result, the interaction between the rotor and the incoming flow is intensified, increasing the vorticity field inside the rotor, irrespective of TSR and the number of deflector plates used. Increasing the TSR value reduces the vorticity field inside the rotor due to decreased airflow being injected into the rotor, as illustrated for TSR = 1.5 and 2.5 in Figures 14 and 15, respectively. At a low TSR value such as 0.5, flow separation around the blades is significant in all cases. At zero azimuth angle, flow separation mainly occurs for the second blade because of its critical position, which is nearly perpendicular to the incoming airflow. In this scenario, the shed vortices move toward the downstream side and, in some cases, interact with the third blade, negatively impacting torque generation. At an azimuth angle of 90°, the first blade is positioned perpendicular to the approaching airflow. Consequently, a strong vortex shedding from the leading and trailing edges of the first blade is initiated. The first blade plays a crucial role in total torque generation at this azimuth angle. At an azimuth angle of 180°, the vorticity field diminishes within the rotor due to a significant reduction in flow separation. At 270°, the vorticity field resulting from flow separation increases for the last blade, influenced by the number of deflector blades. Increasing the TSR value from 0.5 to 1.5 and then to 2.5 gradually reduces the flow separation process within the rotor and enhances the wakes downstream of all blades. This gradual change is primarily due to reduced interaction between the incoming flow and the rotor, resulting from a smaller volume of injected flow, as discussed previously. However, it is evident that at moderate and high TSR values, in all cases where N ≠ 0, the wake downstream of each blade is stronger than that of N = 0. Instantaneous fields of normalized vorticity magnitude at selected azimuth angles for N = 0, 6, 8, and 10 under TSR = 1.5. Instantaneous fields of normalized vorticity magnitude at selected azimuth angles for N = 0, 6, 8, and 10 under TSR = 2.5.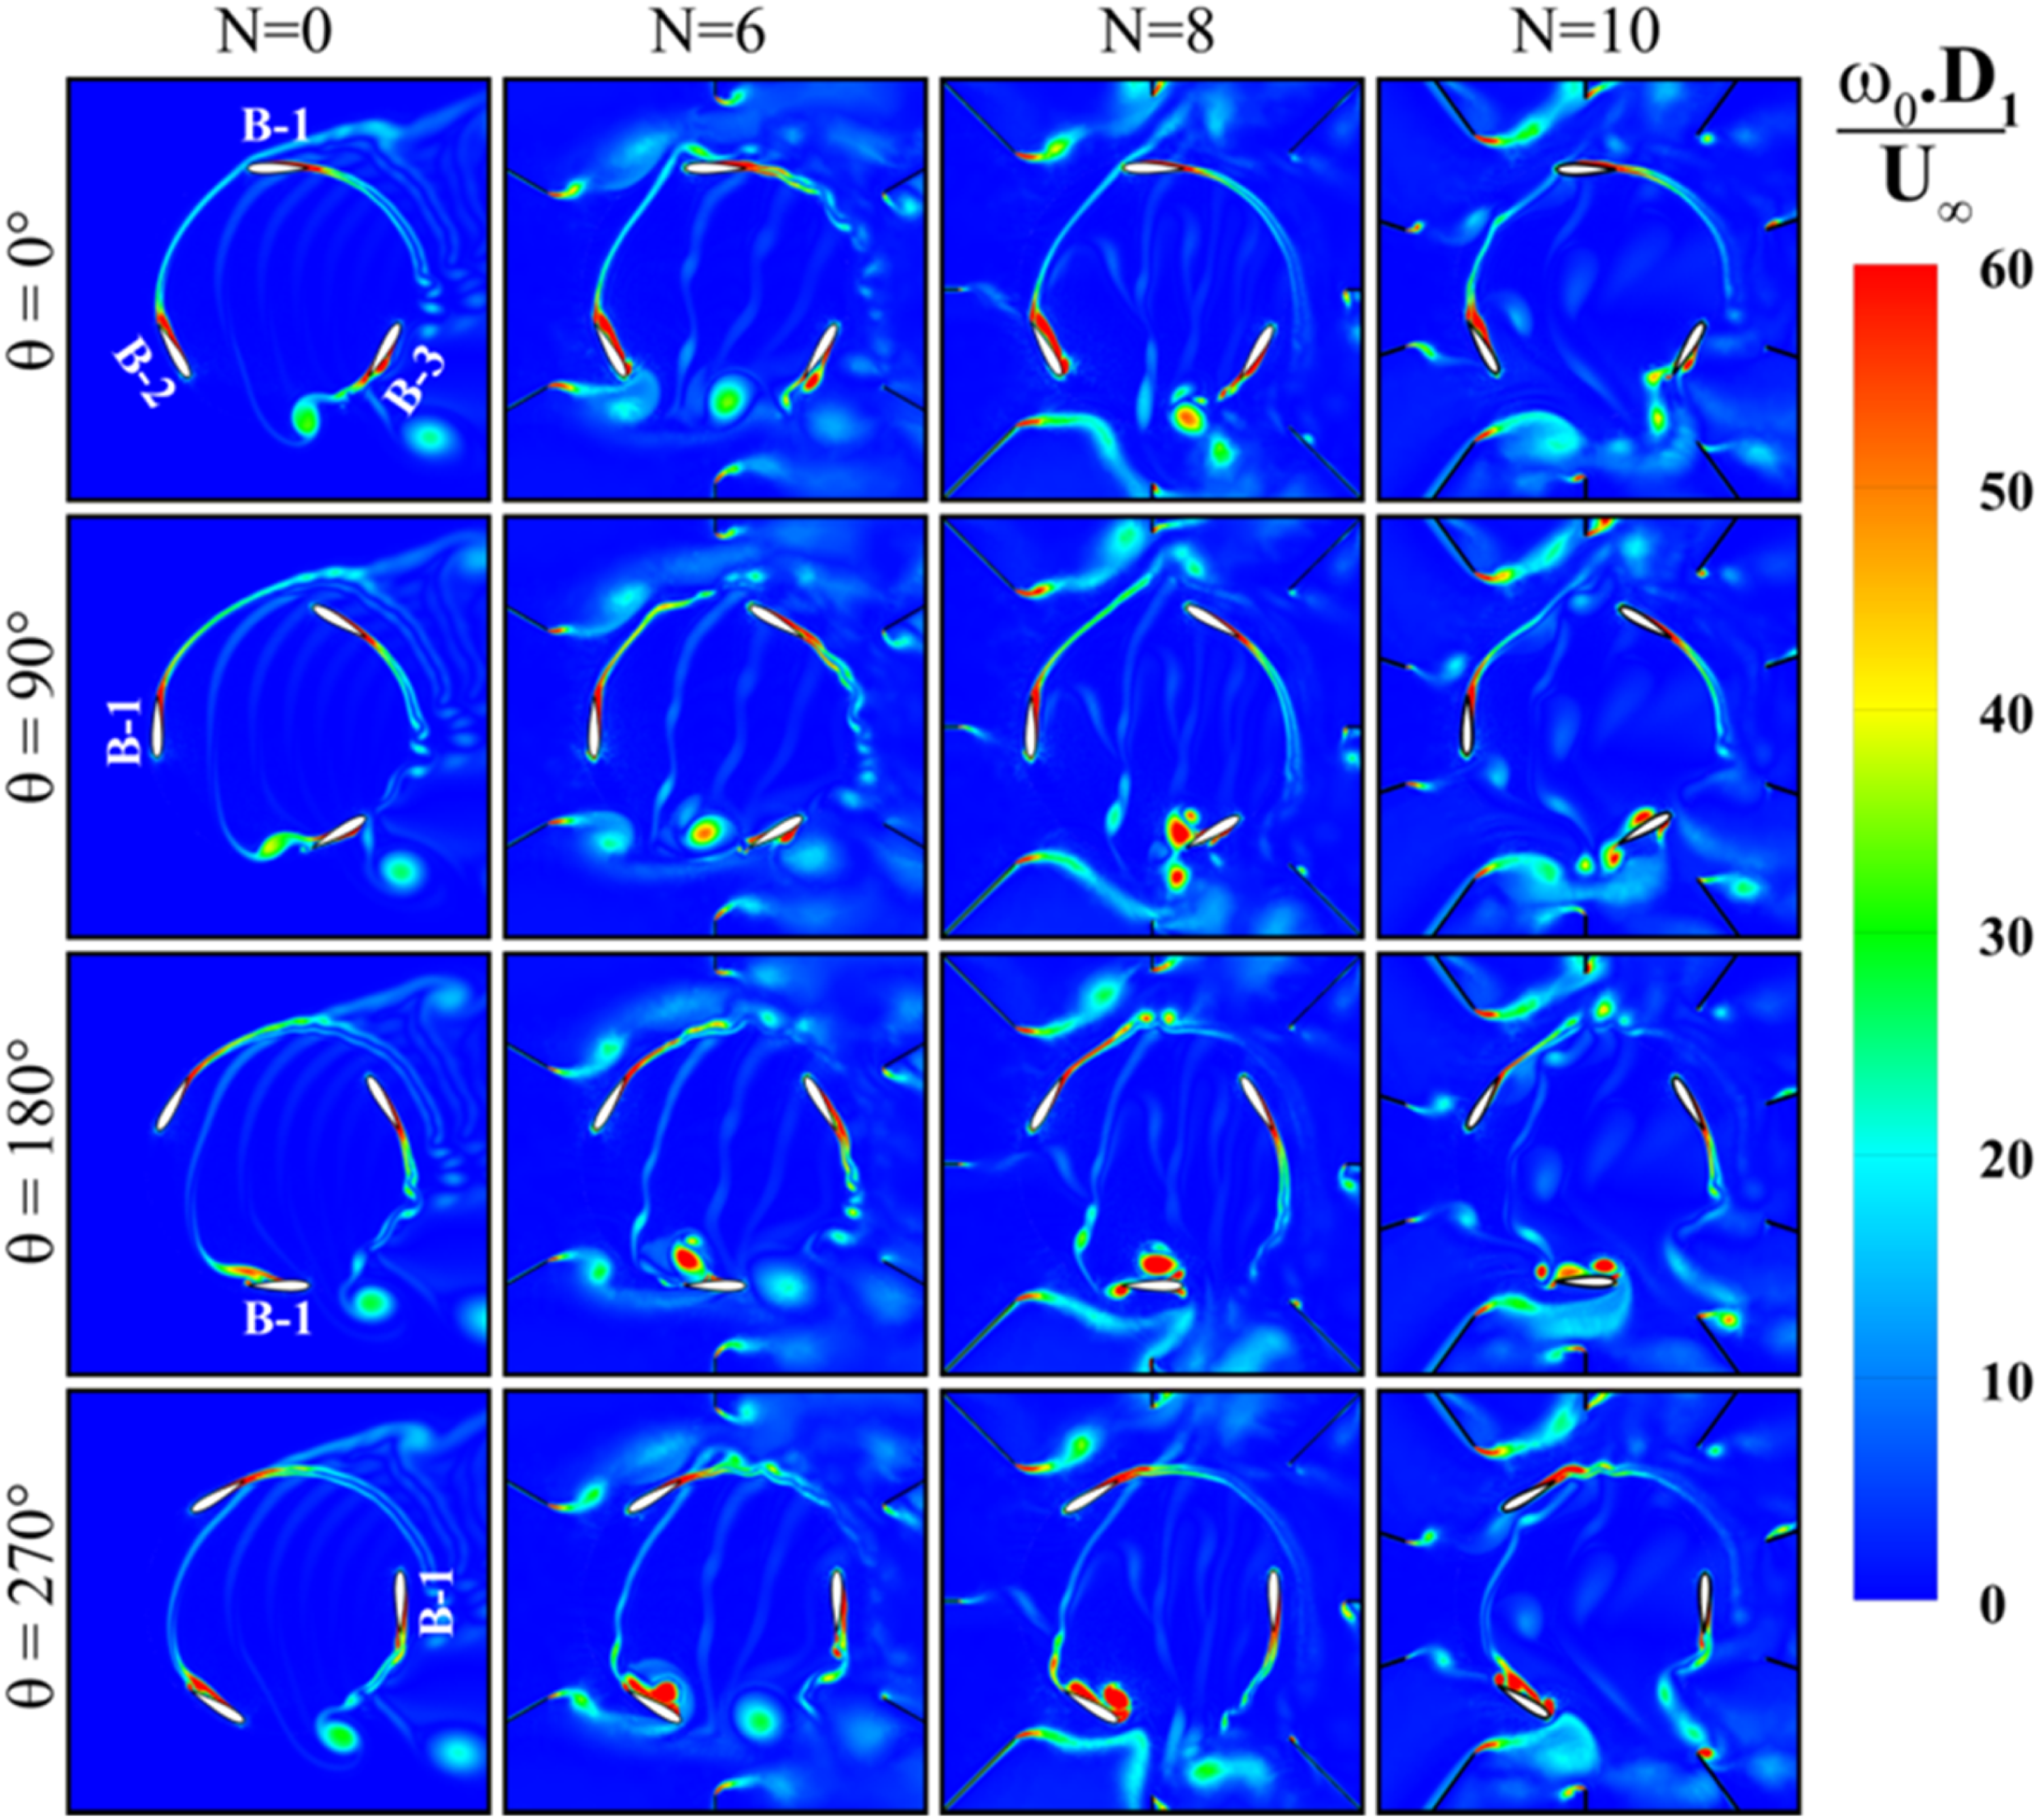
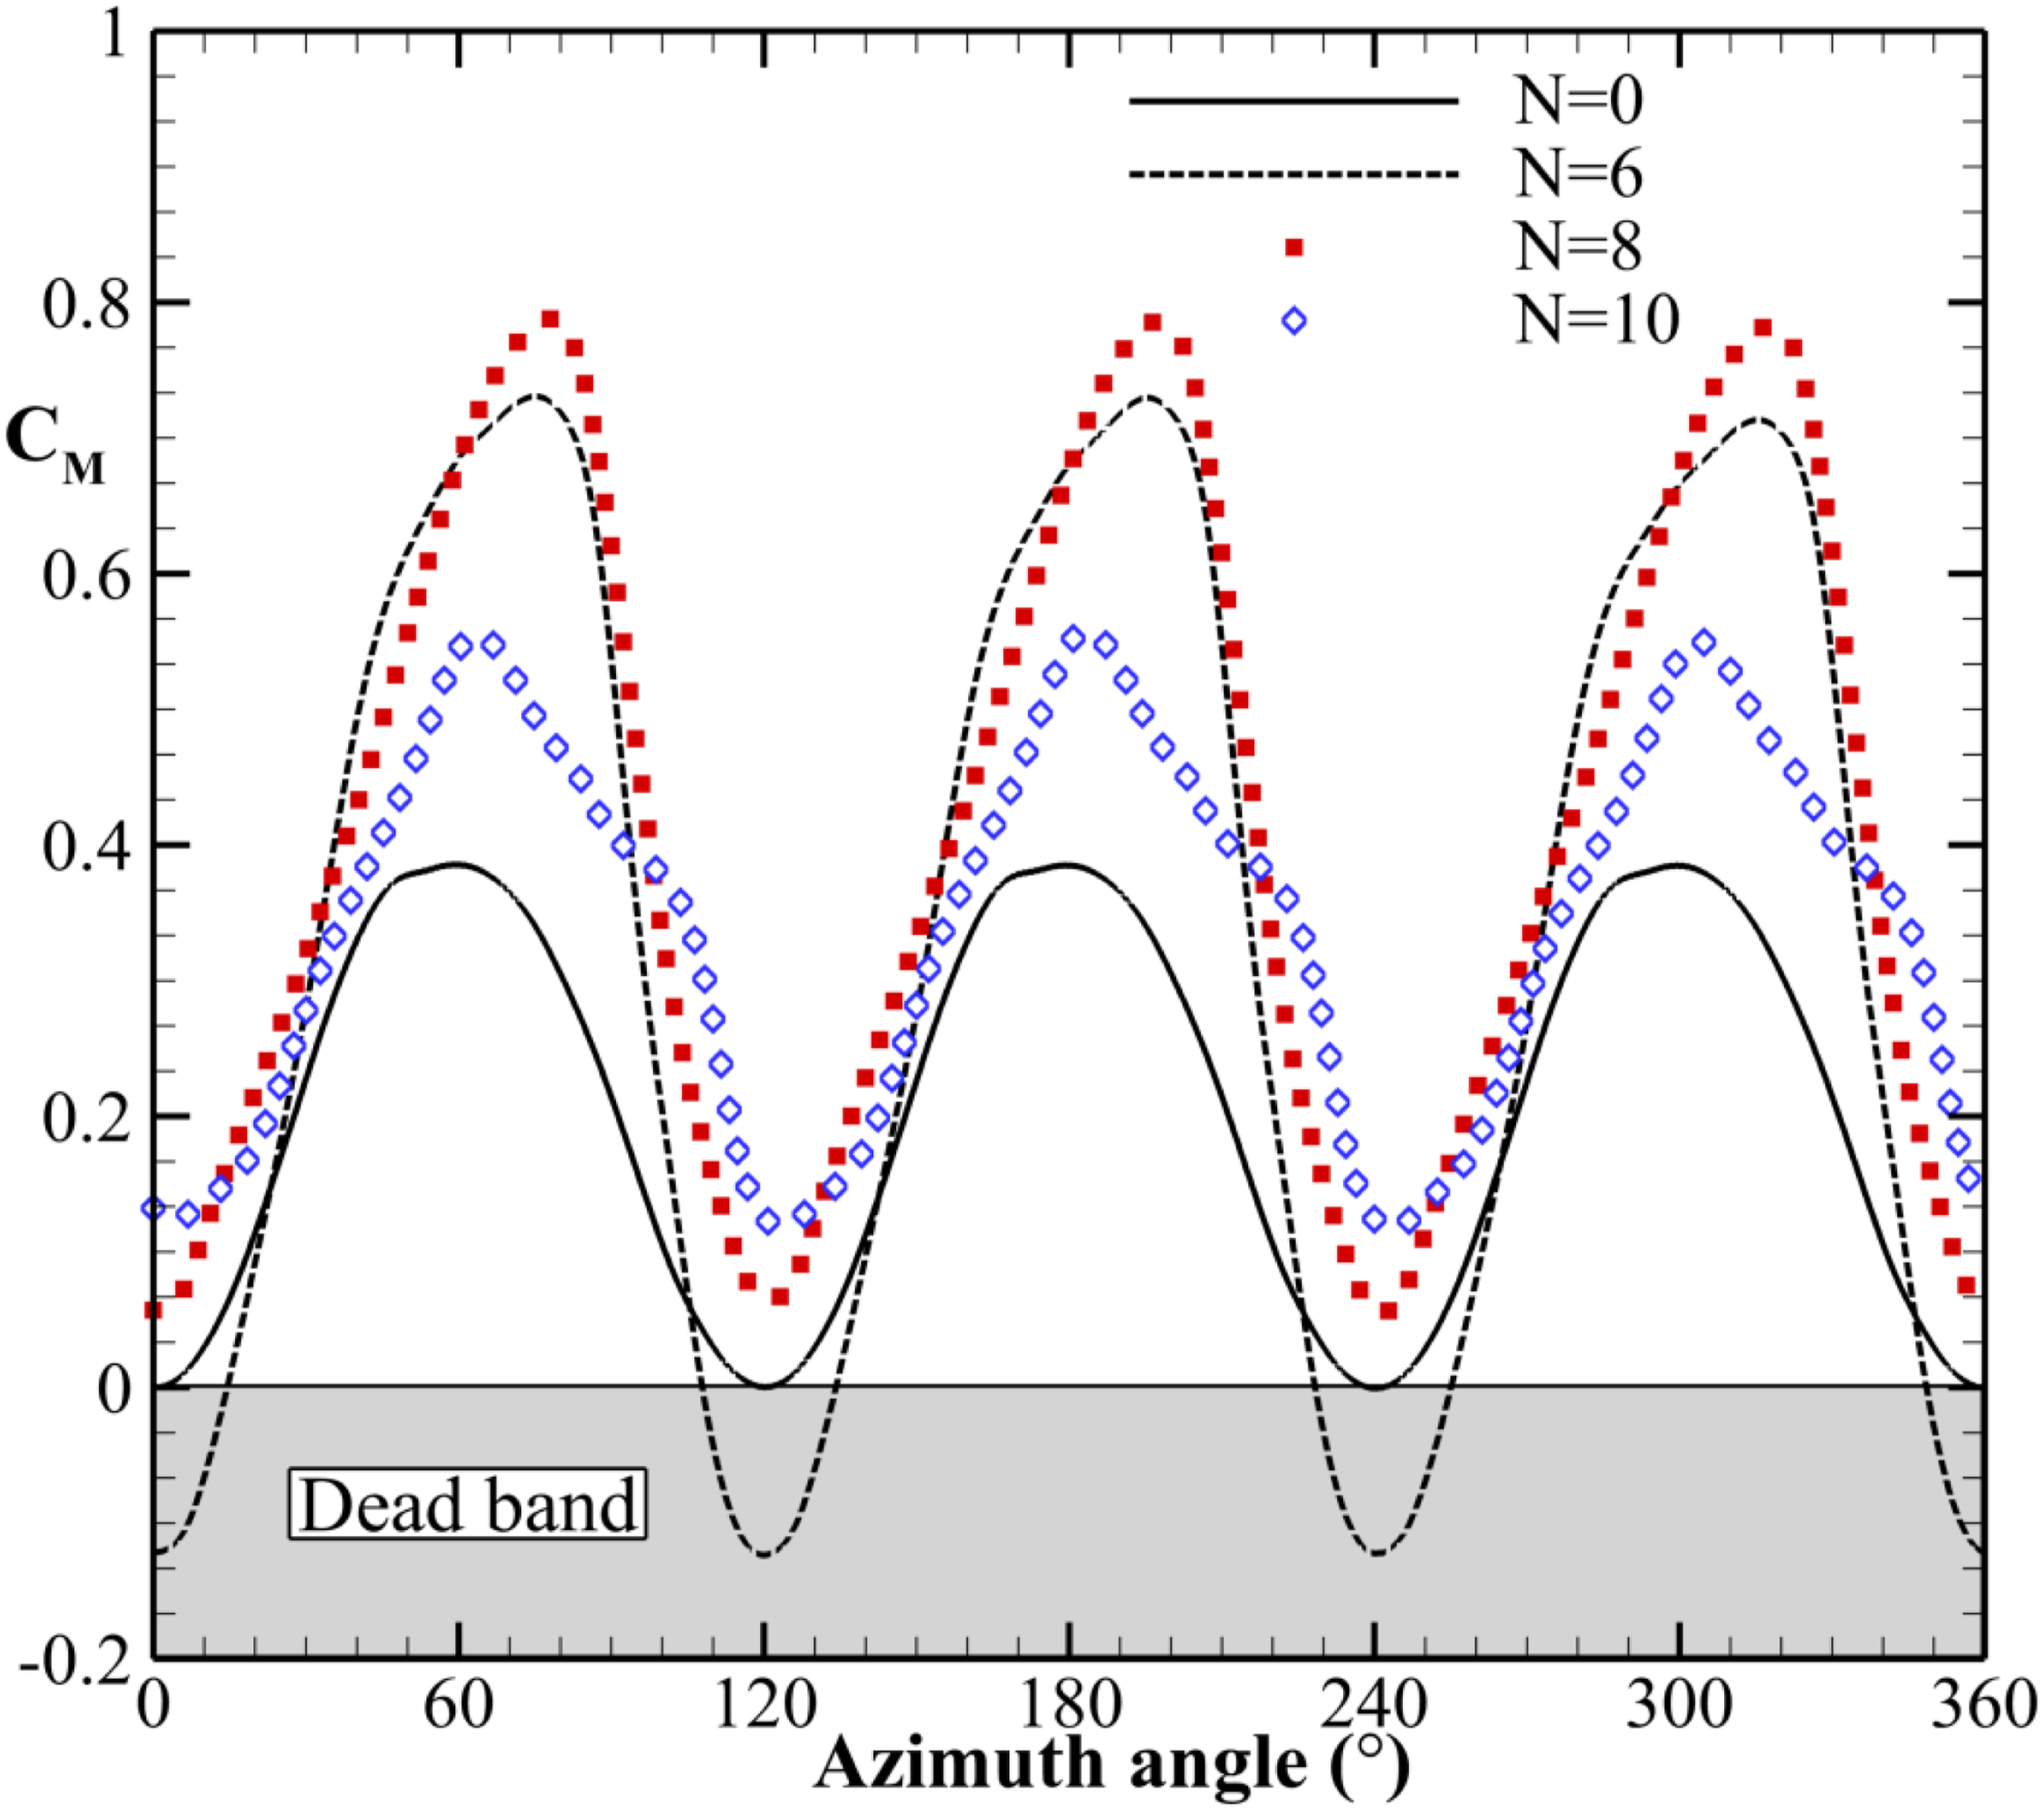
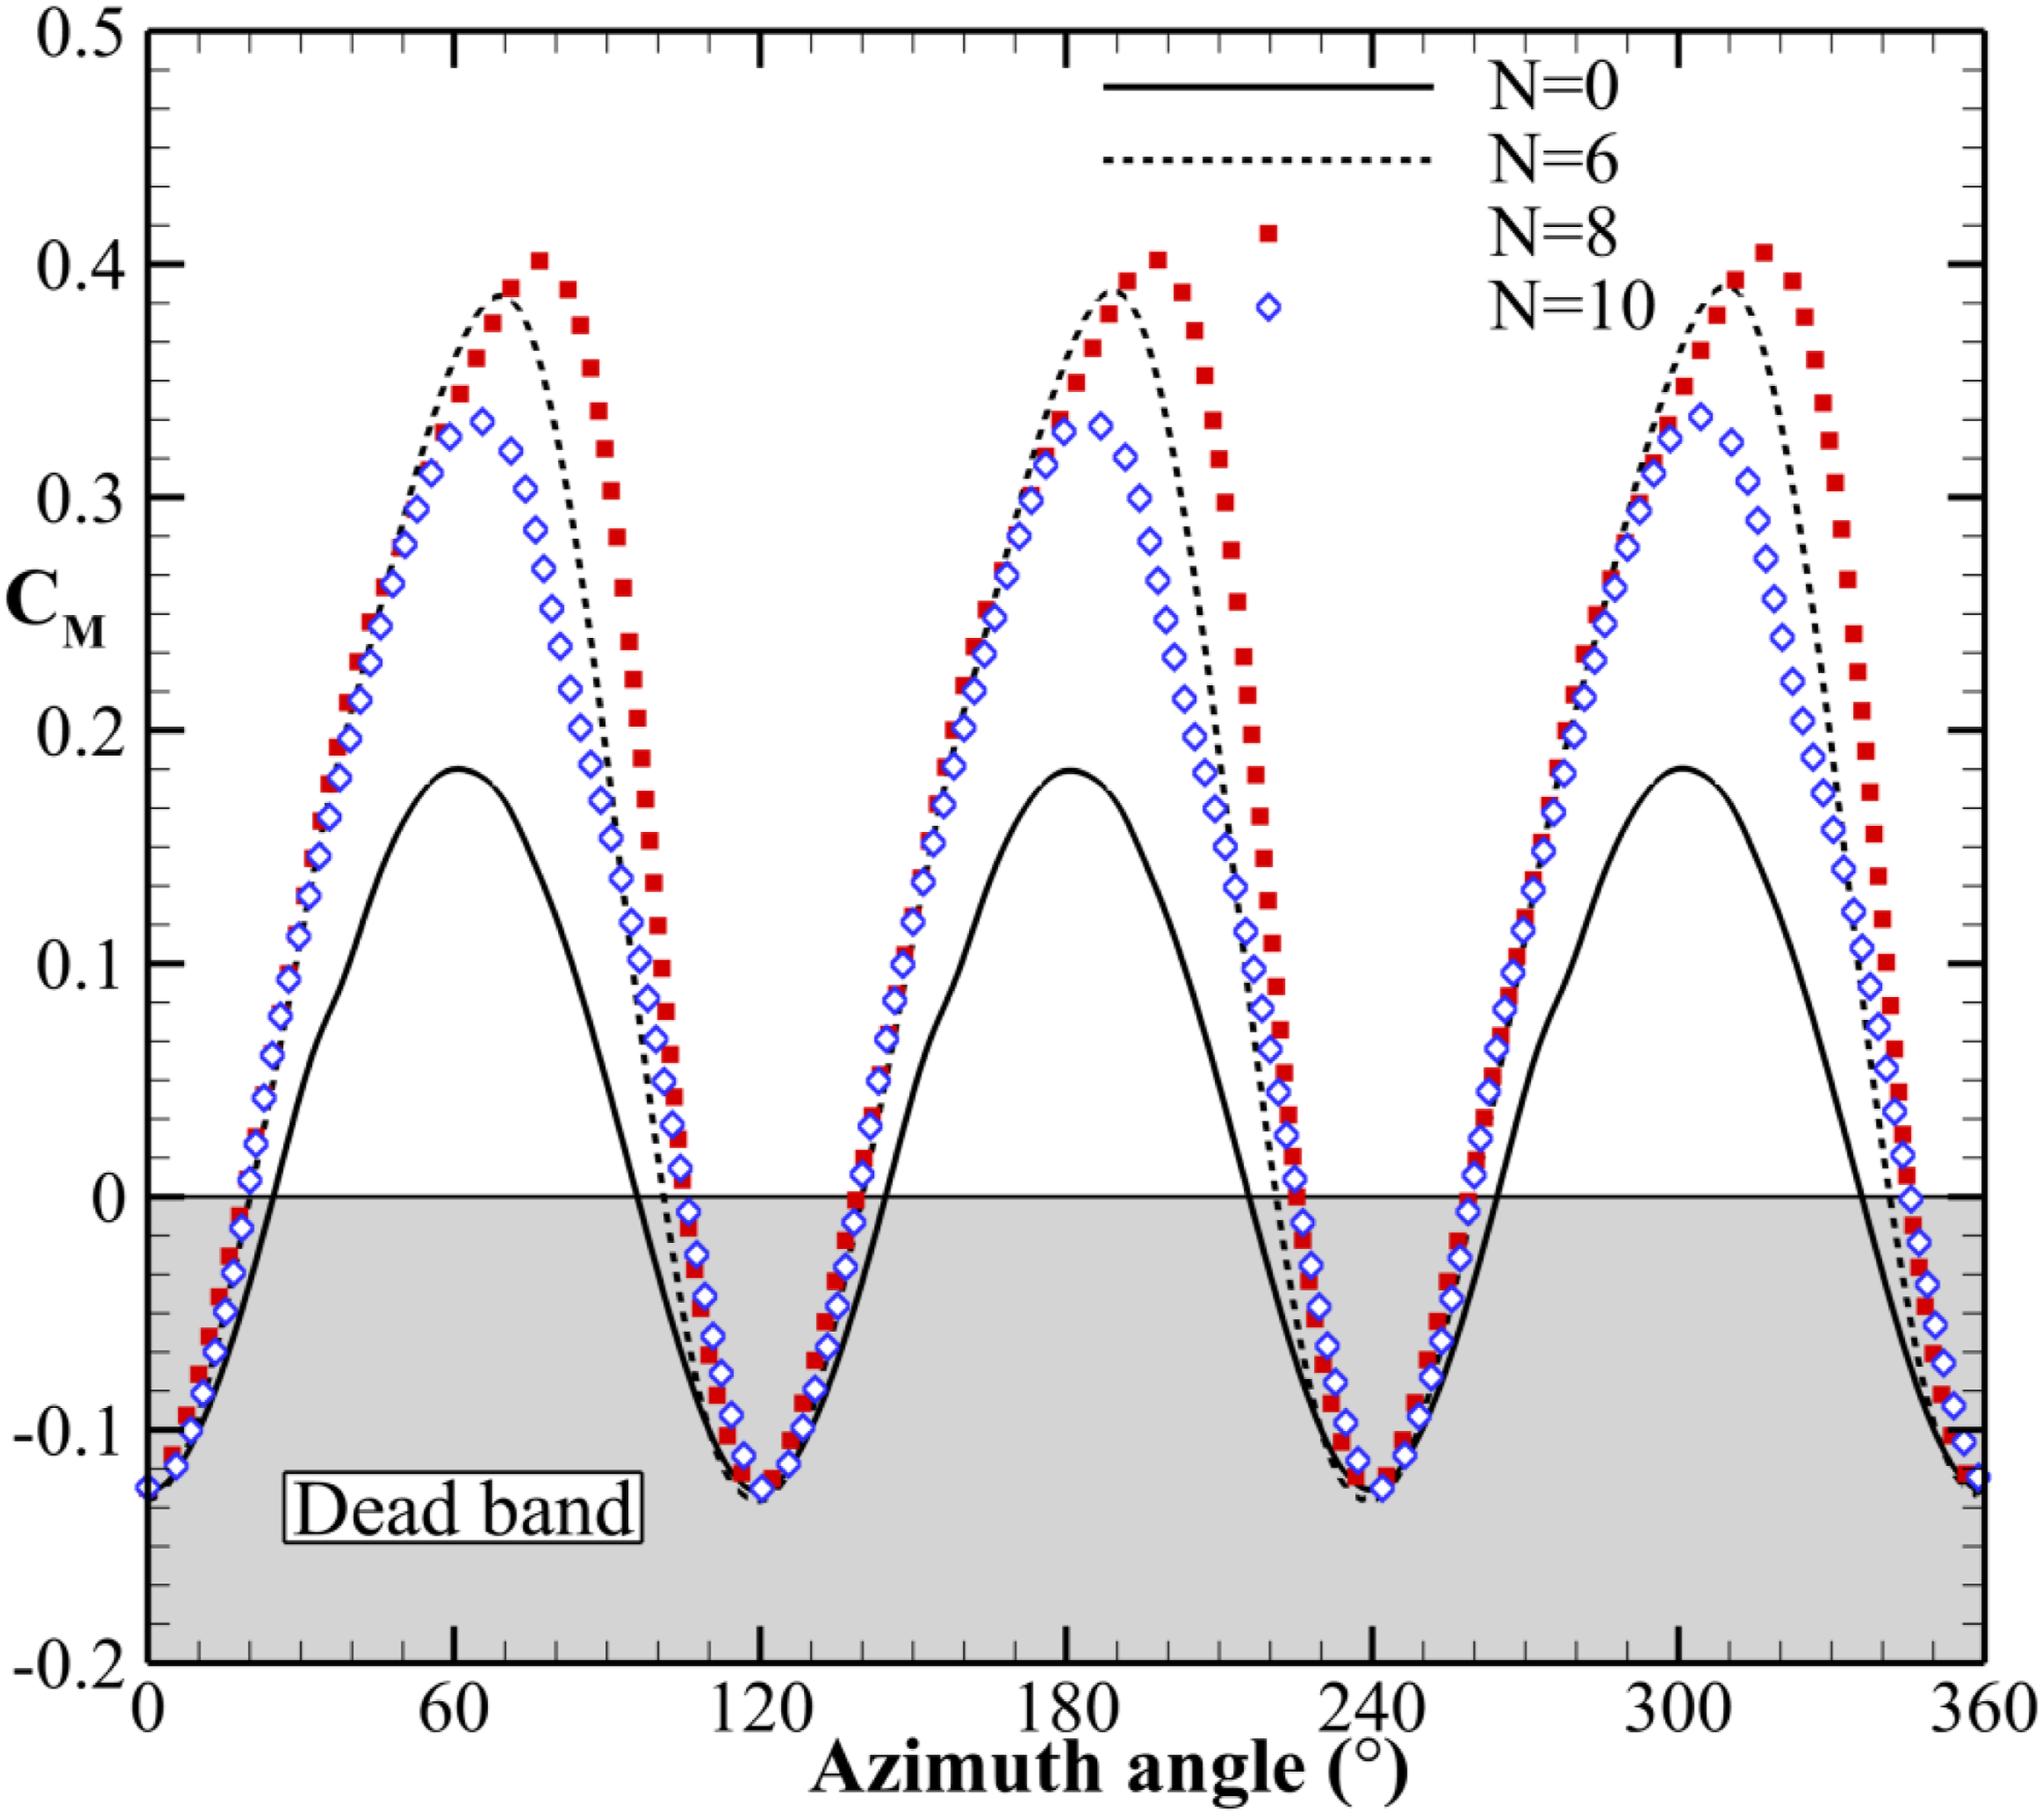
After examining the airflow’s physical behavior inside the rotor, both with and without deflector plates, in terms of velocity and vorticity fields, it becomes straightforward to discuss the torque variations of the rotors under consideration. Figures 16–18 show the variations of torque coefficient throughout a complete rotor cycle for TSR values of 0.5, 1.5, and 2.5, respectively. Analyzing the torque coefficient variations of the rotor during one complete cycle highlights the critical role of the number of deflector plates on rotor performance across different TSR values. An examination of the presented data shows that, regardless of the number of deflector plates, applying deflector plates around a conventional three-bladed Darrieus rotor significantly increases the torque generated by the rotor. For TSR = 0.5, as depicted in Figure 16, each rotor generates positive and negative torques depending on the azimuth angle, regardless of the number of deflector plates. The area where the rotor provides negative torque is known as the dead band and is highlighted in gray. It is recognized that operating a wind rotor inside the dead band is detrimental from both the self-starting and total torque generation perspectives. It is evident that both cases with N = 6 and N = 8 exhibit, more or less, the same dead band extension, slightly greater than the cases with N = 0 and N = 10, which share nearly identical dead band extensions. The increase in the number of deflector plates from N = 6 to N = 8 results in a substantial rise in the torque coefficient. The torque coefficient reaches its maximum at rotational angles, such as 80° and 200°, which are significantly higher than those observed in the N = 6 case. This rise can be attributed to a notable enhancement in the velocity field within the rotor, as illustrated in Figure 10, comparing the case with eight deflector plates to the case with six deflector plates. However, in most azimuth angles where the rotors generate positive torque, the case with N = 8 appears to perform better among the options. Beyond N = 8, the case with N = 10 produces the highest torque, while the cases with N = 0 and N = 6 show similar variations. At a moderate TSR value such as 1.5, in the N = 0 case, the fluctuations of the instantaneous torque coefficient are mild and limited, with a maximum reaching 0.4. As N = 6, fluctuations intensify, and the peak instantaneous torque coefficient increases significantly. Continuing to increase N to 8, fluctuations decrease, and the peak torque coefficient approaches 0.8. Finally, at N = 10, in the case of the rotor with flat plate deflectors, fluctuations of the instantaneous torque coefficient reach their minimum, and the peak value decreases significantly, falling below 0.6. This trend demonstrates that increasing the number of plates up to N = 8 yields a significant improvement in the peak instantaneous torque coefficient; however, further increasing the number of flat plate deflectors causes this peak to decrease, while simultaneously reducing the fluctuations of the instantaneous torque curve. At this TSR value, the dead-band width is reduced across all configurations, and the instantaneous torque coefficient increases significantly. Similar to the TSR = 0.5 case, N = 8 achieves the highest torque coefficient in this TSR regime. Except for N = 6, all other configurations generate positive torque across all azimuth angles, whereas for N = 6, only the amplitude of the instantaneous torque coefficient increases, while the overall torque curve remains unchanged. At a high TSR (e.g., 2.5), the influence of the number of deflector plates becomes negligible. Although torque coefficient variations across all deflector configurations converge, rotors equipped with such plates exhibit a clear and significant improvement compared to the baseline case without deflector plates, demonstrating that deflector plates positively affect aerodynamic performance, even under high TSR conditions. A crucial factor influencing a wind turbine’s average power characteristics is the duration that the rotor experiences negative torque throughout one complete cycle. This essential parameter is calculated for all scenarios at various TSR values, derived from Figures 16–18. At TSR = 0.5, the rotors with N = 0, 6, 8, and 10 generate negative torque at 56.3%, 32.7%, 20.8%, and 27.5% of a complete rotor revolution, respectively. At TSR = 1.5, the cases with N = 0, 8, and 10 develop positive torque at nearly all azimuth angles. Conversely, negative torque is generated for the case with N = 6, accounting for 21.95% of a complete rotor cycle. Finally, at TSR = 2.5, the cases with N = 0, 6, 8, and 10 experience negative torque at 40.4%, 32.2%, 28.1%, and 28.2% of a complete rotor revolution, respectively. This significant reduction in the duration of negative torque generation underscores the importance of deflector plates on Darrieus rotors. Among all cases and TSR values considered, the case with N = 8 provides the highest torque with the shortest duration of negative torque generation in a complete rotor cycle. Therefore, the scenario with eight deflector plates is the optimal case. The inconsistent behavior of negative torque is due to the varying aerodynamic response of the rotor at different TSR values. At lower TSRs (e.g., 0.5), the rotor shows a greater degree of asymmetry and is more responsive to different configurations of deflector plates, resulting in fluctuating magnitudes of negative torques. In contrast, at higher TSRs (e.g., 2.5), the torque behavior is more uniform and converges, although it does not completely stabilize, which suggests that negative torque continues to be affected by aerodynamic conditions and the design of deflector plates. This variability underscores the significant influence of specific flow regimes and geometric arrangements on the torque. Effects of the number of deflector plates on the torque coefficient in one complete rotor cycle at TSR = 0.5. Effects of the number of deflector plates on the torque coefficient in one complete rotor cycle at TSR = 1.5. Effects of the number of deflector plates on the torque coefficient in one complete rotor cycle at TSR = 2.5.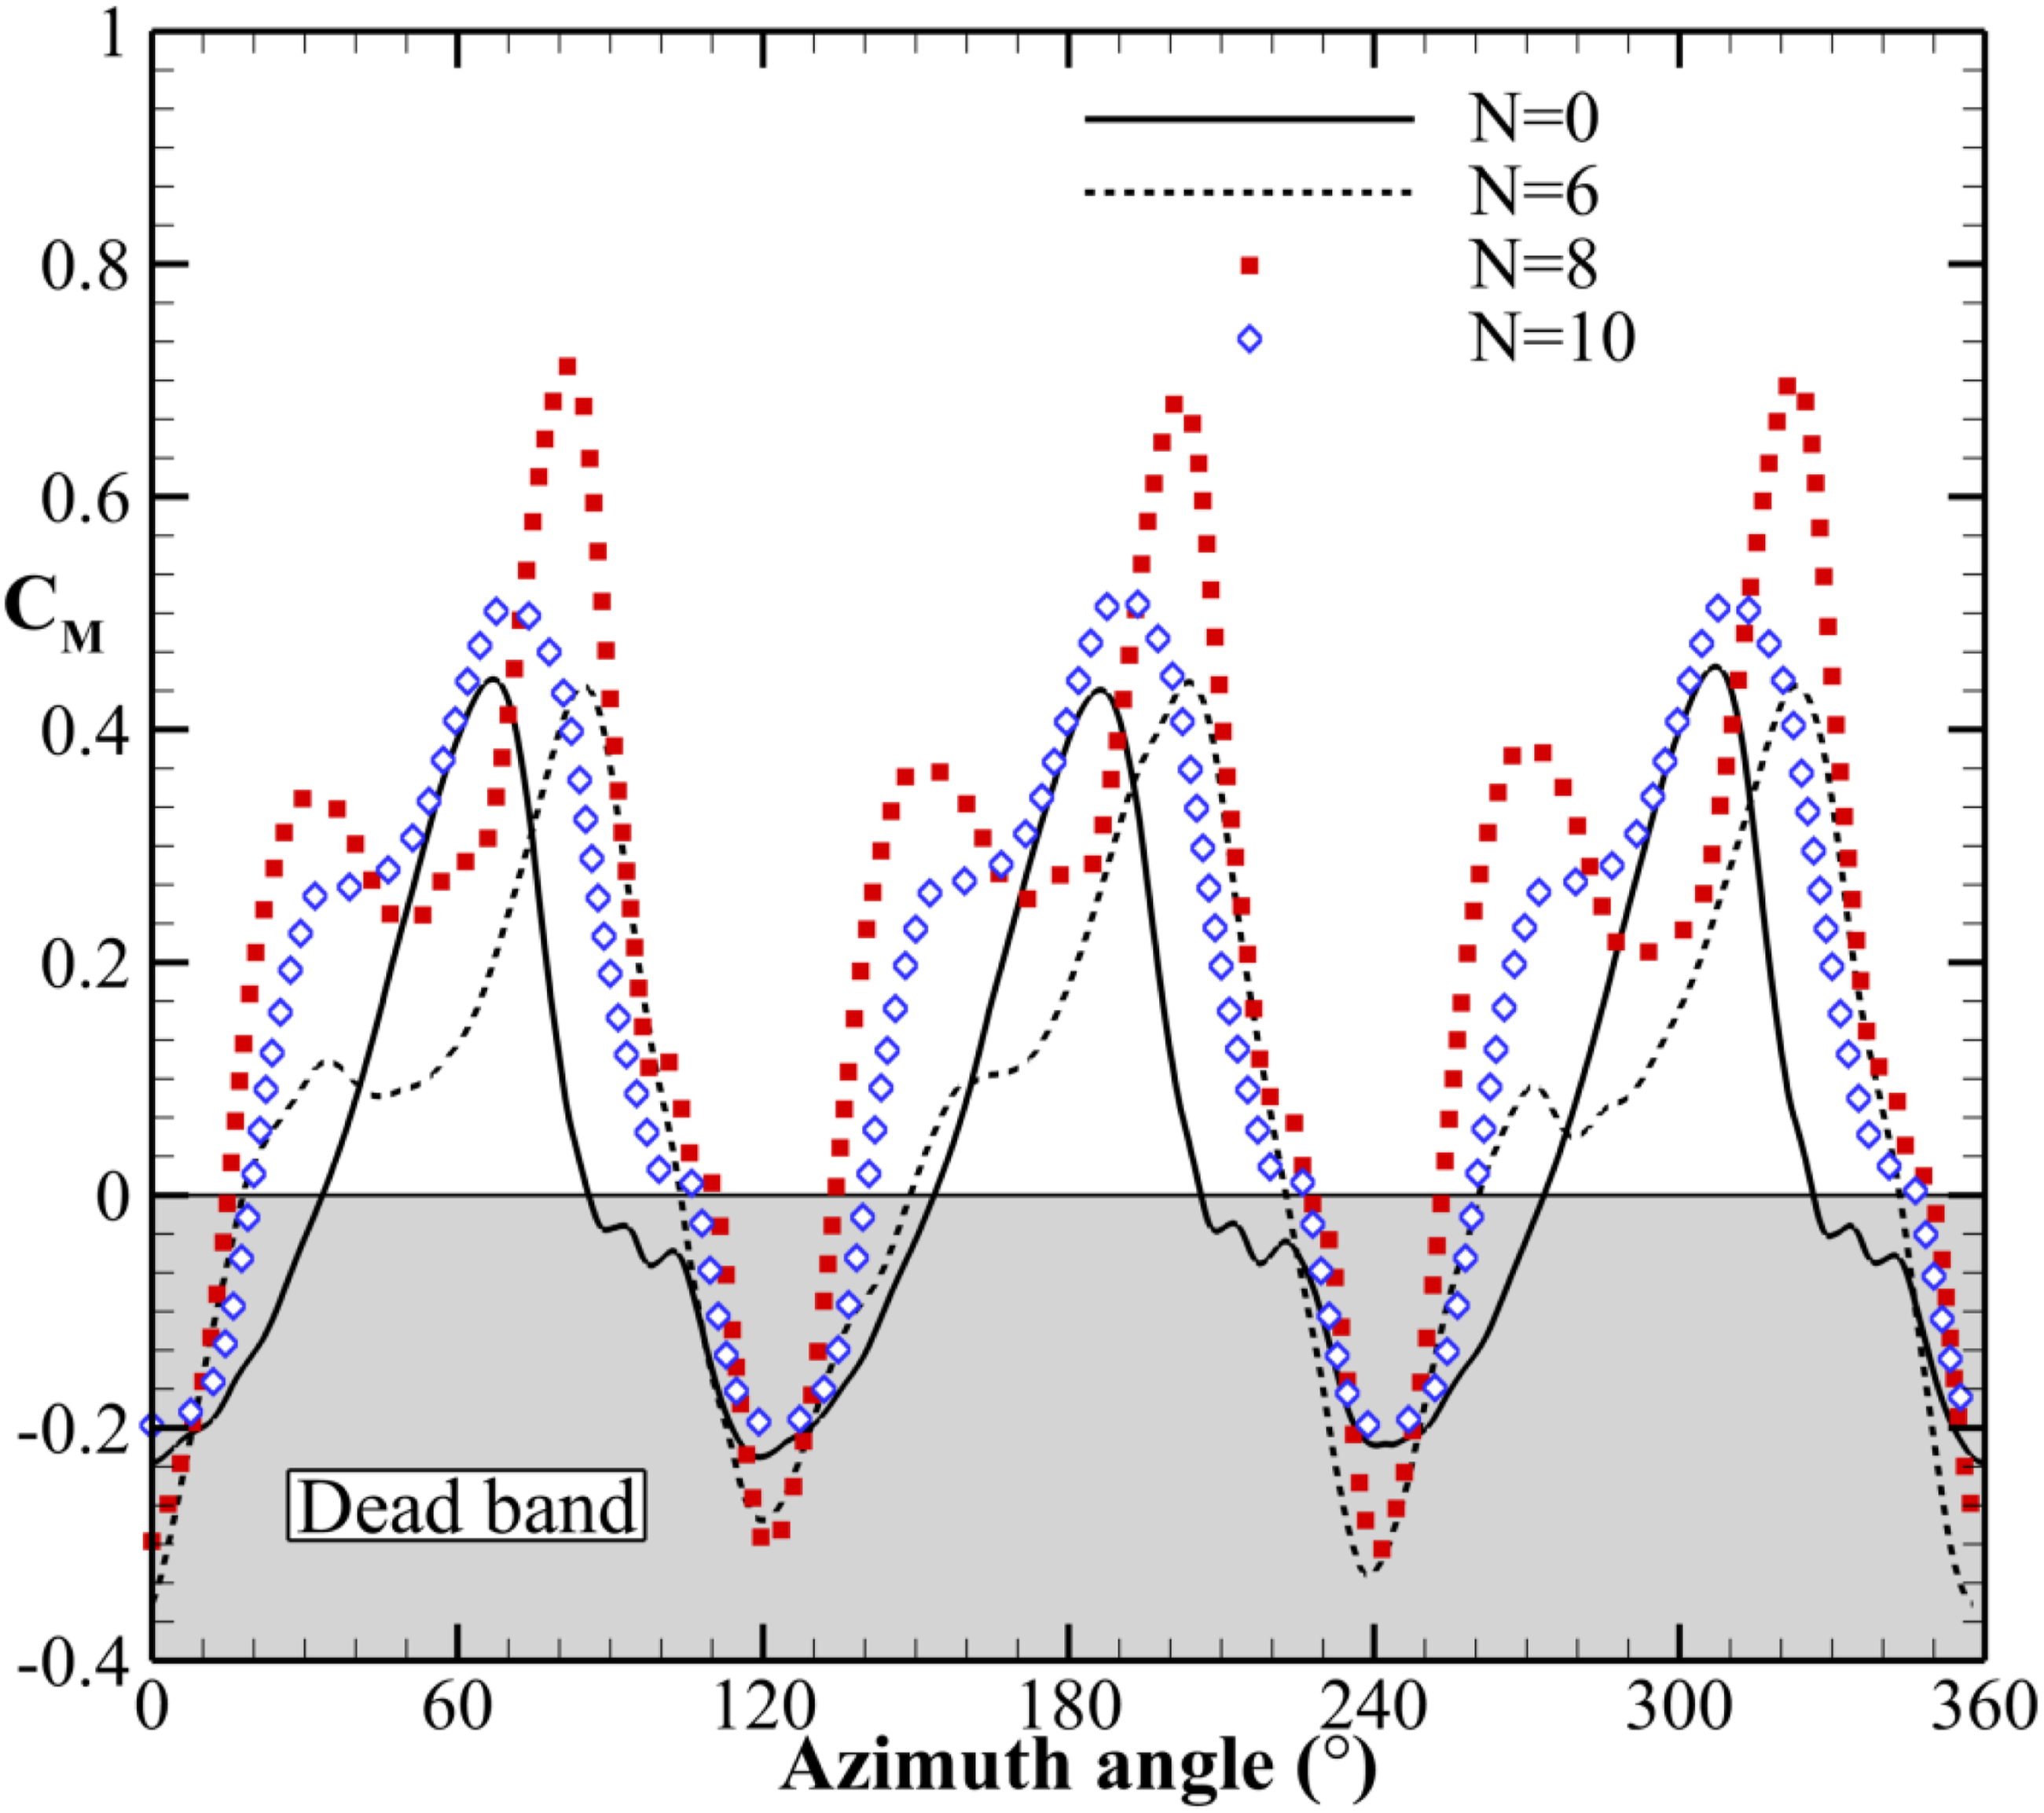
To improve visualization, Figure 19 shows the variations in the mean power coefficient across one complete rotor cycle. As anticipated, the case with N = 8 outperforms the others at all TSR values. For N values beyond 8, the rotors with N = 6 and N = 10 yield the highest mean power coefficients at TSR = 2.5 and 0.5, respectively. The Darrieus rotor without deflector plates has the lowest mean power coefficient across all TSR values. Compared to the scenario without deflector plates, an optimal case with N = 8 demonstrates improvements of up to 456.7%, 102.9%, and 287.7% at TSR = 0.5, 1.5, and 2.5, respectively. Effects of the number of deflector plates on the mean power coefficient at different TSR values.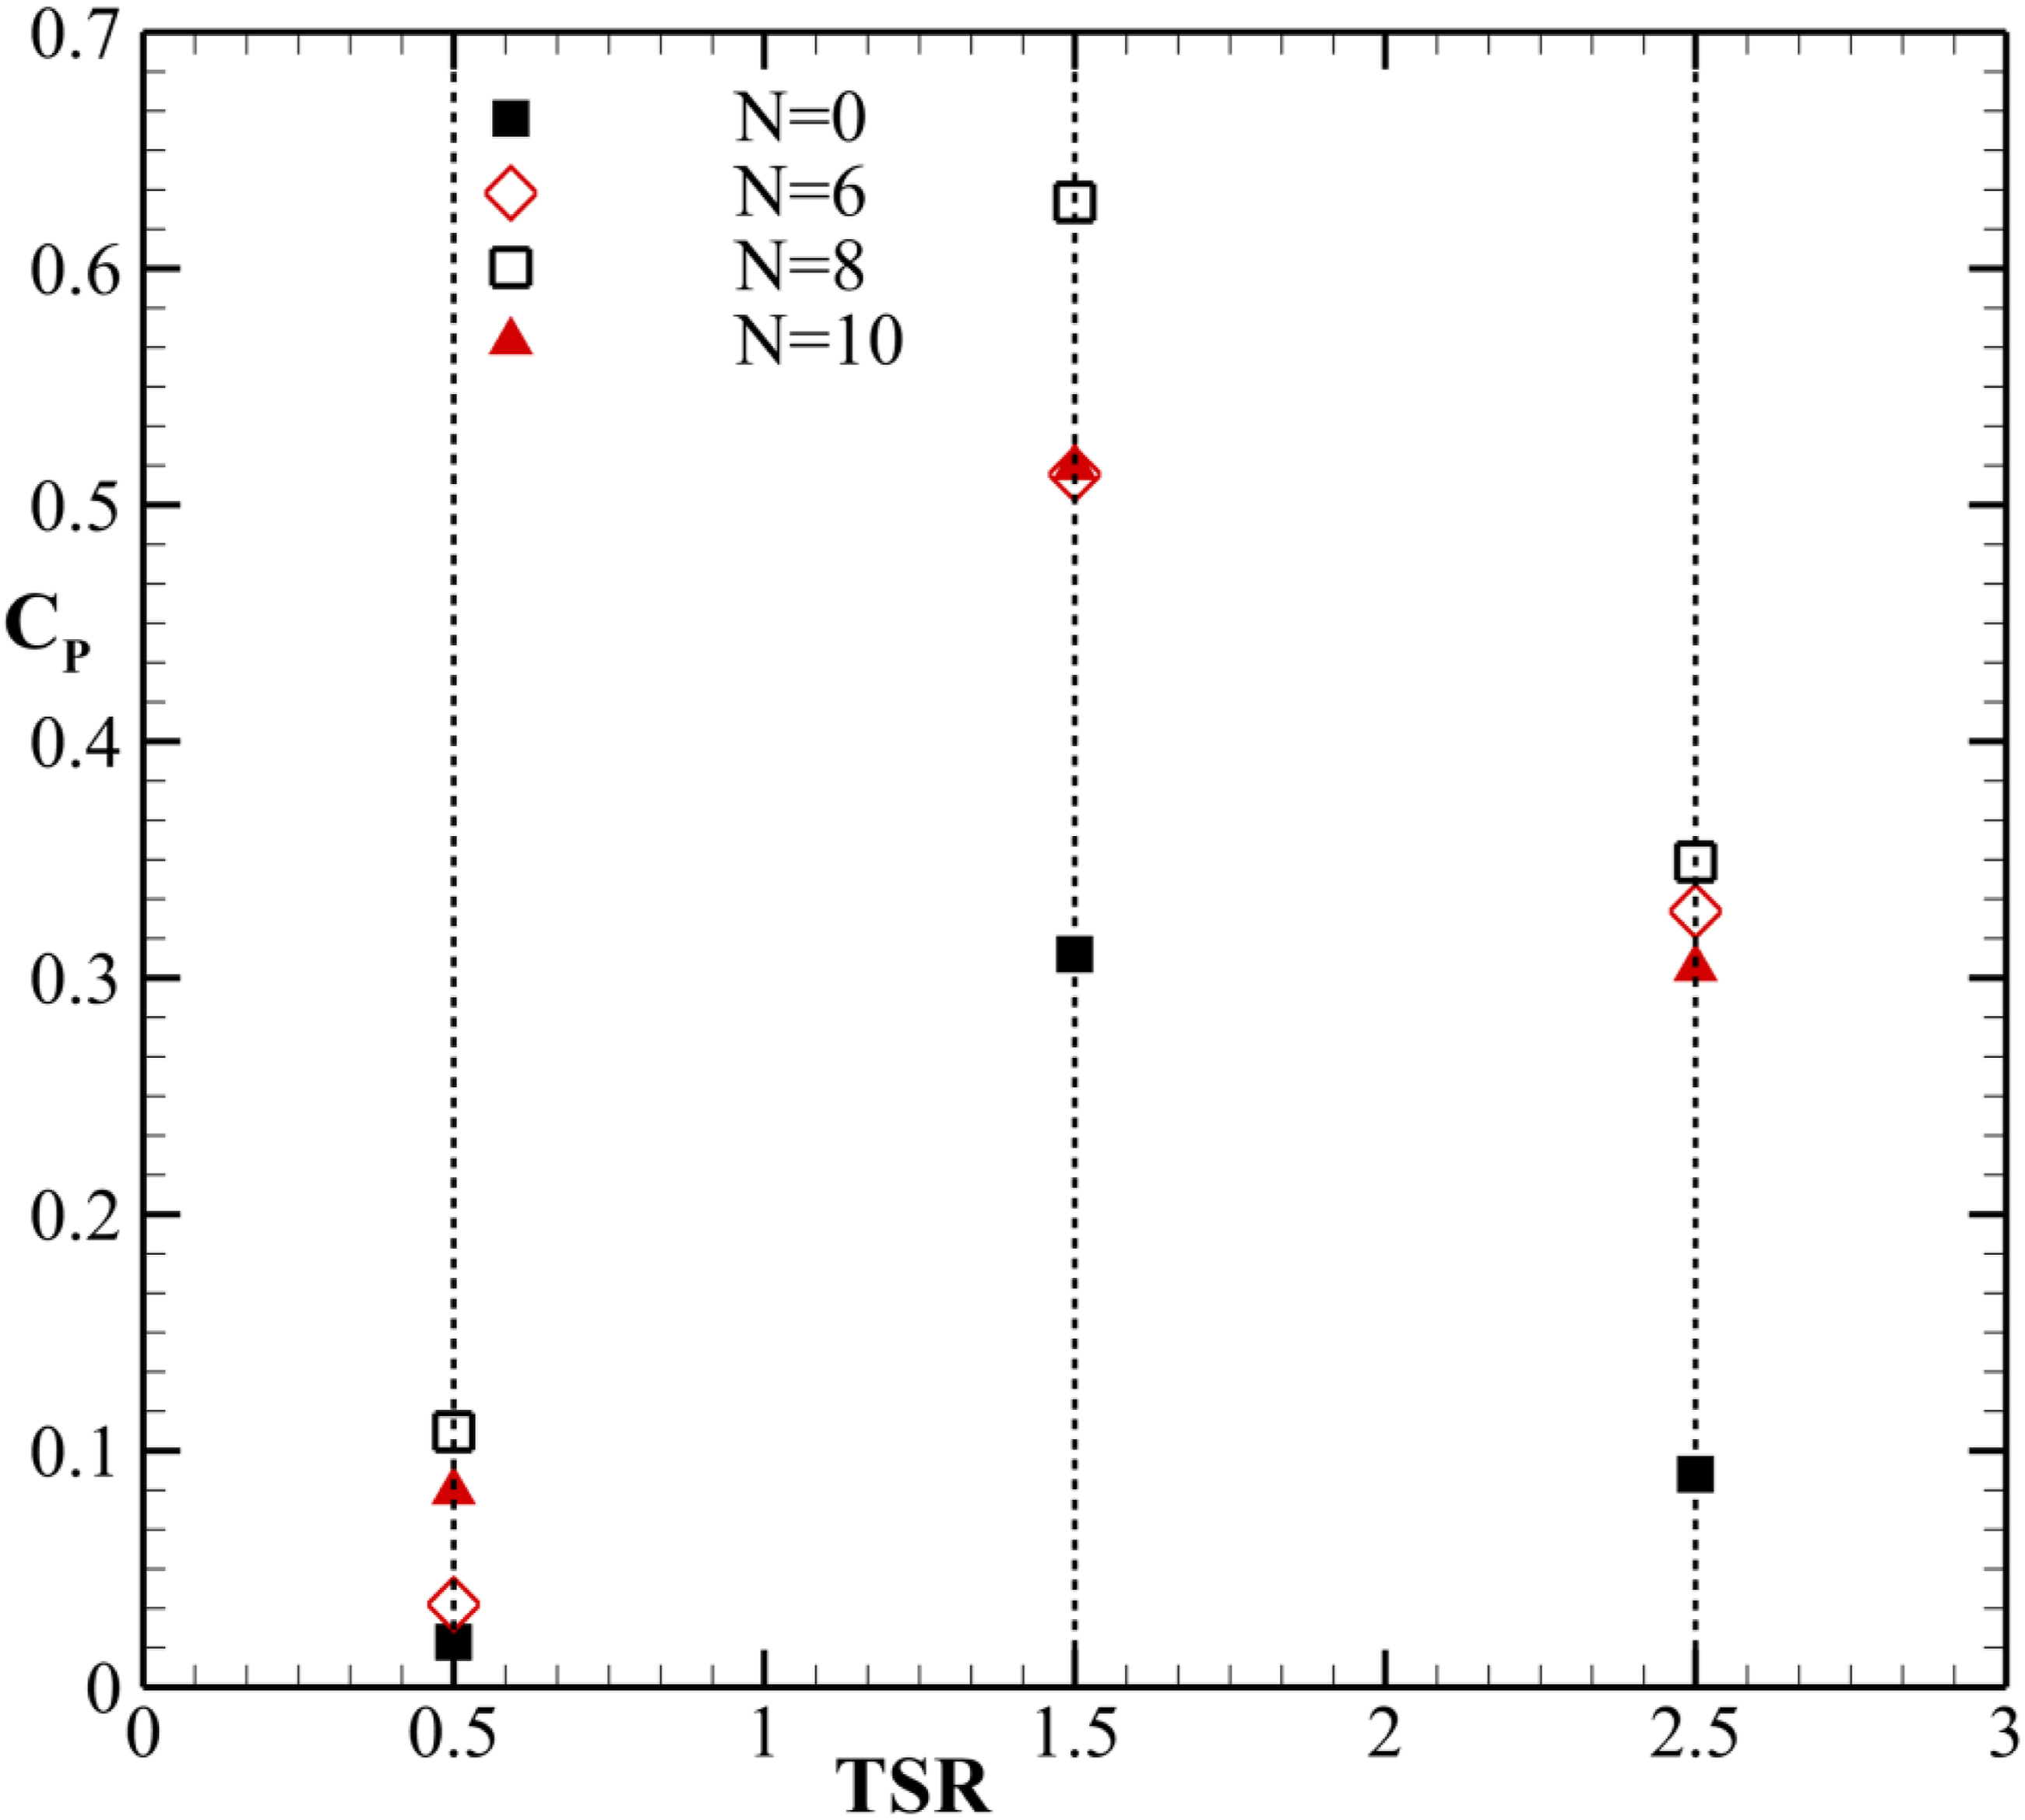
Conclusions
The current study examined the effect of the number of deflector plates on the performance of a three-bladed Darrieus wind turbine, constructed with NACA0018 airfoils using the CFD technique. The deflector plates were regarded as flat plates arranged in a circular configuration around the rotor, maintaining an inner diameter ratio of 1.6 and an outer diameter ratio of 8.8. Three quantities of deflector plates, specifically N = 6, 8, and 10, were evaluated and compared to the baseline scenario without deflector plates. Calculations were conducted for a constant free-wind speed of 6 m/s across various TSR values of 0.5, 1.5, and 2.5. The findings indicated that implementing deflector plates surrounding a three-bladed Darrieus rotor significantly enhances the airflow injected into the rotor and increases the interaction between the rotor and the airflow. This improvement in the flow field around the rotor exhibits an inverse relationship with TSR. At the maximum TSR value of 2.5, the significance of the number of deflector plates was diminished. Additionally, the presence of deflector plates around the Darrieus rotor considerably elevates the torque coefficient while reducing the time duration during which the rotor produces negative torque. Ultimately, it was concluded that the configuration with N = 8 emerged as the optimal choice, exhibiting the highest power characteristics across all cases at every TSR value. For the optimal number of deflector plates, improvements in mean power coefficient of 456.7%, 102.9%, and 287.7% were documented relative to the case without deflector plates under TSR values of 0.5, 1.5, and 2.5, respectively. These significant improvements in average power features highlight the necessity of implementing deflector plates around a Darrieus rotor and may be taken into account by vertical axis wind turbine manufacturers.
The future scope
This study can be a basis for further research on the aerodynamic performance of Darrieus rotors with deflector plates. It is advisable to examine how different free-wind speeds influence the optimal number of deflector plates. Additionally, exploring the effects of various shapes of deflector plates surrounding a Darrieus rotor presents a valuable research opportunity. Lastly, the intensity of incoming turbulence is a significant factor in assessing the performance of a Darrieus rotor equipped with deflector plates.
Footnotes
Authors contribution
Funding
The authors received no financial support for the research, authorship, and/or publication of this article.
Declaration of conflicting interests
The authors declared no potential conflicts of interest with respect to the research, authorship, and/or publication of this article.
Data Availability Statement
No data was used for the research described in the article.