
Abstract
In this study we investigate the association between bidding firm listing status and the abnormal returns and characteristics of target firms, in the context of Australian takeovers. Similar to the US, target abnormal returns are significantly lower in private bids. However, this difference is only significant when comparing public bidders with private non-operating bidders suggesting the results are driven by a lack of operating synergy available to non-operating bidders rather than public bidder agency problems. We also study how target firm characteristics differ between public and private bidders. The results indicate that different private bidders have alternative motivations for making an acquisition. Private equity targets have a less independent board than targets of public bidders and are more undervalued. In comparison, targets of private bidders without existing business activities are smaller, have higher management ownership, lower growth and lower cash flows than targets of public bidders.
1. Introduction
This study extends prior literature by investigating the impact of bidding firm listing status in Australian takeovers. We examine whether, similar to the US (Bargeron et al., 2008), target firm shareholders receive lower abnormal returns when the bidder is not stock exchange listed. Furthermore, using a more comprehensive sample than prior studies we investigate the motivations that drive Australian public-to-private (PTP) takeovers. We also extend the approach used in previous research by partitioning private bidders into three groups: private equity, private operating and private non-operating. 1 This separation is performed as the three categories of private bidders are expected to have differing motives for conducting a takeover. Additionally, our study presents evidence on Australian private equity takeovers with contrasting results to those reported in Chapple et al. (2010) and Chapple et al. (2011).
Takeovers are a well-researched area of corporate finance. A consistent finding across many countries is that target shareholders earn significant abnormal returns around takeover announcements (e.g., Betton et al., 2009; Hodgkinson and Partington, 2008; Bugeja, 2011). Until recently however, studies examining the source of these gains did not consider the influence of bidding firm listing status. This gap in the literature is surprising as a substantial proportion of takeovers are PTP transactions. For instance, Weir and Wright (2006) and Bargeron et al. (2008) report PTP takeovers represent respectively 24% and 27% of takeovers announced in the UK and US respectively.
Bargeron et al. (2008) investigate the influence of bidding firm listing status on target firm abnormal returns in the US. They report target shareholders receive significantly higher abnormal returns in acquisitions made by publicly listed firms. However, after partitioning listed bidders by the level of managerial ownership they show that target firm abnormal returns are significantly higher only for listed bidders that have low managerial ownership. They thus conclude that the difference in abnormal returns across bidder listing status is driven by greater agency problems occurring in bidders with low managerial ownership.
This study examines whether Australian takeovers yield similar findings to those in Bargeron et al. (2008). This investigation makes a contribution for a number of reasons. Firstly, our results indicate whether the findings in Bargeron et al. (2008) are robust outside the US. Secondly, as prior Australian literature (e.g., Bugeja and Da Silva Rosa, 2010; Humphrey-Jenner and Powell, 2011) on target shareholder abnormal returns does not consider bidding firm listing status, this study extends previous research. Thirdly, in our analysis of target shareholder abnormal returns we partition non-listed bidders into private equity, private operating and private non-operating. This finer partitioning allows us to determine if target shareholder abnormal returns differ by listing status only for certain types of non-listed bidder. Finally, this study provides the first multivariate analysis of whether target shareholders receive different abnormal returns when the bidder includes one or more private equity players. 2 Our study thus determines the validity of public criticisms that private equity bidders are ‘barbarians at the gate’ or are ‘driven by greed’ and their actions disadvantage target shareholders. 3
Using a sample of 800 takeovers announced for Australian Securities Exchange (ASX) listed firms between 1997 and 2008 we find approximately 30% involve a PTP transaction. This percentage is higher than that for the UK (Weir and Wright, 2006) and US (Bargeron et al., 2008) and justifies an examination of the impact of bidder listing status in Australian takeovers. Our empirical analysis indicates that similar to the US, target shareholders earn significantly higher abnormal returns in takeovers announced by publicly listed bidders. However, further investigation reveals that this result is sensitive to partitioning private bidders into private equity, private operating or private non-operating. This additional analysis indicates that target abnormal returns for public bidders are only significantly higher to those for private non-operating bidders. In contrast with the US findings, we do not find that the higher target returns for public bidders are driven by agency problems in the bidding firms. The most likely explanation for our result is that private non-operating bidders pay a lower premium as they are unable to realise operating synergies from a takeover. Our results also show there is no difference in target shareholder returns between private equity bids and public bids, lending no support to suggestions that private equity bidders take advantage of target shareholders.
The second motivation for this study is to provide a comprehensive examination of the characteristics of Australian target firms that differ between PTP takeovers and takeovers by listed bidders. This examination is worthwhile as prior Australian research (Eddey et al., 1996; Evans et al., 2005) employs only small sample sizes. Furthermore, our research method differs in two important respects to that utilised in those studies. Firstly, we compare targets of PTP takeovers with targets of publicly listed bidders, as opposed to comparing PTP targets with firms that remain listed. Secondly, this study recognises that private bidders are not homogenous and that the motivation for making an acquisition is likely to differ by private bidder type. As such, this study examines how the characteristics of public takeovers differ from those made by three categories of private bidders: private equity, private operating and private non-operating. This study also follows recent UK research (e.g., Weir et al., 2005a; Weir and Wright, 2006) by investigating if Australian PTP takeovers are a result of target firms having ineffective internal monitoring and lax corporate governance.
Our analysis of private equity targets differs to that in Chapple et al. (2010). That study compares the features of private equity targets to a sample matched by year and industry without controlling for payment method. In contrast, we recognise that private equity bidders have a very limited ability to offer equity payment and hence use only targets offered cash payment as the control. This sample selection restriction is important as prior research (e.g., Bugeja and Da Silva Rosa, 2008) shows that target firm characteristics differ across payment method. Additionally, in contrast to Chapple et al. (2010) we compare private equity targets with targets of only publicly listed bidders, rather than all other target firms. This approach is used as targets of other types of private bidders are also likely to have differing characteristics to those of public bidders.
Our findings show that targets in a PTP takeover are smaller in size, suggesting that smaller listed firms revert to private ownership to reduce the administrative costs of remaining a listed company. Consistent with targets of private bidders having ineffective internal monitoring (Weir and Wright, 2006) our results show that firms targeted by private bidders have a significantly lower proportion of non-executive directors on the board. The likelihood that a takeover will be a PTP transaction increases significantly with target firm investing cash flows. This result indicates that target firms in PTP transactions are generating substantial cash flows from asset sales. Our findings do not support the prediction that firms receive a private takeover to take advantage of unused tax shields (Lowenstein, 1985), to solve the agency problems of free cash flows (Jensen, 1986) or to avoid being acquired in another takeover (Lowenstein, 1985).
The separation of private bidders into the three categories reveals that target firm characteristics differ on alternative dimensions to takeovers announced by public bidders. Targets of private equity consortiums are more undervalued and have fewer non-executive directors in comparison to targets of public bidders. Unlike Chapple et al. (2010) we do not find that private equity targets have lower debt, greater free cash flow or lower growth. These inconsistent results indicate that determining the features of targets of private equity bidders is sensitive to the choice of control group. The firms that are made an offer by private operating bidders are significantly smaller and have higher debt levels than targets of listed bidders. The number of significant differences between targets of private and public bidders is highest when comparing private non-operating bidders with listed bidders. The targets of private non-operating bidders are smaller in size, have fewer non-executive directors and employ directors with higher ownership levels. Additionally, targets of private non-operating bidders appear to be underperforming financially as they have a significantly lower market-to-book ratio, lower free cash flows and greater investing cash inflows.
The remainder of this study is arranged as follows. Section 2 discusses prior literature relevant to this study and Section 3 describes the research method. The data collection process is described in Section 4, whilst Section 5 presents the results of the empirical testing. The final section of the paper provides discussion and a conclusion.
2. Prior literature on takeovers and bidder listing status
Following a successful acquisition, a target company is typically delisted from the stock exchange. As discussed by Weir and Wright (2006) there are however differing consequences of being acquired by a publicly listed bidder relative to a PTP transaction. When the bidder is listed, the performance of the target company will be indirectly subject to the scrutiny of investors and analysts of its listed parent. In contrast, in a PTP transaction the target will no longer be monitored by public investors. Another difference is that following a PTP takeover the ownership structure of the target will become more highly concentrated, substantially reducing the agency problems associated with the separation of ownership and control. With a public takeover however the target company will be merged into the listed group and the group will continue to be subject to the agency problems associated with widely dispersed equity. A further difference between PTP and public takeovers is that PTP acquisitions often introduce a significant level of debt into the capital structure of the acquired target at a level much greater than typically acceptable in a publicly listed firm. The benefit of introducing this additional debt is the heightened monitoring of creditors. Another point of distinction between the two offer types is that some private bidders do not conduct business operations prior to the takeover. As such, in these takeovers there is a much reduced ability of the bidder and target to combine operations and other functions to achieve operating synergies and cost savings. These differences between PTP and public takeovers are of significance when considering why target firm abnormal returns and target firm characteristics are likely to differ across the two bidder types.
2.1. Abnormal returns
Prior studies across many countries indicate that target shareholders receive significant premiums in corporate takeovers (e.g., Bargeron et al. (2008) in the US; Bugeja (2005) in Australia; Constantinou et al. (2005) in the UK). However, until Bargeron et al. (2008) little attention had been paid to whether the bidder was publicly listed. That study compared premiums paid for target firms in the US by public and private acquirers and reported that public firms pay significantly higher premiums than private firms after controlling for other deal characteristics (e.g., hostility, competing bidders, toehold, etc.). 4 They suggest that agency explanations explain this result, as there is no difference in premiums when they compare private bidders with public bidders that have management ownership greater than 50%. As discussed above, another potential explanation for the difference in premiums is that there is less opportunity for synergies when a private bidder acquires a target. No prior Australian research has undertaken a multivariate comparison of target shareholder returns in PTP and public takeovers. 5 This lack of prior evidence is surprising as PTP takeovers comprise a significant percentage of takeovers announced for Australian listed firms.
2.2. Motivations for private acquisitions
Many reasons have been advanced in the literature as a motivation for a PTP transaction. These reasons which are summarised in Palepu (1990) include the following:
2.2.1. Incentive alignment
A consequence of the separation of ownership and control is that managers may privately benefit from behaviour that is not in the interest of the firm
Firms with relatively high levels of managerial ownership may also be more likely to be taken private. With increasing managerial ownership managers become entrenched and have sufficient ownership rights to block a takeover from an outside party. Such managers may be motivated to take actions that are inconsistent with maximising shareholder wealth (e.g., risk aversion) due to the substantial amount of personal wealth tied up in the firm (Halpern et al., 1999). By taking the firm private it is possible for the managers to reduce the level of their shareholdings. Additionally, if debt is used to finance the acquisition this will provide an incentive for managers to re-focus on maximising shareholder wealth. Studies in the US (Halpern et al., 1999) and UK (Weir et al., 2005a, 2005b) indicate that firms taken private are more likely to have higher board and CEO shareholdings. Prior Australian evidence however finds no difference in managerial ownership between firms that go private and a control group of listed firms (Eddey et al., 1996 and Evans et al., 2005).
As an extension of the agency problems occurring in publicly owned corporations, Jensen (1986) describe the agency problems associated with free cash flow. Free cash flow is defined as cash flow in excess of that required to fund all positive net present value projects available to the firm. Jensen hypothesises that where a firm has excess free cash flows and low growth prospects the excess cash may be used by managers to grow the size of the company beyond the optimum level. One incentive for managers to increase the size of their firm is that managers with greater resources under their control often receive higher levels of compensation (Grinstein and Hribar, 2004). Taking the company private in such circumstances is expected to alleviate these agency problems as the selection and implementation of projects can be more easily scrutinised by owners and creditors, who are likely to have greater access to inside information. Further, the process of taking the company private typically increases the leverage of the firm thereby bonding managers to pay out excess cash flows to make loan repayments.
Evidence on the impact of target free cash flows on the likelihood of a PTP takeover is mixed. Lehn and Poulsen (1989) find that US firms that go private have higher free cash flows and lower growth prospects than firms that remain listed. Similarly, Opler and Titman (1993) find US firms that undertake a leveraged buyout (LBO) have high free cash flow and low q-ratios. Insignificant results for free cash flows are however found in other studies: US (Halpern et al., 1999), UK (Weir et al., 2005a, 2005b; Weir and Wright, 2006) and Australia (Eddey et al., 1996; Evans et al., 2005). Lower growth for firms that are taken private is found in Australia (Evans et al., 2005) and the UK (Weir and Wright, 2006).
Opler and Titman (1993) argue that agency problems are heightened in high growth technology firms and that due to the greater risk for these types of organisations they will not be candidates for an LBO. Consistent with this expectation they show that a firm’s research and development intensity reduces the likelihood they will be acquired by a private bidder. Evans et al. (2005) document a similar finding in Australia.
2.2.2. Ineffective internal monitoring
Weir and Wright (2006) argue that firms with ineffective internal governance and monitoring mechanisms are more likely to be subject to a PTP takeover as such firms are most likely to benefit from the higher monitoring of managers. Their study compares public and private targets in the UK to examine if there is any difference in board composition. The results show that a PTP takeover is more likely when the CEO of a target firm is also the chairperson. The percentage of non-executive directors on the target firm board is insignificant however between the two types of targets.
2.2.3. Takeover defence
Another incentive for a PTP takeover is for the target to avoid being acquired by another bidder. In this case the private acquisition is considered to be
2.2.4. Tax benefit hypothesis
Transactions by private bidders are often highly leveraged, and increase target firm debt to levels beyond that which public shareholders would have approved. Lowenstein (1985) argues taking advantage of unused tax shields will result in public firms with low debt levels being more likely to be acquired by a private bidder than firms with high debt levels. As discussed earlier, the higher leverage also provides an incentive effect on managers to maximise firm value and bonds managers to pay out any excess cash. Support for the tax motivation for
2.2.5. Undervaluation hypothesis
A public company by maintaining a stock market listing comes under the scrutiny of market participants who place a value on the firm. Where acquirers (including managers) believe the
2.2.6. Reduction in administrative and compliance costs
There are significant costs associated with being a listed company (listing fees, reporting costs, auditing fees, compliance costs, etc.). Such costs can be relatively high for small listed firms. For example, annual listing fees for entities on the ASX are calculated on a sliding scale and have a lower dollar cost relative to market capitalisation for larger firms. 8 As discussed by DeAngelo et al. (1984) these costs can be diminished if the company is acquired by a non-listed bidder. In making this decision a target firm must trade off the administrative cost savings against the benefits of being listed (e.g., a lower relative cost of capital). As smaller companies in particular are not heavily traded and issue new shares infrequently they are less likely to achieve the benefits of being listed. It is thus expected that smaller firms will be more likely to be acquired by a private bidder. Inconsistent with this expectation, however, the results in Opler and Titman (1993) show no association between firm size (measured by total assets) and the likelihood of a private takeover.
2.2.7. Differences in motivations across private bidder type
The above section describes the various motivations for a takeover by a non-listed entity. This discussion and prior Australian research (Eddey et al., 1996; Evans et al., 2005), however, ignore that private bidders encompass alternative bidder types including private equity bidders, operating firms and non-operating firms. The motivations for acquisition by these different types of bidders are unlikely to be consistent. For example, private equity bidders are more likely to make an acquisition and increase target firm debt levels to take advantage of unused tax shields than the other types of private bidders. In addition, the Australian Private Equity & Venture Capital Association Limited (AVCAL) (2007) state that private equity investments seek to align the interest of management and owners, provide active stewardship, and manage and plan the activities of the entity to promote and achieve long-term growth. 9 This suggests that targets of private equity bidders are likely to have lower growth, greater agency problems associated with the separation of ownership and control, and be subject to ineffective internal monitoring. As private equity bidders have access to substantial resources they will be able to make takeover offers for larger target firms than the other types of private bidders. Evidence supporting some of these expectations is reported in Chapple et al. (2010). They find that relative to other targets, targets of private equity funds have lower debt and higher free cash flow consistent respectively with the tax benefit and incentive alignment hypothesis. Their results also show that private equity targets are of larger size and have a lower market-to-book ratio consistent with these firms having greater opportunities for future growth.
It is expected that private non-operating bidders will frequently be used as a vehicle by existing target firm management to take a listed target private. One incentive for such a transaction is to defeat an alternative takeover offer thus allowing existing management to retain their positions. Also, existing management may use a private bidder to delist the firm if based on their private information they believe the target is undervalued. Where existing management takes their firm private it is expected that they have high levels of existing ownership. Relative to other takeovers the lower pool of funds available to private non-operating bidders would suggest that they make acquisitions of smaller targets.
As private operating bidders are undertaking existing business activities they have a greater ability to extract operating synergies from a business combination than the other types of private bidders. Thus, the motive for making a takeover may be less influenced by reducing agency problems or acting as a takeover defence. One would expect that these acquisitions may be driven with an expectation of improving target firm performance, suggesting that these target firms may be experiencing low growth or underperforming prior to the takeover. Similar to private non-operating bidders the size of target firms acquired by a private operating bidder is expected to be smaller than those of listed bidders due to financial constraints.
3. Research method
Our research method employs two regression models to examine how target firm abnormal returns and characteristics differ between takeovers initiated by public and private bidders. As described in the prior section the motivations for a PTP takeover are likely to vary across the three types of private bidder. As a result both regression models are estimated both for the total sample and after partitioning the sample into the different private bidder categories.
Model (1) determines the target firm characteristics that vary between takeovers by public and private bidders. The model uses logit regression with the dependent variable (PRIVATE) coded as one where the bidding firm is a non-listed bidder. The variables included in model (1) are based on prior literature and are expected to distinguish firms subject to a private bid from those subject to a bid from a listed bidder.
A target firm’s free cash flow is expected to be positively related to the likelihood that a firm will go private. Free cash flow (FCF) is calculated for the year prior to the takeover as cash flow from operations minus dividends. This measure is scaled by average assets to reduce heteroskedasticity. Target firm growth is measured using sales growth over the two years before the takeover announcement (SALESGR). We also include the target firm market-to-book ratio in the model as an additional proxy for growth opportunities (MKTBK). As firms with greater capital expenditure are more likely to be undertaking wasteful expenditure we include net investing cash flows scaled by total assets in the model (CAPEX). The relationship between managerial ownership and the likelihood a firm will be receive a PTP offer is uncertain. Whilst it is hypothesised that firms with low ownership are more likely to receive a takeover from a non-listed bidder to reduce agency costs, other predictions suggest firms with higher ownership are more likely to be taken private. To allow for a non-linear relationship between PTP takeover likelihood and target board ownership we include both target board ownership (BRDOWN) and board ownership squared (BRDOWNSQ) in the model. Earlier studies (Opler and Titman, 1993; Evans et al., 2005) have found that firms with greater research intensity are less likely to be acquired by a private bidder. We measure target firm research intensity in the year prior to the takeover announcement as research and development expense divided by sales revenue (RESEARCH). As Weir and Wright (2006) suggest that target firms with weak internal monitoring mechanisms are more likely candidates for private bids we include as a variable the proportion of the target firm board that are non-executive directors (NONEXEC).
Prior research suggests that a firm may seek a private bidder to avoid a takeover threat. To examine this prediction we use two variables. The first variable (COMPBID) is a dummy variable indicating takeovers where a competing bid exists concurrently for the target firm. The second variable (PRIORBID) is coded as one where a takeover bid was made for the target firm in the two years prior to the current takeover contest. It is predicted that smaller firms will be more likely to receive a takeover offer by a private firm to reduce administrative and listing costs. Further, private firms (other than private equity) are unlikely to have the resources available to acquire a large listed entity. Target firm size is measured as the natural logarithm of target market capitalisation three months prior to the takeover announcement (SIZE). It has been suggested that firms are acquired by a private bidder to take advantage of unused tax shields. We test this prediction using the debt-to-equity ratio (LEV) of the target firm disclosed for the financial year-end prior to the takeover announcement. The liquidity of the target firm, measured using the current ratio, is also included as a control (LIQUID). The final variables are intended to determine if target firms are more likely to be subject to a private bid if they are undervalued or underperforming. Following Weir and Wright (2006) we proxy for undervaluation using the target firm’s market capitalisation at the end of the financial year before the takeover announcement divided by market capitalisation at the end of the previous financial year. We measure target firm performance using the target firm’s return on equity ratio for the financial year before the takeover (ROE).
The full regression model (1) is as follows:
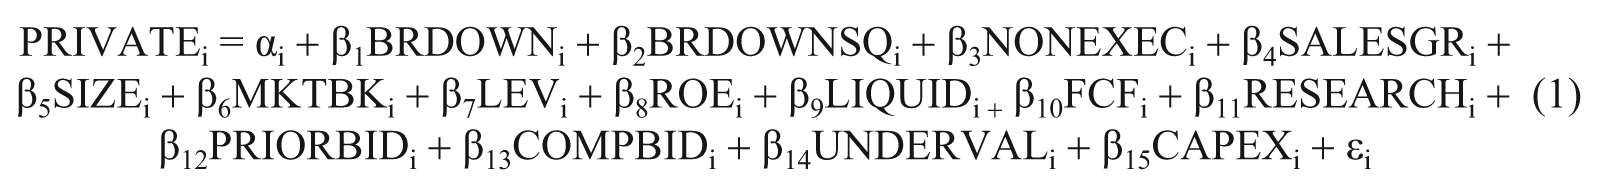
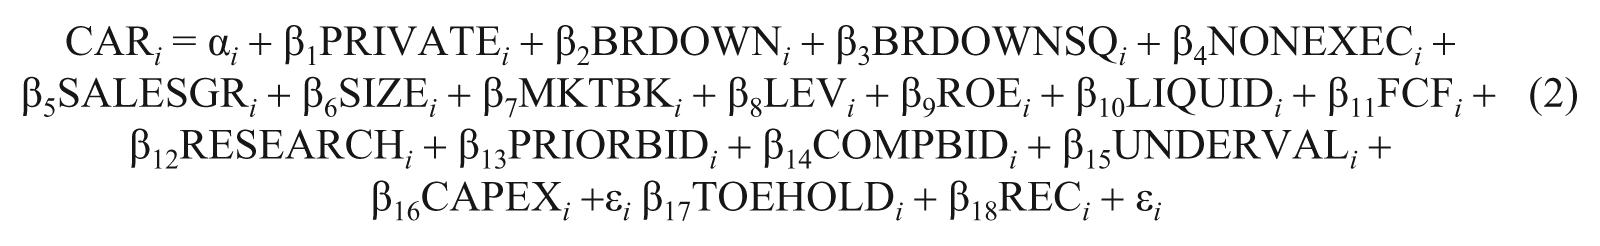
The second model (i.e., model 2) we estimate investigates whether target shareholder abnormal returns differ between takeovers announced by private and public bidders. This model employs OLS and the dependent variable is the target firm cumulative abnormal return calculated from 60 days prior to the takeover announcement until 30 days after (CAR). Abnormal returns are calculated using market model parameters estimated over the period from 205 days through to 90 days prior to the takeover announcement. The market return is proxied using the return on the All Ordinaries Accumulation Index. The regression includes a dummy variable (PRIVATE) denoting those takeovers where the bidder is not listed. In addition, we add the variables included in model (1). It is expected that abnormal returns will be positively associated with target firm free cash flow (Smith and Kim, 1994) and whether the firm has been subject to prior takeover interest or competing bids. If target firm managers are overinvesting in productive assets then abnormal returns will be negatively related to target firm capital expenditure. Target firm ownership structure is controlled by including the two target board ownership variables (i,e., BRDOWN and BRDOWNSQ) and the acquiring firm toehold (TOEHOLD). Stulz (1988) argues that an increased premium must be offered when a bidding firm has to purchase shares from a greater number of outside target shareholders. Consistent with this expectation Stulz et al. (1990) find target abnormal returns are positively related to target managerial ownership and negatively related to the acquiring firm toehold. Bugeja and Walter (1995) find a similar result for toehold in Australia. The coefficients on sales growth, market-to-book, return on equity, current ratio, leverage and the proxy for undervaluation are included to control respectively for target firm growth, performance, liquidity, risk and undervaluation. In addition to these variables we include a dummy variable indicating takeovers where the recommendation of target firm directors is that the offer be accepted (REC). The full model is
As private firms have a limited ability to offer equity consideration, both models are estimated using a sample comprising takeovers where exclusively cash is offered as payment. This approach is consistent with Bargeron et al. (2008) and ensures that the comparison between bidder types includes only similar acquisitions. This sample restriction is justified by previous research which documents significant differences in target firm characteristics between cash and non-cash takeovers (e.g., Bugeja and Da Silva Rosa, 2008; Faccio and Masulis, 2005; Martin, 1996; Mayer and Walker, 1996). This approach stands in contrast to the method used in the examination of private equity targets in Chapple et al. (2010) as that study did not exclude non-cash takeovers from the control group.
4. Data and descriptive statistics
The Connect 4 Mergers and Acquisitions database was used to identify 867 merger and acquisition announcements for ASX listed firms between 1997 and 2008. 10 For each takeover we examined the statutory documents lodged by the bidding firm with the ASX (available on Connect 4) to classify each bidder as either private or public. 11 For private bidders the takeover documents were used to categorise each bidder as private equity, private operating or private non-operating. It was necessary to exclude 43 takeovers due to insufficient data to estimate the regression models. An additional 24 announcements were omitted from the sample as the transaction did not involve an offer to acquire control (e.g., the introduction of a new holding company or the divestment of a subsidiary.) After these exclusions the sample consisted of 800 takeovers. Takeovers in which the bidder offered non-cash consideration were then excluded to leave a final sample of 441 takeovers. The temporal distribution of the sample is shown in Table 1.
Distribution of takeover offers from by private and public bidders
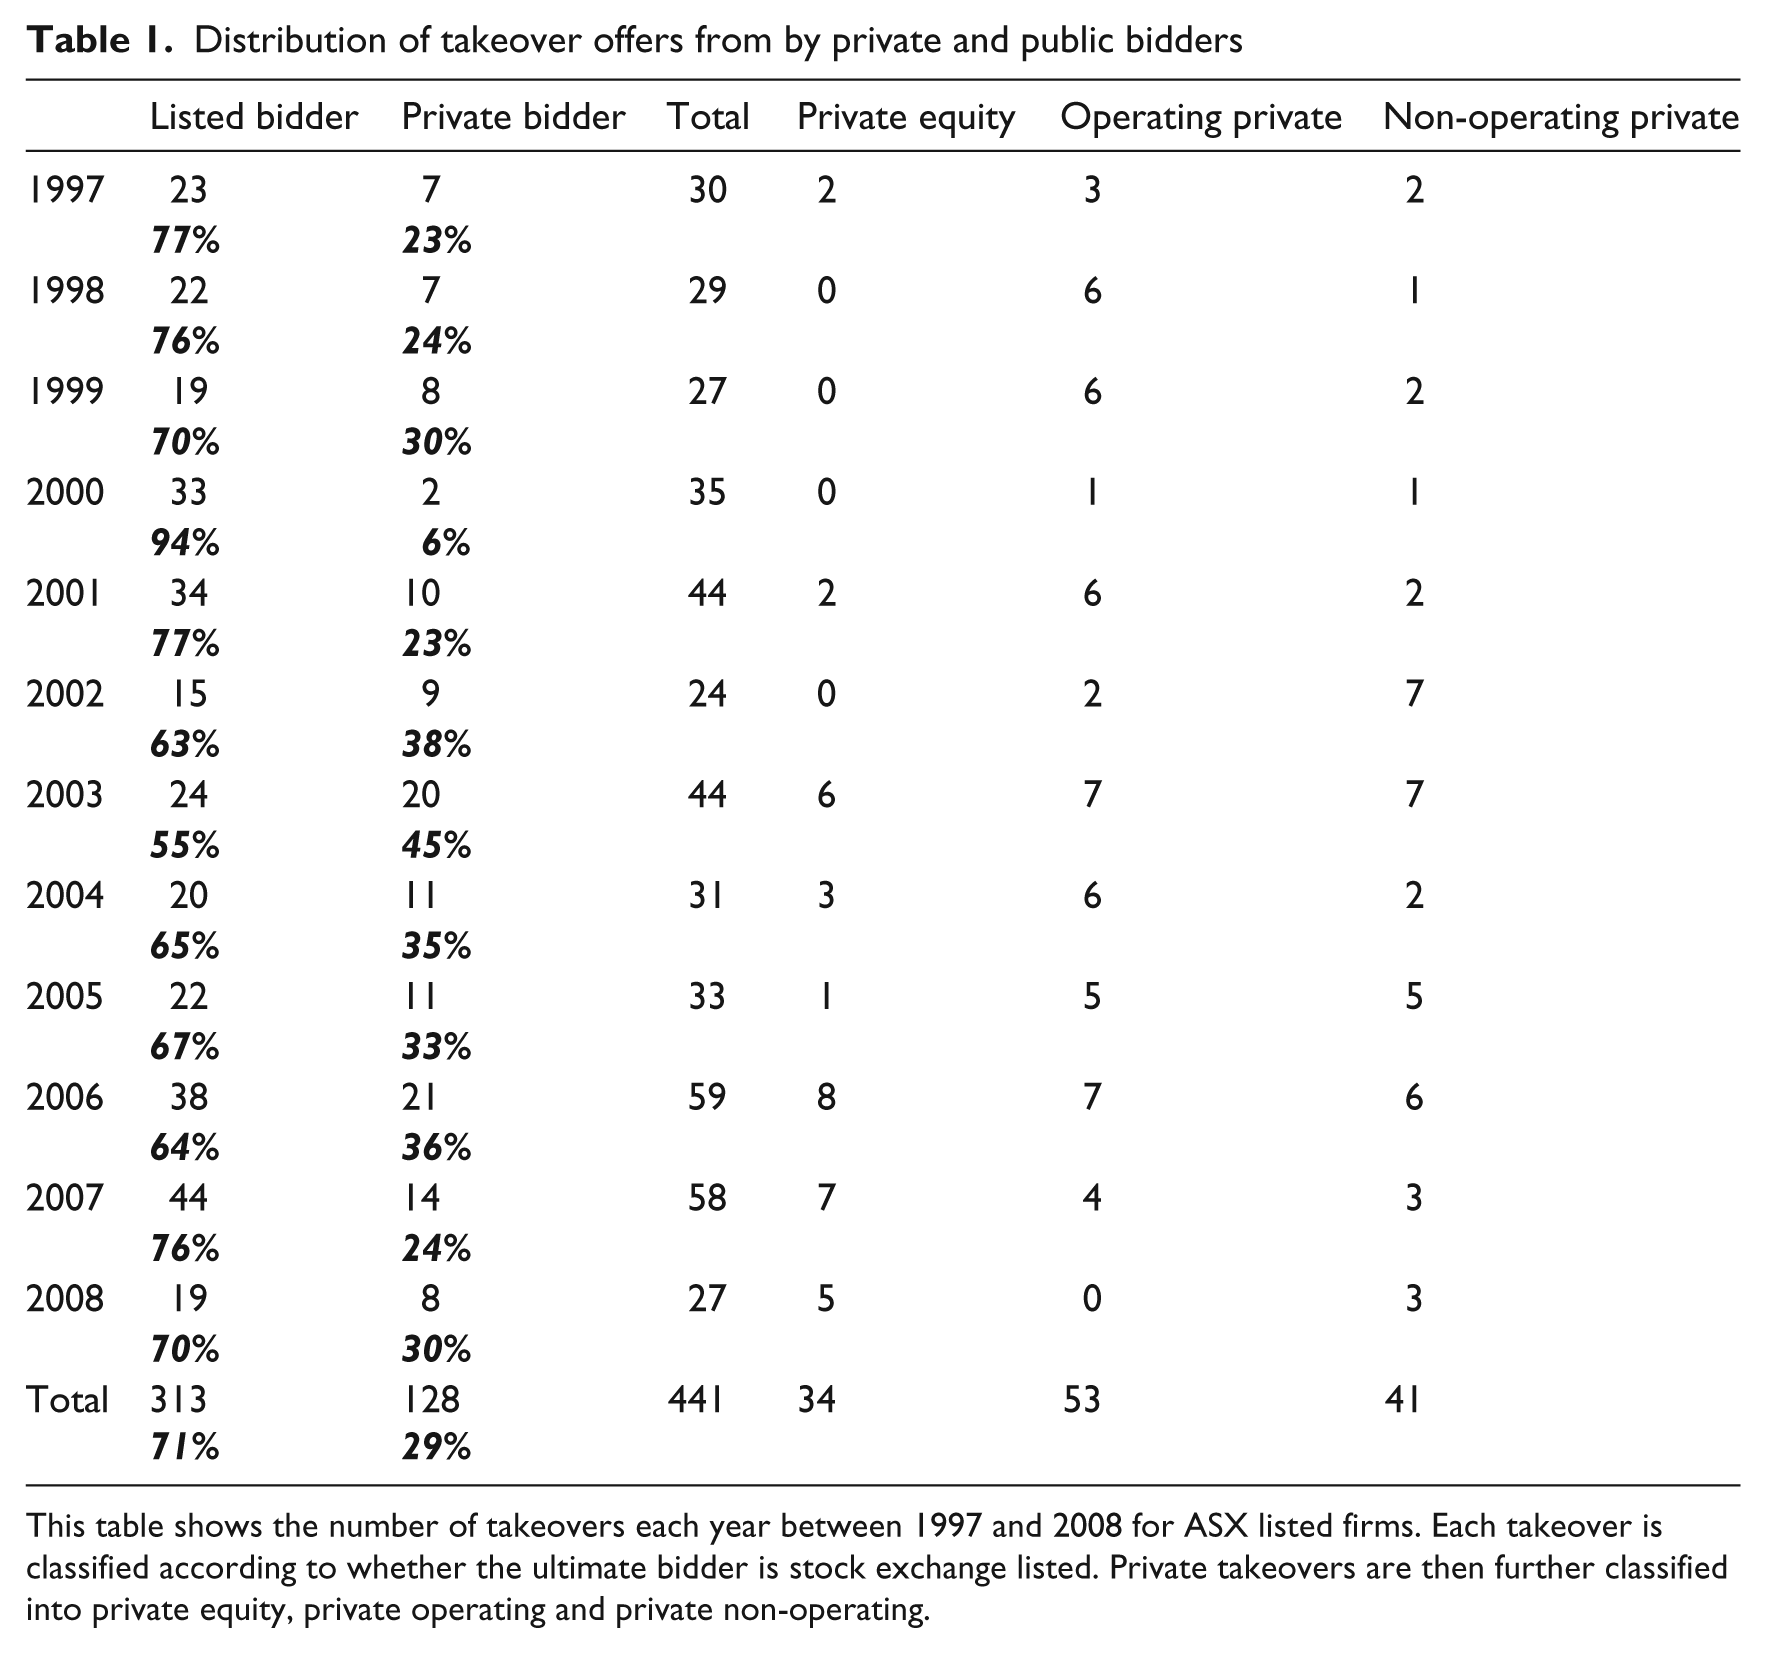
This table shows the number of takeovers each year between 1997 and 2008 for ASX listed firms. Each takeover is classified according to whether the ultimate bidder is stock exchange listed. Private takeovers are then further classified into private equity, private operating and private non-operating.
The number of takeovers is fairly stable over the sample period, with the largest number of takeovers announced in 2006. Across each year, however, there is substantial variation in the distribution of takeovers across bidder type. For example, takeovers announced by ASX listed firms comprise 94% of takeovers in 2000 but only 55% in 2003. Private bidders comprise on average 29% of acquisition announcements. Included amongst the private bidders are 34 (27%) private equity bidders, 53 (41%) operating firms and 41 (32%) non-operating firms. 12
Statutory takeover documents lodged with the ASX by the bidder and target were used to collect information on consideration type, bidding firm toehold, the recommendation of the target firm board and target director ownership. Target firm financial reports for the financial year ended before the takeover announcement were downloaded from the Aspect Huntley FinAnalysis database and the necessary financial information hand collected. Share price information needed to calculate CARs, market capitalisation, the undervaluation measure and the market-to-book ratio were sourced from the Core Research Database administered by the Securities Industry Research Centre of Asia-Pacific (i.e., SIRCA).
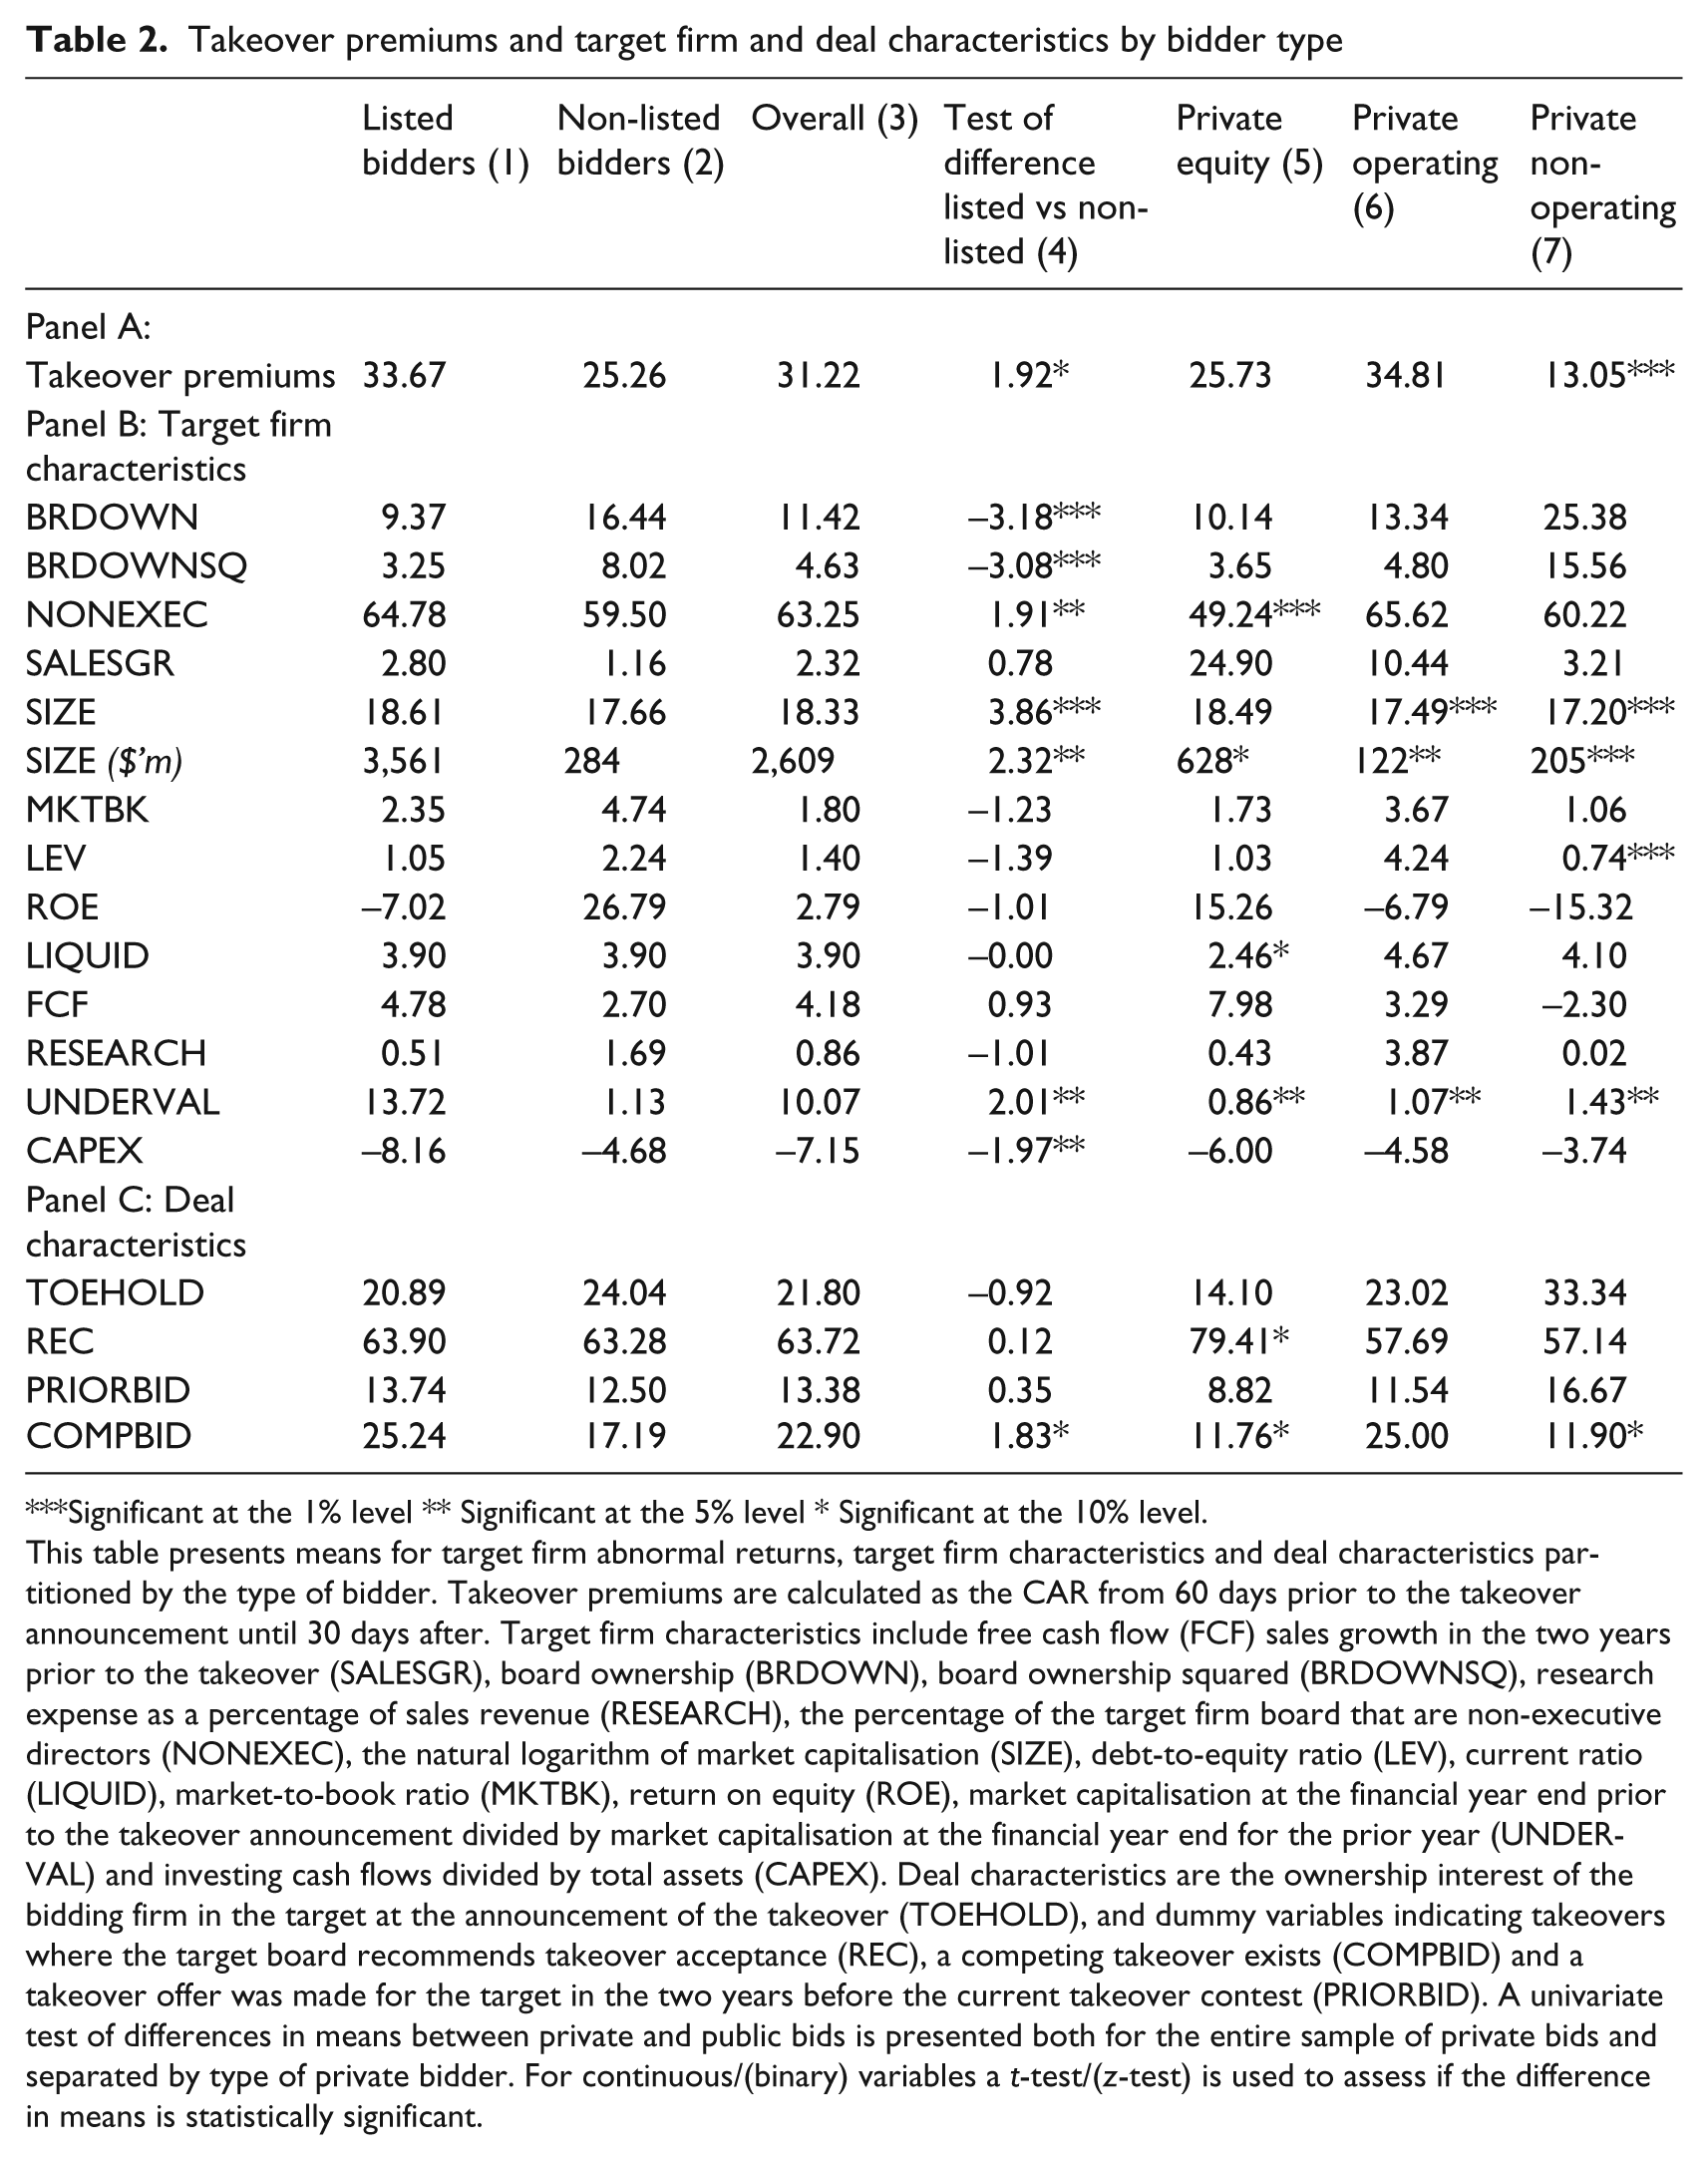
Table 2 presents descriptive statistics on the variables included in the two regression models. Columns (1) and (2) present details for listed and non-listed bidders respectively, whilst columns (5) through (7) separate the information for private bidders into the three bidder types. Panel A shows that the average abnormal return for listed and unlisted bidders are respectively 34% and 25% with the difference statistically significant at the 10% level. The mean abnormal return for non-operating private bidders is 13% which is significantly below that for public bidders. The target returns for private equity and private operating bids do not statistically differ to those for public bidders.
Takeover premiums and target firm and deal characteristics by bidder type
Significant at the 1% level ** Significant at the 5% level * Significant at the 10% level.
This table presents means for target firm abnormal returns, target firm characteristics and deal characteristics partitioned by the type of bidder. Takeover premiums are calculated as the CAR from 60 days prior to the takeover announcement until 30 days after. Target firm characteristics include free cash flow (FCF) sales growth in the two years prior to the takeover (SALESGR), board ownership (BRDOWN), board ownership squared (BRDOWNSQ), research expense as a percentage of sales revenue (RESEARCH), the percentage of the target firm board that are non-executive directors (NONEXEC), the natural logarithm of market capitalisation (SIZE), debt-to-equity ratio (LEV), current ratio (LIQUID), market-to-book ratio (MKTBK), return on equity (ROE), market capitalisation at the financial year end prior to the takeover announcement divided by market capitalisation at the financial year end for the prior year (UNDERVAL) and investing cash flows divided by total assets (CAPEX). Deal characteristics are the ownership interest of the bidding firm in the target at the announcement of the takeover (TOEHOLD), and dummy variables indicating takeovers where the target board recommends takeover acceptance (REC), a competing takeover exists (COMPBID) and a takeover offer was made for the target in the two years before the current takeover contest (PRIORBID). A univariate test of differences in means between private and public bids is presented both for the entire sample of private bids and separated by type of private bidder. For continuous/(binary) variables a t-test/(z-test) is used to assess if the difference in means is statistically significant.
A comparison of target firm and deal characteristics across bidder types is provided respectively in Panels B and C of Table 2. This comparison indicates there is no significant difference in free cash flow, market-to-book ratio, research intensity, return on equity, toehold or prior takeover bids between targets of public and private bidders. Consistent with the argument of Weir and Wright (2006), targets subject to a private takeover have a lower percentage of non-executive directors, with this result driven by private equity takeovers. Targets of private bidders have significantly higher board ownership than firms targeted by public bidders. Inconsistent with private takeovers being used as a takeover defence, competing takeover bids arise less frequently for private equity and private non-operating takeovers. Target firm size is significantly lower in private operating and private non-operating bids. On the other hand, private equity bidders announce takeovers for firms of similar size to public bidders. Target firm leverage is significantly lower for takeovers announced by private non-operating firms. Similar to the result in Chapple et al. (2010) and Chapple et al. (2011), private equity bids are more likely than public bids to be conducted as a friendly takeover.
Pearson and Spearman correlation coefficients between the variables included in the regression models are presented in Table 3. The results show that target firm CARs are significantly lower in private bids. When private bidders are partitioned into the three types there is a significant negative correlation between abnormal returns and private non-operating bidders (PRIVNOP) but an insignificant correlation for private equity (PRIVEQ) and private operating bidders (PRIVOP). The significant correlations between private bidders and the various explanatory variables are generally consistent with those presented in Table 2. As no individual correlation coefficient is above 0.8, multicollinearity is unlikely to be a serious problem in the estimation of the regression models. 13
Correlation between dependent and independent variables (Pearson correlations are above the diagonal and Spearman correlations are below)

Significant at the 1% level ** Significant at the 5% level * Significant at the 10% level.
This table presents correlation coefficients between the dependent and independent variables in the two regression models. CARs are calculated from 60 days prior to the takeover announcement until 30 days after (CAR). An indicator variable is used to denote takeovers announced by non-listed bidders (PRIVATE). Non-listed bidders are further separated into private equity (PRIVEQ), private operating (PRIVOP) and private non-operating bidders (PRIVNOP). Target firm characteristics include free cash flow (FCF), sales growth in the two years prior to the takeover (SALESGR), board ownership (BRDOWN), board ownership squared (BRDOWNSQ), research expense as a percentage of sales revenue (RESEARCH), the percentage of the target firm board that are non-executive directors (NONEXEC), the natural logarithm of market capitalisation (SIZE), debt-to-equity ratio (LEV), current ratio (LIQUID), market-to-book ratio (MKTBK) return on equity ratio (ROE), undervaluation (UNDERVAL) and capital expenditure (CAPEX). Deal characteristics are the ownership interest of the bidding firm in the target (TOEHOLD), and dummy variables indicating takeovers where the target board recommends takeover acceptance (REC), a competing takeover exists (COMPBID), and a takeover offer was made for the target in the two years before the current takeover contest (PRIORBID).
5. Results
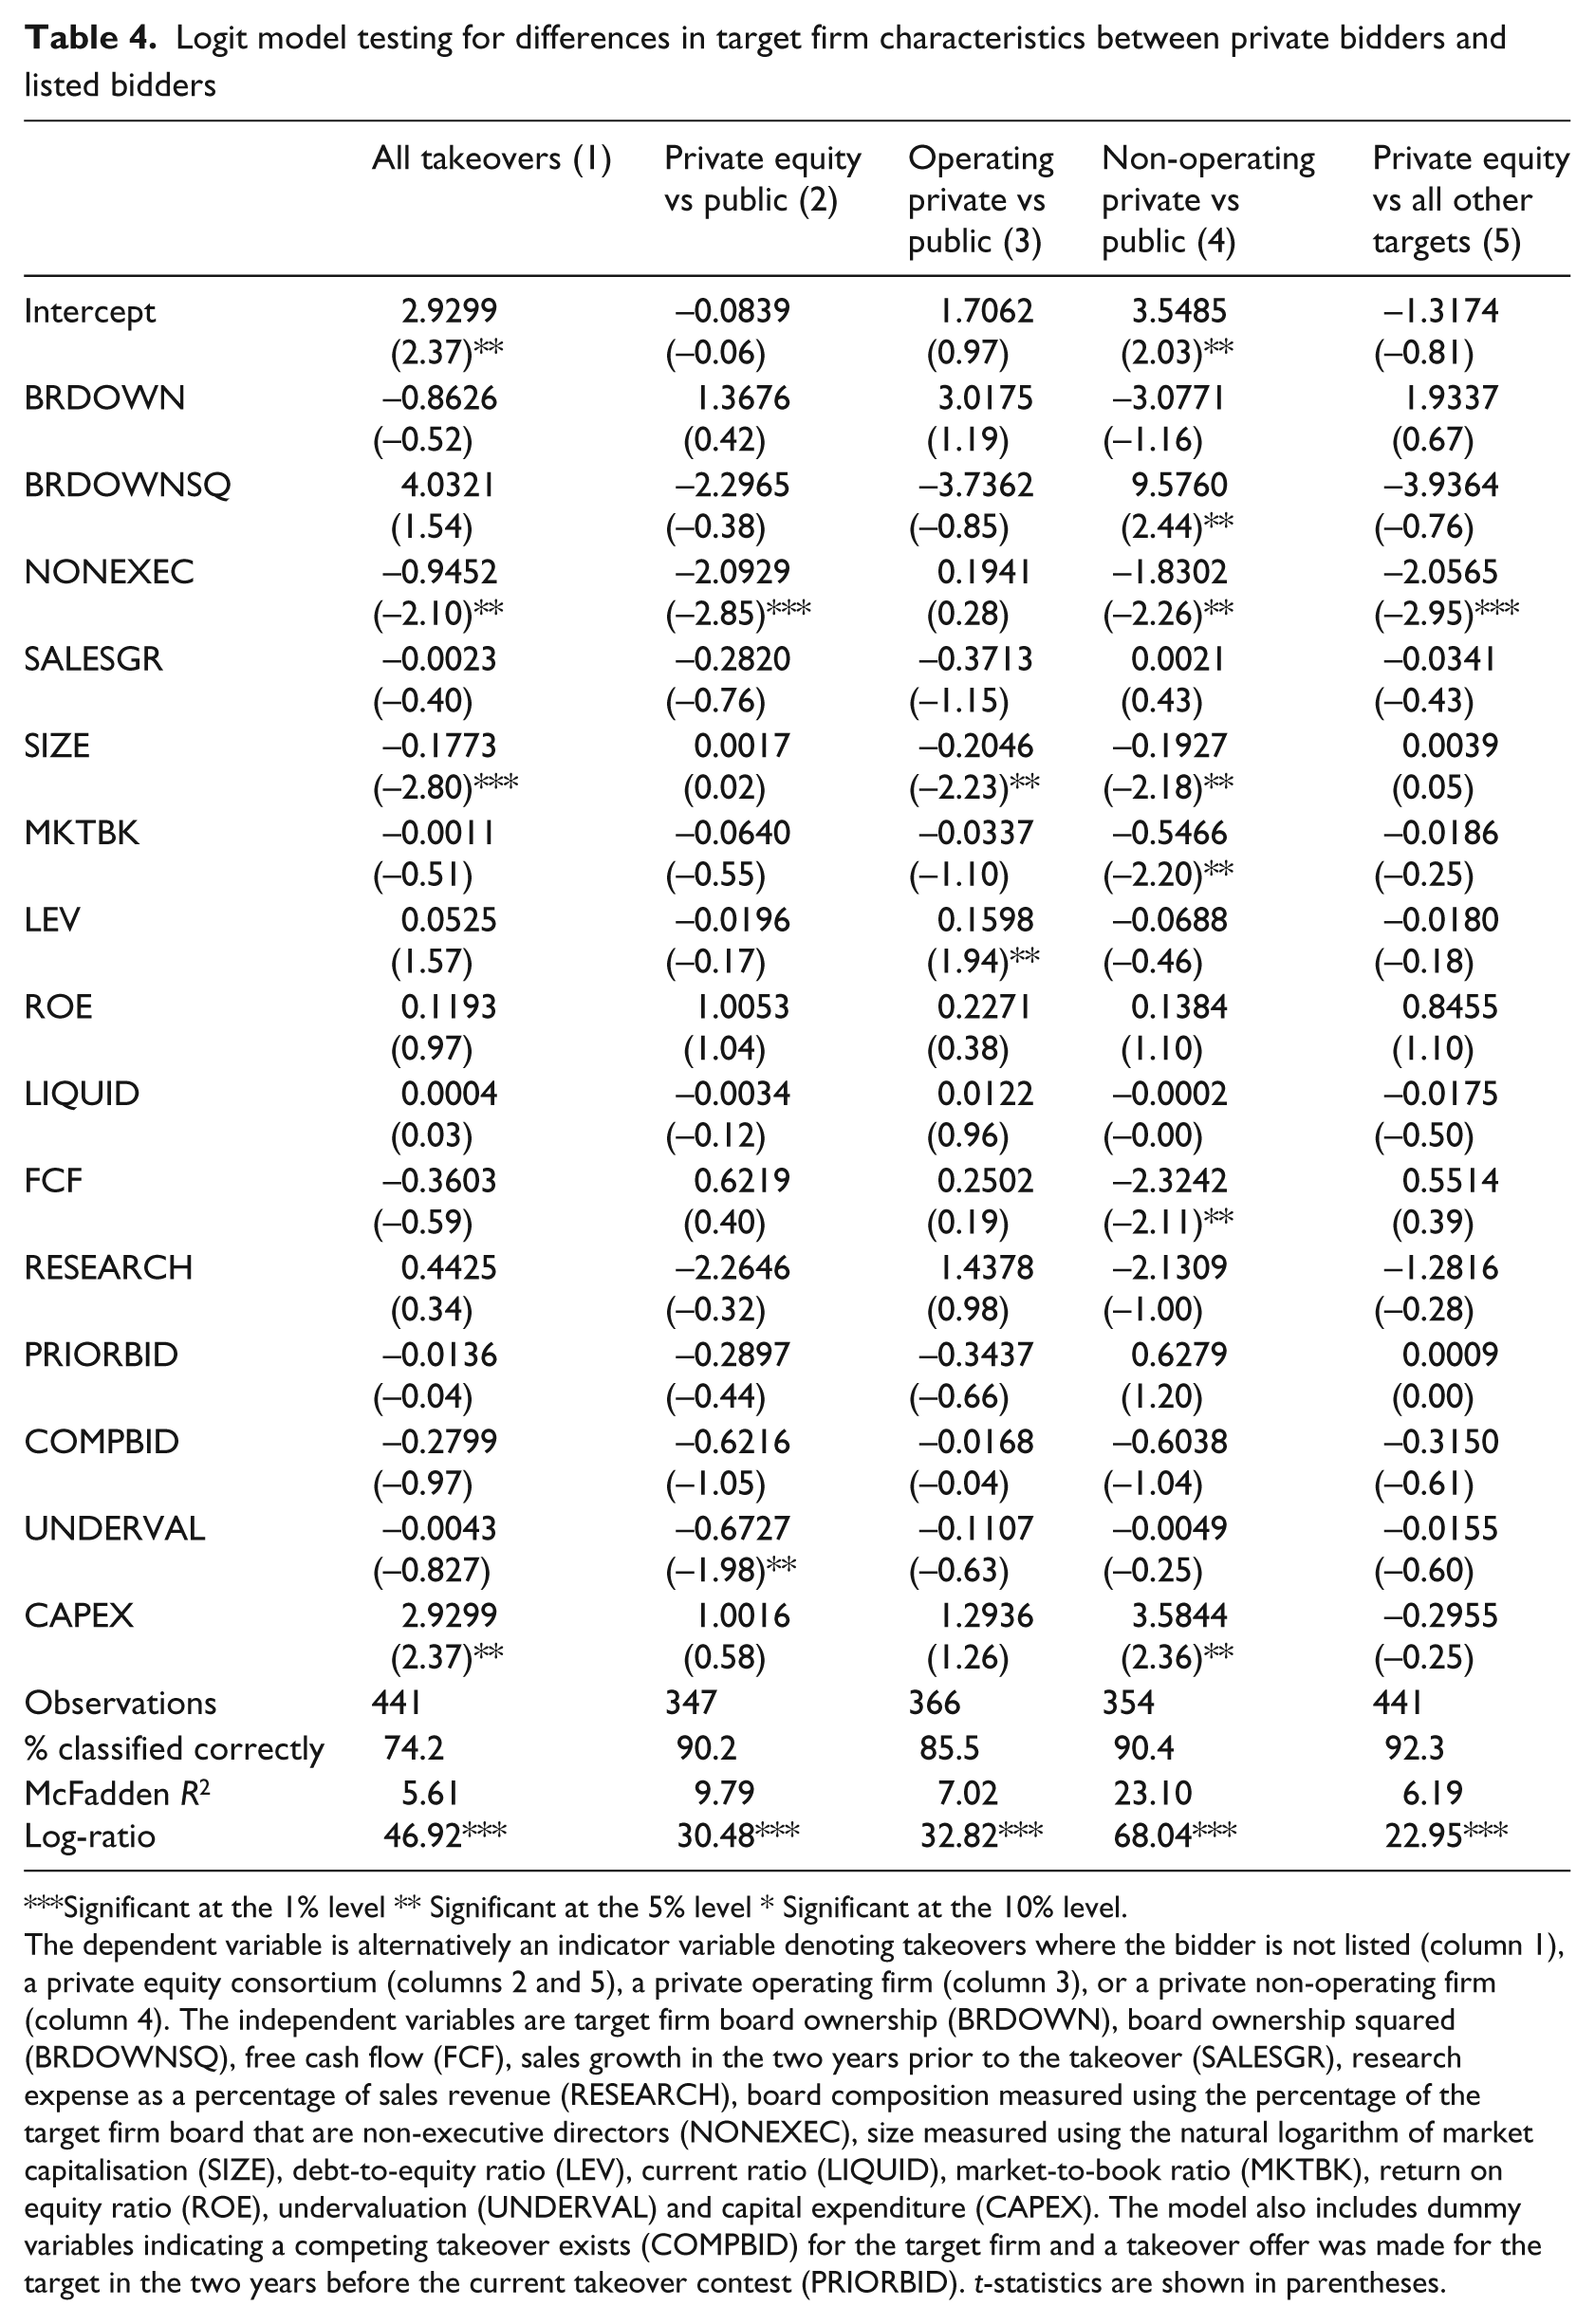
The results of estimating regression model (1) for the complete sample are presented in the first column of Table 4. The findings indicate that targets in PTP takeovers are significantly smaller in size. The smaller size of targets of private bidders is consistent with smaller targets having higher relative compliance costs and seeking to go private to reduce these costs. Alternatively, private bidders may be restricted to bidding for small listed firms due to their lower pool of capital. The results also indicate that targets of private bidders have a board consisting of a lower percentage of non-executive directors. This result is consistent with the argument of Weir and Wright (2006) that PTP takeovers are more likely if there is ineffective internal monitoring. Targets of private bidders also have significantly higher investing cash flows consistent with these firms having higher free cash flow from selling assets. Board ownership is unrelated to the likelihood that a takeover is made by a private bidder. For the full sample the results provide no evidence that PTP takeovers are driven by high target free cash flow, prior or competing takeover bids or target firm leverage, growth, performance or liquidity.
Logit model testing for differences in target firm characteristics between private bidders and listed bidders
Significant at the 1% level ** Significant at the 5% level * Significant at the 10% level.
The dependent variable is alternatively an indicator variable denoting takeovers where the bidder is not listed (column 1), a private equity consortium (columns 2 and 5), a private operating firm (column 3), or a private non-operating firm (column 4). The independent variables are target firm board ownership (BRDOWN), board ownership squared (BRDOWNSQ), free cash flow (FCF), sales growth in the two years prior to the takeover (SALESGR), research expense as a percentage of sales revenue (RESEARCH), board composition measured using the percentage of the target firm board that are non-executive directors (NONEXEC), size measured using the natural logarithm of market capitalisation (SIZE), debt-to-equity ratio (LEV), current ratio (LIQUID), market-to-book ratio (MKTBK), return on equity ratio (ROE), undervaluation (UNDERVAL) and capital expenditure (CAPEX). The model also includes dummy variables indicating a competing takeover exists (COMPBID) for the target firm and a takeover offer was made for the target in the two years before the current takeover contest (PRIORBID). t-statistics are shown in parentheses.
The results reported in columns (2), (3) and (4) of Table 4 estimate model (1) by comparing respectively public takeovers to private equity, private operating and private non-operating bidders. This analysis is undertaken because the motivations for each type of private bidder are unlikely to be consistent. Relative to targets of public bidders the targets of private equity consortiums have significantly fewer non-executive directors. This result is consistent with the AVCAL (2007) argument that private equity consortiums make acquisitions of firms for which they can increase the alignment of interest between owners and managers. The targets of private equity bidders have also experienced a significantly larger decrease in market capitalisation in the preceding financial year, suggesting that these firms are more likely to be undervalued.
The results of this study for private equity acquisitions are in contrast to the results in Chapple et al. (2010). They report that private equity targets have significantly higher free cash flow, a lower market-to-book ratio, lower leverage, larger size and higher interest coverage. As Chapple et al. (2010) compare private equity targets to all other targets including those of other private bidders, our results are re-estimated by comparing private equity targets to all other targets in the sample. The results shown in column (5) are consistent with those in the original regression, although the undervaluation measure is no longer significant. Another difference between this study and Chapple et al. (2010) is that they retain non-cash takeovers in the control group. In untabulated results we re-estimated model (1) by comparing private equity targets with all other targets irrespective of payment methods. These results continue to show that private equity targets have fewer non-executive directors. Additionally, private equity targets had significantly higher return on equity than other targets. The other results were unchanged. As a final comparison to the results in Chapple et al. (2010), that study finds that private equity targets have higher interest coverage. As a robustness check we included interested coverage in regression model (1) and re-estimated the findings presented in columns (1), (2), and (5) of Table 4. In each model the coefficient on interest coverage is insignificant. In summary, our results on the dimensions in which private equity targets differ significantly to other target firms are inconsistent with those presented in Chapple et al. (2010). These inconsistent findings are explained by the use of alternative control groups.
The comparison of public targets with targets of private operating companies (i.e., column 3) indicates that private operating company targets are of smaller size and have higher leverage than targets of public bidders. The fact that these targets have higher leverage is inconsistent with the targets being acquired by a private bidder to access unused tax shields. An alternative explanation is that these targets have reached the limit of their debt capacity and seek to combine with an operating private firm to increase financial slack.
In column (4) public targets are compared with targets of private non-operating bidders. The 23% R-squared for this regression is the highest explanatory power for the different variations of model (1) shown in Table 4. The findings indicate that targets of private non-operating bidders are of smaller size consistent with these bidders having fewer resources to make a takeover. The results also suggest that firms subject to a takeover from a non-operating bidder are financially underperforming, as these targets have lower free cash flow and a lower market-to-book ratio than public targets. Furthermore, these targets have significantly greater investing cash flows, suggesting that the firms may be liquidating assets either to meet funding needs or due to lower growth. Targets of private non-operating bidders also have significantly higher board ownership and fewer non-executive directors than public targets. The high level of board ownership of these targets indicates that managers in these firms are potentially entrenched, which would act as a deterrent to a takeover by a public firm.
The results of estimating regression model (2) testing for a difference in target firm abnormal returns between public and private bidders are shown in Table 5. The findings from comparing all public bidders against all private bidders are shown in column (1). The coefficient on the private bidder dummy variable is negative and significant, consistent with the US results in Bargeron et al. (2008). In columns (2) through (4) of Table 5 the target abnormal returns for public bidders are compared respectively with the returns for private equity, private operating and private non-operating bidders. The findings show no significant difference in abnormal returns between public bidders and both private equity and private operating bidders. The insignificant difference for private equity bidders shows that the univariate findings of a lower premium being paid by private equity firms reported in Chapple et al. (2010) and Chapple et al. (2011) are not robust to multivariate analysis. Further, the results indicate that concerns that private equity bidders take advantage of target shareholders are unjustified.
OLS regression tests of differences in target shareholder abnormal returns between private bidders and listed bidders

Significant at the 1% level ** Significant at the 5% level * Significant at the 10% level.
The dependent variable is the target firm CAR measured from 60 days prior to the takeover announcement until 30 days after. The test variable (PRIVATE) is defined alternatively as takeovers where the bidder is a non-listed entity (column 1), a private equity bidder (column 2), a private operating bidder (column 3), or a private non-operating bidder (column 4). The independent variables include target firm board ownership (BRDOWN), board ownership squared (BRDOWNSQ), free cash flow (FCF), sales growth in the two years prior to the takeover (SALESGR), research expense as a percentage of sales revenue (RESEARCH), board composition measured using the percentage of the target firm board that are non-executive directors (NONEXEC), size measured using the natural logarithm of market capitalisation (SIZE), debt-to-equity ratio (LEV), current ratio (LIQUID), market-to-book ratio (MKTBK), return on equity ratio (ROE), undervaluation (UNDERVAL) and capital expenditure (CAPEX). The model also includes dummy variables indicating a competing takeover exists (COMPBID) for the target firm, a takeover offer was made for the target in the two years before the current takeover contest (PRIORBID), and the target firm board recommends bid acceptance (REC). The model also controls for the ownership interest of the bidding firm in the target at the announcement of the takeover (TOEHOLD). t-statistics are shown in parentheses.
In column (4) of Table 5 the results show that targets of private non-operating bidders receive significantly lower abnormal returns than targets of public bidders. This difference in returns is possibly explained by private non-operating bidders being unable to achieve operating synergies from undertaking an acquisition, or alternatively as reported in the US (Bargeron et al., 2008) it may reflect agency problems associated with public companies with low management ownership.
The results on the control variables indicate that abnormal returns are higher when the target firm has higher sales growth consistent with bidders paying a higher premium for target firms which are growing. The findings also show an increased premium when the target firm has higher free cash flow similar to the results in Smith and Kim (1994). There is a significant negative association between takeover premiums and target firm leverage and toehold. The finding on the bidder’s toehold is as expected following the results in Stulz et al. (1990) and Bugeja and Walter (1995). Target firm research intensity is also positively associated to abnormal returns. Takeover premiums are significantly higher for target firms which are potentially undervalued. The relationship between target board ownership and takeover premiums is positive. This may be explained by greater target firm board resistance at low levels of target board ownership. The significant negative coefficient on the squared amount of board ownership indicates, however, that the positive relationship between board ownership and takeover premiums decreases as board ownership rises. There is no significant association between abnormal returns and the recommendation of the target board, target firm size and liquidity.
It is interesting to note that the significance of some of the control variables varies across the sample partitions. For instance, sales growth and free cash flows are related to abnormal returns only when private non-operating takeovers are compared to public bidders, suggesting that private non-operating bidders place additional emphasis on these target firm characteristics. Also, leverage is negatively associated to abnormal returns only for targets of private operating bidders. This finding is likely related to the result in Table 4, indicating that leverage is significantly higher for targets of these bidders. Bidders are likely to reduce the premium paid for such targets due to their greater risk. The target board ownership variables are significant except for the regression comparing targets of public bidders to those of private non-operating bidders. In addition, the performance of target firms is not significant in the overall regression but is positively associated with abnormal returns for private operating and private non-operating bidders, indicating that these bidders are willing to pay a higher price for better performing targets.
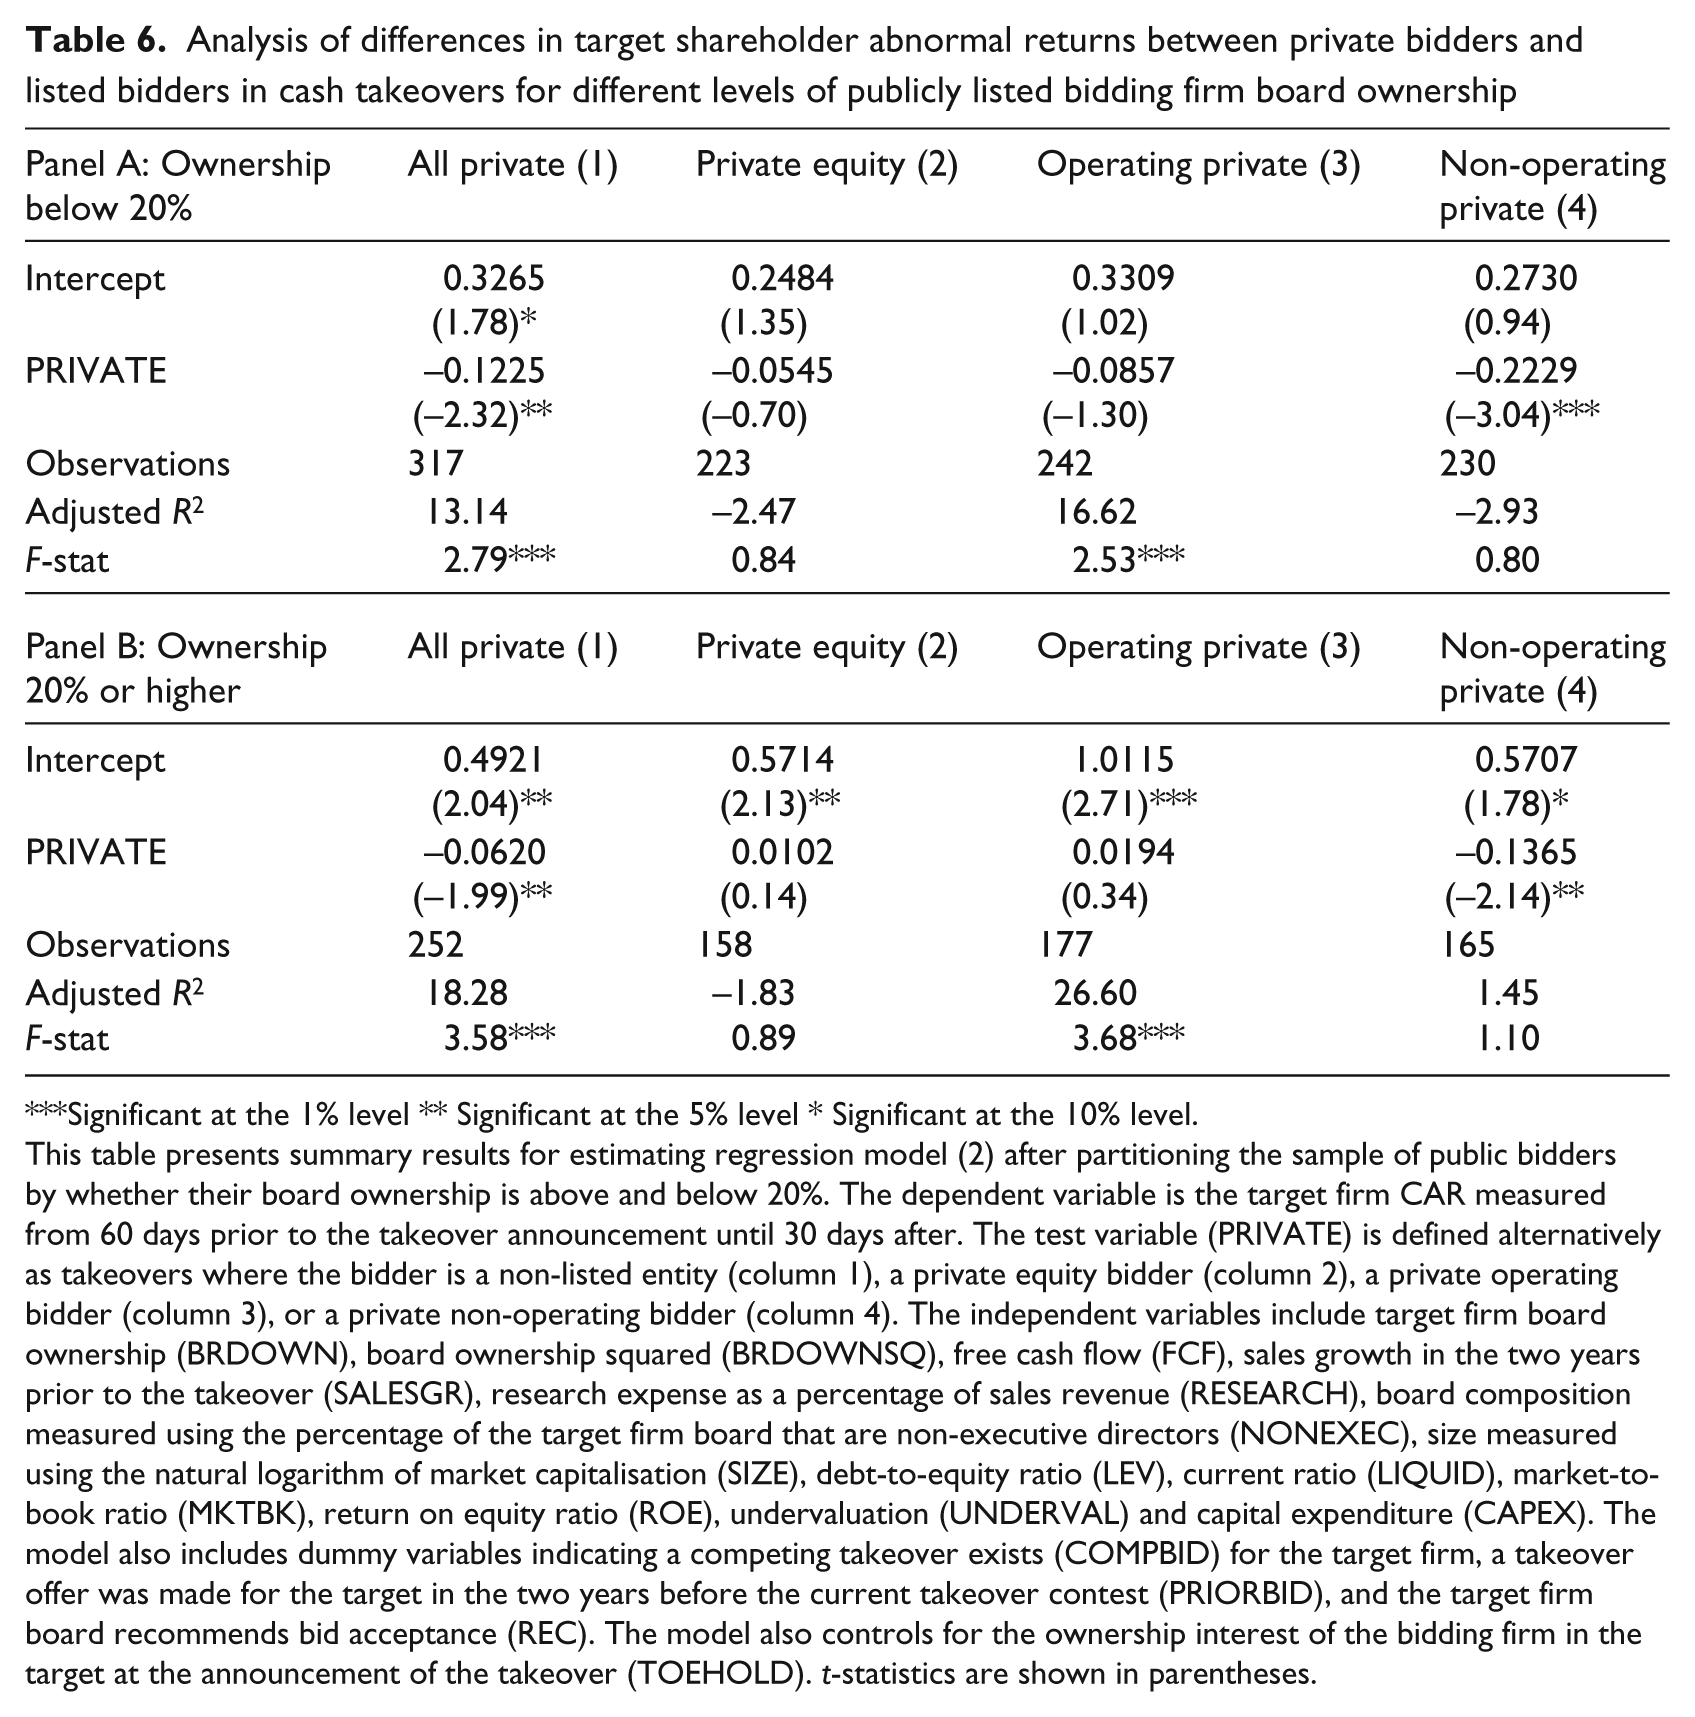
The findings reported in Table 5 indicate that target firms of private non-operating bidders receive a lower premium than targets of public bidders. As a means of determining if this result is due to bidding firm agency problems or the inability of private non-operating firms to obtain synergistic benefits from a takeover, details of board ownership are collected from the takeover documents of public bidders. The sample of public bidders is then partitioned at a board ownership level of 20% and the regression analysis presented in Table 5 repeated for each group of public bidders. 14 A summary of the results of this extra analysis is given in Table 6.
Analysis of differences in target shareholder abnormal returns between private bidders and listed bidders in cash takeovers for different levels of publicly listed bidding firm board ownership
Significant at the 1% level ** Significant at the 5% level * Significant at the 10% level.
This table presents summary results for estimating regression model (2) after partitioning the sample of public bidders by whether their board ownership is above and below 20%. The dependent variable is the target firm CAR measured from 60 days prior to the takeover announcement until 30 days after. The test variable (PRIVATE) is defined alternatively as takeovers where the bidder is a non-listed entity (column 1), a private equity bidder (column 2), a private operating bidder (column 3), or a private non-operating bidder (column 4). The independent variables include target firm board ownership (BRDOWN), board ownership squared (BRDOWNSQ), free cash flow (FCF), sales growth in the two years prior to the takeover (SALESGR), research expense as a percentage of sales revenue (RESEARCH), board composition measured using the percentage of the target firm board that are non-executive directors (NONEXEC), size measured using the natural logarithm of market capitalisation (SIZE), debt-to-equity ratio (LEV), current ratio (LIQUID), market-to-book ratio (MKTBK), return on equity ratio (ROE), undervaluation (UNDERVAL) and capital expenditure (CAPEX). The model also includes dummy variables indicating a competing takeover exists (COMPBID) for the target firm, a takeover offer was made for the target in the two years before the current takeover contest (PRIORBID), and the target firm board recommends bid acceptance (REC). The model also controls for the ownership interest of the bidding firm in the target at the announcement of the takeover (TOEHOLD). t-statistics are shown in parentheses.
Panel A of Table 6 presents the results of the coefficient on the private indicator variable for the sample of public bidders with board ownership below 20%. 15 Consistent with the results for the full sample, the only difference in abnormal returns is between public bidders and private non-operating bidders. Panel B presents the results for public bidders with ownership of 20% or higher. The findings for this group are identical to those reported in Panel A with abnormal returns still being significantly lower for private non-operating bidders. As target abnormal returns are significantly higher for public bidders than private non-operating bidders for both the high and low public bidder ownership groups, this indicates that public bidder agency problems are not driving the findings. Thus the most likely explanation is that private non-operating bidders pay a lower premium because of the inability to achieve synergies, or alternatively they are forced to pay a lower price due to financial constraints. 16
5.1. Sensitivity tests
The use of OLS regression requires the use of a random sample. As a sample comprising only takeover targets is not a random sample we re-estimated the abnormal return model presented in Table 5 using a Heckman (1979) two-step procedure. 17 In the first step a probit model is estimated to predict firms that will be subject to a takeover offer. 18 The independent variables used in this model are firm size, asset turnover, market-to-book ratio, leverage, liquidity, undervaluation and an industry indicator dummy variable. 19 The inverse Mills ratio from this probit model is then included in the revised regression model (2) to control for self-selection. The conclusions drawn from the results after including the inverse Mills ratio were unchanged from those presented in Table 5. Additionally, the coefficient on the inverse Mills ratio was insignificant.
The comparison of characteristics of PTP and public takeovers did not provide support for the tax benefit hypothesis. To examine if this is caused by the proxy used for potential tax benefits (i.e., target firm leverage) we re-estimated regression model (1) using an alternative proxy for potential tax savings. This alternative variable was defined as the ratio of target firm tax expense to profit before tax in the year prior to the takeover announcement. If the tax benefit hypothesis was to be supported it would be expected that this variable would be positively related to the likelihood of a takeover by a private bidder. The coefficient on this variable however was insignificant.
The UK results in Weir and Wright (2006) find that a private takeover is more likely when the CEO and chairperson roles are held by the same director. To test if this is also the case in Australia the tests were also estimated including a dummy variable indicating target firms in which the same director held the roles of CEO and chairperson. This variable was insignificant. The lack of significance on this variable is not surprising as less than 10% of target firms subject to an Australian takeover offer disclosed CEO/chairperson duality.
Consistent with the argument of Weir and Wright (2006) that PTP takeovers are used in circumstances in which there is ineffective internal monitoring, the results indicate that targets in takeovers by private bidders have a lower percentage of non-executive directors. Previous research (e.g., Yermack, 1996) suggests that firm performance decreases with higher board size consistent with a decrease in the effectiveness of internal monitoring. To test whether board size also differs between targets of private and public bidders, target firm board size was included as an additional explanatory variable in model (1). The coefficient on this variable was insignificant both for the total sample and after partitioning by the different types of private bidders.
Target firm abnormal returns were also calculated over the following daily event windows around the takeover announcement: (−10, +10), (−60, +10) and (−1, +1). Model (2) was re-estimated using these alternative event windows and the conclusion from the results presented remained unchanged.
6. Conclusions
This study examines how target firm abnormal returns and characteristics differ between public bidders and private bidders. In contrast to prior studies, as part of our analysis we recognise that private bidders as not all alike, so the investigation is repeated separately for private equity, private operating and private non-operating bidders. The results of the study indicate that target shareholder abnormal returns for public bidders are statistically similar to those for private equity bidders and private operating bidders. In contrast, target shareholders receive significantly lower abnormal returns in takeovers by a private non-operating bidder than in takeovers received from a public bidder. Unlike the US findings in Bargeron et al. (2008) the results are not driven by public bidders with low managerial ownership but are more likely explained by private non-operating firms offering a lower premium due to their inability to achieve operating synergies by combining activities with the target firm. The insignificant difference in target abnormal returns between public bidders and private equity bidders addresses public concern that private equity bidders take advantage of target shareholders.
The analysis of how target firm characteristics differ across private and public bidders reveals that there are different motivations between the three types of private bidders. Private equity targets are typically similar to targets of public bidders with the exception that they have a decline in market value prior to the bid and they have fewer non-executive board members. The lower proportion of non-executive directors suggests that ineffective internal monitoring may be a partial explanation for private equity takeovers. Similarly, takeovers by private non-operating firms are more likely to feature targets with a lower number of non-executive directors. In addition, private non-operating bidders announce takeovers for smaller firms with lower free cash flow, lower market-to-book ratios and relatively greater board ownership. Overall, the conclusion from these results is that private non-operating takeovers typically involve a target firm with entrenched management, low growth prospects and underlying cash flow problems. The final group of private bidders are operating firms. The targets of this group are significantly smaller than those of public bidders, reflecting either a desire by the target firm to reduce compliance costs or alternatively an indication of the financial constraints of the bidder. Furthermore, the targets of private non-operating bidders have significantly greater leverage, suggesting that these target firms are seeking to combine with an operating firm due to constraints associated with obtaining additional debt finance.
Footnotes
Acknowledgements
The authors wish to acknowledge the research assistance of Raghav Jain and comments by participants at the 2011 European Accounting Association Annual Meeting.
Funding
This research received no specific grant from any funding agency in the public, commercial, or not-for-profit sectors.