
Abstract
This paper investigates two aspects of bank financing using a sample of 1,973 Australian small to medium sized enterprises (SMEs). We compare the variables that explain why Australian small to medium sized enterprises seek bank finance with those that underpin bank credit rationing of loan applications. Our analysis highlights that little overlap exists between the two sets of variables. Larger small to medium sized enterprises with growth intentions, business plans, and those in the agriculture industry are significantly more likely to seek finance. In contrast, firms in agriculture that are older, and that have incremental product innovation, 40% or more of export sales, and a male Chief Executive Officer, are less likely to be credit rationed. Importantly, having business plans, whether in large or small firms, does not relate significantly to credit rationing.
Keywords
1. Introduction
According to the Australian Bureau of Statistics, as of June 2013, 2,079,666 businesses were actively trading in Australia, of which small to medium sized enterprises (SMEs) comprised over 98.8%. 1 SMEs employ more than 70% of the Australian workforce and their importance for economic growth has been well documented (Beck et al., 2005; Cull et al., 2006; Ennew and Binks, 1995; Snodgrass and Biggs, 1996; Waite, 1973). For SMEs to support economic growth, individual firms need to grow, which means their access to bank finance is vital. As a result, understanding the issues that SMEs face in funding growth and other business activities in Australia can have considerable economic value.
This paper compares variables traditionally linked to credit rationing with firms that sought bank finance. We achieve this by firstly investigating which types of firms seek bank finance and secondly by investigating what firm characteristics are associated with credit rationing by banks. As we consider the same factors in the two sets of models, namely, those that look at what firms see as important to seek finance, against those that show what actually matters for credit rationing, we were able to compare the differences and similarities in what firms versus banks perceive to be important. This is important and has economic consequences if it is the case that firms and banks have incongruous views of what is important. Using data from a large-scale survey, conducted in 2010 to 2011 in Australia, we document the results of estimating a number of TOBIT and PROBIT models to address this important issue of bank financing of SMEs.
When there are restrictions on finance, termed credit rationing, the demand for loans exceeds the supply at the ruling price (Jaffee and Russell, 1976). Put differently, under the assumption of market equilibrium, the price of loans (interest rates) adjusts to clear the market; all those who want loans will receive them. Credit rationing suggests a breakdown, because either not all firms seeking loans can obtain them, or firms may not be offered the full amount of the loan they applied for, even if they are willing to pay a higher price. If we assume that firms exist to maximise stockholder wealth (meaning they will accept all positive net present value [NPV] projects), if credit is rationed, firms may be forced to make sub-optimal investment decisions, including ignoring wealth-creating projects, by accepting a lower number of positive NPV projects. 2 Greenwald and Stiglitz (1987) produced a seminal paper that linked the availability of credit to real investment. These authors extensive research found that it is important for policy makers, borrowers (firms) and lenders (including banks) to have insights into credit rationing.
Research investigating the reasons as to why firms are credit rationed is voluminous. There are many detailed reviews of these works, including those more recently by Bellier et al. (2012), who identify three relevant strands of literature. First, a macroeconomic approach centres on the availability of credit to the banks, which is limited to a finite amount they can raise; hence they need to ration lending. This strand further examines the impact of monetary policy on the availability of credit. The second strand starts by explaining market equilibrium, where demand equals supply. Interest rates (the price of credit) will adjust to clear the market so that credit is not rationed. However, the seminal theoretical work of Stiglitz and Weiss (1981) shows that, even in equilibrium, credit rationing may result from information asymmetry. This information asymmetry arises from the incentives that drive borrowers to seek finance and the incentives that drive lenders to supply it. For example, it may be unprofitable for a bank to agree to a loan interest rate higher than the equilibrium rate even if the bank has sufficient funds. The reason being is that the higher rate is likely to be a signal of worse risk than the average loan. Therefore, even if there is excess demand for finance there is no competitive force that will cause the interest rate to adjust and credit is rationed. This is likely to be more pronounced in markets with imperfect information associated with borrowers.
SMEs are generally less transparent with greater imperfect information to those not involved within the firm owing to lack of financial data, thus creating a scenario of information asymmetry, specifically between less involved banks and the borrowing firm. That is, compared to larger firms, less information is available about smaller firms. It is for this reason that Berger and Udell (2006) refer to SMEs as informationally opaque. In contrast, De la Torre et al. (2010) show that this opaqueness is not evident in restricting bank finance to SMEs in a number of emerging markets.
Information asymmetry, according to Stiglitz and Weiss (1981), leads to adverse selection and an incentive effect (moral hazard). Adverse selection occurs because banks are unable to adequately distinguish among different firms. The incentive effect is a moral hazard for the bank. Since the bank is not able to directly control all the actions of the borrower, it will formulate the terms of the loan contract in a manner designed to induce the borrower to take actions that are in the interests of the bank, as well as to attract low-risk borrowers. This amounts to credit rationing. Collateral offered by firms may help their loan applications, but as shown by Stiglitz and Weiss (1981), it does not eliminate the possibility of credit rationing.
The third strand of the literature identified by Bellier et al. (2012), ignored by Stiglitz and Weiss (1981), and developed from the work of Kon and Storey (2003) is referred to as the theory of discouraged borrowers. SMEs are discouraged from applying for bank loans because the owners fear loan rejection. Interestingly, the literature in this area does not document any justification for this behaviour and the evidence of it is obtained by asking owners why they did not apply for bank finance. For example, Vos et al. (2007) found 21% of their sample of US SMEs did not apply for loans owing to their fear of loan denial. It is presumed that this fear of loan denial is rooted in psychology where it lies within the broader fear of failure (atychiphobia). Vos et al. (2007) explain that the education level of SME owners reduces this fear. Although important in the context of credit rationing, our data do not allow us to consider this avenue of research.
The paper proceeds as follows. In Section 2, we review the relevant literature in the context of firms seeking finance and credit rationing. We follow the credit rationing strand to create expectations for our data set, as defined in Section 3, whereas in Section 4 we develop a number of models to empirically examine the characteristics of firms that are credit rationed in our sample. These specific firm characteristics include firm age and size, growth options, export focus, industry sector, innovation and Chief Executive Officer (CEO) gender. We integrate the factors that explain credit rationing with the decision to seek bank finance. Our results show that firms’ understanding of what is needed, does not match the reality of rationing decisions taken by banks. This has not been done before. We highlight factors not previously considered in the literature including a more specific examination of industry sectors, different measures and types of innovation, interaction of business plans and firm size and an Australian SME data set. We find both support for and differences from previous studies, which we report in Section 5. Section 6 documents tests of robustness for the main results. The final section explains the importance of these results for SMEs that apply for bank loans as well as for the development of policies for improving financing to SMEs.
2. Credit rationing and seeking finance for SMEs
We identify two specific strands of literature seeking to explain credit rationing with a particular focus on SMEs. The first involves the macro-level, such as bank structure or institutional explanations, and the second contains micro-level explanations, such as firm specific explanations. We briefly discuss these as follows.
2.1. Structural or institutional reasons for credit rationing
Canales and Nanda (2012) identify two directions of the research into structural or institutional reasons for credit rationing. First, prior to 2000, the research question responded to the impact of banking sector deregulation (particularly in the US), which led to consolidation of the market through mergers and takeovers. A full review is offered by Berger et al. (1999). The concern about smaller firms being credit rationed was that, with the disappearance of smaller banks that had historically lent a larger proportion of their loans to smaller firms compared to larger banks, finance for smaller firms would diminish (Jayaratne and Wolken, 1999). This research finding: that fewer smaller banks meant less finance for smaller firms was not without opposition. For example, Strahan and Weston (1998) found this not to be the case in their examination of the US market, and later, Black and Strahan (2002) found that the increased competition in the banking sector improved lending success for smaller firms.
The second direction identified by Canales and Nanda (2012): that bank structure can affect bank lending, relates to the information asymmetry arguments presented earlier. Specifically, a decentralised banking structure, where individual bank managers have greater autonomy to make lending decisions, can improve lending success for smaller firms. Generally, lending to smaller firms involves relatively more ‘soft information’ than ‘hard information’. Soft information includes the character of the borrower (Cole et al., 2004), idiosyncratic local conditions and firm-specific characteristics (Peek and Rosengren, 1998), and whether the loans may be local-information intensive (Berger and Udell, 1995; Petersen and Rajan, 1994). Hard information includes audited financial statements, often included in business plans (Black and Strahan, 2002). Canales and Nanda (2012: 355) state that a key characteristic of small business lending is that ‘it relies heavily on information that cannot be easily verified by others’. Therefore, a decentralised banking structure allows individual managers to more easily verify soft information that is often the only information that small businesses have when applying for loans. Larger firms generally possess audited financial statements and rely on these when applying for loans. In a centralised banking structure, there is greater emphasis on hard information and, as a result, small businesses face credit rationing under a centralised banking structure.
Other macro reasons for credit rationing may be important structural events that have had a significant impact globally on the availability of credit. Although this does not necessarily create a size effect in credit rationing, it can be related across bank lending generally. Hancock and Wilcox (1998) reported on the ‘credit crunch’ of 1990 and found, on balance, reductions in bank capital at either small or large banks led to reduced bank lending. Not surprisingly, factors such as loan delinquency rates and macroeconomic conditions also affect bank lending. More recently, the global financial crisis of 2008 resulted in many financial institutions tightening their lending activities. Specifically, Love and Zaidi (2010) found that for a sample of SMEs in Thailand, Philippines, Korea and Indonesia during a financial crisis that bank finance for growth is especially important as trade credit is constrained. In addition, Basel III has been targeted as possibly restricting bank lending for companies (Ryan, 2012). With the adoption of Basel II (pre-global financial crisis) and Basel III to improve bank liquidity and address capital adequacy concerns, credit rationing has become a larger concern. 3 Both accords essentially make it much more attractive to lend for residential mortgages than to businesses.
2.2. Factors specific to the individual SME
The second broad reason that we identify why SMEs may be credit-rationed involves individual firm characteristics. Characteristics that have been found to influence credit rationing include firm age and size, growth options, export focus, business plans, industry sector, innovation and CEO gender (e.g. Bellier et al., 2012; Freel, 2007; Harrison and Mason, 2007). Specifically, in relation to Australian SMEs Cassar and Holmes (2003) found that asset structure, profitability and growth were important influences upon SME financing.
We now consider each of these variables individually in relation to firms seeking finance and to credit rationing because each of these become important variables in the models we develop later in the paper.
2.2.1. Firm age and size
The literature about the age and size of SMEs seeking finance is limited. On the one hand, larger and older firms are more likely to have lower bankruptcy risk and are therefore relatively more likely to seek bank finance than smaller and younger firms (Situm, 2014). However, smaller and younger firms are more likely to need finance and therefore seek it. Furthermore, the costs associated with bankruptcy are complex, particularly in Australia. For example, Robertson and Tress (1985) question whether priority rules are strictly enforced or where claims are settled before liquidation and Pham and Chow (1989) provide evidence that, although there is an inverse relationship between liquidation costs and firm size in Australia, it is not significant. Therefore, we do not make any prediction for firm size and age in relation to their seeking bank finance.
Numerous studies have shown that credit rationing decreases with the age of the firm (e.g. Beck et al., 2006; Cole, 1998; Freel, 2007; Gertler, 1988; Winker, 1999). Generally though, the argument advanced for the existence of an age effect is based on the reduction of information asymmetries as firms become older. That is, younger firms are more credit rationed than older firms. The adverse selection issue may lessen as the lender is better able to differentiate between various firms and their investment proposals, in that the lender knows more salient information about older firms relative to younger firms (Stiglitz and Weiss, 1981). Similarly, it could be safely assumed that, as the lender-borrower relationship develops through time, the lender would be more comfortable with the decisions that agents of the firm make to address the incentive, moral-hazard issue.
Nearly all empirical studies on credit rationing have documented firm size effects (e.g. Devereux and Schiantarelli, 1990; Freel, 2007; Oliner and Rudebusch, 1992). Although a similar argument has been advanced for firm size as for firm age, this being reduced asymmetric information, the importance of the banking relationship as a separate factor has been shown to exist (Berger and Udell, 1995). Berger and Udell (1995) conclude that small firms with established banking relationships are able to borrow at lower rates and are less likely to be required to pledge collateral. This suggests that the extent of the bank relationship is a determinant of credit rationing. These variables are also confounded by issues associated with ‘soft information’ and ‘hard information’. For example, firm size and age is likely to be correlated with a greater amount of hard information, such as audited financial statements. The effect of hard information may be mitigated by a greater use of soft information through established bank relationships. This, however, seems somewhat inconsistent with the results for business plans discussed later. Unfortunately, as we do not have sufficient data to test the extent of the bank relationship, we assume that firm age and size proxy for the extent of the bank relationship. We therefore hypothesise a negative relationship between firm age and firm size and credit rationing. 4
2.2.2. Growth options
It is not clear whether growth firms are expected to seek bank finance more than non-growth firms. Growth increases risks of financial distress implying that growth firms are less likely to seek bank finance. Also, growing firms use free cash flows for growth and are less likely to have sufficient cash flow for loan repayments, and as such would be less likely to seek bank finance. However, according to pecking order theory, growth firms seek debt more than non-growth firms (Frank and Goyal, 2009). In addition, there is evidence that decisions associated with growing Australian SMEs are complex (Holmes and Zimmer, 1994). Given this uncertainty, we make no predictions of the relationship between growth and firms seeking bank finance. There may also be a relation between past growth and future growth which we explain in the context of credit rationing below.
From the credit rationing literature there are two aspects associated with growth. The first is historical growth and the second is future growth options. It has often been considered that growing firms are subject to credit rationing resulting from information asymmetries between owners and the bank (Freel, 2007). However, Binks and Ennew (1996) argue that growing firms are likely to more extensively use bank lending so that, in the longer term, their better prospects have clear implications for future bank profits. Binks and Ennew (1996) add that growing firms typically will also be more willing to share information with the bank from which they are seeking finance. This suggests that growing firms will be less credit-rationed. However, growing firms are more likely to be short of collateral and therefore subject to credit-rationing. This indicates uncertainty in the relationship between credit rationing and growth.
Binks and Ennew (1996) and more recently Freel et al. (2012) distinguish between past growth and future growth options. Binks and Ennew (1996) and Freel et al. (2012) suggest that desiring growth in the future acts as a positive signal to lenders (indicating optimism surrounding the firm), while having achieved growth in the recent past is more likely to be associated with cash constraints and collateral difficulties. Binks and Ennew (1996) and Freel et al. (2012) proxy future growth options as the expectations of the CEO about future growth of the firm and find future growth firms are credit constrained. Following Binks and Ennew (1996) and Freel et al. (2012) we hypothesise that there will be a negative association between CEO expectations about future growth of the firm and credit rationing. It is not clear what the relationship between historical growth and credit rationing is expected to be. We consider this for both seeking finance and credit rationing in the robustness section of the paper.
2.2.3. Export focus
SMEs that are exporters are expected to have an increased demand for finance to support the increased cash-flow requirements of an export business. Therefore, we predict a positive relationship between SMEs seeking finance and an export focus. However, this is likely to depend upon the extent of the firm’s business that is export. We discuss this further below. Variables that impact a firms exporting ability are less likely to include cultural aspects than expected (Brewer and Sherriff, 2007). In relation to Australian SMEs, Styles and Ambler (2000) found that relational variables had a significant impact on export performance. Relational variables included experiential data collection, learning and relationship formation (social learning). However, Brewer (2009) found that policies implemented by the Australian Government over the period 2002–2006 to promote export did not result in a significant increase in the number of Australian firms exporting. These studies did not consider credit rationing or financing associated with SMEs that exported.
Freel (2007) suggests that firms generating export income generally have higher margins and more sophisticated management. These firms may also experience fewer information asymmetries. Therefore, this indicates that credit is expected to be less rationed for export-oriented firms. Beck et al. (2003) also support the notion of a positive relationship between export firms and access to bank finance. However, two matters are unclear: first, whether a particular level of export income exists beyond which credit is not rationed; and second, whether, as soon as a firm generates export income (at any level), banks are more willing to lend. Generally, however, we hypothesise a negative relationship between export sales and credit rationing. Initially, we define exporting firms as those with export sales of more than 10% of total sales (Chakravarty and Xiang, 2013; Freel, 2007). We explore different percentages of exports to total sales and discuss these results in the robustness section of the paper.
2.2.4. Business plans
The investigation of business planning in SMEs has delivered much debate, with research focusing mostly on the absence or presence of business plans and their relationship with firm performance (Frost, 2003; Robinson and Pearce, 1983). Often business plans are developed specifically for obtaining bank finance. Therefore, we predict a positive relationship between firms having business plans and seeking finance. As discussed below we also expect an interaction effect between firm size and business plans. It is uncertain how this interaction effect will impact the decision to seek finance.
In relation to credit rationing, a number of researchers have linked reduction of information asymmetry with the provision of information (Fatoki and Asah, 2011; Pretorius and Shaw, 2004; Sarapaivanich and Kotey, 2006). Pretorius and Shaw (2004) argue that a business plan is perceived as one of the most essential documents to be prepared by SMEs. As mentioned previously, information asymmetry is a major contributor to credit rationing by banks. Business plans often also include financial information, which has also been shown to reduce credit rationing. Having a business plan is therefore one method that can reduce information asymmetry. As a result, we hypothesise that business plan will have a negative relationship with credit rationing. That is, if a firm has a business plan it is relatively less likely to be credit rationed on bank finance. Given the hypothesised links between firm size and information asymmetry, and business plans and information asymmetry, we expect a significant positive interaction between firm size and business plans. This means that if the firm has a business plan their size is less important.
2.2.5. Industry sector
Considerable evidence of industry effects on firm capital structures and most textbooks on corporate finance indicate differences in capital structures for different industries (e.g. Ross et al., 2010). The industry sector in which a firm operates can provide information as to the riskiness of its future. Different industry sectors are also likely to be characterised by different competitive environments and risks (Freel et al., 2012). For example, high technology firms are perceived as being more risky in the sense of having higher default rates than firms in other industries (Westhead and Storey, 1997). This evidence indicates that the demands for bank finance by SMEs in different industries will differ. Although different industries have been found to have different debt levels, we make no prediction as to which SMEs in different industries are more or less likely to seek finance.
In relation to credit rationing, Freel (2007) indicates that higher relative borrowing requirements may lead service firms to encounter less credit rationing than manufacturing firms. Beck et al. (2006) find that credit rationing is positively related to firms in manufacturing, agriculture and construction, negatively related to firms in sales, but insignificantly related to firms in the services industry. Unfortunately, Beck et al. (2006) do not explain these results. Freel et al. (2012) posit a range of different hypotheses regarding industry effects. Different industries are likely to proxy for a range of factors that impact on the bank lending decision through risk or information asymmetry pathways. How these factors impact on credit rationing for our sample of SMEs is uncertain.
2.2.6. Innovation
By their nature, investments in innovation are seen as:
fundamentally uncertain in output and returns, largely irreversible and plagued by asymmetric information problems, with the obvious consequence that firms, especially if small sized, are assumed to be disproportionately disadvantaged at collecting external finance to fund such types of investments. (Alessandrini et al., 2010: 851)
Although this view indicates that innovative firms are likely to be credit rationed this does not suggest they are less likely to seek finance relative to non-innovative firms. Therefore we predict that innovative firms are more likely to seek finance to fund their innovation. Therefore, we expect a positive relationship between innovation and SMEs seeking bank finance. This is independent of the type of innovation which we discuss below in relation to credit rationing.
In relation to credit rationing, innovative activities in the UK, particularly in high technology and smaller firms, has been found to influence bank lending (Canepa and Stoneman, 2008; Freel, 1999, 2007; Westhead and Storey, 1997), in 11 European countries (Efthyvoulou and Vahter, 2012), and in South Africa, where 75% of new SMEs were denied loans (Fatoki and Odeyemi, 2010). Although the latter authors do not consider innovation specifically, we argue that being a new SME implies that at least some degree of novel or non-novel innovation is involved in credit rationing.
The literature classifies innovation as either process- and/or product-related (Damanpour and Aravind, 2006). Process innovation involves a change in the method through which a product or service is manufactured or delivered to the market, or is an organisational process. Product innovation involves introducing a new or substantially improved product or service. The literature suggests that innovative firms, irrespective of product or process innovation are more likely to be credit-rationed than non-innovative firms (Freel, 2007). Freel (2007) investigates a sample of 256 innovative and non-innovative SMEs in the UK who applied for bank loans. Although not considering the impact of credit rationing, but in an Australian context, Blackmore and Nesbitt (2012) explore innovation with a sample of Australian SMEs. Blackmore and Nesbitt (2012) find evidence of four different strategies in their sample of SMEs. These include defender, prospector, analyser and static typology. An explanation of these are provided in Bahaee (1992) and Miles and Snow (1978).
Apart from process or product innovation, the nature of innovation is also relevant in credit rationing. Innovation can comprise a product or process that significantly improves prospects at the firm, but not at the industry level, or it can be new to the firm and the industry. In essence, these are respectively incremental and novel innovations. Freel (2007) finds that, while a small amount of innovation (incremental) is negatively related to credit rationing, greater levels of innovation (novel) is not. Specifically, Freel (2007) found that 1 to 5% contribution to profit from new and/or improved product is negatively associated with credit rationing. This can be explained by the risk-averse nature of banks. That is, for high levels of innovation credit rationing is likely to occur. We hypothesise a similar relationship for Australian SMEs. When innovation is divided into incremental and novel we hypothesise a negative relationship between incremental innovation and credit rationing, indicating that banks regard a small amount of innovation as favourable for bank loan success, irrespective of product or process innovation. For novel innovation, we predict a positive relationship with credit rationing by banks, again irrespective of whether it is product or process innovation. This means that novel innovation is considered to be too risky for banks to lend against.
2.2.7. CEO gender
Zimmerman-Treichel and Scott (2006) (ZTS, 2006) show that women-run businesses are significantly less likely to apply for a bank loan than men-run businesses. Although there was no evidence presented as to why this occurred, ZTS (2006) proposed that this could be due to women’s concern about maintaining control over their businesses or concern over discrimination. Although ZTS (2006) sampled women in US firms we expect a similar relationships for Australian women CEOs and firms seeking bank finance. Therefore, we predict a negative relationship between SMEs with female CEOs seeking finance relative to SMEs with male CEOs seeking finance.
The notion that the gender of the CEO may be a determinant of credit rationing is persistent in both academic and policy literature (e.g. Freel et al., 2012). Although some literature reports that gender is significant in credit rationing, other studies find that gender proxies for other factors that influence credit rationing, for example, firm age, industry sector and firm size (Ahl, 2004). However, Carter et al. (2007) argue that, even after controlling for other factors, there is still a residual gender effect. These types of findings have divided the literature on gender and finance and with no clear theoretical support for a gender effect. Therefore we do not hypothesise any particular relationship between CEO gender and bank credit rationing for Australian SMEs.
Table 1 provides an overview of the hypotheses and predicted signs.
Variables and predicted signs in relation to hypotheses for firms seeking finance and credit rationing.

3. Data and variables
This paper uses data from a large-scale survey conducted during 2010 and 2011 in Australia. This survey was conducted for the then Department of Employment, Economic Development and Innovation of the Queensland government to inform government policy on innovation. The survey covered a cross-section of Australian firms and used the approach based on that advocated in the OSLO Manual (2005) and developed by the Centre for Business Research (CBR) at Cambridge University (see Cosh et al., 2012; Freel, 2007). The CBR studies have been conducted over 18 years, and the methodology and survey instrument have been tested and validated extensively. The surveys were mailed to 28,300 Australian firms of all sizes, using a stratified sampling strategy to ensure representativeness across firm sizes, industries and States. The response rate was 7.5% with a total of 2,108 responses returned after two reminders. This result is in line with similar studies conducted elsewhere. 5 However, to ensure that non-response bias did not affect the sample, the approach advocated by Armstrong and Overton (1977) was used to compare early and late responding firms. Firms were divided into two groups: those that responded within two weeks of receiving the survey, and those that responded subsequently. The mean responses of these two groups, similar in size, were compared across the main variables in our model, using a t-test. We found significant differences for firms in the service industry and firm age. With no significant differences in the majority of variables, we took no further steps.
In this paper, we are interested in two aspects of SME bank finance. The first dependent variable is a dichotomous variable indicating whether or not the firm sought finance in the past two years. This was obtained from a question asking if the firm sought finance or not in the past two years.
The second dependent variable is our proxy for credit rationing. Bellier et al. (2012) categorise different measures of credit rationing as indirect or direct. Indirect measures include econometric techniques that quantify disequilibrium in credit markets (Fair and Jaffee, 1972). These techniques also use both proxies for credit rationing such as trade credit (Petersen and Rajan, 1994) and a credit line (Cosci and Meliciani, 2002). Direct measures are based on surveys of firms or banks. Bellier et al. (2012) and Cieply and Dejardin (2010) consider the denial or refusal rate of bank loan applications based on surveys of firms as a good proxy for credit rationing, and we use this measure. Specifically, firms who sought finance from a bank within the past two years of the survey date were asked what percentage of the amount of finance sought they obtained. This provided us with a continuous variable from zero to 100% to represent the percentage of bank finance obtained for each firm. We subtract the percentage of bank finance obtained from 100 to represent our proxy for credit rationing.
The independent variables were obtained from questions to the CEO of each firm in the sample. These included the number of full-time employees, the age of the firm, whether the firm had a business plan, and the gender of the CEO. From their answers to the last two questions, dummy variables were created (unity if they had a business plan, or zero otherwise, and unity if the CEO was male, or zero otherwise). Four industry types, namely agricultural, services, manufacturing and mining were created from responses on a question about the industry of their firm. 6
Four innovation performance variables were created from the questions regarding different types of innovation (product or process), that occurred over the preceding three years. These were divided into two sub-categories: incremental and novel. Dummy variables were created for all categories (see Cosh et al., 2012). ‘Yes’ responses were recorded as unity, or zero otherwise.
An exporting dummy variable was based on a question asking respondents for the percentage of total sales in non-domestic markets in the preceding three years. Initially, firms that reported sales of 10% or more in non-domestic markets were regarded as exporters and coded unity, or zero otherwise. The appropriateness of this cut-off point is explained in the section that deals with robustness tests.
Respondents were asked to describe the firm’s growth objectives over the next three years as either becoming smaller, staying the same size, growing moderately, or growing substantially. A dummy variable was given unity if the growth objective was to grow moderately or substantially, or zero otherwise. Tests for the impact of different proxies for the growth objective are discussed in the robustness section.
Of the sample of 1,973 useable responses, approximately 78% of firms (1,558) did not seek finance while 21% (416) had applied for bank finance. Table 2 provides details of some descriptive statistics for the sample.
Descriptive statistics.
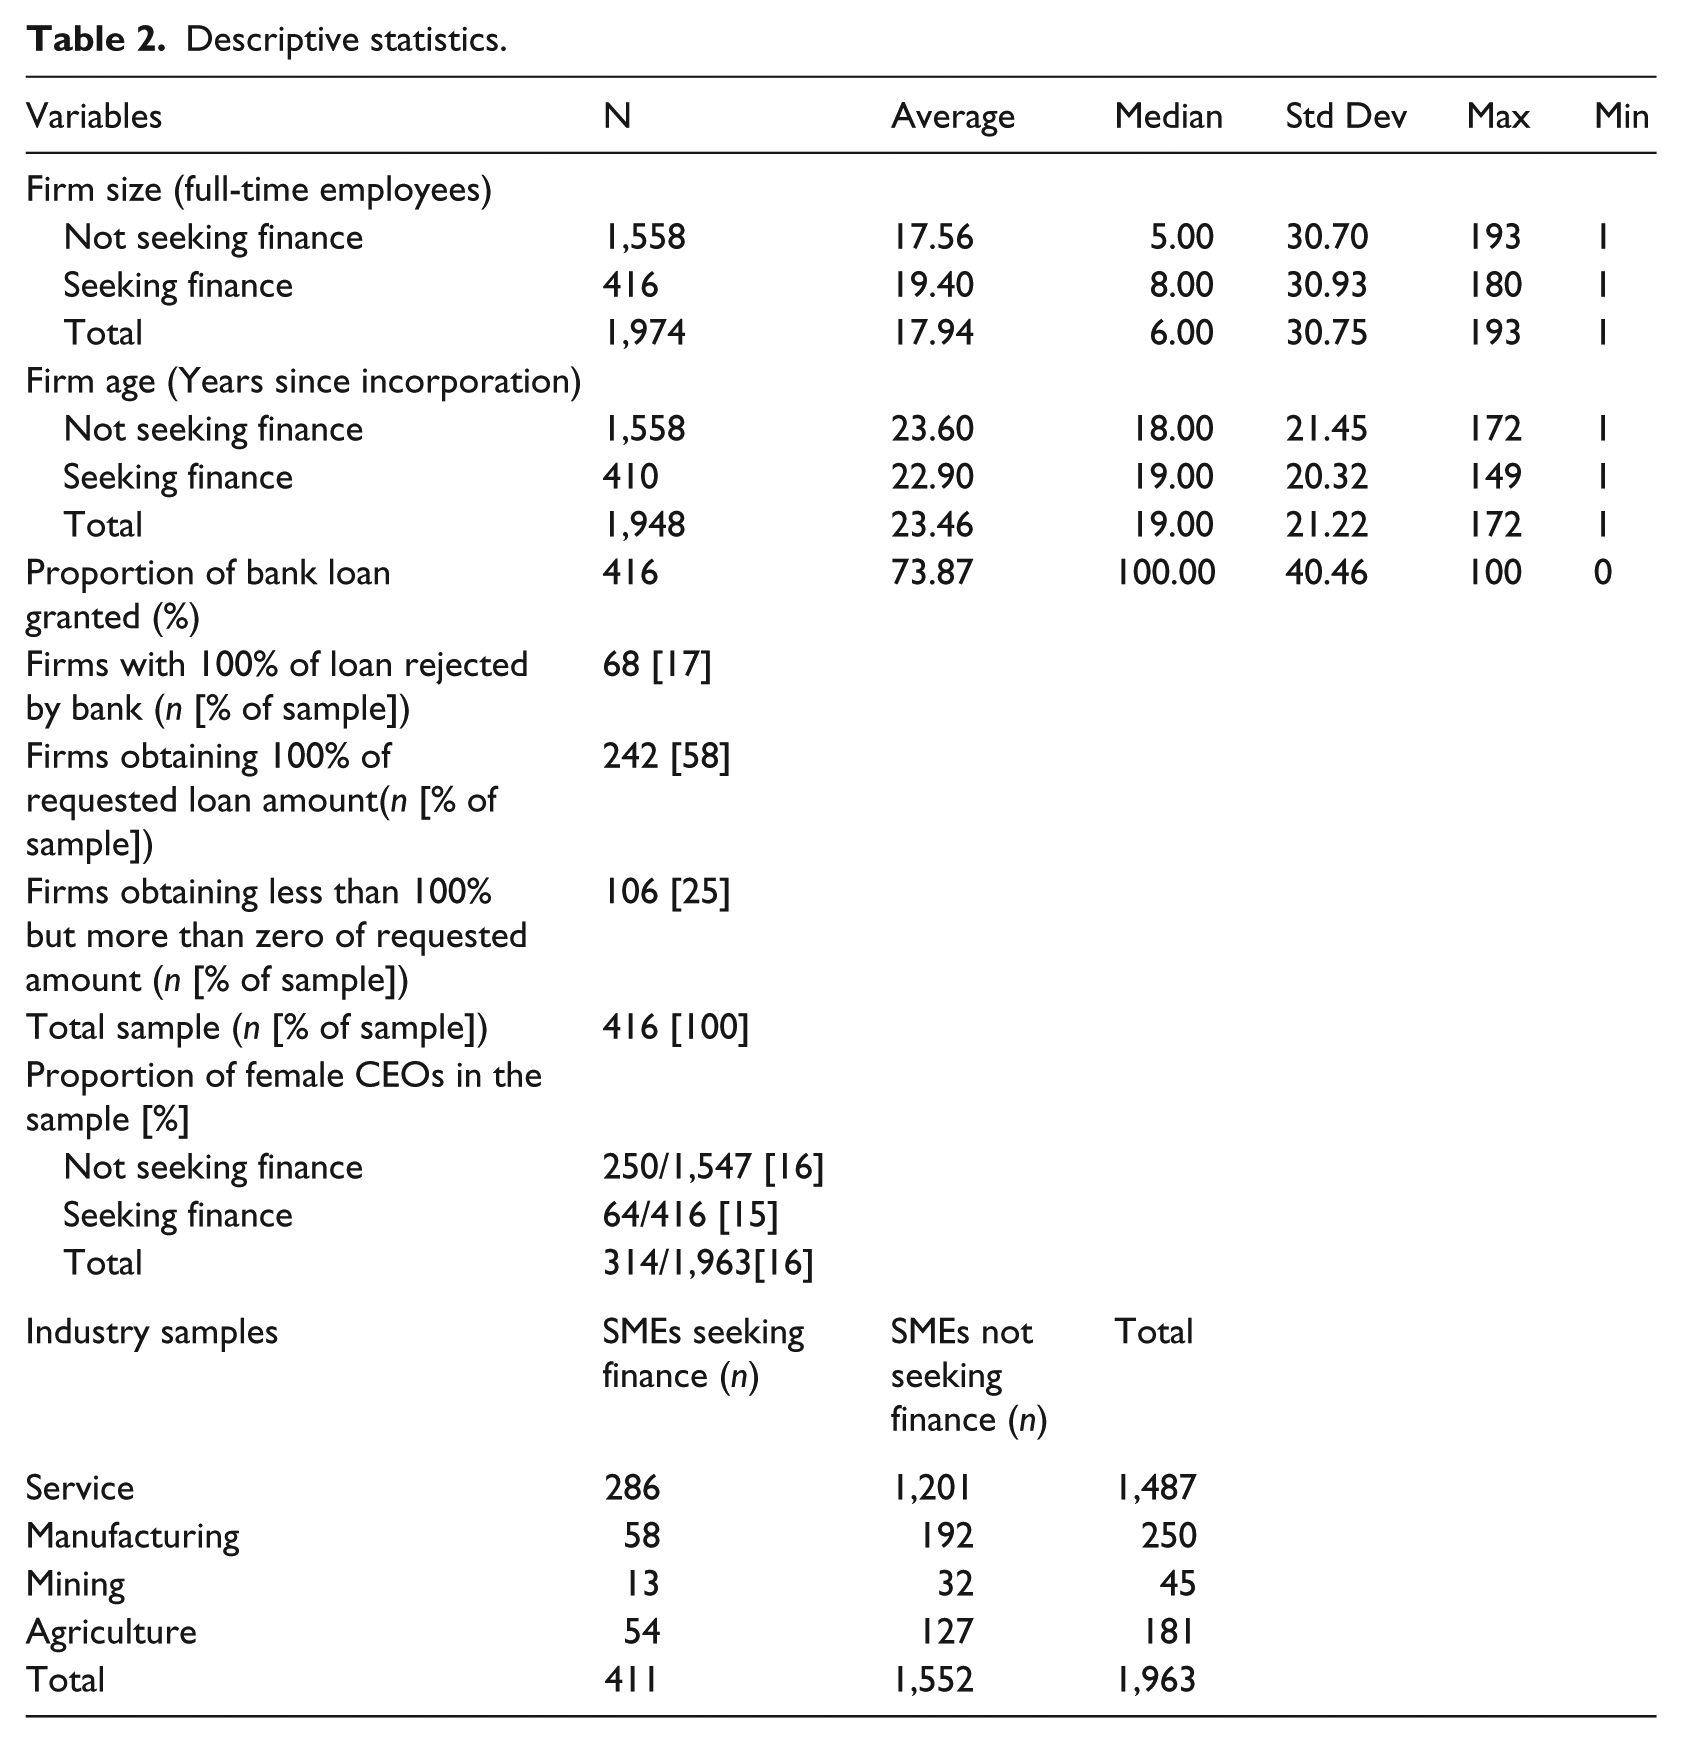
The average firm size is approximately 18 full-time employees. The average firm age is approximately 23 years. The oldest firm is 172 years-old. 7 No significant difference is found between the sample of firms not seeking finance and those seeking finance on size (Full-time equivalent employees - FTE) and age (FTE: t-stat=1.10; prob-value=0.26, Age: t-stat=0.60; prob-value=0.54). However, there are some differences on other measures between firms not seeking finance relative to those that do. Interestingly, 77% of growth firms sought finance, whereas 85% of non-growth firms sought finance. Thirty per cent of agricultural firms sought finance, whereas only 20% of other firms sought finance. These results are not shown in Table 2 for brevity.
The average proportion of bank loan financed is 74% of the amount sought which is shown in Table 2. Although 17% of firms are rejected for any bank finance, 58% obtained the full amount of finance sought. Female CEOs represent approximately 16% of the sample. 8 There is no significant difference between the number of female CEO seeking finance versus not seeking finance.
Also as shown in Table 2 is a breakdown of SMEs across different industry classifications. As shown there are only a small number of firms seeking finance in the mining industry, with the majority of firms in the service industry.
4. Research model
To investigate the decision of Australian SMEs to seek finance, we use a robust PROBIT model, as the dependent variable is dichotomous. To investigate credit rationing we use a robust TOBIT logistic regression model as the dependent variable is truncated zero to 100. 9 The base Models 1.1 and 1.2 are defined as follows:


Where Fini is either unity if the firm sought finance in the past two years or zero otherwise and Rationi is our proxy for credit rationing for firm i; Agei is the natural logarithm of age for firm i, measured in years; Sizei is the natural logarithm of size for firm i, where size is measured as equivalent full-time employees; Growthi is a dummy variable of unity if the CEO of firm i has stated that the firm is expected to grow moderately or substantially over the next three years, or zero otherwise; 10 Exporti is a dummy variable equal to unity if firm i has export sales that are 10% or more of total sales; 11 BusPlani is a dummy variable equal to unity if firm i has a business plan, or zero otherwise; and Servicei is a dummy variable equal to unity if firm i is in the service industry, or zero otherwise.
In the further models, for ease of reading, we collapse the models together so Fin and Ration are shown as Fin or Ration in a single equation. Model 2 considers a finer distinction on firm industry classifications:

Where Miningi is a dummy variable equal to unity if firm i is in the mining industry, or zero otherwise; Agrii is a dummy equal to unity if firm i is in the agriculture industry, or zero otherwise; and the other variables are as previously defined. 12
Model 3 augments Model 2 with the impact of both process and product innovation:

Where PoIi is a dummy variable of unity if firm i is classified as being process innovative, or zero otherwise; PdIi is a dummy variable of unity if firm i is classified as being product innovative, or zero otherwise; and the other variables are as previously defined.
Model 4 separates out process innovation into incremental and novel:

Where IPoIi is a dummy variable of unity if firm i is classified as process innovative at an incremental level, or zero otherwise; and NPoIi is a dummy variable of unity if firm i is classified as process innovative at a novel level; and the other variables are as previously defined.
Model 5 considers the significance of product innovation in a similar manner as Model 4 does for process innovation. That is, Model 5 considers incremental and novel product innovation:

Where IPdIi is a dummy variable of unity if firm i is product innovative at an incremental level, or zero otherwise; NPdIi is a dummy variable of unity if firm i is product innovative at a novel level zero otherwise; and the other variables are as previously defined.
Models 6.1 and 6.2 augment into Models 4 and 5 the gender of firm i CEO respectively:


Where Malei is a dummy variable equal to unity if the firm CEO is male, or zero otherwise; and the other variables are as previously defined. The above models are estimated across the sample of firms with robust standard errors.
5. Results
Table 3 provides a correlation matrix for all the variables used in the TOBIT and PROBIT models. Although some of these correlations are high, highly correlated variables are not used simultaneously in our models. Furthermore, we discuss in our robustness tests the techniques used to further address any concerns with multicollinearity.
Pearson, Spearman and tetrachoric correlations.
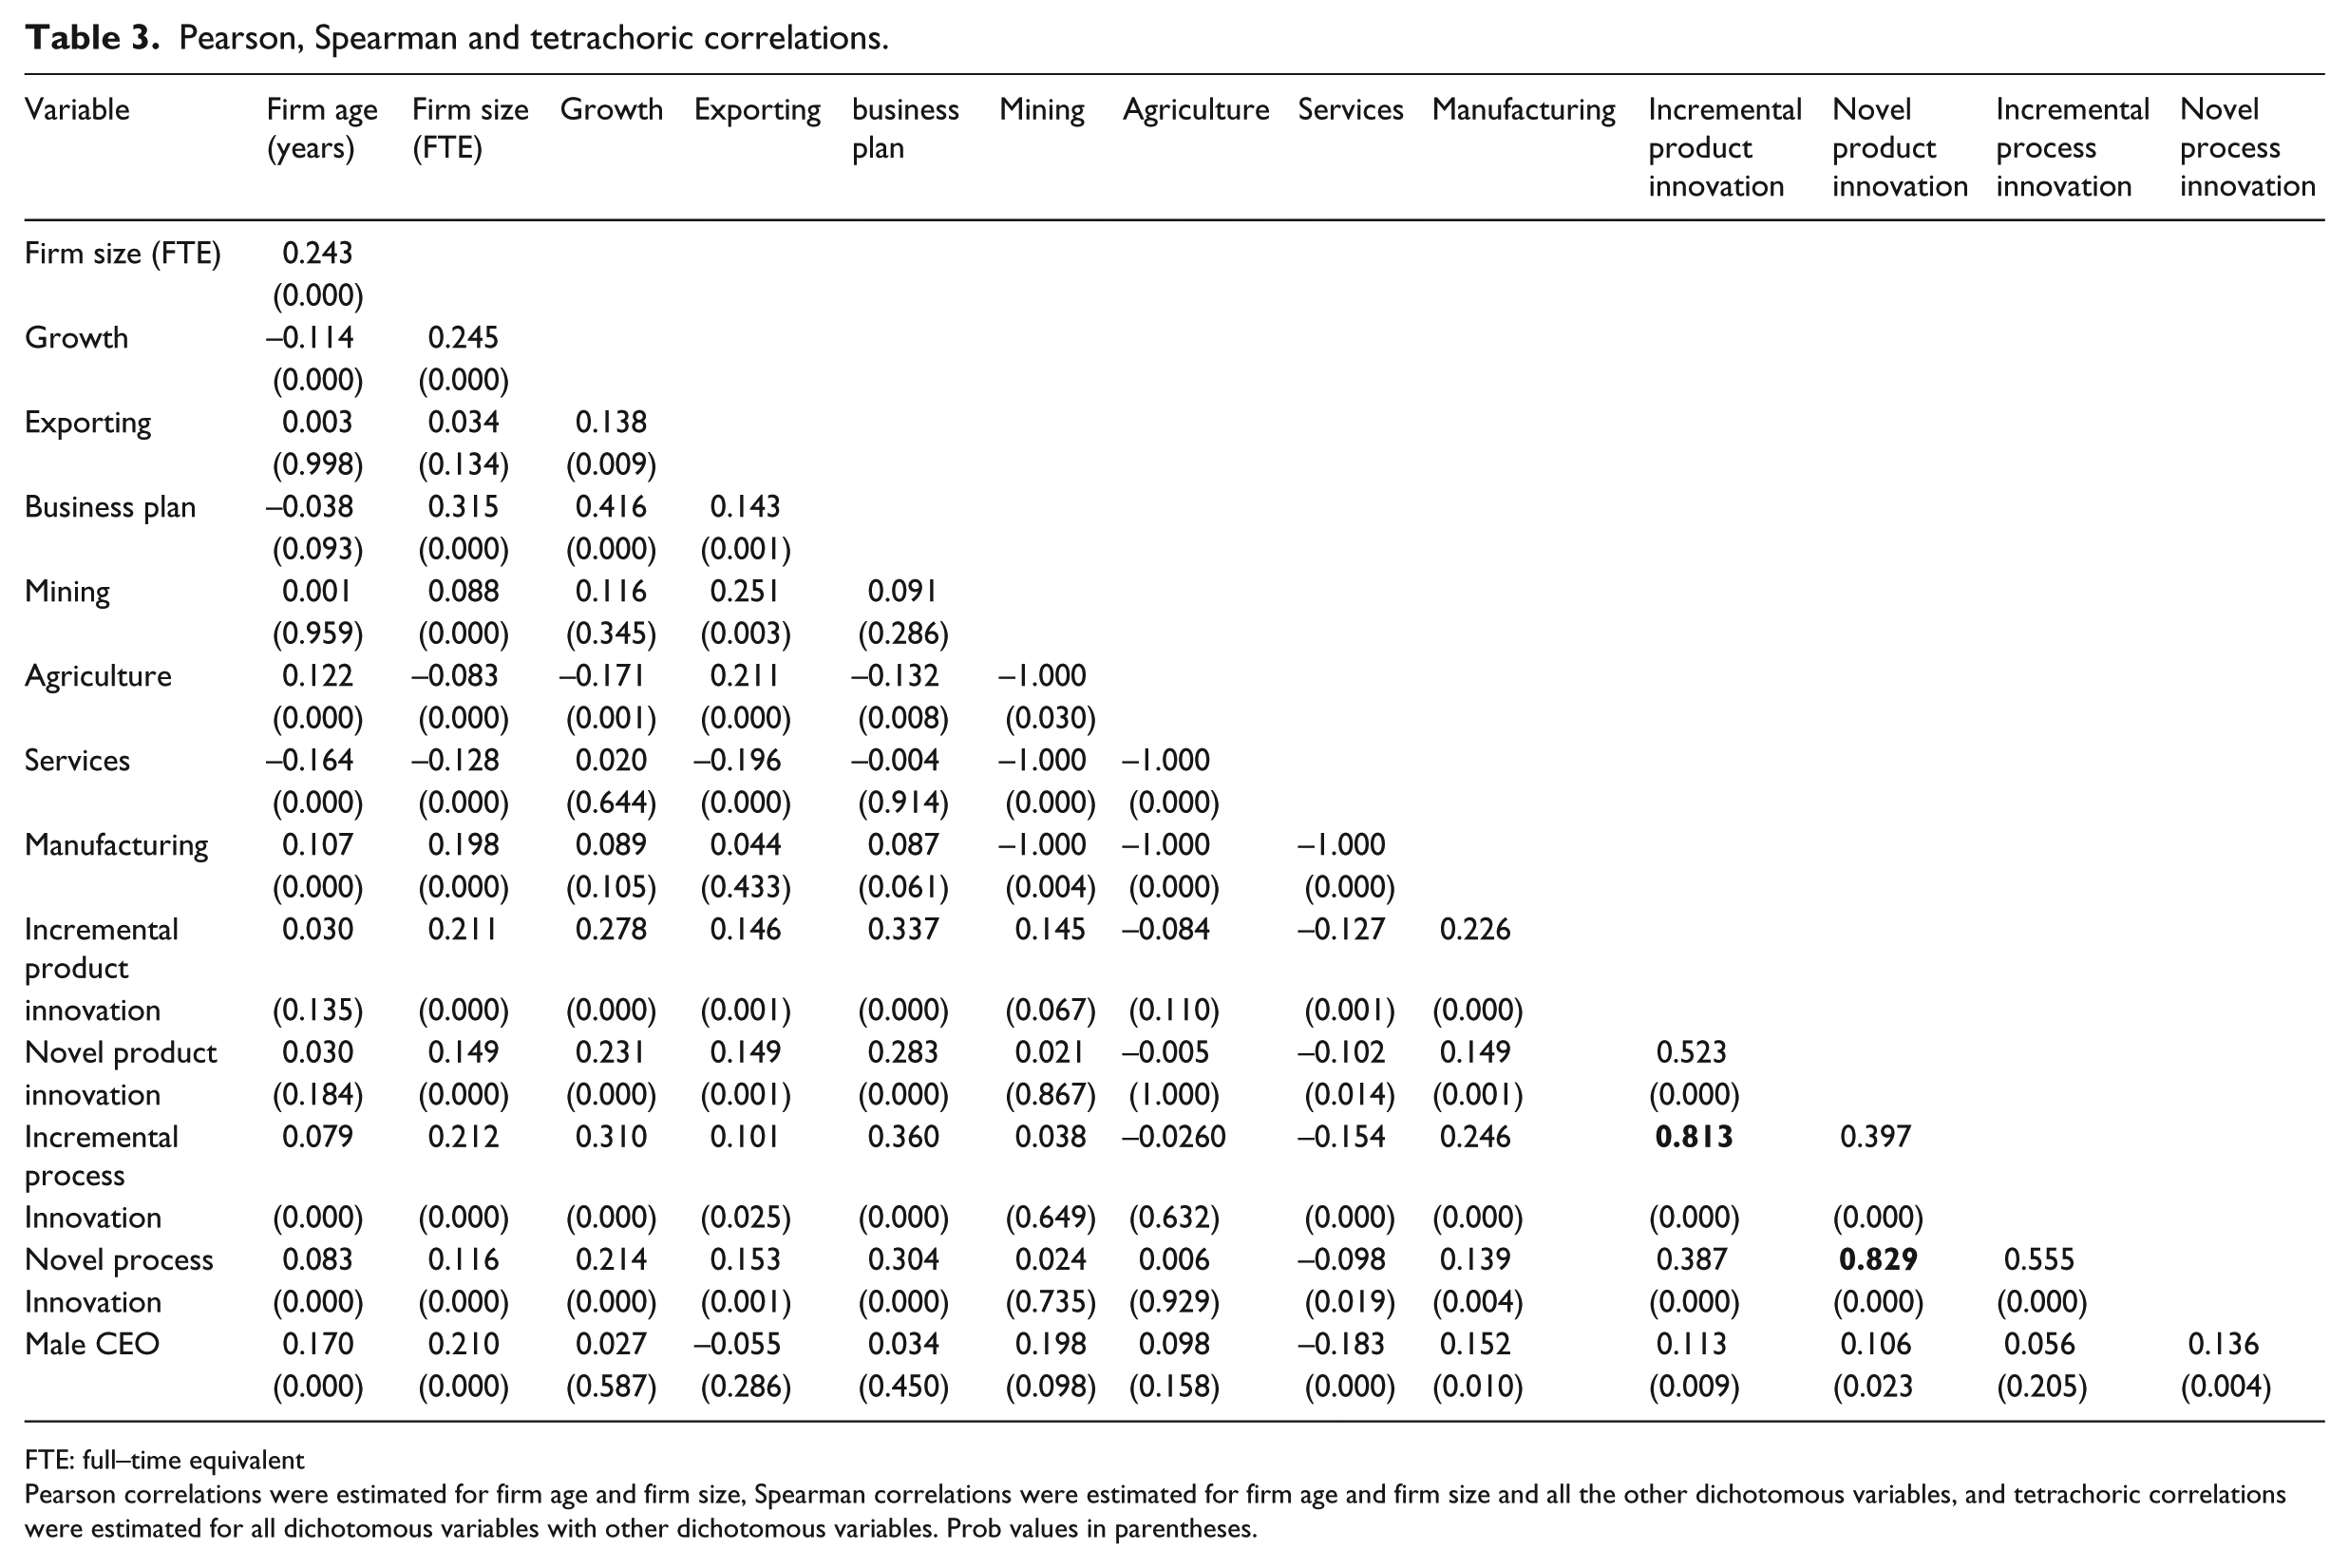
FTE: full–time equivalent
Pearson correlations were estimated for firm age and firm size, Spearman correlations were estimated for firm age and firm size and all the other dichotomous variables, and tetrachoric correlations were estimated for all dichotomous variables with other dichotomous variables. Prob values in parentheses.
The result of our model estimations for Australian SMEs seeking finance are shown in Table 4.
Probit estimation of SMEs decision to seek finance using the following models:


Where Fini either unity if firm i sought finance in the past two years, or zero otherwise; Agei is the natural logarithm of age of firm i, measured in years; Sizei is the size of firm i, measured as the natural logarithm of equivalent full-time-employees; Growthi is a dummy variable of unity if the CEO of firm i has stated that the firm is expected to grow moderately or substantially over the next three years, or zero otherwise; Exporti is the proportion of firm i’s sales in export markets that are greater than 10% of total firm i sales; BusPlani is a dummy variable equal to unity if firm i has a business plan, or zero otherwise; Servicei is a dummy variable equal to unity if firm i is in the service industry, or zero otherwise; Miningi is a dummy variable equal to unity if the firm is in mining, or zero otherwise; Agrii is a dummy equal to unity if the firm is in the agriculture industry, or zero otherwise; PoIi is a dummy variable of unity if firm i is classified as being process innovative, or zero otherwise; PdIi is a dummy variable of unity if firm i is classified as being product innovative, or zero otherwise; IPoIi is a dummy variable of unity if firm i is classified as process innovative at an incremental level, or zero otherwise; NPoIi is a dummy variable of unity if firm i is classified as process innovative at a novel level, or zero otherwise; IPdIi is a dummy variable of unity if firm i is classified as product innovative at an incremental level, or zero otherwise; NPdIi is a dummy variable of unity if firm i is classified as product innovative at a novel level, or zero otherwise; and Malei is a dummy variable of unity if firm i has a male CEO, or zero otherwise. The estimation uses Huber/White standard errors and covariance. P-values are in parentheses.

SME: small to medium sized enterprises; FTE: full-time equivalent; LR: likelihood ratio
Table 4 shows all models are highly significant although the models generally explain only a small percent of the relationship for firms seeking finance. The McFadden R2 ranges from only 1.6% to 2%. The last column in Table 4 is discussed later.
Five variables show relatively consistent significance in relation to firms seeking finance across all Models: firm size, growth options (albeit at the 10% level, except for Model 1.1 where it is insignificant), business plans, an interaction effect of business plans and firm size, and firms in agriculture. The positive relationship between firm size and the dependent variable suggests that it is the larger SMEs that are more likely to seek bank finance. We had no prior in relation to this variable. Although it is very weak the positive relationship between growth options and firms seeking finance suggests that firms that are intending to grow seek bank finance. Similarly, firms that seek finance would be expected to prepare a business plan for this purpose which is supported. A significant negative interaction exists between firms with business plans and size. Once a firm has a business plan, size is less important in seeking finance.
As a result of the work by Beck et al. (2006) on industry effects of credit rationing, they are now seen as more complex than a simple division between manufacturing and service. It is uncertain if this equally applies to firms seeking finance. As shown in Table 4, firms in agriculture have a consistent significant positive relationship to seeking finance relative to manufacturing firms, whereas firms in other industries do not. 13 Although we expected some industry effects we had no prior in relation to which industry.
Firm age, exporting focus, and the gender of the CEO are not significant determinants for firms seeking finance across any models. Although we had no prior in relation to firm age, export focus and gender were expected to have a positive and negative relationship respectively with firms seeking finance. In contrast to that predicted none of the innovation variables are significant.
The results from our model estimations for credit rationing are shown in Table 5.
Tobit estimation of credit rationing across the following models:


Where Rationi is 1-the proportion of bank loan applied for and granted for firm i; Agei is the natural logarithm of age of firm i, measured in years; Sizei is the size of firm i, measured as the natural logarithm of equivalent full-time-employees; Growthi is a dummy variable of unity if the CEO of firm i has stated that the firm is expected to grow moderately or substantially over the next three years, or zero otherwise; Exporti is the proportion of firm i’s sales in export markets that are greater than 10% (40% in Final) of total firm i sales; BusPlani is a dummy variable equal to unity if firm i has a business plan, or zero otherwise; Servicei is a dummy variable equal to unity if firm i is in the service industry, or zero otherwise; Miningi is a dummy variable equal to unity if the firm is in mining, or zero otherwise; Agrii is a dummy equal to unity if the firm is in the agriculture industry, or zero otherwise; PoIi is a dummy variable of unity if firm i is classified as being process innovative, or zero otherwise; PdIi is a dummy variable of unity if firm i is classified as being product innovative, or zero otherwise; IPoIi is a dummy variable of unity if firm i is classified as process innovative at an incremental level, or zero otherwise; NPoIi is a dummy variable of unity if firm i is classified as process innovative at a novel level, or zero otherwise; IPdIi is a dummy variable of unity if firm i is classified as product innovative at an incremental level, or zero otherwise; NPdIi is a dummy variable of unity if firm i is classified as product innovative at a novel level, or zero otherwise; and Malei is a dummy variable of unity if firm i has a male CEO, or zero otherwise. The estimation uses Huber/White standard errors and covariance. P-values are in parentheses.
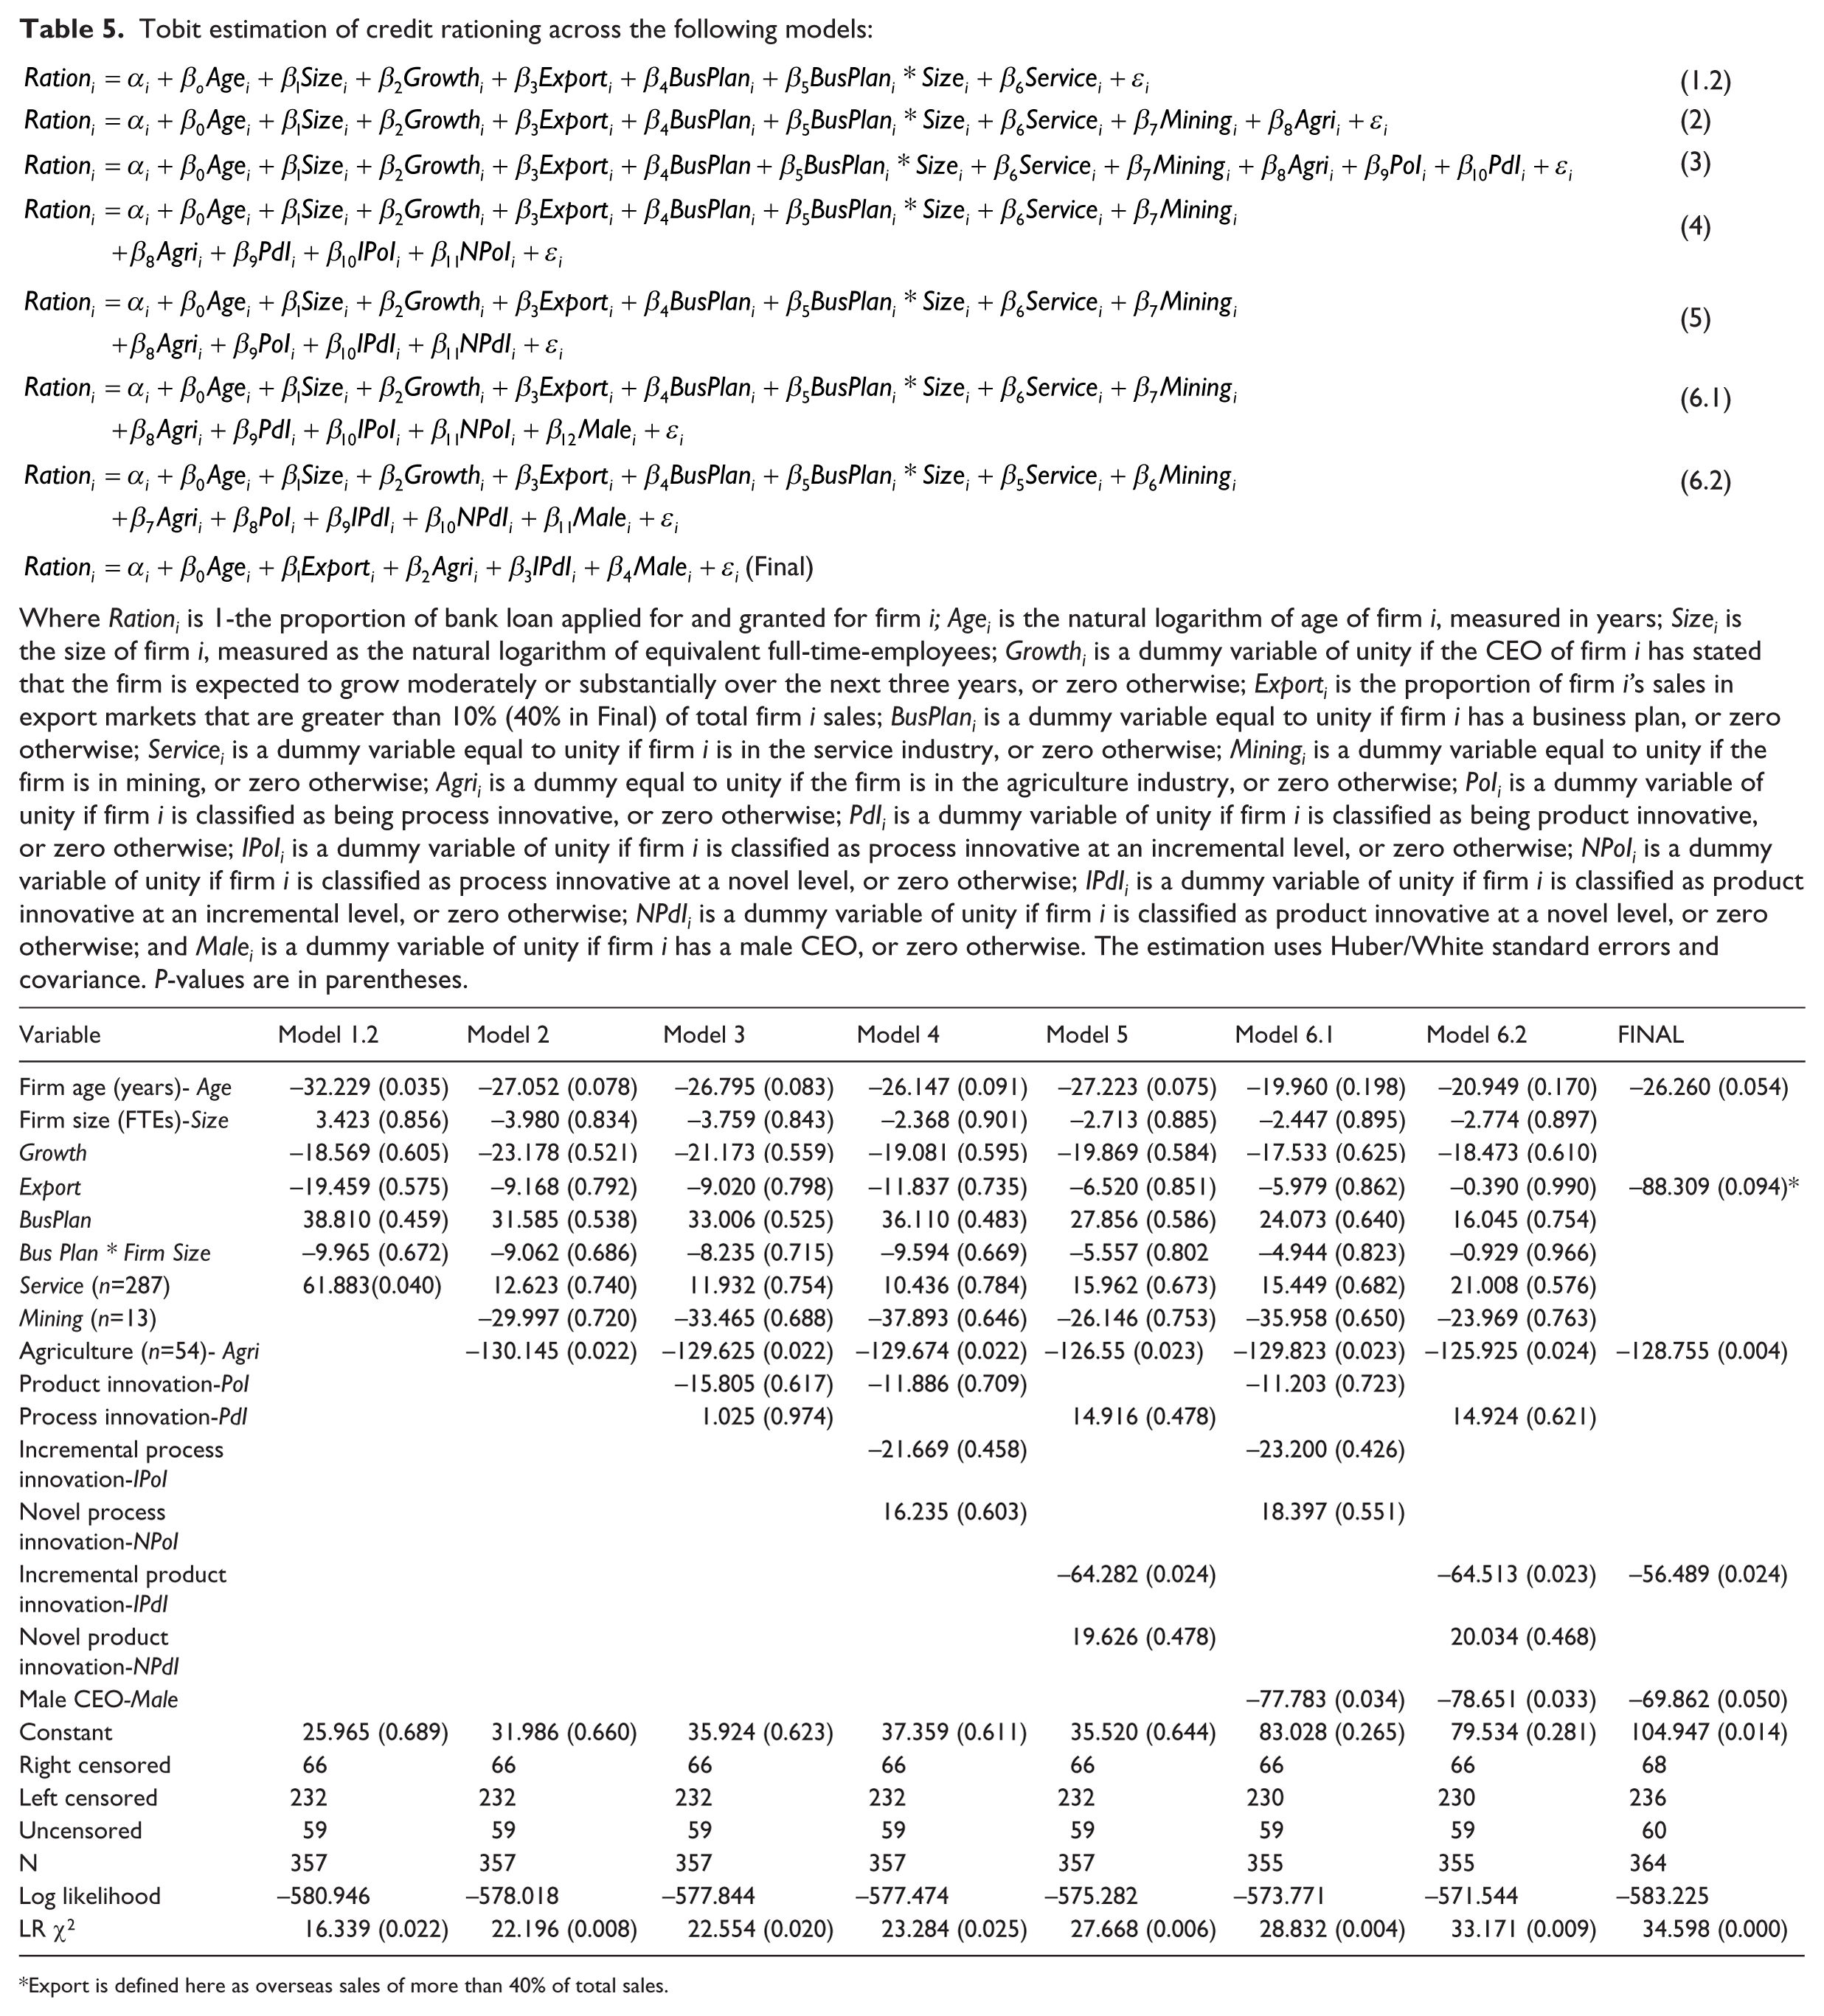
Export is defined here as overseas sales of more than 40% of total sales.
As shown in Table 5 all models are highly significant with high LRχ2 statistics. The last column in Table 5 is discussed later. Apart from Models 6.1 and 6.2 firm age is consistently negative and significant as predicted, although the results vary in significance across Models. Firm size is not significant in any model, which is initially somewhat surprising. However, this can be explained in two ways: first, the sample of firms generally is smaller than other studies (e.g. Freel, 2007); and second, the variability in size is not sufficient for size effects to be identified. The growth intention dummy is not significant and neither is firms having a business plan or the interaction effect. Although the export variable is insignificant across all models, further results reported in the robustness section shed light on this result. Credit rationing is positively significant for service firms (relative to manufacturing firms) at the 5% level for Model 1.2. Generally, the results of Model 1.2 are broadly consistent with Freel (2007) among others.
The results of Model 2 are shown in Column 3 of Table 5. Model 2 considers a finer distinction of the industry classifications. Firms in the agriculture sector now significantly differ from those in manufacturing in relation to credit rationing. In summary, agricultural firms are significantly less credit-constrained in relation to manufacturing firms and also in relation to all other firms. 14
Model 3 introduces product and process innovation. As shown in Column 4 of Table 5, the coefficients on product and process innovation are not significant. Other results are relatively similar to the previous models. However, the simple division on product and process innovation distorts the real picture. Models 4 and 5 apportion product and process innovation into incremental (or firm-level) innovation and novel (or industry-wide level) innovation. In relation to process innovation, neither incremental nor novel innovation is a significant explanatory variable for credit rationing. The significance of other variables remains basically as they were in previous models. However, in Model 5, where product innovation is separated into incremental and novel levels, we find a negative and significant coefficient for incremental product innovation. This indicates that a firm that innovates within its own organisation on products is afforded a greater amount of loan success. However, if this innovation is extended to an industry-wide level, there is no significant change to loan success. This may be attributable to increased risk at industry success relative to success at the firm level. Freel (2007: 27) suggests ‘a little innovation is a good thing’ in relation to loan success, which is consistent with our results.
Up to this point in the analyses, we have not considered whether the gender of the CEO impacts on credit rationing. Model 6.1 (6.2) introduces the male-gender dummy variable into Model 4 (5). As shown in Columns 7 and 8 of Table 5, gender is negative and significantly related to credit rationing. That is, male CEOs are significantly less likely to be credit rationed relative to female CEOs. Although this result supports Freel et al. (2012) and Carter et al. (2007), we document more detail in the robustness section under interactions. The other significant variables include agriculture and incremental product innovation. Interestingly, firm age is insignificant in Models 6.1 and 6.2.
6. Robustness tests
In this section we report a range of robustness tests.
6.1. Export sales
To gain a better understanding of the impact of the level of exporting firms’ sales, we tested the impact of foreign sales percentages on firms seeking finance and also on credit rationing and found that, generally, foreign sales only became a significant explanatory variable for credit rationing and only when foreign sales are in excess of 40% of total sales. This formed the basis for the final models discussed next.
6.2. Redundant variable tests
Because of the large number of insignificant variables identified in the results, particularly for Models 6.1 and 6.2, a redundant variable test was conducted on all insignificant variables. This resulted in the likelihood ratio (LR) test being insignificant (for seeking finance: LR= 13.398; p-value=0.268 and for credit rationing: LR=4.323; p-value=0.976). Because of the redundancy variable tests, the final models selected are as follows:


Following the robustness test on the percentage of export sales, Exporti is defined as overseas sales in excess of 40% of total sales, while the other variables are as previously defined.
The results of these models are shown in the last columns of Tables 4 and 5. The variables significantly related to firms seeking finance are firm size, the firm’s growth intentions, being in the agriculture industry, and whether the firm has a business plan. In relation to credit rationing, firm age, exports in excess of 40% of total sales, firms in the agriculture industry, firms with incremental product innovation, and firms with a male CEO are significant, even though the export variable is significant only at 10%. The only variable consistent for firms seeking finance and for credit rationing is the agriculture industry dummy. This leads to two findings about firms in agriculture: first, they are significantly more likely to seek finance; and second, their loan applications are less likely to be credit rationed.
6.3. Growth and planning to grow
Binks and Ennew (1996) suggest that it is not past growth but those expecting to grow that experience negative (positive) credit rationing (bank finance success). However, Freel (2007) finds a significant positive (negative) relationship between past growth and credit rationing (bank finance success). To consider the impact of past growth, we re-estimate all models (that is, for seeking finance and credit rationing) using the average annual growth in actual turnover for each firm over the past three years. We find that firms with either past growth or growth intentions are significantly more likely to seek bank finance. Neither past growth nor growth intentions are significantly related to credit rationing. In other words, using past growth as a proxy for growth options does not change the original results.
6.4. Interactions
Although the literature review identified an interaction between business plans and firm size there is potential for interactions to exist on firm age and size, firm age and growth, firm size and growth, innovation and firm size, innovation and firm age, export levels and firm age, and export levels and firm size relative to credit rationing. The results of estimating models that considers such interactions failed to show any interesting results. To identify if male CEOs are more likely to be CEOs of older firms (and this explains the firm-age effect), an interaction variable was also created on gender and firm age. Although this model is also robust to the interaction effect, when the male CEO dummy is removed from the model, leaving only the interaction term, it becomes significant. However, the firm-age coefficient remains insignificant. Although including all the constitutive terms in an interaction model increases multicollinearity, it does not justify the omission of the constitutive terms (Brambor et al., 2006). Therefore, we do not give much weight to this result.
Similarly, to ascertain if gender effects influence results for incremental product innovation, we estimated a gender interaction on the incremental product innovation variable. To ascertain if a gender impact for firms in agriculture exists, we estimated a similar gender interaction variable. We identified that, of the female CEOs, nine (or approximately 15% of all female CEOs in the sample) were in agricultural firms and, of these, all nine women obtained 100% financing from the banks (i.e. experienced zero credit rationing). This resulted in the censored TOBIT model being mis-specified. An uncensored TOBIT model was therefore estimated. We also found that firms with innovation relate negatively with credit rationing and that male CEOs do significantly better than female CEOs in bank loan success. However, this does not occur in agriculture where females have significantly more success. Nevertheless, we do note the smaller sample size in the last group and are cautious about this result. Generally, the main results were robust to interaction effects apart from the interaction already identified between business plans and firm size.
6.5. Export firms
We identified a strand of literature that considered the impact of credit rationing on exporting firms rather than whether exporting firms are credit rationed (Chaney, 2005; Gross and Verani, 2012; Manova, 2010; Minetti and Zhu, 2011). These models have export as the dependent variable and examine how credit rationing can impact on export sales. This suggests an issue of endogeniety between the level of exports and credit rationing. To ascertain if endogeniety is a problem in our final credit rationing model, we created an instrumental variable that was related to the level of export sales but not to credit rationing. This instrumental variable was created as follows: Each percentage of total sales for firm i in a foreign currency was multiplied by the change in the foreign exchange rate from 2010 to 2011. For example, when we considered a firm that had 20% of total sales from the US, and 30% from Europe, we found the change in the AUD/USD and AUD/EUR from 2010 to 2011 to be 0.260 and 0.061 respectively. The instrumental variable for this firm is calculated as the sum of the product of the overseas sales and the change in the exchange rate (20% × 0.26 + 30% × 0.061 = 0.070). In cases where the foreign sales were from Asia, we used the change in the trade-weighted index. This series was then used as an instrument in a two-stage least-square regression. We also estimated an alternative instrumental variable that only considered the summation of changes in the relevant exchange rates for firms that had foreign sales. These two instrumental variables are akin to a value-weighted and an equally weighted index. We conducted the two-stage least-squares regressions on the final credit rationing model to find no significant endogeniety present. The Cragg-Donald Wald F statistic indicated that both the value weighted instrument and the equally weighted instrument were strong instruments. The Durbin-Wu-Hausman test for the final model using the value weighted instrumental variable is 2.406 (Chi-sq test) with a p-value of 0.120 and for the equally weighted instrumental variable it is 1.056 (Chi-sq test) with a p-value of 0.308. Given that these results indicate that endogeniety is not a problem the results of the final model reported in Table 5 remain robust.
6.6. Sample selection bias
As a further robustness test on the results, we estimated the final models using a Heckman method to account for potential sample selection bias; sample selection bias in finance is reviewed in Tucker (2010). Firms that are credit rationed, insofar as they have identified themselves as seeking finance, bias the results from the sample of all firms. In other words, the selection of credit rationing firms is non-random. For example, since we want to estimate the determinants of credit rationing, we select the sample only from those firms seeking finance. This can induce bias into the results, which can be tested using the Heckman method over two stages. The first stage estimates the response equation (credit rationing), whereas the second stage estimates the seeking finance equation. These results are reported in Table 6. The results are consistent with those previously reported indicating that the results are robust to any sample selection bias.
This table reports the results of estimating the final regression models using the Heckman selection method.The Heckman (1979) selection model accounts for potential sample selection bias. This model is specified as follows:

FTE: full-time equivalent
6.7. Spatial rationing
There is some evidence, albeit mixed, on the evidence of geographical or spatial credit rationing. For example, Petersen and Rajan (2002) and Berger et al. (2005) find evidence of spatial credit rationing, whereas Agarwal and Hauswald (2010) explain this evidence as relating to lender’s informational advantage. To identify if firm location (metropolitan versus non-metropolitan) has any impact on credit rationing, we downloaded all Australian postcode data and matched postcodes to whether each firm was metropolitan or not. Including a dummy variable for spatial rationing (0 if metropolitan or 1 otherwise) failed to change any of the results reported in any substantial way. The variable was insignificant across all models for both firms seeking finance and credit rationing.
6.8. Ordinary Least Square (OLS) regressions
In addition to the various robustness tests mentioned above, all models were estimated using OLS regressions, which produced results substantively similar to those reported.
6.9. Multicollinearity
To address concerns regarding multicollinearity, variance inflation factors were estimated for all variables using OLS regressions. Variance inflation factors (for non-interaction variables) were fewer than 4.5. 15 This result supported those in the correlation matrix shown in Table 3 thus suggesting that multicollinearity is not a cause for concern.
7. Discussion and conclusion
The importance of SMEs for economic growth is well documented. As with large firms, the availability of finance is vitally important to SMEs to ensure their viability and growth. We document in this paper the results from estimating a number of models of firms seeking finance and subsequent credit rationing for Australian SMEs.
Our results can be discussed as follows. First, in investigating which type of firms seek bank finance, we find that larger firms, firms with either past growth or growth intentions, firms with business plans, and firms in the agriculture industry matters. These findings are well supported in previous studies (Bellier et al., 2012; Freel, 2007; Harrison and Mason, 2007), particularly that agricultural firms need debt finance for working capital on an ongoing basis (Mason and Stark, 2004). Similarly, growth firms need finance to invest in the resources that underpin growth (Manova, 2010). The use of business plans is also supported by the literature (e.g. Mason and Stark, 2004), which shows that potential funders often wish to see a business plan as the first step in deciding whether to fund a business. These results also indicate that firms are more likely to seek finance if they exhibit the characteristics that they perceive banks look for in fundable firms.
Second, our modelling of credit rationing delivered interesting results. We find across a range of different models that older firms, those with over 40% of revenue from exports, firms in agriculture, firms with incremental product innovation, and firms with a male CEO, relate positively to the proportion of bank finance that they successfully obtained (negatively to credit rationing). Generally, credit is rationed for smaller firms, those without export revenues of at less than 40% of total revenue, firms in non-agriculture industries, firms without incremental product innovation, and firms with female CEOs. These results are generally consistent with previous studies such as Freel (2007) among others.
Third, as we considered the same factors in these two sets of models, namely, those that look at what firms see as important to seek finance, against those that show what actually matters for credit rationing, we were able to compare the differences and similarities in what firms versus banks perceive to be important. From this comparison, we derived some interesting insights. First, although firms view the preparation of a business plan as important, it has no significant relationship to credit rationing. Our results therefore point to a mismatch of expectations. This finding is important when considered against not only academic literature that argues that firms without business plans are more likely to be credit rationed (e.g. Pretorius and Shaw, 2004), but also the conventional wisdom that forces business owners to commit resources to preparing business plans when seeking finance. In our sample of SMEs, it is evident that this is not an effective use of resources. This also raises interesting issues regarding the value of ‘soft’ and ‘hard’ information.
Furthermore, although firms that seek finance are more likely to have growth intentions, this is not a significant variable for credit rationing. In addition, firms with innovation are not more likely to seek finance but, when they do, firms with incremental product innovation relate positively to the amount of loan success (negatively with credit rationing). And while firms that have exports greater than 40% of total sales are not more likely to seek finance, this is seen as favourable in obtaining higher success obtaining bank finance. Taken together, these latter factors point to some conservatism in the decision-making processes of banks.
Firms in the agricultural industry are more likely to seek finance, which has a positive influence on the amount of loan obtained (i.e. negative relationship with credit rationing). Firms with female CEOs are not more likely to seek finance relative to firms with male CEOs. However, firms with female CEOs are more likely to be credit-rationed than firms with male CEOs. Taken together, these findings point to the importance for business owners to understand how their funders will be making decisions, should they want to increase their chances for loan success.
Whether these results are attributable to post-global financial crisis-bank lending policy is unclear. Certainly, since the crisis, there have been many structural changes and planning through Basel III to strengthen the regulation, supervision and risk management of the world’s banking sector. Australia fared much better than many other economies during the time of the crisis; however, as noted by Schwartz (2013: 77), it is in our interest to ‘play by the rules’, that is, adopt these more stringent Basel III requirements. The Australian banking regulator (APRA) is very proactive in ensuring the safety of the banks to the extent of pushing the requirement for banks to meet the new standards ahead of time, notwithstanding the displayed resilience of the sector. Whether these results point to further difficulties for customers in sourcing bank loans remains to be seen, although it would seem sensible to hypothesise that more stringent requirements would both make borrowing more difficult for SMEs and impact upon economic growth.
Footnotes
Acknowledgements
Special thanks for comments from participants at the FIRN Annual conference 2013, the Asian Finance Association Conference 2014 and anonymous referees.
Final transcript accepted 19 April 2014 by Kathy Walsh (AE Finance).
Funding
Funding provided by Department of Science, Information Technology, Innovation and the Arts, Queensland Government.
1.
To be consistent with many existing studies on SMEs and to allow comparisons to be made we adopt a definition of an SME as a firm having less than 200 full-time equivalent employees.
2.
![]() argues that, owing to Japan’s regional bank problems of accumulating non-performing loans, lack of diversification, and the absence of competition, financing investment projects of SMEs may be supported politically rather than through the banking system. The political interests may necessitate funding suboptimal investment projects of regional SMEs and keeping non-performing SMEs alive.
argues that, owing to Japan’s regional bank problems of accumulating non-performing loans, lack of diversification, and the absence of competition, financing investment projects of SMEs may be supported politically rather than through the banking system. The political interests may necessitate funding suboptimal investment projects of regional SMEs and keeping non-performing SMEs alive.
3.
4.
As credit rationing implies less finance a negative relation actually means that the firm receives more finance. For example, the older the firm the less credit rationed we expect. Hence we expect a negative relation between firm age and credit rationing.
5.
Of the 2,108 responses 1,974 were usable having less than 200 FTEs. Not all variables were provided by all respondents so the sample was reduced further in some cases. For example on gender 1,963 observations were usable. Further details about sample descriptive statistics are provided later.
6.
This industry grouping is as provided by the Australian Bureau of Statistics (ABS, 2007).
7.
The oldest firm in Australia is the Bank of New South Wales which was established in 1817, making it 197 years old in 2014. In 1982 Bank of New South Wales merged with the Commercial Bank of Australia to form Westpac Banking Corporation. This firm is not in our sample due to it being larger than 200 FTEs. It is mentioned here for interest. The survey data is anonymous so we cannot determine the name of the oldest firm in the sample. However, we do know it is in the agriculture industry.
8.
9.
We test the robustness of this model and report results later in the paper.
10.
We test the sensitivity of this cut-off in the robustness section.
11.
We test the sensitivity of this cut-off in the robustness section.
12.
The reference category is manufacturing.
13.
Estimating Model 2 with the agriculture dummy as the only industry variable provides a coefficient of 0.391 which is significant at the 1% level (p-value=0.001). Estimating Model 2 with the mining dummy as the only industry variable provides a coefficient of 0.216 which is insignificant (p-value=0.291). Estimating Model 2 with a manufacturing dummy as the only industry variable provides a coefficient of 0.011 which is insignificant (p-value=0.908). Model 1.1 in ![]() provides the results for the service industry dummy with a coefficient value of -0.241 which is significant at 1% (p-value=0.001).
provides the results for the service industry dummy with a coefficient value of -0.241 which is significant at 1% (p-value=0.001).
14.
When Model 2 is estimated separately for each industry variable we find the coefficient on the agriculture industry variable is -139.512, which is significant at the 1% level (p-value=0.002), the coefficient on the mining industry variable is -30.335, which is not significant (p-value=0.709) and the coefficient on the manufacturing industry dummy is 7.091 which is not significant (p-value=0.857). The results for the service industry dummy are shown in column 2 of ![]() . This implies that service firms are less likely to seek finance relative to other firms but not relative to manufacturing firms.
. This implies that service firms are less likely to seek finance relative to other firms but not relative to manufacturing firms.
15.
Variance inflation factor of less than 10 is used as a rule of thumb to rule out severe or serious multicollinearity (O’Brien, 2007).