



Abstract
This study examines information and volatility linkages across energy and financial markets. In a world economy so connected, the impacts of climate change are likely to be transmitted through interlinked global markets. Hence, uncovering and understanding the interaction across these markets is a fundamental concern during the energy transition as it helps to understand how to strengthen incentives to facilitate energy investments. Based on the relation between information flows and volatility, this study employs a simple correlation approach based on implied volatility measures and the trading model of Fleming et al. to measure the common information linkages, as gauged by the correlation of return volatilities. The results suggest that volatility linkages across these markets are strong due to common information sharing and cross-market hedging.
JEL Classification:
1. Introduction
This study examines information and volatility linkages across energy and financial markets. Climate change represents a central and urgent challenge for humanity. The scale of potential damages due to climate change could pose a significant systemic risk to the livelihoods and economic health of those who rely on them (IPCC, 2018). In order to avoid dangerous interference with the climate system, the international community acknowledged the importance of a transition to a sustainable future in the Paris Agreement by collectively agreeing to keep the global average surface temperature increase to well below 2°C above pre-industrial levels. A transformation of the energy system in line with a more stringent target of 1.5°C represents a “grand challenge” (George et al., 2016) facing humanity, as coordinated actions and collaborative efforts by various societal stakeholders are required to strengthen the global response to the threat of global warming (IPCC, 2018).
Energy investments, especially those in clean energy technologies, are central to this challenge, in that they not only fuel economic growth but also offer innovative ways to meet decarbonization goals. 1 However, uncertainty in the timing and stringency of climate policies prevents a series of strategic investments from creating a market pull for clean energy. Given the significant role of market forces in the transition to a clean energy economy (Linnenluecke et al., 2018), clear market signals must be put in place to create economic incentives for low-carbon solutions. Hence, understanding the energy market-mechanism landscape will provide useful insights for individuals and organizations to consider and respond to climate change.
As the energy transition is expected to bring structural changes in the economy, both energy and financial markets face serious challenges. The fundamental change in the energy mix that underpins investment decisions will necessitate reasonably swift changes in capital allocation from carbon-intensive fossil fuels to low-carbon clean energy (IEA, 2016). Moreover, changes in policy, advances in technology, and increased physical risks due to more frequent and severe extreme weather and climate events could prompt a re-assessment of the value of a vast range of fossil fuel assets and materially damage financial stability. The recent global financial crisis demonstrated that financial markets become highly correlated during periods of high volatility, even when the underlying economic fundamentals are different. In a world economy that is so connected, financial contagion from a fear of the effects of climate change can be transmitted through interlinked global markets, which could also result in a loss of public confidence and panic selling. These interlocked challenges suggest that uncovering the interaction across energy and financial markets is a fundamental concern during the energy transition, as it helps understand how to strengthen incentives for policy and technology to facilitate energy investments.
The amount of investments required for energy transition is very large, yet a comprehensive analysis of market linkages has been surprisingly quiet. Prior research has predominately focused on the mechanisms linking volatility behavior across financial markets (e.g. Campbell and Ammer, 1993; Fleming et al., 1998; Hakim and McAleer, 2010) or has mainly examined volatility linkages within the energy markets (e.g. Ewing et al., 2002; Lin and Li, 2015; Soucek and Todorova, 2014), or have concentrated their discussions on only one particular pair of volatility linkage between energy and financial markets (e.g. Arouri et al., 2011; Awartani et al., 2016; Liu et al., 2013; Malik and Hammoudeh, 2007). Motivated by the rising global temperature and increasing financial integration, the aim of this study is to fill this gap and extend previous work by comprehensively examining (1) the volatility transmission between energy and financial markets, (2) the interplay among the fuels themselves, and (3) the volatility linkages between the fossil fuel and clean energy markets.
The common approach to examining market interaction is to use return correlations. Absolute and squared returns are a typical measure of volatility in prior studies; however, they can be noisy proxies, and their correlations may not adequately reflect the extent of market linkages. In light of the theory that volatility reflects the rate at which information flows to the market (e.g. Kyle, 1985; Ross, 1989), this study proposes that information linkages across the markets of interest reside in volatility correlations rather than return correlations. To measure these linkages, this study applied two different approaches, informally with a simple correlation analysis based on implied volatility (Wang, 2009) and formally with the general method of moments (GMM) method used by Fleming et al. (1998). The speculative trading model of Fleming et al. (1998) directly estimates the contemporaneous correlation between the log information flows in different markets, which measures the strength of the volatility linkages across markets. Both approaches yield similar results that information flows that drive across markets are significantly correlated. More importantly, market linkages estimated using the GMM approach appear stronger than those suggested by the conventional volatility measures.
This study makes two contributions to the existing literature. First, it extends the application of the Fleming et al. (1998) model to the energy markets, including the emerging clean energy market. Prior studies have demonstrated that modeling the information flows with the GMM approach reveals market linkages and many observed characteristics of the data that are not obvious in other noisy volatility measures (e.g. Fleischer, 2003; Mi and Hodgson, 2018; Schultz and Swieringa, 2016; Treepongkaruna and Gray, 2009). However, these studies mainly focus on the examination of information and volatility linkages across financial markets. In addition, most studies that use correlation analysis often based on the GARCH-type models tend to concentrate their discussions on only one particular pair of volatility linkage between two markets. The expanded set of asset markets introduces a comprehensive examination of the extent of common information linkages across markets with different underlying economic fundamentals. Hence, the results of this study offer meaningful insights into energy investments during the period of the energy transition.
Second, this study opens up a new line of investigation within the “grand challenge” literature by exploring market mechanisms linking volatility behavior across energy and financial markets. There is a growing strand of research from a number of disciplinary perspectives that supports the transition to a low-carbon economy. However, previous work has largely focused on the role of either corporate responses (e.g. Wright and Nyberg, 2017) or institutional actors (e.g. Aguilera-Caracuel and Ortiz-de Mandojana, 2013) in facilitating low-carbon technology development and deployment. Little is known about the implications of market volatility and information linkages between energy and financial markets on energy transition and decarbonization. Hence, this study answers the call for further research on the interaction of market, policy, and environment during the transition toward low-emission, climate resilient pathways.
The remainder of this study is organized as follows. Section 2 reviews existing studies on volatility linkages between the markets of interest, section 3 proposes the hypothesis, section 4 describes the research methodology, section 5 presents the results of two different approaches to measure market linkages, and section 6 contains the conclusion.
2. Literature review
Due to globalization and advances in information technology, the increasing integration of financial markets around the world has raised the need to understand the transmission of information shocks and the resulting volatility across markets. Given the considerable size and importance of fossil fuels in our globalized world, substantial mitigation efforts could result in a re-allocation of the use of fossil fuels and large price swings in their markets, and even pose a significant threat to the financial system. Hence, there is a growing strand of literature analyzing volatility transmission patterns of fossil fuels and clean energy.
2.1. The linkage between the fossil fuel and financial markets
Given the repeated occurrence of turmoil in the financial and fossil fuel markets, considerable attention has been devoted to the transmission of volatility between the crude oil market and the stock market. Using a BEKK-GARCH model, Malik and Hammoudeh (2007) study the volatility spillovers among the US stock market, global crude oil market, and major Gulf Cooperation Council (GCC) stock markets. They provide evidence of volatility transmission from the oil market to the Gulf stock markets but reveal that for Saudi Arabia, there is a significant volatility spillover from the stock market to the oil market. In the same context but applying the VAR-GARCH approach, Arouri et al. (2011) find that substantial return and volatility spillovers exist between world oil prices and GCC stock markets, especially over the crisis sub-period.
Recognizing the increased financialization of the oil market, Liu et al. (2013) examine the short-term and long-term relationships between the crude oil volatility index (OVX) and other existing volatility indexes of the stock (VIX), exchange rate (EVZ), and gold (GVZ) markets. The results show that the OVX is heavily influenced by other volatility indexes. In particular, the stock market is the main source of uncertainty that is transmitted to the crude oil market, indicating that market participants become more susceptible to uncertainty shocks from financial markets, especially when global economic development is substantially disrupted (Liu et al., 2013). By exploiting the implied volatility indexes, Awartani et al. (2016) show that volatility transmitted from the oil market to the US equity market, exchange rate, and precious metals are significant, but the amount of volatility transferred is negligible. These findings highlight the importance of oil in formulating risk expectations and assessing risks in other financial markets.
2.2. The interplay between the crude oil and natural gas markets
As crude oil and natural gas are substitutes in consumption and complements and rivals in production (Lin and Li, 2015), it is generally assumed that these markets are linked. Thus, volatility spillovers between these markets usually result from changes in common information and cross-hedging demand. With a multivariate GARCH model, Ewing et al. (2002) examine the volatility spillovers between the oil and natural gas markets and find that oil return volatility responds when volatility originates in either market, as oil return volatility is conditional on its own past volatilities and those of natural gas. Karali and Ramirez (2014) confirm this finding and show that volatility in the crude oil market is also transmitted to the natural gas market. However, unlike Ewing et al. (2002), they find that only positive shocks in the natural gas market affect volatility in the crude oil market. Soucek and Todorova (2014) extend the literature by studying volatility interrelations in energy futures markets with the application of a multivariate HAR model with range-based volatility estimates. Their results suggest that Brent crude oil futures carry significant information for the volatility evolution of the other energy futures, as crude oil volatility seems to lead the volatility of natural gas and gasoil.
2.3. The transmission between the fossil fuel and clean energy markets
In recent years, the growing concerns about climate change and the volatile nature of fuel prices have spurred interest in the clean energy market. As clean energy represents an alternative to fossil fuels, information shocks such as the adoption of the Paris Agreement may affect expectations and generate volatility in both fossil fuel and clean energy markets. Henriques and Sadorsky (2008) study the dynamic relationships among stock prices of alternative energy companies, technology stock prices, oil prices, and interest rates using a VAR approach. Their results show that shocks to technology stock prices impact alternative energy companies more than oil price shocks. Using multivariate GARCH and dynamic conditional correlation models, Sadorsky (2012) examines the volatility transmission between the oil prices and stock prices of clean energy and technology companies. The results suggest that the clean energy stock prices are more strongly correlated with technology stock prices than with oil prices, which suggests that oil futures can provide a better hedge for investments in clean energy stocks. Using the asymmetric BEKK model, Wen et al. (2014) document that both new energy and fossil fuel stock news transmits into the variances of their counter assets and that the volatility spillovers depend complexly on the respective signs of the return shocks of each asset. A recent study by Reboredo (2015) indicates that oil price dynamics significantly contributes to (representing approximately 30% of) the downside and upside risks of renewable energy companies.
In summary, while different methodologies have been applied to examine volatility transmission across energy and financial markets, the overall results from these studies support the existence of volatility linkages across various markets, highlighting the significance of the empirical results for portfolio allocation and risk management.
3. Hypothesis development
The seminal work of Kyle (1985) suggests that return variance reflects the rate at which information is incorporated into prices. Ross (1989) shows that in a no-arbitrage economy the variance of price changes is directly related to the rate of information arrival. Both studies imply that information flows from one market can generate volatility in another market. Using the generalized speculative trading model of Tauchen and Pitts (1983), Fleming et al. (1998) formalize the relation between information and volatility. According to this model, volatility linkages arise from two main channels. The first source is common information that prompts speculators to simultaneously alter their expectations and adjust their demand across markets. The second source is information spillovers caused by cross-market hedging. That is, speculators rebalance their portfolios and hedge against an information shock using other assets, which consequently changes the demand for both assets.
Fleming et al. (1998) argue that both common information and information spillovers play a crucial role in generating trading and volatility across markets upon the arrival of new information. It is also expected that higher levels of common information and information spillovers can strengthen market linkages (Fleming et al. 1998). Prior studies have applied the Fleming et al. (1998) model in examining information and volatility linkages across different asset markets and their results confirm the effectiveness of the model in identifying common information flows and volatility spillovers in these markets (e.g. Fleischer, 2003; Mi and Hodgson, 2018; Schultz and Swieringa, 2016; Treepongkaruna and Gray, 2009). In addition, Kodres and Pritsker (2002) employ a multiple-asset, noisy rational expectations model of asset prices to investigate financial market contagion. They model contagion as a consequence of the cross-market rebalancing of exposures to macroeconomic risks and conclude that volatility is generated through changes in expectations in one market and subsequent cross-market portfolio rebalancing.
The uncovering of significant volatility interactions across energy and financial markets in the prior literature suggests the presence of common information sharing and cross-market hedging by investors. Based on the rational expectations framework employed in Fleming et al. (1998) and Kodres and Pritsker (2002), this study proposes that information and volatility linkages across the fossil fuel, clean energy, and major financial markets can be established through volatility correlations across markets rather than return correlations. Despite market frictions, it is expected that strong volatility linkages across markets are influenced by information relevant to common fundamentals in their pricing as well as information spillovers resulting from portfolio diversification benefits or economic linkages.
4. Data and methodology
4.1. The implied volatility approach
This study first follows Wang (2009) in using implied volatility to assess volatility linkages across markets. The intuition behind the implied volatility approach lies in its design and forecasting performance. Serving as a gauge of investor fears, implied volatility is derived from option prices rather than extracted from historical returns (Poon and Granger, 2003). Hence, unlike the widely used GARCH-type volatility proxies that are by nature historical, implied volatility reflects market expectations about future volatility and the transmission of uncertainty across markets (Liu et al., 2013).
The instruments used are the WTI Light Sweet Crude Oil futures for oil, the Henry Hub Natural Gas futures for natural gas, the Guggenheim Solar ETF for clean energy, the S&P 500 Index for stocks, the 10-year US Treasury Note futures for bonds, and the Eurodollar futures for the money market. Specifically, the state-preference volatility indexes have been constructed as the volatility measures for the crude oil
Table 1 reports the summary statistics of return and volatility series for each market under investigation. The statistics in Panel A show that the average returns are lower for fossil fuel and clean energy investments than for investments in major financial markets. In particular, clean energy underperforms the oil market and the broader market with the lowest return over the sample period. In line with the standard deviation pattern observed in Panel A, energy markets tend to have higher implied volatilities compared to financial markets.
Summary statistics of return and implied volatility series.
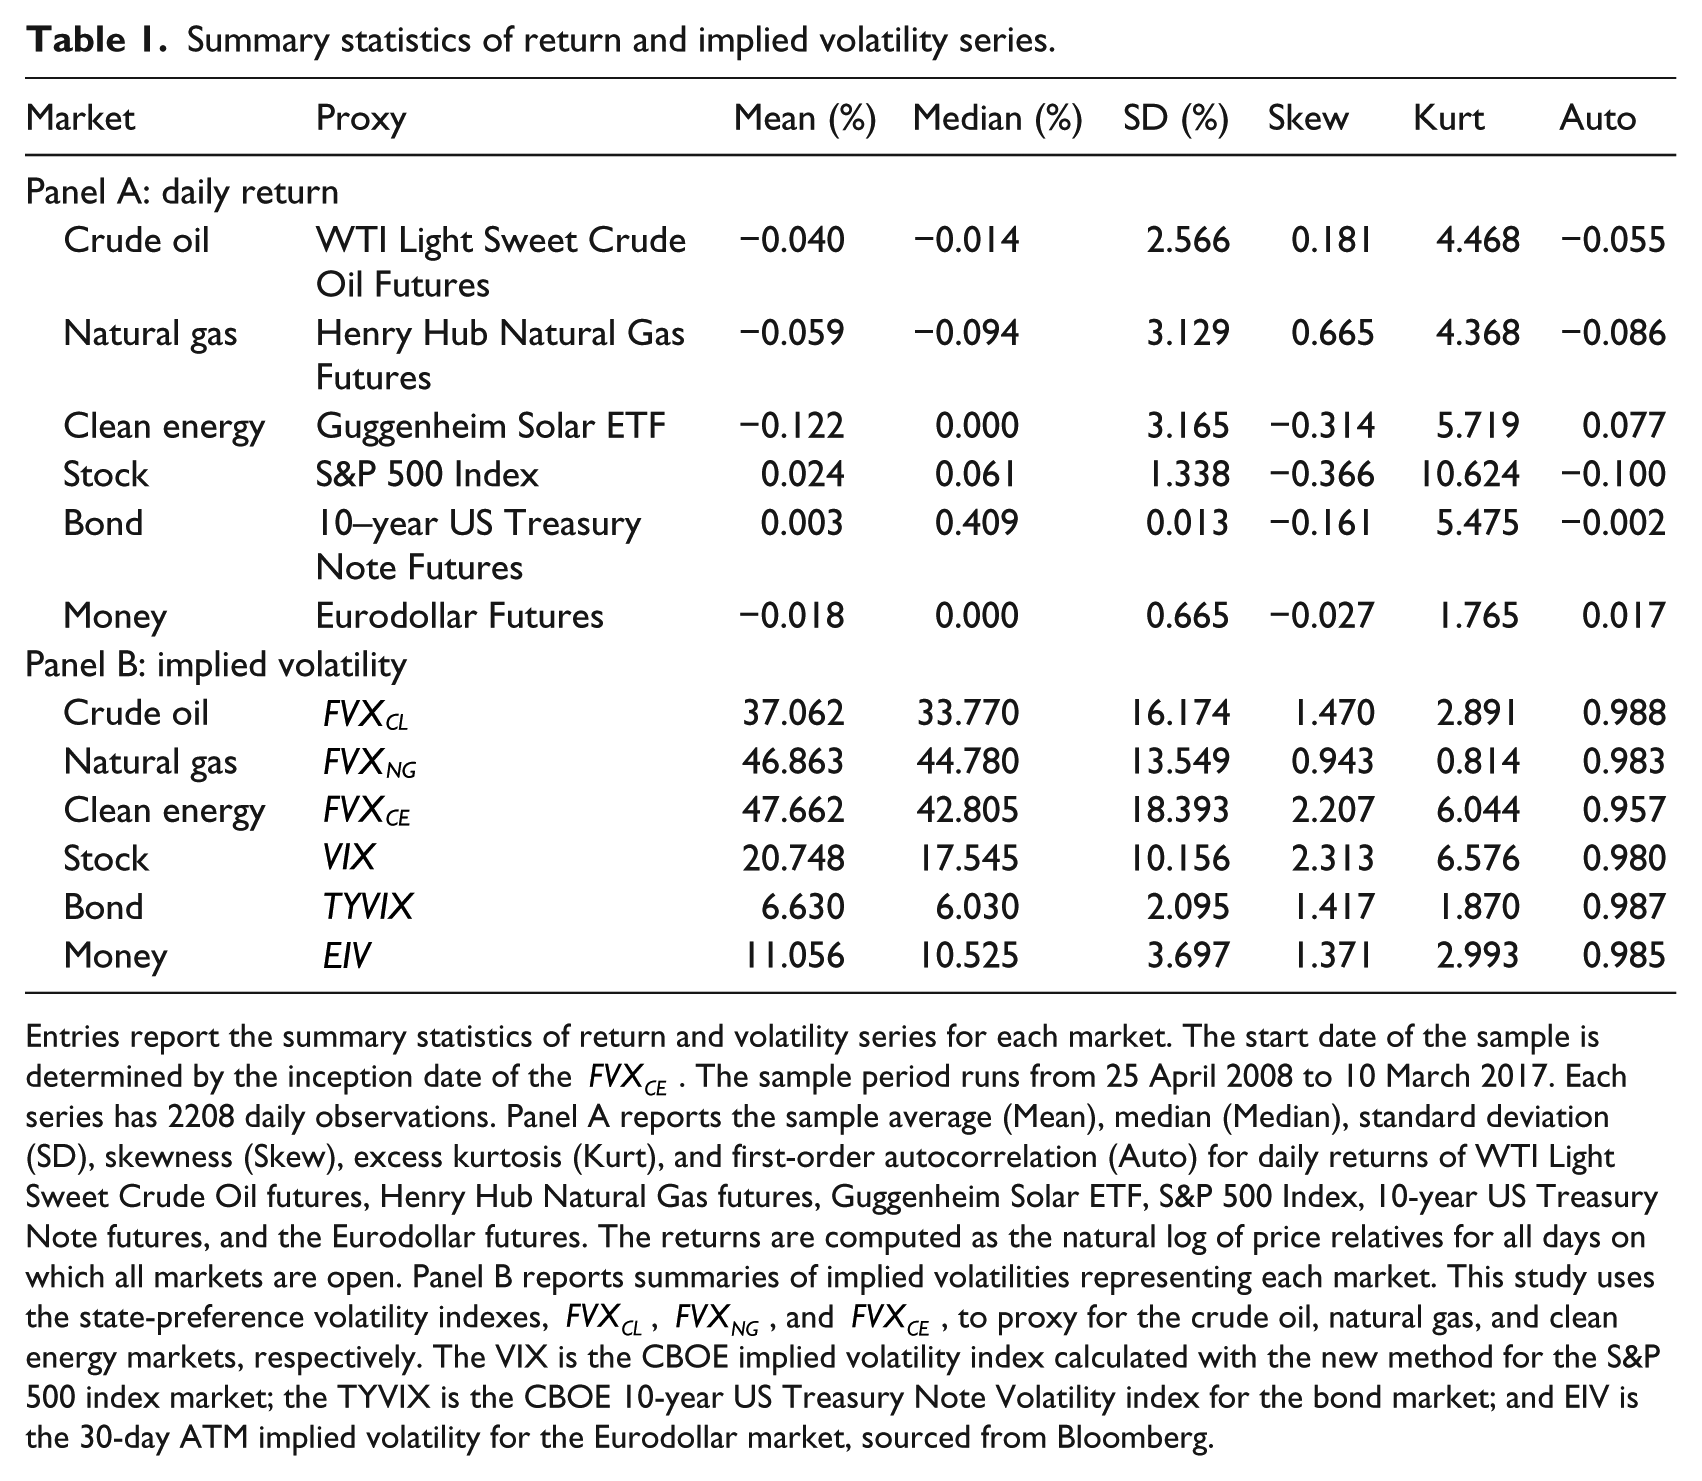
Entries report the summary statistics of return and volatility series for each market. The start date of the sample is determined by the inception date of the
4.2. The GMM approach
This study also examines market volatility correlations using the GMM approach of Fleming et al. (1998), which has both theoretical and practical advantages over the GARCH-type models applied in previous studies. Its theoretical benefits derive from the assumption that stochastic information flows generate volatility. The GMM approach evolves from a theoretical analysis of the trading process, while the GARCH-type approach models information flows based on past prices (Fleming et al., 1998). As a result, the GMM approach allows stochastic volatility specifications to be incorporated into a rational expectations framework that follows for more general forms of serial dependence (Fleming et al., 1998). The practical advantages stem from how simple the approach is to implement and provide correlations of interest with direct estimates (Fleming et al., 1998). Using a bivariate GMM system, this approach yields a direct measure of the contemporaneous correlations between information flows, which measures the strength of volatility linkages across markets (Fleming et al., 1998).
To exploit the relation between information flows and volatility, Fleming et al. (1998) develop a volatility representation of their trading model. The first step is to define

where
To generalize the model, Fleming et al. (1998) write equation (1) as

where
As shown in equation (2), the variance of

where
Along with their underlying assumptions, equations (2) and (3) yield 4


Here, daily returns are generated by a joint stochastic process, and the unpredicted component of returns is defined as

Squaring both sides yields

Taking the natural logarithm of both sides transforms equation (4) into

Since


where
Therefore, moment restrictions on

for all integers
To assess the strength of cross-market linkages, the moment conditions for the bivariate estimation can also be derived. For any two markets,

where
Hence, the cross-market restrictions are expressed as

for all integers
Therefore, the correlation between the log information flows in the two markets can be estimated by including the above moment conditions. The bivariate GMM disturbance vector for assessing the strength of the linkages between the two markets can be written as
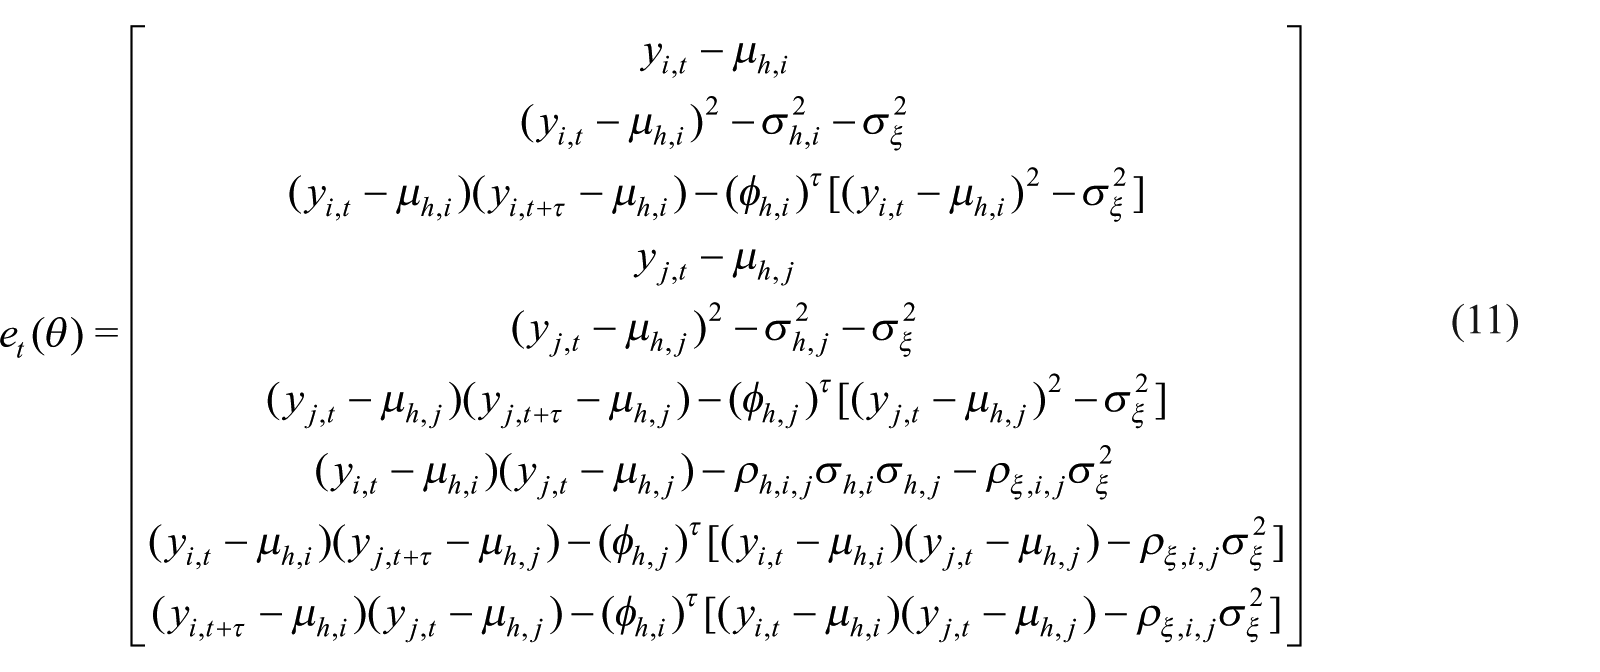
where
The bivariate specification also provides estimates of the correlation between the information flows (i.e.
To obtain the cross-market volatility correlations between energy and financial markets, this study estimates the correlation between the log information flows using the GMM approach to impose the restrictions of the Fleming et al. (1998) stochastic volatility model. To construct the

where
Second, remove the volatility seasonality by regressing

Third, subtract

After the GMM estimation moment conditions are determined by following Fleming et al. (1998), this study implements the GMM estimation procedures in obtaining the cross-market correlations by fitting 15 bivariate systems, pairing (1) crude oil and stocks, (2) crude oil and bonds, (3) crude oil and money, (4) natural gas and stocks, (5) natural gas and bonds, (6) natural gas and money, (7) clean energy and stocks, (8) clean energy and bonds, (9) clean energy and money, (10) crude oil and natural gas, (11) crude oil and clean energy, (12) natural gas and clean energy, (13) stocks and bonds, (14) stocks and money, and (15) bonds and money.
5. Results and discussion
5.1. The implied volatility correlation
The preliminary results based on the implied volatility correlation approach (Wang, 2009) are reported in Table 2. Panel A provides the pair-wise return correlations across markets. Unsurprisingly, the correlation between clean energy and stocks is the highest of the pair-wise correlations because the Guggenheim Solar ETF tracks the performance of a portfolio of clean energy stocks. Crude oil is relatively highly correlated with all the other markets, implying the significant role of crude oil in the global economy. It is the consensus that economic conditions can influence the prices of both stocks and oil commodities—as macroeconomic conditions improve, corporate earnings increase and the demand for energy commodities rises. 6 The results also show a negative return correlation between crude oil and bonds. A possible explanation is that the bond market is often considered as a less risky investment than stocks. As investors become concerned about future returns in higher risk assets, such as stocks and crude oil, they tend to increase their portfolio allocations to bonds. Investors also tend to add energy commodities (such as crude oil and clean energy, as indicated by the negative return correlations) as an alternative to bond investments to diversify their portfolios or hedge against inflation risks.
Return correlation versus implied volatility correlation.
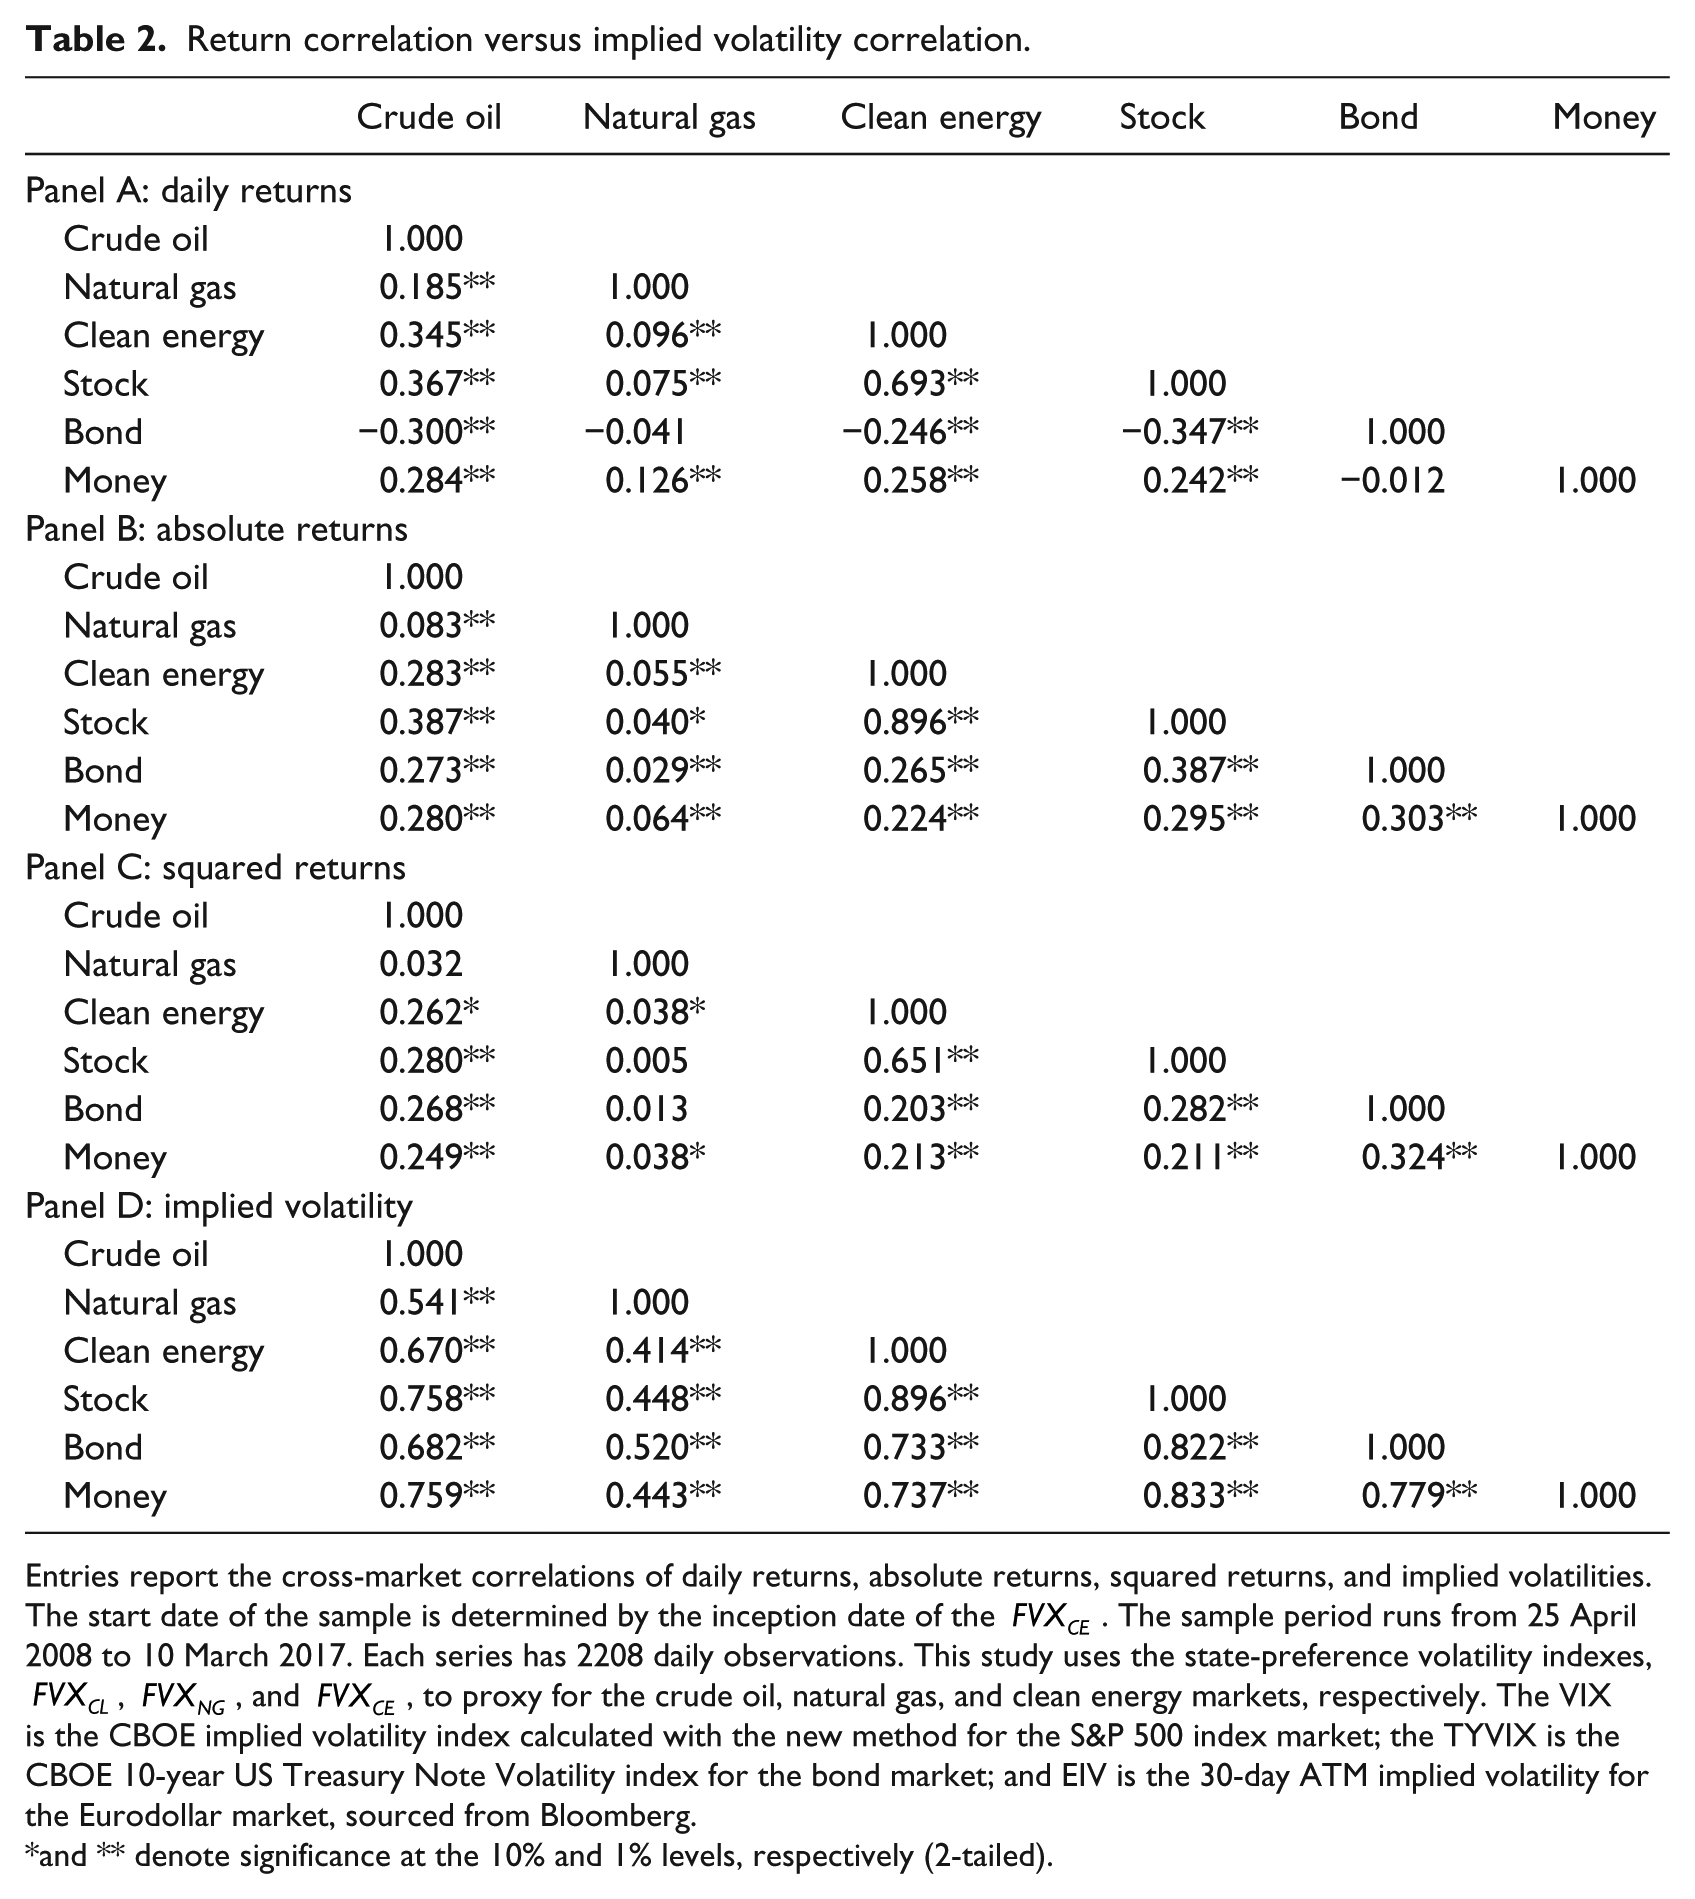
Entries report the cross-market correlations of daily returns, absolute returns, squared returns, and implied volatilities. The start date of the sample is determined by the inception date of the
and ** denote significance at the 10% and 1% levels, respectively (2-tailed).
Panels B and C report the cross-market correlations of two common measures of return volatility, namely absolute returns and squared returns. The correlations of absolute returns are in general smaller than those of returns, except for those between crude oil and stocks and between clean energy and stocks. The absolute correlations are uniformly larger than the squared return correlations. The sign of the correlation between bonds and crude oil/clean energy/stocks changes from negative to positive when using the absolute and squared volatility measures. These correlations serve as benchmarks for the analysis of cross-market volatility linkages. However, note that absolute and squared returns are often considered noisy proxies for return volatility, and thus, their correlations may not adequately reflect the strength of market linkages.
Panel D provides the pair-wise correlations across markets based on implied volatility and implies that there is a high level of interaction among markets. Unlike the return correlations, the volatility correlations across markets are both positive and significant. Moreover, the magnitude of the volatility correlations is greater than that of the return correlations, supporting the hypothesis that information linkages are reflected in the volatility between different asset classes. The strong volatility linkages suggest these markets appear to be influenced by common information sharing and cross-market hedging.
As shown in Table 1, one of the most notable features of the implied volatility series is the presence of high first-order autocorrelation coefficients. This suggests that implied volatilities in these markets are highly persistent, which raises concerns that a correlation study between these series may be susceptible to spurious effects. Following Wang (2009), this study implements a Monte Carlo simulation procedure to detect and control for spurious effects. Underlying each simulation run is the following simple regression model

where
Each simulation run is conducted under the assumption that the independent and dependent variables are not correlated but exhibit the same autocorrelation properties as the observational data (Ferson et al., 2003; Foster et al., 1997). As the first step of the simulation procedure, the moment and serial correlation properties of the regression variables are estimated for each data series. Second, uncorrelated independent and dependent variables with the same moments and serial correlation properties as those of the sample are simulated for the same period with the same frequency as the data in the sample. A regression is then run on these simulated series and the process is repeated 1000 times. The
Table 3 reports the spurious regression simulation results for all markets. It is evident that, in general, there are strong linkages across markets, as evidenced by the strong, positive, and robust correlations between the implied volatilities of markets.
7
For example, the calculated
Spurious regression effect diagnostics.
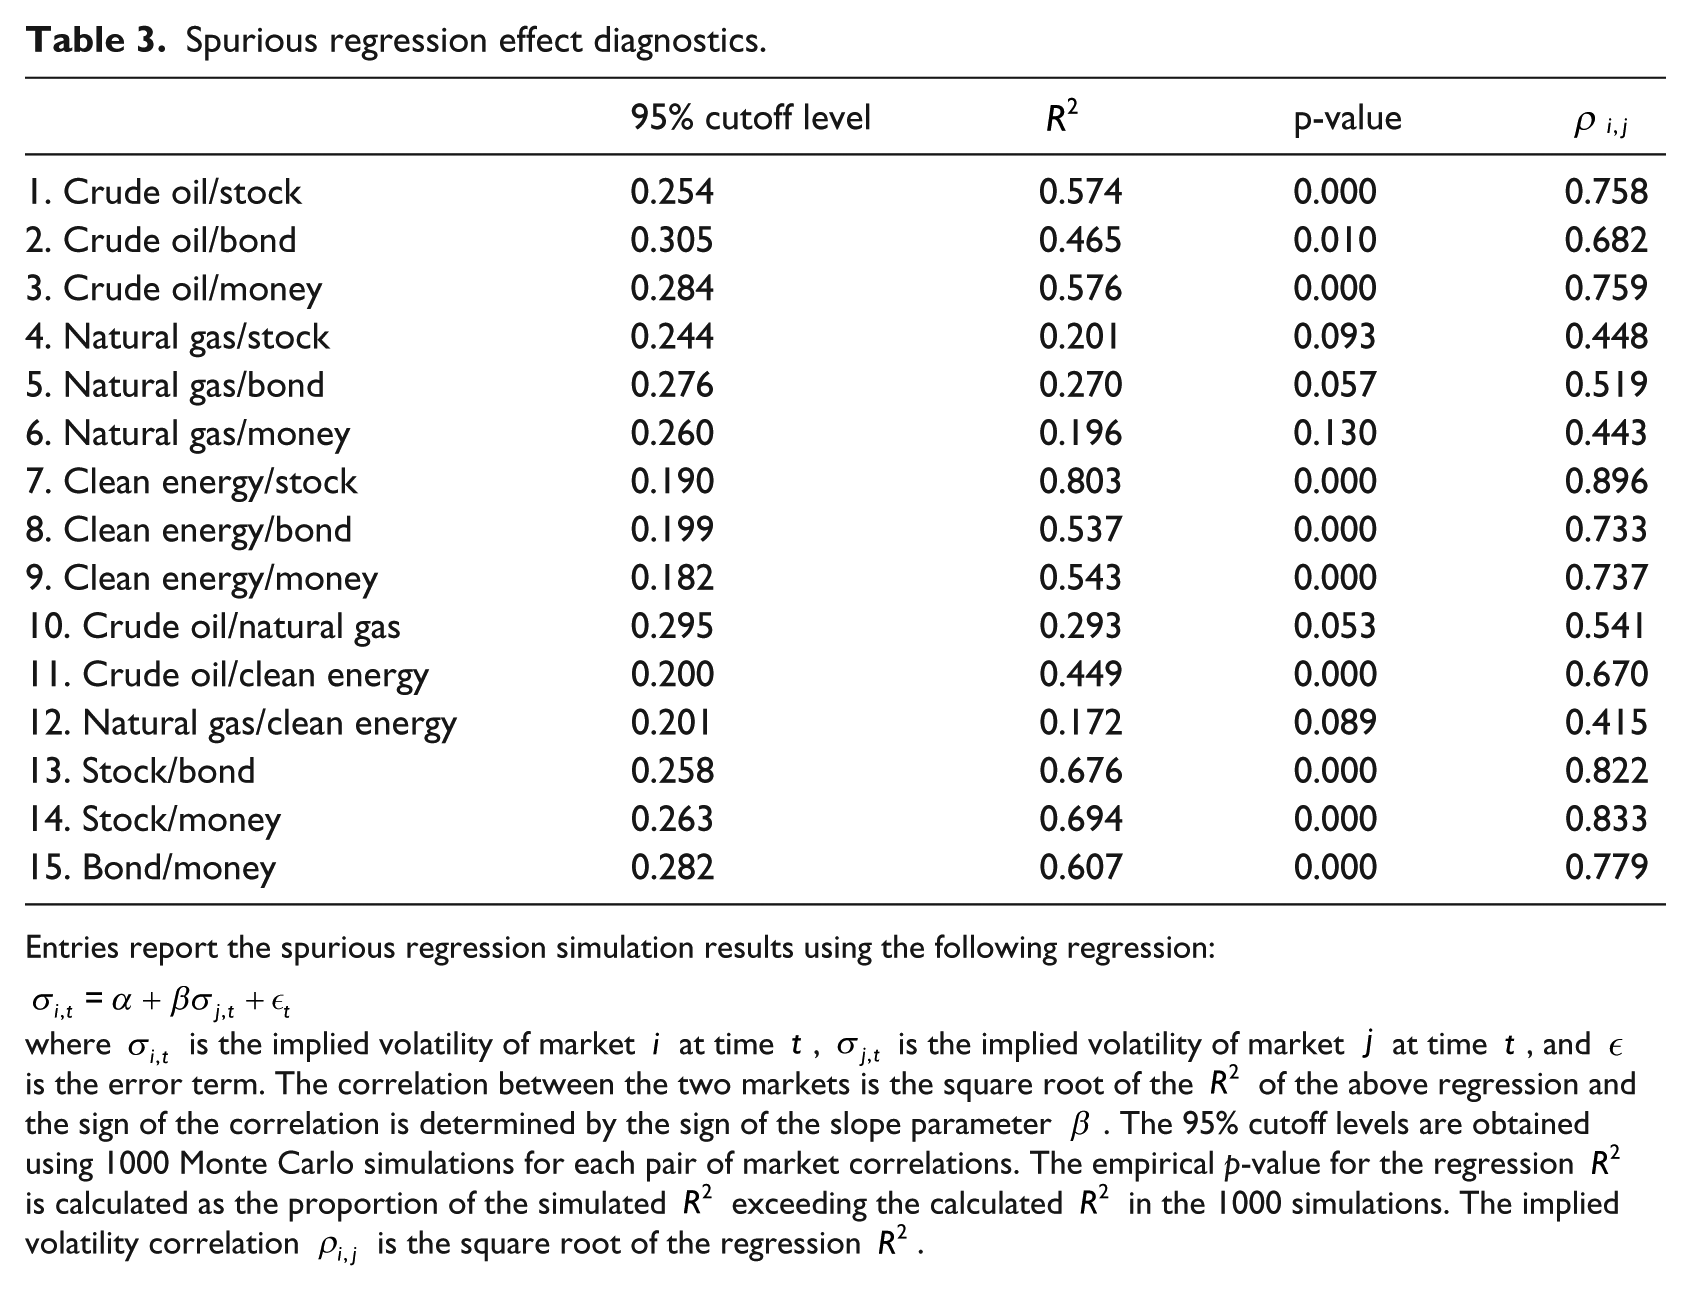
Entries report the spurious regression simulation results using the following regression:
where
5.2. The GMM model estimation results
Table 4 reports the bivariate estimation results for
GMM model estimation results.
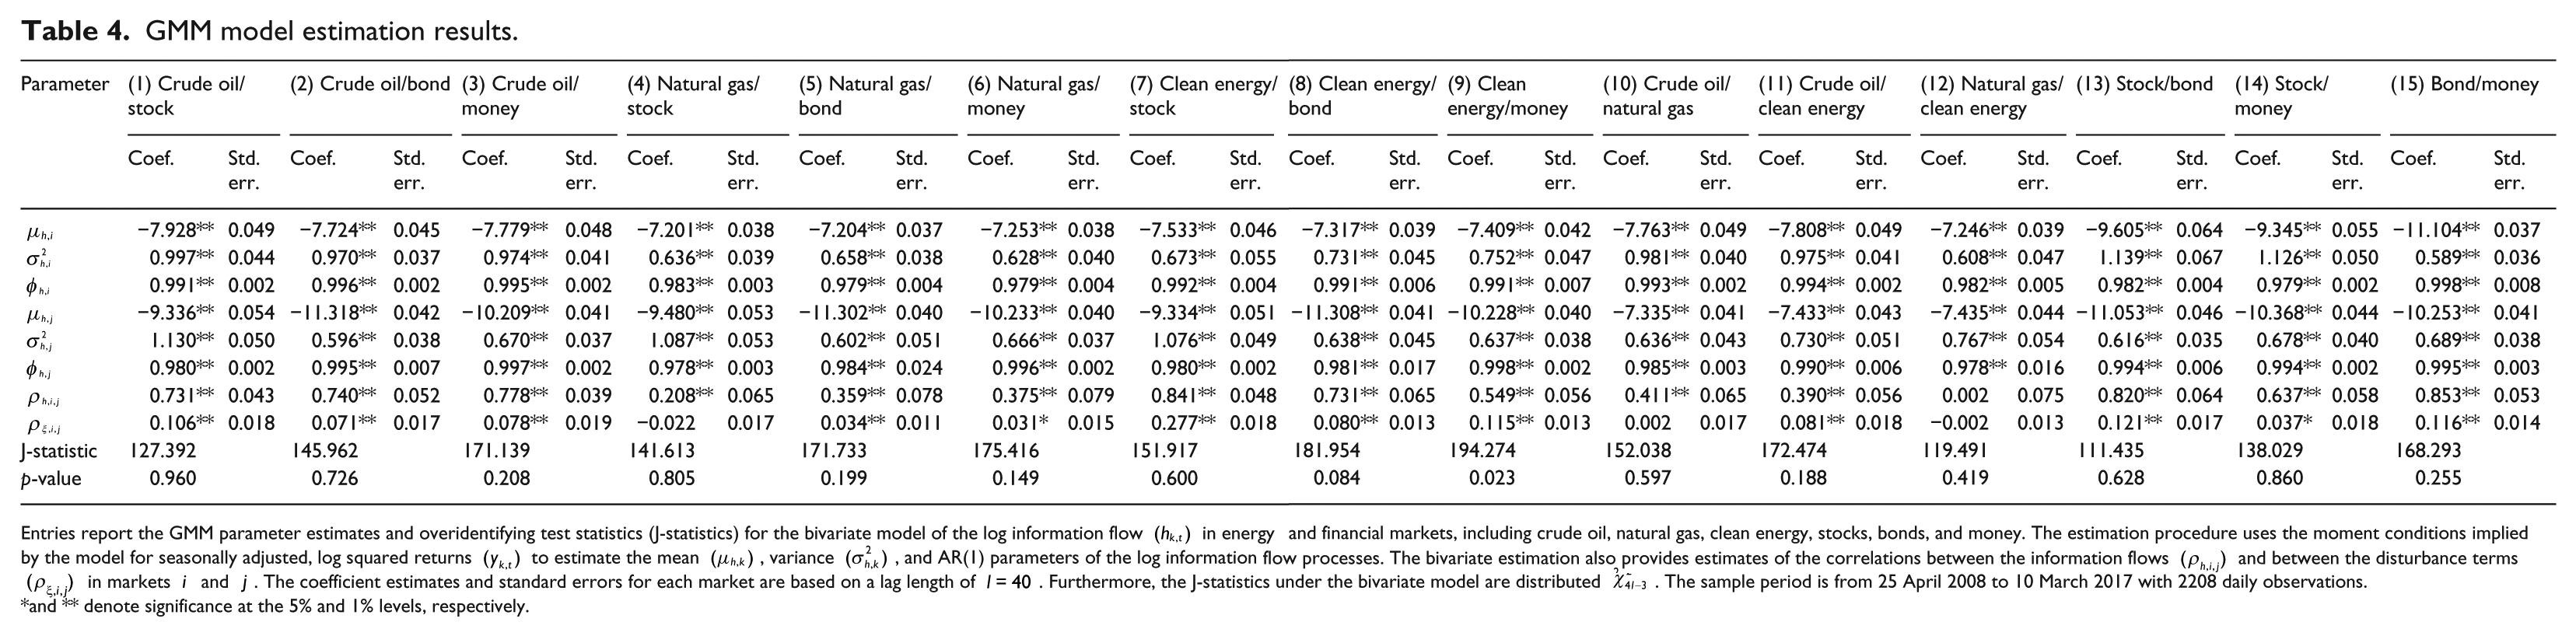
Entries report the GMM parameter estimates and overidentifying test statistics (J-statistics) for the bivariate model of the log information flow
and ** denote significance at the 5% and 1% levels, respectively.
In contrast, the estimated variance of the log information flows
The estimated parameter of greatest interest in the bivariate systems is the correlation of the log information flows between markets (i.e.
The magnitude of these information flow correlations has substantial implications for the linkages across markets. For example, the fact that energy markets are commonly sensitive to many types of information (e.g. economic growth, industrial production, unanticipated weather events, climate mitigation policies, technological innovation) can drive the relatively strong information linkages across energy markets. As crude oil and natural gas/clean energy serve as substitutes and complements of one another, information spillovers may occur because of cross-market hedging demand, causing volatility through trading activities. It is also evident that, compared to natural gas and clean energy, crude oil has stronger linkages to financial markets. This indicates that the crude oil market incorporates information more quickly and completely, likely due to its greater depth and liquidity. As crude oil is one of the fundamental drivers of the global economy, the strength of the volatility interaction between crude oil and financial markets is likely prompted via the spillover channel. It is unexpected that natural gas has weaker information linkages with the other markets. In particular, there seems to be no information flow correlation between natural gas and clean energy. One possible explanation is that common information might not be significant across these two markets or cross-hedging might not be effective, as market participants might not have accepted clean energy as a substitute for natural gas. 9
Moreover, the information flow correlations of stocks-bonds, stocks-money, and bonds-money (for a sample period from 25 April 2008 to 10 March 2017) are much higher than those reported in Fleming et al. (1998) (for a sample period from 3 January 1983 to 31 August 1995) and Wang (2009) (for a sample period from 5 January 1998 to 31 December 2007). This reveals that the information linkages across these markets have strengthened over time. Comparing the GMM estimation results with the implied volatility correlations (corrected for spurious effects) reveals that they are relatively similar in most cases. The differences in the correlation results probably arise from the underlying assumptions and methodologies of these two approaches. The GMM approach is based on a theoretical analysis of the trading process and incorporates stochastic volatility specifications into a rational expectations framework that follows for more general forms of serial dependence. Implied volatility, in contrast, requires no trading model to derive volatility series and assess the process of information flows. Moreover, implied volatility is derived from option prices and reflects market expectations of future volatility, while the volatility measure in Fleming et al. (1998) is proxied by the log of the squared historical return (i.e.
6. Conclusion
Scientists have been warning for decades that rising global temperature, driven by greenhouse gas emissions primary from the burning of fossil fuels, will have catastrophic consequences for humanity (IPCC, 2014). The increasing speed of global environmental degradation and the resulting negative externalities call for a rapid transition to a low-carbon economy through investments in clean energy technologies. However, a smooth and timely energy transition is a complex process with multiple interactions. Hence, the transformation of the energy system represents a “grand challenge” (George et al., 2016) facing humanity to mitigate climate risk while meeting economic development goals. By looking at the common information and volatility linkages across energy and financial markets, this study answers the call for further research on the interaction of market, policy, and environment during the transition toward low-emission, climate-resilient pathways.
The overall results indicate that information flows that drive trading across markets are significantly correlated. More importantly, market linkages estimated using the GMM approach appear stronger than those indicated by the conventional proxies for volatility. In particular, crude oil has the strongest linkage to other energy and financial markets. This is consistent with its great depth and liquidity to respond to and process information more quickly and completely. The significance of crude oil in the global economy also suggests that the strength of the volatility interaction between crude oil and financial markets is likely prompted via the spillover channel. Furthermore, considering the sharing of common information in energy markets and the relationship between crude oil and natural gas/clean energy as substitutes and complements, the information flow correlations across these markets appear to be strong. Taken together, the empirical analysis in this study provides support for the Fleming et al. (1998) trading model in the context of energy markets, which can help to better understand the information relationship between energy and financial markets.
The evidence of strong market linkages across these markets of interest also provides a wide range of important implications for asset allocation, portfolio diversification, risk management, and policy making. The cross-market linkages provide investors with opportunities to facilitate optimal portfolio allocation and risk management decisions. For example, at times of heightened volatility in the oil market, investors can increase their investment in clean energy, as reflected by the demand for cross-market hedging. Portfolio managers also want to have a better understanding of market integration to evaluate market risks and develop hedging strategies. For instance, a careful analysis of the spillover effects between the oil and stock markets can help improve the conditional volatility and covariance estimates that are used to compute the optimal weights and hedge ratios for oil/stock portfolio holdings.
From a financial stability perspective, it is essential for policymakers to understand how information shocks are propagated across markets to determine the depth and persistence of their impacts and design effective policy instruments. For example, for policymakers seeking to progressively reduce dependence on finite fossil fuels and carbon emissions, studying information and volatility linkages between the fossil fuel and clean energy markets can help to create more effective incentive mechanisms that can be used to foster the development of clean energy. Moreover, the volatile nature of fossil fuel and clean energy markets represent a potential source of systemic financial instability, as information shocks induce volatility transmission from energy markets to major financial markets. Hence, a good understanding of market interrelationships could aid policymakers in addressing financial stability issues while facilitating the implementation of climate policies. A further implication is that policymakers could encourage a more diversified range of improved energy supply options through new policies, providing different economies with the flexibility to respond to the change in market conditions and the arrival of new information.
Footnotes
Appendix 1
The state-preference theory has been fruitfully applied in various areas of financial economics, especially in the study of derivatives markets. The method used in this article to develop the volatility indexes for the fossil fuel and clean energy markets is derived from the Arrow (1964)-Debreu (1959) state-preference model, which can be expressed in the following form
where
This approach has been applied in prior studies to construct volatility indexes for various financial markets, which are proved to be an unbiased predictor of the future realized performance of the underlying returns and exhibit better predictive power than the conventional volatility estimators (e.g. Liu and O’Neill, 2017; O’Neill et al., 2016; Pan, 2018). Compared with the complicated and opaque computation process of the VIX and other CBOE volatility indexes, the state-preference approach is also considered to be easier to implement, less data dependent and less susceptible to manipulation, while being grounded in theoretical foundations (Liu and O’Neill, 2017).
As the state-preference model can be applied to price any security in a complete market setting as a state price multiplied by its payoff (Ross, 1976), this study proposes to construct volatility indexes for the WTI Light Sweet Crude Oil futures, the Henry Hub Natural Gas futures, and the Guggenheim Solar ETF, the in the state-preference context as follows
where
Following Breeden and Litzenberger (1978) and Banz and Miller (1978), the state prices in equation (14) can be estimated using the delta security approach under the framework of Black and Scholes (1973) and its extension Merton (1973)
where
Within the state-preference framework, this model (i.e. equation (15)) does not require strike price inputs from each option. Instead, states in each market are defined using the daily levels of the underlying asset. A state of 100 indicates that the price level will be at 100 after 1 month. Specifically, states are created with the increment of the minimum tick size, in line with the market microstructure. As an illustrated example, states in the WTI Light Sweet Crude Oil market are computed with an increment of one cent, in line with the minimal possible tick size, ranging from 50% of the minimum and 150% of the maximum price levels over the period from 28 October 2005 to 10 March 2017. The minimum and maximum of the futures price level during the sample period are 26.21 and 145.29, respectively. The corresponding states therefore range from approximately 13 to 218 in increments of 0.01, with a total of 20,501 to be modeled in equation (14).
As each state price represents an interval from
Final transcript accepted 18 June 2019 by Kathleen Walsh (AE Finance).
Funding
The author(s) disclosed receipt of the following financial support for the research, authorship, and/or publication of this article: This study was supported by an Australian Government Research Training Program Scholarship. This study also benefits from Alumni Friends of The University of Queensland Golden Jubilee Prizes and UQ Business School RHD Funding.
1.
It is estimated that around US$53 trillion of investments in energy supply and energy efficiency are required to put the world on a path to a low-carbon future (IEA, 2014).
2.
3.
4.
Rearranging
5.
As
6.
By comparing the correlations between daily returns on crude oil and stocks,  find that crude oil has shown similar risk and return characteristics to stocks over the past decade. As a result, the prices of stocks and oil commodities could tend to move in the same direction during periods where risks are rising significantly (during the financial crisis) and then abating (during the subsequent recovery).
7.
The only exception is the correlation between natural gas and money, which fails to reject the spurious correlation hypothesis. Note further that the significance of the correlations between natural gas and other markets tends to be weaker after controlling for spurious effects, indicating that these correlations may be susceptible to serial correlation.
8.
As the mean log information flows are in units of log squared returns, they are negative numbers. By taking the square root of the inverses of the natural logarithm, the average volatility can be transformed back into units of return variance. Hence, the more negative the mean log information flow estimates are, the smaller the return variance is.
9.
Although forms of clean energy, such as wind power and solar energy, have experienced rapid growth in recent years, natural gas is still much more widely available around the world and remains a major source of electricity generation.