
Abstract
By exploring a natural experiment where the Chinese regulatory body introduced a dividend regulatory change in 2012, this article investigates the wealth effects of dividend regulation which increases firms’ dividends. I find that firms’ share price reacted positively (negatively) to regulatory events increasing (decreasing) investors’ expectation of dividends. The effects are more pronounced for firms with low dividends or domiciled in weak legal environments, robust to different research designs. The findings are consistent with the notion that low dividends in China are a manifestation of implicit contract failure. Dividend regulation provides remedies to low investor protection arising from weak legal environments.
JEL Classification:
1. Introduction
In this article, I investigate the wealth effects of dividend regulation which increases firms’ propensity to pay dividends in subsequent periods. Using a dividend regulatory change (Reg-2012) introduced by the China Securities Regulatory Commission (hereafter the CSRC) in 2012, which represents an exogenous shock to firms’ propensity to pay dividends, I examine two specific research questions: (1) whether events surrounding the introduction of Reg-2012 triggered positive or negative share price responses and (2) whether these market responses were associated with firm characteristics, including a firm’s propensity to pay dividends, the firm’s ownership structure, the nature of the controlling shareholder(s) (state vs non-state) and the legal environment where the firm is domiciled. Answers to these questions advance our understanding of the effects of regulation which directly enhances shareholders’ dividend rights and its wealth consequences.
I begin by identifying seven events related to the introduction of Reg-2012 and provide some initial descriptive evidence regarding the overall (average) share price effects at these event dates. Results show that, overall, the market reacted positively (negatively) to events leading to increases (decreases) in investors’ expectation of the regulation. When I partition the overall sample into low and high dividend payment subsamples, the results indicate that low dividend firms reacted positively if events increased firms’ propensity to pay dividends. These findings are consistent with the contention that insiders did not deliver sufficient dividends in the Chinese capital market prior to Reg-2012, and shareholders suffered from such situations.
Prior research suggests that dividends result from the implicit contract between shareholders and insiders.1,2 The implicit contract manifests in the following simultaneous game: shareholders anticipate insiders’ opportunistic behaviour and discount the share prices accordingly; meanwhile, to reduce the discount to share prices, insiders have motives to constrain their opportunistic behaviour (e.g. via paying dividends). Faccio et al. (2001) find that in firms with visibly high expropriation risk, minority shareholders can rely on the implicit contract to extract dividends. Consistent with this evidence, De Cesari (2012) and Price et al. (2011) document that the implicit contract also leads to high dividends in firms with severe agency problems in Italy and Mexico. However, the implicit contract may not be efficient in realising shareholders’ dividend rights (contract failure). For example, Faccio et al. (2001) find that minority shareholders are not alert to invisible expropriation motives, thus only requiring low dividends. The above descriptive evidence suggests that the implicit contract failure in China might be pervasive so that regulatory intervention might be needed.
Subsequently, I conduct cross-sectional analyses along three dimensions, associated with the presence of contract failure, to provide further evidence. First, insiders are pervasive in emerging economies and they have the capacity to camouflage their expropriation motives (Faccio et al., 2001; Gopalan and Jayaraman, 2012; Leuz et al., 2003). 3 The camouflage by insiders may decrease outside shareholders’ assessment of the potential expropriation risk. Consequently, insiders pay lower dividends than they would have paid had the expropriation risk been assessed properly (Faccio et al., 2001). Second, in many cases, controlling shareholders are the government itself (Faccio et al., 2001; La Porta et al., 1999). These state-owned enterprises (SOEs) pursue some social objectives, such as employment, rather than economic profits (Lin and Tan, 1999), and so the implicit contract only plays a limited role. Third, even if outside shareholders are able to perceive the underlying expropriation motives and price-protect their interests (insiders are sensitive to stock prices), insiders can ex ante (implicitly) commit to a certain dividend level without fulfilling their pre-commitments ex post. These ex post decisions are hard to challenge even if minorities seek help from courts, especially in countries with only weak legal systems (La Porta et al., 2000a; Shleifer, 2010).
A few empirical results emerge from the data. First, after controlling for a set of firm fundamentals, there is a negative association between firm dividend levels and market reactions to regulatory events. This finding suggests that low dividends in China are likely a manifestation of implicit contract failure. Second, I find evidence, robust to various research designs, that the introduction of Reg-2012 resulted in a greater, more positive price response for firms located in weak legal environments. This result is consistent with the notion that regulation can provide remedies to weak legal systems in terms of protecting investors’ interests (La Porta et al., 2000a; Shleifer, 2010). Third, I do not observe any statistically significant association between abnormal market reactions and insiders’ ownership or the nature of the ultimate controllers. Finally, benchmarked against firms headquartered in China but listed in Hong Kong, firms listed in Shanghai and Shenzhen subject to Reg-2012 substantially increased their dividends after the regulatory intervention. Collectively, my findings are consistent with the conjecture that implicit contract failure occurs, at least in certain Chinese listed firms, and regulatory changes that increase dividends counter this failure and enhance the wealth of shareholders. However, these results cannot be interpreted as evidence for more extensive dividend regulatory reforms because alternative market mechanisms may exist to address implicit contract failure more efficiently (Coase, 1960).
My research adds to the literature in several ways. First, this article extends the line of study investigating the wealth effects of dividend regulation in China (Huang et al., 2011; Li et al., 2010). Both studies focus on dividend regulatory changes applicable to firms intending to conduct equity refinancing in the open market (see Figure 1). My study differs from previous research in two fundamental ways. First, the regulatory change studied in this article is applicable to all listed firms. Second, I identify a set of events surrounding the introduction of Reg-2012, in contrast to prior studies which only focus on the event when the regulatory body officially enacted a policy change. The multiple event approach allows switches in signs of share price reactions to be observed across events. 4 Consistent switches largely exclude the possibility that observed market reactions were driven by other contemporaneous economic news and form a better identification strategy (Armstrong et al., 2010; Larcker et al., 2011; Li et al., 2008; Zhang, 2007).

The evolution of dividend regulation in the Chinese capital market.
Second, my study advances the understanding of the extent to which (outside) shareholders are able to realise their dividend rights via implicit contracts (De Cesari, 2012; Faccio et al., 2001; Knyazeva, 2008; Kose et al., 2011). The results imply that low dividend payment is a manifestation of implicit contract failure in China. The efficacy of implicit contracts is jeopardised by weak legal environments where firms are domiciled.
Third, my study may have policy implications for regulatory bodies. My findings yield useful inputs for future policy revisions by the CSRC. The Chinese capital market is representative of many other emerging capital markets in terms of the institutional features leading to potential implicit contract failure. That is, the Chinese market is characterised not only by relatively high levels of concentration in ownership and the potential for state influence (Bradford et al., 2013) but also by relatively weak legal environments (Durnev and Kim, 2005). 5 As a result, the CSRC’s dividend regulation experience might have implications for their counterparts in other emerging economies.
The remainder of this study proceeds as follows. Section 2 describes the institutional background to the research, including how dividend regulation in China had evolved prior to the introduction of Reg-2012. Section 3 summarises the relevant literature and develops hypotheses. Research design and empirical results are documented in Sections 4 and 5, respectively. Section 6 presents some robustness checks and Section 7 concludes the study.
2. Institutional background
Dividend regulation has had a relatively long history in the Chinese capital market, summarised in Figure 1.
On 28 March 2001 (2001-regulation), the CSRC required underwriters to explain why a firm had not paid dividends in the previous 3 years if the firm applied for equity financing and the board of directors had not provided reasonable explanations. The CSRC stated the purpose of the 2001-regulation was ‘to protect the interests of investors and public communities’. 6
On 7 December 2004 (2004-regulation), the CSRC first tied dividends to refinancing and prevented firms from issuing additional shares or convertible bonds if no dividends had been paid in the previous 3 years. The objective of the 2004-regulation was ‘to discipline controlling shareholders and protect minority shareholders’. 7 Some firms paid only tiny dividends to meet this requirement. 8
On 6 May 2006 (2006-regulation), the CSRC stipulated a minimum dividend level for firms with refinancing applications. The accumulated dividends, either cash or stock, cannot be less than 20% of the average total realised net profits over the 3 years prior to applications. The 2006-regulation was intended to ‘protect the interests of both investors and public communities’. 9
On 9 October 2008 (2008-regulation), the CSRC increased the threshold from 20% to 30% and precluded the use of stock dividends for refinancing purposes. The stated objective of the 2008-regulation was ‘to guide and regulate dividend policies of listed firms’. 10
As illustrated by the above changes, prior to Reg-2012, dividend regulation was only related to firms with additional financing needs. In 2012, the CSRC expanded its regulation to all firms. In justifying Reg-2012, the CSRC stated its purpose was ‘to enhance the transparency of listed firms’ dividend policies and facilitate investors’ expectation of future returns’. 11 To achieve the stated purpose, the CSRC required firms to pay dividends consistently to outside shareholders. Therefore, the regulation was expected to affect firms more if they did not pay dividends or paid occasional dividends prior to the introduction of Reg-2012. These affected firms might increase their dividends or frequency of paying dividends in future periods.
3. Literature review and hypothesis development
In this section, I hypothesise the relation between market returns to events surrounding the introduction of Reg-2012 and four firm characteristics: low versus high dividend payers, cash flow rights of controlling shareholders, state versus non-state-controlled enterprises and legal environments in which firms are domiciled.
3.1. Market reactions of low versus high dividend firms
Reg-2012 was expected to increase firms’ propensity to pay dividends (Rabinovitch, 2012). First, according to Reg-2012, firms have to make explicit dividend commitments and comply with their commitments in paying dividends. As a result, these revealed commitments facilitate both investors’ and the CSRC’s monitoring of firms’ subsequent dividend payments. Second, the Shanghai Security Exchange (hereafter SSE) encouraged all SSE firms to meet or beat the 30% payout ratio. Wei and Xiao (2009), Wang and Zhang (2012) and He and Li (2018) document evidence that Chinese firms have motives to cater to the regulatory requirement in distributing dividends. Therefore, either the dividend commitments or the target ratio proposed by the SSE may increase firms’ propensity to pay dividends.
A considerable body of research documents the determinants of dividends paid by firms. The first strand of literature suggests that dividends are primarily determined by firms’ economic fundamentals, such as size, profitability and growth. Fama and French (2001), Denis and Osobov (2008) and Fatemi and Bildik (2012) find that firms’ propensity to pay dividends is positively associated with firm size and profitability and negatively associated with firms’ investment opportunities. The above associations are also exhibited by Chinese listed firms (Huang et al., 2011). According to the fundamental explanation of dividends, if affected firms had to increase their original dividends and deviated from their economic fundamentals due to the introduction of Reg-2012, their share prices likely decreased.
Another line of literature suggests that agency issues explain the variation in firm dividends beyond economic fundamentals. For example, Faccio et al. (2001), Price et al. (2011), De Cesari (2012) and Kose et al. (2011) show that shareholders are able to extract dividends via implicit contracts. However, the implicit contract may fail to result in proper dividends, which leads to the conjecture that Reg-2012 might benefit firms’ outside shareholders. Bradford et al. (2013) indicate that stronger expropriation motives of controlling shareholders are associated with lower dividends in China, consistent with the findings that poorly protected outside shareholders are not able to extract ‘sufficient’ dividends from firms with high agency costs via implicit contracts (La Porta et al., 2000b). Thus, low dividends might be a manifestation of implicit contract failure. As a consequence, Reg-2012 might trigger positive share price reactions if it increased dividends to a preferred level, provided that the relevant costs were not as high as the incremental benefits.
Based on the above analysis, if firms’ dividends were mainly determined by firm economic fundamentals before Reg-2012, the regulation might trigger negative share price changes. In contrast, if firms were subject to implicit contract failure before Reg-2012, the regulation should generate positive share price changes. I put forward the first hypothesis in the following form:
H1. The cumulative abnormal returns of low dividend firms to events surrounding the introduction of Reg-2012 were higher than those of high dividend firms if implicit contracts fail to deliver dividends.
3.2. The association between market reactions and firm ownership structure
Lower cash flow rights of insiders imply that they may have higher expropriation motives (Jensen and Meckling, 1976). Insiders with high expropriation motives might be likely to disguise their misbehaviour. Leuz et al. (2003) argue that insiders in emerging economies camouflage their expropriation by managing earnings. Gopalan and Jayaraman (2012) empirically find that insiders with stronger expropriation motives exercise more extensive earnings management.
The extent of camouflage of misconduct by insiders has important implications for outside shareholders’ use of implicit contracts in extracting dividends. If insiders are less likely to engage in camouflage, outside shareholders are able to fully anticipate the potential agency problems and rely on implicit contracts to extract sufficient dividends. In contrast, if insiders are more likely to engage in camouflage, outside shareholders may not fully assess the potential agency issues and these contracts are ineffective in extracting enough dividends (Faccio et al., 2001).
Based on the above analysis, events increasing firms’ propensity to pay dividends surrounding the introduction of Reg-2012 might trigger more positive share price reactions of firms where insiders have lower cash flow rights (stronger expropriation motives). I propose the following hypothesis:
H2. The cumulative abnormal returns to events increasing firms’ propensity to pay dividends were negatively related to controlling shareholders’ cash flow rights.
3.3. Market reactions of state versus non-state enterprises
Managers of SOEs might be distracted from maximising shareholders’ wealth. They have to implement government policies and fulfil social objectives, such as reducing the unemployment rate. As a result, SOEs conduct some redundant or inefficient projects. For example, Lin and Tan (1999) show that economically non-viable industries are maintained in China for social objectives. Thus, SOEs exhibit lower investment efficiency compared to their non-SOE peers in China (Chen et al., 2011).
These social objectives pursued by SOEs are likely to lead to retention of funds and overinvestment (Wei and Liu, 2007). Anecdotal evidence also illustrates that SOEs in China have a lower propensity to pay dividends than non-SOEs. 12 Regarding the overinvestment of SOEs, the price-protection behaviour of outside shareholders (implicit contracts) may not influence SOEs’ dividend policies because managers of SOEs focus their attention on the political needs of government rather than shareholders’ interests. That is, implicit contract failure likely occurs in SOEs.
Given SOEs’ current lower propensity to pay dividends, Reg-2012 has the potential to improve SOEs’ dividends (from the perspective of outside shareholders). Lang and Litzenberger (1989) show that dividend increases of overinvestment firms trigger a positive market response. Thus, share prices of SOEs would react positively to events increasing firms’ dividends surrounding the introduction of Reg-2012.
However, prior literature suggests that state ownership compromises the enforcement of regulation in China. Berkman et al. (2010) find that state-owned firms did not experience positive market reactions to a policy change intended to constrain related-party transactions in China, compared to non-state-owned firms. They interpret this as evidence that the Chinese government does not enforce regulation on itself. If this selective enforcement is applicable in the Reg-2012 setting, investors might expect that Reg-2012 would have only a limited impact on SOEs’ dividends, and the share prices of these firms would not react. Thus, I propose the following hypotheses:
H3. If there was no selective enforcement of Reg-2012, the cumulative abnormal returns of state-owned firms to events surrounding the introduction of Reg-2012 would be higher than those of non-state-owned firms.
3.4. The association between market reactions and legal environments
There are at least two reasons leading to the conjecture that the implicit contract might not lead to sufficient dividends in firms located in a weak legal environment. First, firms located in such an environment are likely to report lower quality information in China (Firth et al., 2011). Low-quality information revises downwards outside shareholders’ estimates of insiders’ expropriation risks, therefore leading to lower dividends. Second, even if outside shareholders could ‘see through’ the low-quality information and fully expect insiders’ expropriation, and insiders are able to reduce the potential effects of price protection by ex ante implicit dividend commitments (Kose et al., 2011), ex post insiders might not meet their dividend promises because of their dominant voting power. In this case, outside shareholders could seek help from courts to protect their interests. However, politically connected insiders are able to influence court decisions in their favour, especially in regions with weak legal systems (Leuz and Wysocki, 2008; Shleifer, 2010). Therefore, the implicit contract in firms located in weak legal environments possibly fails in extracting ‘sufficient’ dividends.
Reg-2012 potentially provides an alternative regulatory solution to this issue (Shleifer, 2010). For example, outside shareholders are able to rely on the regulation to require more dividends from firms located in weak legal environments. Regarding the potential distortion of courts’ judgement by insiders, Reg-2012 could restrict courts’ discretion (Shleifer, 2010) if the regulation is well enforced. Remedies offered by Reg-2012 might mitigate the contract failure in firms located in weak legal environments. Thus, I propose the following hypotheses:
H4. The cumulative abnormal returns of firms domiciled in weak legal environments to events surrounding the introduction of Reg-2012 were higher than those of firms domiciled in strong legal environments if Reg-2012 were effectively enforced.
4. Research design
4.1. Events surrounding the introduction of Reg-2012
The key events are identified from four widely circulated financial newspapers in China: China Securities Journal, Shanghai Securities News, Securities Daily and Securities Timely. The time period related to this study is 1 November 2011–8 January 2013. 13
To identify key event dates, I read the front page headlines of each newspaper for every day in the period of interest and selected those titles which included the term ‘dividend’. This produced a list of 37 events. To ensure that the articles were about Reg-2012, I read the contents of each news article and excluded those unrelated to the introduction of Reg-2012. This procedure reduced the number of events to seven and revealed the corresponding event dates. Table 1 summarises the event dates, main content of each news article, the likely impact on investors’ expectations of dividend changes and the predicted signs of market responses. The details of each event are presented in Appendix 2.
Events surrounding the introduction of Reg-2012. EVENT1–EVENT4 lead up to Reg-2012 and EVENT5–EVENT7 are related to the enforcement of Reg-2012. ‘Increase’ and ‘decrease’ refer to impacts of each event on firms’ propensity to pay dividends. The predicted sign is the anticipated wealth effects.

CSRC: China Securities Regulatory Commission; SSE: Shanghai Security Exchange.
4.1.1. The overall market reaction
Before relating market reactions to firm characteristics (H1–H4), I examine whether the overall market abnormal return to each of the above seven events was positive or negative. In addition, to increase the power of the test, the overall market abnormal return across all events is assessed (Armstrong et al., 2010). The design in this subsection provides some descriptive evidence on the overall effects of Reg-2012.
I estimate the abnormal return for each individual firm to each event according to the following multivariate regression model (MVRM), which is widely used in regulatory event studies, such as Binder (1985) and Li et al. (2008), among others

where Rit is firm i’s daily market return on day t, MKT_RTNt is the value-weighted index return on day t, EVENTj (j = 1–7) is a dummy variable equal to 1/l (l is the length of the event window, which equals 3 in this article) during the jth event, and εit is the disturbance item for firm i on day t. 14 εit is serially independent within each firm but correlated across firms because all firms have the same estimate period.
Because all firms have the same right-hand side (RHS) variables in equation (1), ordinary least squares (OLS) will lead to unbiased estimators for each firm (Binder, 1985; Zellner, 1962). However, the purpose is to examine the overall market return (across firms) at each event which cannot be conducted by separately running OLS regressions of equation (1) for each firm. In contrast, seemingly unrelated regressions (SUR) can be employed as a convenient approach for the joint coefficient test. A Wald test, specified in Zellner (1962), yields proper statistics which take into account the cross-correlation among γij, but large samples will hinder the estimate of SUR. Binder (1985) suggests that regressing an equally weighted portfolio of sample firms on the RHS variables in equation (1) will produce equivalent statistics to the Wald test. Thus, I run equation (2) to gauge the overall effect of Reg-2012
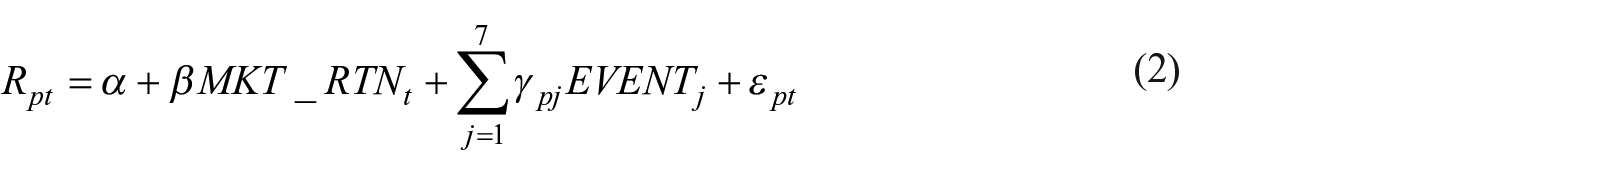
where Rpt is the equally weighted portfolio of affected firms on day t, and all RHS variables are defined in equation (1). The magnitude of γpj is equal to that of
If increasing firms’ propensity to pay dividends generated net benefits, γp1, γp2, γp3, γp4, γp5, γp6 and γp7 would be positive, negative, negative, positive, positive, positive and positive, respectively. The cumulative γps across events, after adjusting for different predicted signs, would also be positive. 15 In contrast, if increasing firms’ propensity to pay dividends generated net costs, the signs of γp1 to γp7 would be opposite to the predictions above and the (adjusted) aggregate γps across events would be negative. The predicted signs are summarised in Table 1.
In addition, equation (2) is estimated for two portfolios: high versus low dividend payers. The differences between individual γpjs for the two groups are used to detect the varying effects of Reg-2012. I expect that the magnitude of market response of low dividend payers is higher than that of high dividend payers if a regulatory event increasing firms’ propensity to pay dividends benefitted the market. The market reaction of low dividend payers pooled across events should be higher than that of high dividend payers. 16
4.1.2. Cross-sectional market responses
To test H1–H4, a two-stage approach could be adopted. In the first stage, equation (1) is estimated to capture each firm i’s share price reactions (γij) to event j. In the second stage, γijs are regressed on firm characteristics in the following model

where γij is the cumulative abnormal returns estimated from equation (1). DIV, OWN, SOE and LEGAL relate to the underlying constructs in H1–H4, respectively, and are defined as follows. DIV equals the average dividend yield of a firm in the past 5 years before 2010. Dividend yield is dividends declared by firms deflated by market capitalisation. Higher DIV indicates that a firm has higher propensity to pay dividends. 17 OWN denotes cash flow rights of controlling shareholders, measured by the number of shares directly and indirectly held by controlling shareholders deflated by the total number of outstanding shares, with a higher value indicating lower expropriation motives (Jensen and Meckling, 1976). SOE equals 1 if the controlling shareholder of a firm is the government, otherwise 0 (Chen et al., 2009). This proxy is widely used in the relevant literature (Firth et al., 2011; Wang et al., 2008). LEGAL measures the development of the legal infrastructure in different geographic regions in China, denoted by the legal index of each province or city (Fan and Wang, 2009).
CONTROLS includes variables employed as controls in prior regulation-related studies (Berkman et al., 2010; Larcker et al., 2011): (1) SIZE measured by the natural logarithm of market value as of the latest trading date prior to the first event; (2) AB_RET measured by the market-adjusted cumulative abnormal returns in the [−120, −5] window with the first event date as day 0; (3) BETA equals the coefficient on market returns in a market model estimated over [−120, −5] for each firm; (4) LEV measured by the book value of long-term debt divided by the book value of total assets as of the latest financial reports prior to the first event; (5) MB measured by firms’ market capitalisation as of the most recent trading date divided by the book value of total assets as of the latest financial reports, prior to the first event; (6) RE_AT equals the retained earnings divided by total assets; and (7) ROA is net profits divided by total assets. Industry fixed effects are controlled in equation (3). The definitions and measurement of variables are summarised in Appendix 1.
In the above two-stage approach, all firms are subject to the same event dates, leading to violations of independently and identically distributed assumption of ωij. The heteroscedasticity and cross-correlation in the disturbance items do not affect the estimates of coefficients but bias the standard errors (Clinch and Magliolo, 1992; Sefcik and Thompson, 1986). Portfolio time-series regressions rather than cross-sectional OLS regressions can be used to estimate equation (3) to mitigate this effect (Fernando et al., 2012; Li et al., 2008; Sefcik and Thompson, 1986).
I follow two steps to estimate portfolio time-series regressions. First, I construct M portfolios. M is the number of parameters to be estimated in equation (3). For example, M equals 33 (1 intercept, 4 coefficients on variables of interest, 7 coefficients on control variables and 21 coefficients of industries). Specifically, let X denote the matrix collecting sample observations (N) with each observation measured along M dimensions, then (XTX)−1XT is a M×N matrix. The jth row represents the weights (N elements) used to construct portfolios arising from the jth independent variable over the estimation window (Sefcik and Thompson, 1986). Second, the weighted returns of the time-series portfolio are put on the left-hand side of equation (2) and OLS is used to estimate γpjs. Each of the seven γpjs corresponds to the coefficient of the jth variable in equation (3) for each event.
4.2. Sample construction
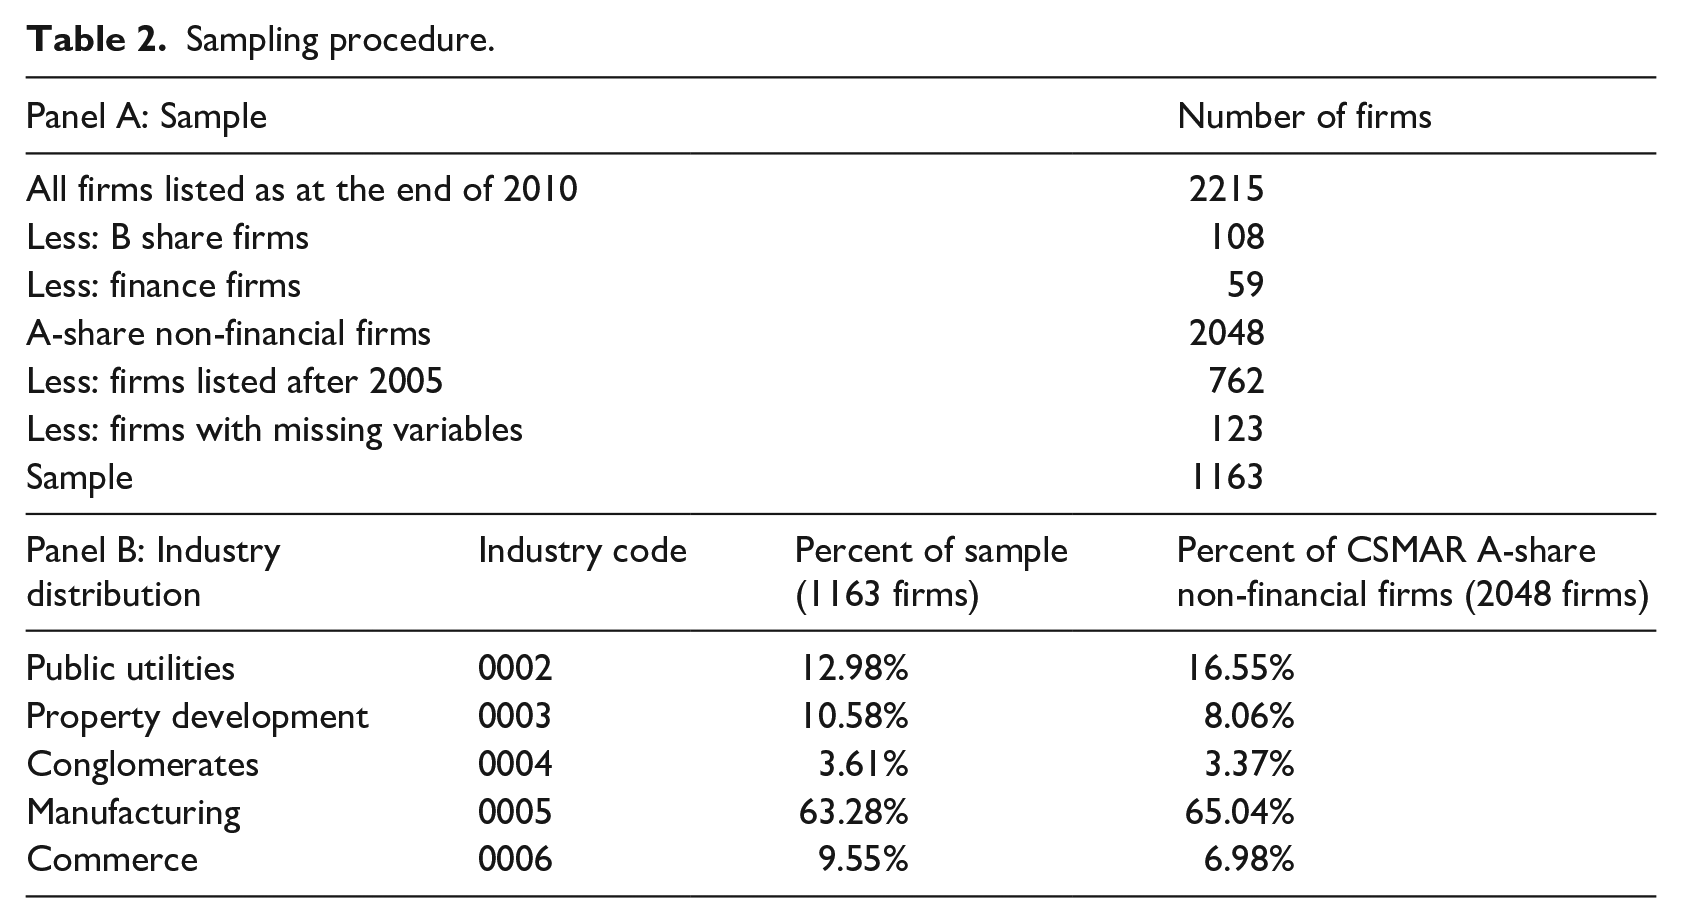
Because the estimation period spans from 1 October 2011 to 31 January 2013, all the SSE and Shenzhen Securities Exchange (hereafter SZSE) listed firms at the end of 2010 constitute the population (2215 firms), from which sample firms are selected following several criteria: (1) I exclude firms who issue B shares, that is, common stocks of these firms are denominated in US or HK dollars (B shares); (2) I exclude financial firms; (3) I delete firms listed before 2005 to calculate average dividend payment over the previous 5 years; and (4) I exclude firms with missing values in firm characteristic variables. This sampling strategy results in 1163 firms. Panel B of Table 2 illustrates the sampling procedure and compares the composition of the sample to that of the population, which indicates that the sample is representative of all listed firms.
Sampling procedure.
All market returns (both individual firms and the market index) and accounting information are retrieved from the China Stock Market and Accounting Research (CSMAR) database. For any firm with missing market returns on certain dates, I find ‘pseudo’ market returns for these missing values according to the following procedures. 18 First, in the same industry, I obtain one matching firm whose size is closest to the size of the firm with missing market returns and replace these missing values with the market returns of the matching firm on the same dates. Size should be measured by the total market value on the date closest to the date with missing market returns. If the matching procedure based on market value cannot yield ‘pseudo’ market returns, firms are matched based on the total assets disclosed in the most recent financial reports. Second, all remaining missing market returns after the above matching procedures are designated as zero.
Table 3 reports descriptive statistics for all variables used in the multivariate analyses. All continuous variables except RET are winsorized at the top and bottom 1% of the sample. 19 Mean (median) CAR is 1.1% (0.97%), implying that the regulation is perceived to benefit the market. Because there are seven event market returns for each firm, to calculate this firm-level CAR, I multiply the market reactions arising from EVENT2 and EVENT3 by −1 and aggregate with other market reactions. The mean (median) dividend yield of Chinese listed firms is 0.95% (0.55%), similar to the statistics in Bradford et al. (2013). These results indicate that, on average, Chinese firms pay much lower dividends than their peers in the United States or the United Kingdom. 20 The low propensity to pay dividends was used by the CSRC to justify the promulgation of Reg-2012. On average, 30.4% of total outstanding shares are owned by controlling shareholders and almost 65% of firms are controlled by the government, consistent with the conclusion in prior literature that ownership concentration and government stakes in East Asian economies are considerably high (Faccio et al., 2001). The mean legal index is 6.25 with a maximum value of 10.00 (Shanghai). Mean (median) AB_RET over the [−120, −5] window is −5.29% (−7.37%), portraying a depressed market in China before the initiation of Reg-2012. 21 The descriptive statistics of all other control variables are consistent with prior studies (He and Li, 2018).
Summary statistics. This table presents the summary statistics of all variables used in the multivariate analyses. For each firm, CAR aggregates all cumulative abnormal returns surrounding each regulatory event. For regulatory events which decreased investors’ expectation of dividend increases, I reverse the signs of the cumulative abnormal returns. RET is daily stock return of each firm over the estimate period 1 October 2011–31 January 2013, winsorized at 0.1%. In the estimate period, there are 323 trading days in total, thus the number of RET is 1163 × 323 = 375,649. All other variables are defined in Appendix 1 and continuous variables are winsorized at 1%. CAR, AB_RET and RET are all measured in decimal point.
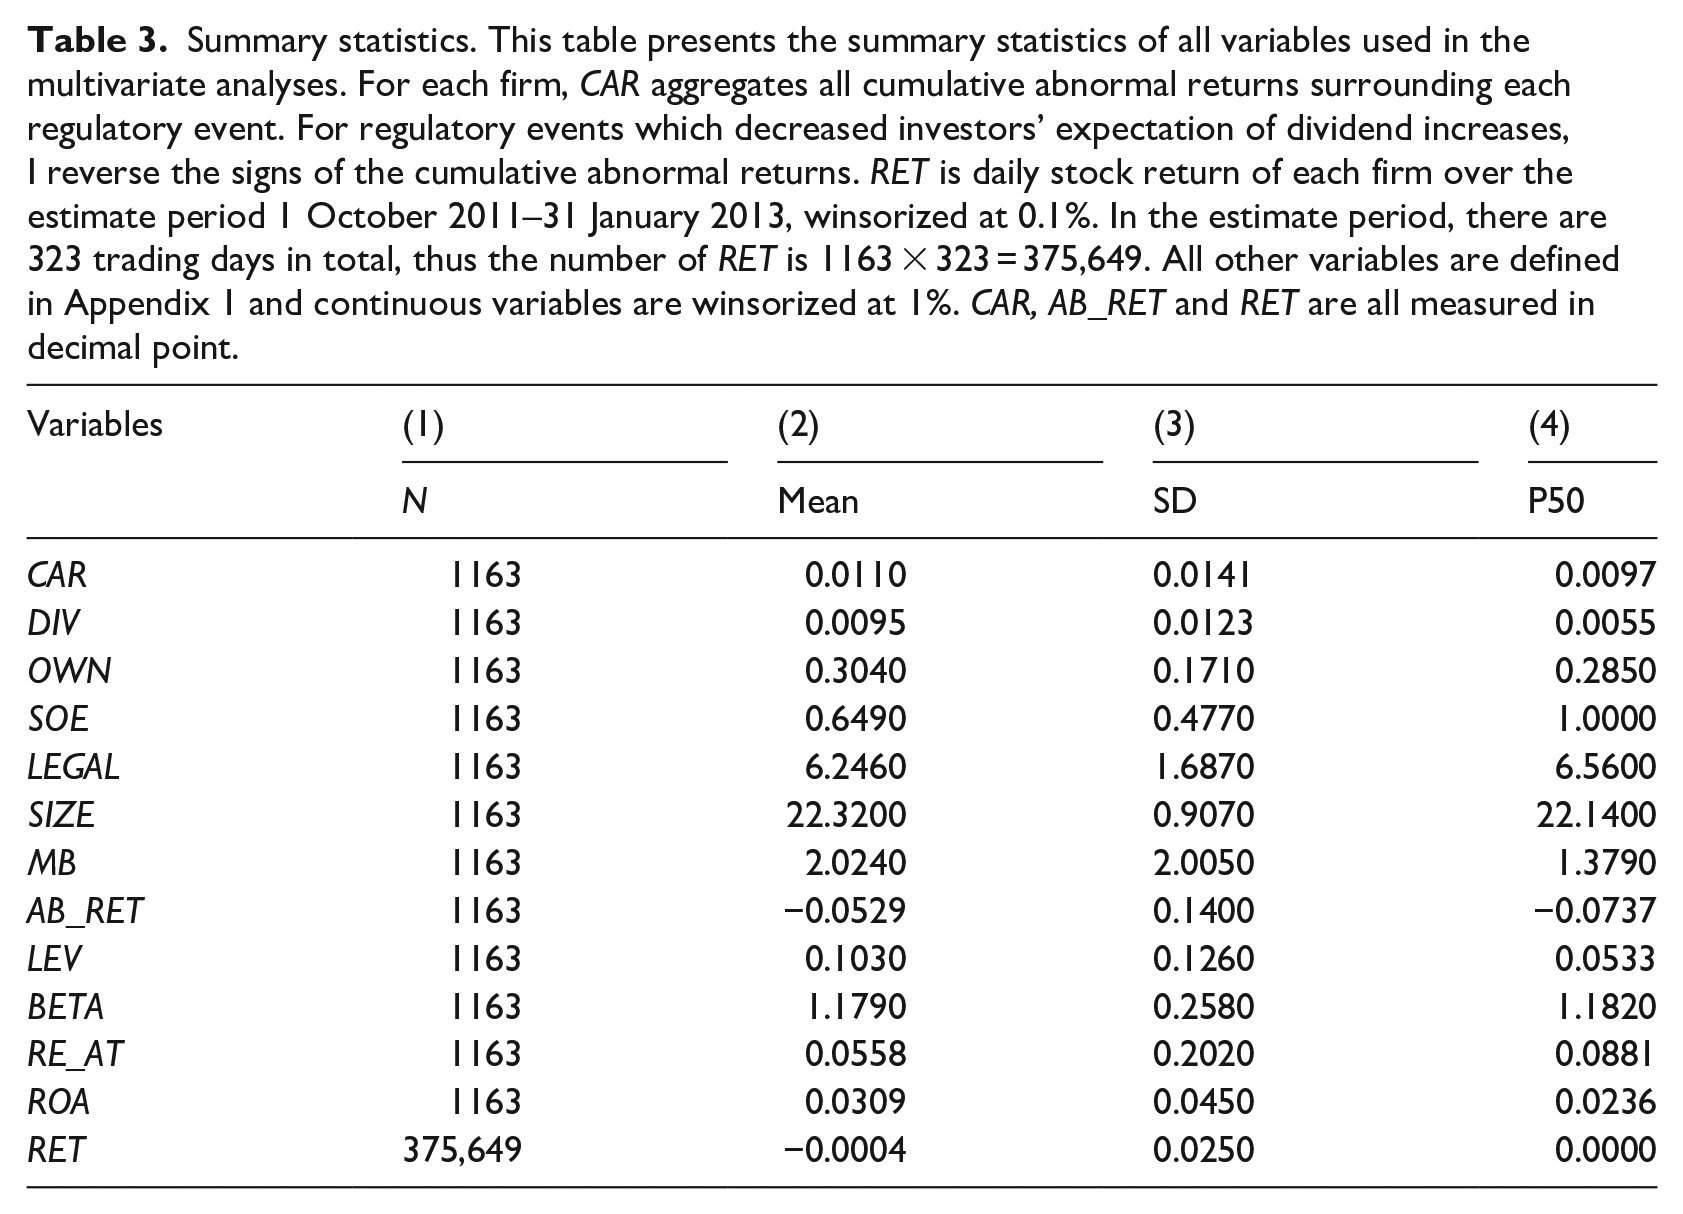
Table 4 tabulates the pairwise correlations between all variables used in multivariate analyses. All cells below (above) the main diagonal show Pearson (Spearman) correlations. There are strong correlations between CAR and each of the variables of interest. Overall, there is some preliminary evidence supportive of H1, H2 and H4. Regarding the prediction of selective enforcement of regulation over non-SOEs, there is no such evidence. However, all these correlations are simply univariate results, which might be biased by the existence of correlated omitted variables. 22 In the next section, I proceed to multivariate analyses.
Correlation table. This table presents the pairwise correlation between all variables used in the multivariate regression analysis, with lower (upper) diagonal indicating the Pearson (Spearman) correlations. Correlations in bold are statistically significant at least at the 1% level.

5. Empirical results
5.1. The overall market reaction
Table 5 presents the overall market returns to regulatory events surrounding the introduction of Reg-2012. Model (1) averages abnormal returns across all sample firms. Across all events, the coefficient signs on EVENT1–EVENT7 switch in a pattern consistent with the prediction based on the imperfect implicit contract explanation (Table 1). 23 Given that events leading to regulation normally involve debates and uncertainties (Schipper and Thompson, 1983), each event can only slightly change investors’ expectations and as such only a few events can trigger significant market reactions. To increase the power of tests, prior studies normally aggregate market reactions across events (Armstrong et al., 2010; Larcker et al., 2011; Zhang, 2007). Among the events leading to significant market reaction, EVENT2, when the manager of the SZSE declared that the CSRC would not mandate dividends which decreased firms’ expected propensity to pay dividends, is associated with an abnormal return of −2.11% with a t-statistic of −2.71. 24 At EVENT7 when the SSE officially enacted its ‘30%’ payout requirement, share prices of firms increased by 1.82%, with a t-statistic of 2.34. The adjusted aggregate market response across all events (an abnormal return of 7.74% with an F-statistic of 14.07) corroborates the above finding that dividend regulation increasing firms’ dividends enhances shareholders’ wealth.
The overall market response to events surrounding the introduction of Reg-2012: Event window [−1, +1]

Rpt is the equally weighted market return of three portfolios on day t: full sample (1163 firms), low dividend payers (582 firms) and high dividend payers (581 firms). Models (1)–(3) present the results of estimating the regression for each of the three portfolios. Models (2) and (3) are estimated using seemingly unrelated regressions (Zellner, 1962). MKT_RTNt is the value-weighted index return on day t. EVENTj is equal to 1/3 in event window j, otherwise 0. The signs in the ‘Revised expectation’ column represent whether an event increased or decreased firms’ propensity to pay dividends. The signs of italicised coefficients are consistent with the prediction of contract failure. Joint coefficients are constructed by reversing the signs of coefficients when events decreased firms’ propensity to pay dividend (α2 and α3) and summarising all coefficients across events. The estimate period spans 1 October 2011–31 January 2013.
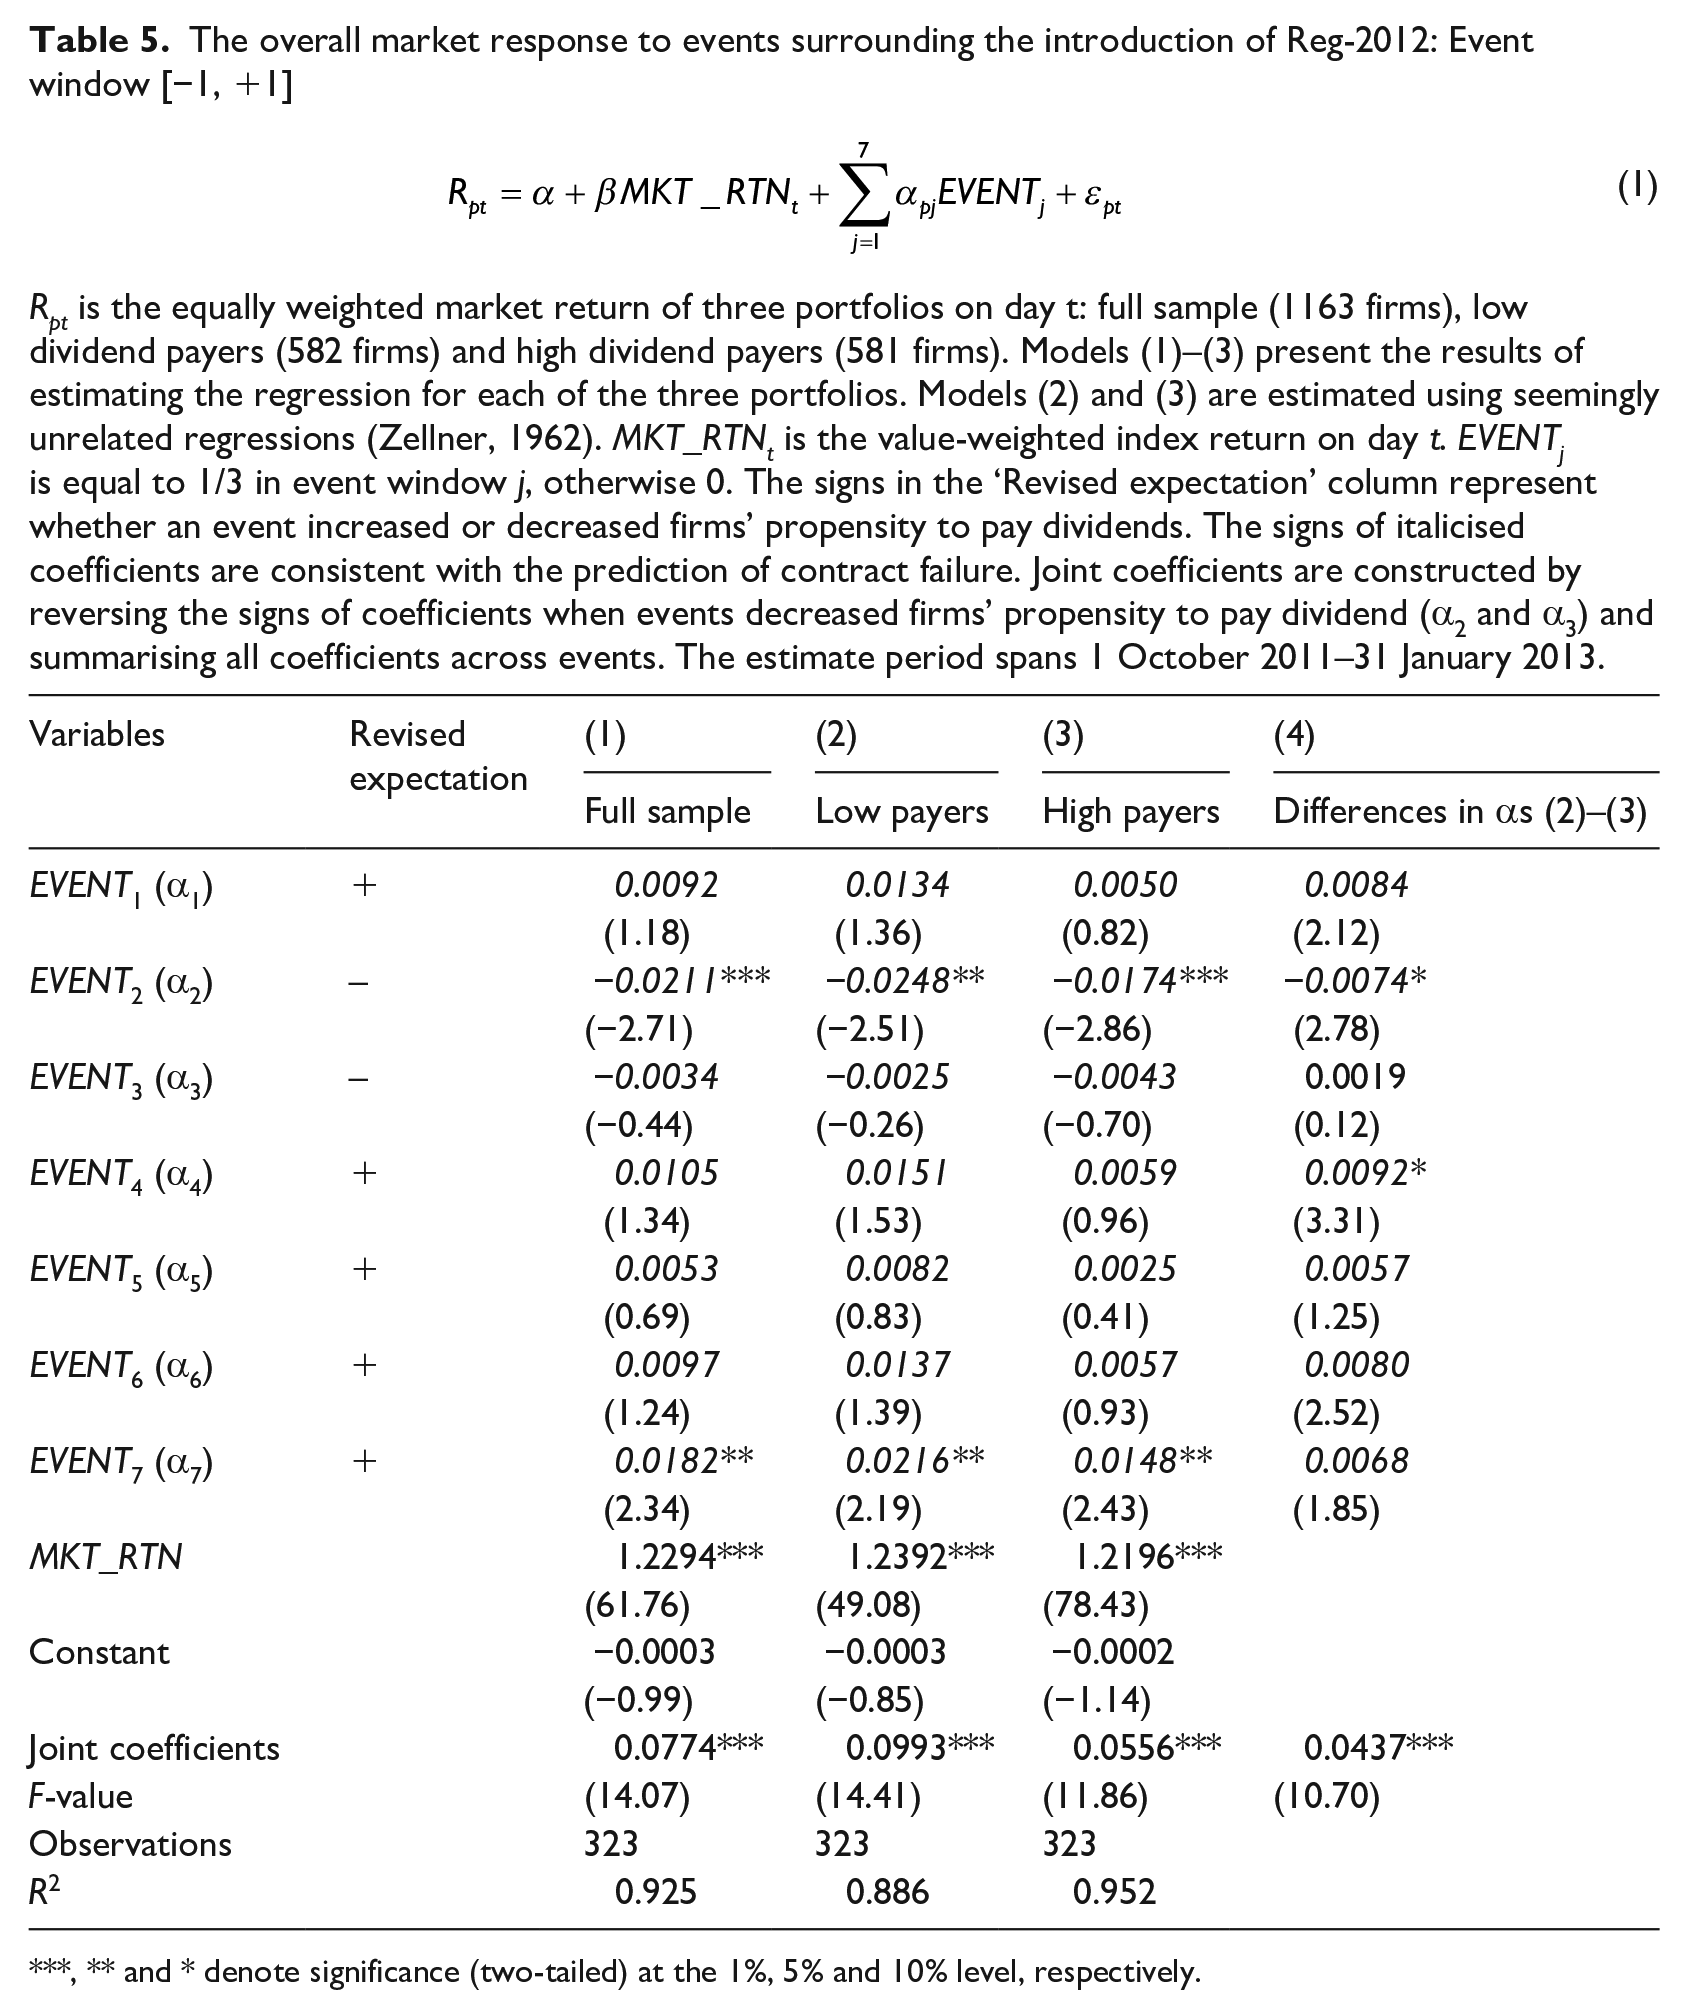
, ** and * denote significance (two-tailed) at the 1%, 5% and 10% level, respectively.
To exclude the possibility that the overall market response reflected time trends, I partition firms into low (dividend yield lower than industry median) and high dividend payers (dividend yield higher than industry median). Models (2) and (3) document the market responses of low and high dividend payers, respectively. For all events surrounding the introduction of Reg-2012 increasing (decreasing) firms’ propensity to pay dividends except EVENT3, low dividend payers responded more (less) favourably than high dividend payers. That is, compared to high dividend payers, low dividend payers’ share prices further increased by 4.36% with an F-statistic of 10.70.
The above empirical results are consistent with anecdotal evidence. For example, when the CSRC announced its intention to regulate firms’ dividends at EVENT1, investors’ comments on the website (http://finance.ifeng.com) indicated positive attitudes towards the CSRC’s initiatives. Therefore, I document some descriptive evidence supportive of the notion that regulation which increases firms’ propensity to pay dividends enhances shareholders’ wealth.
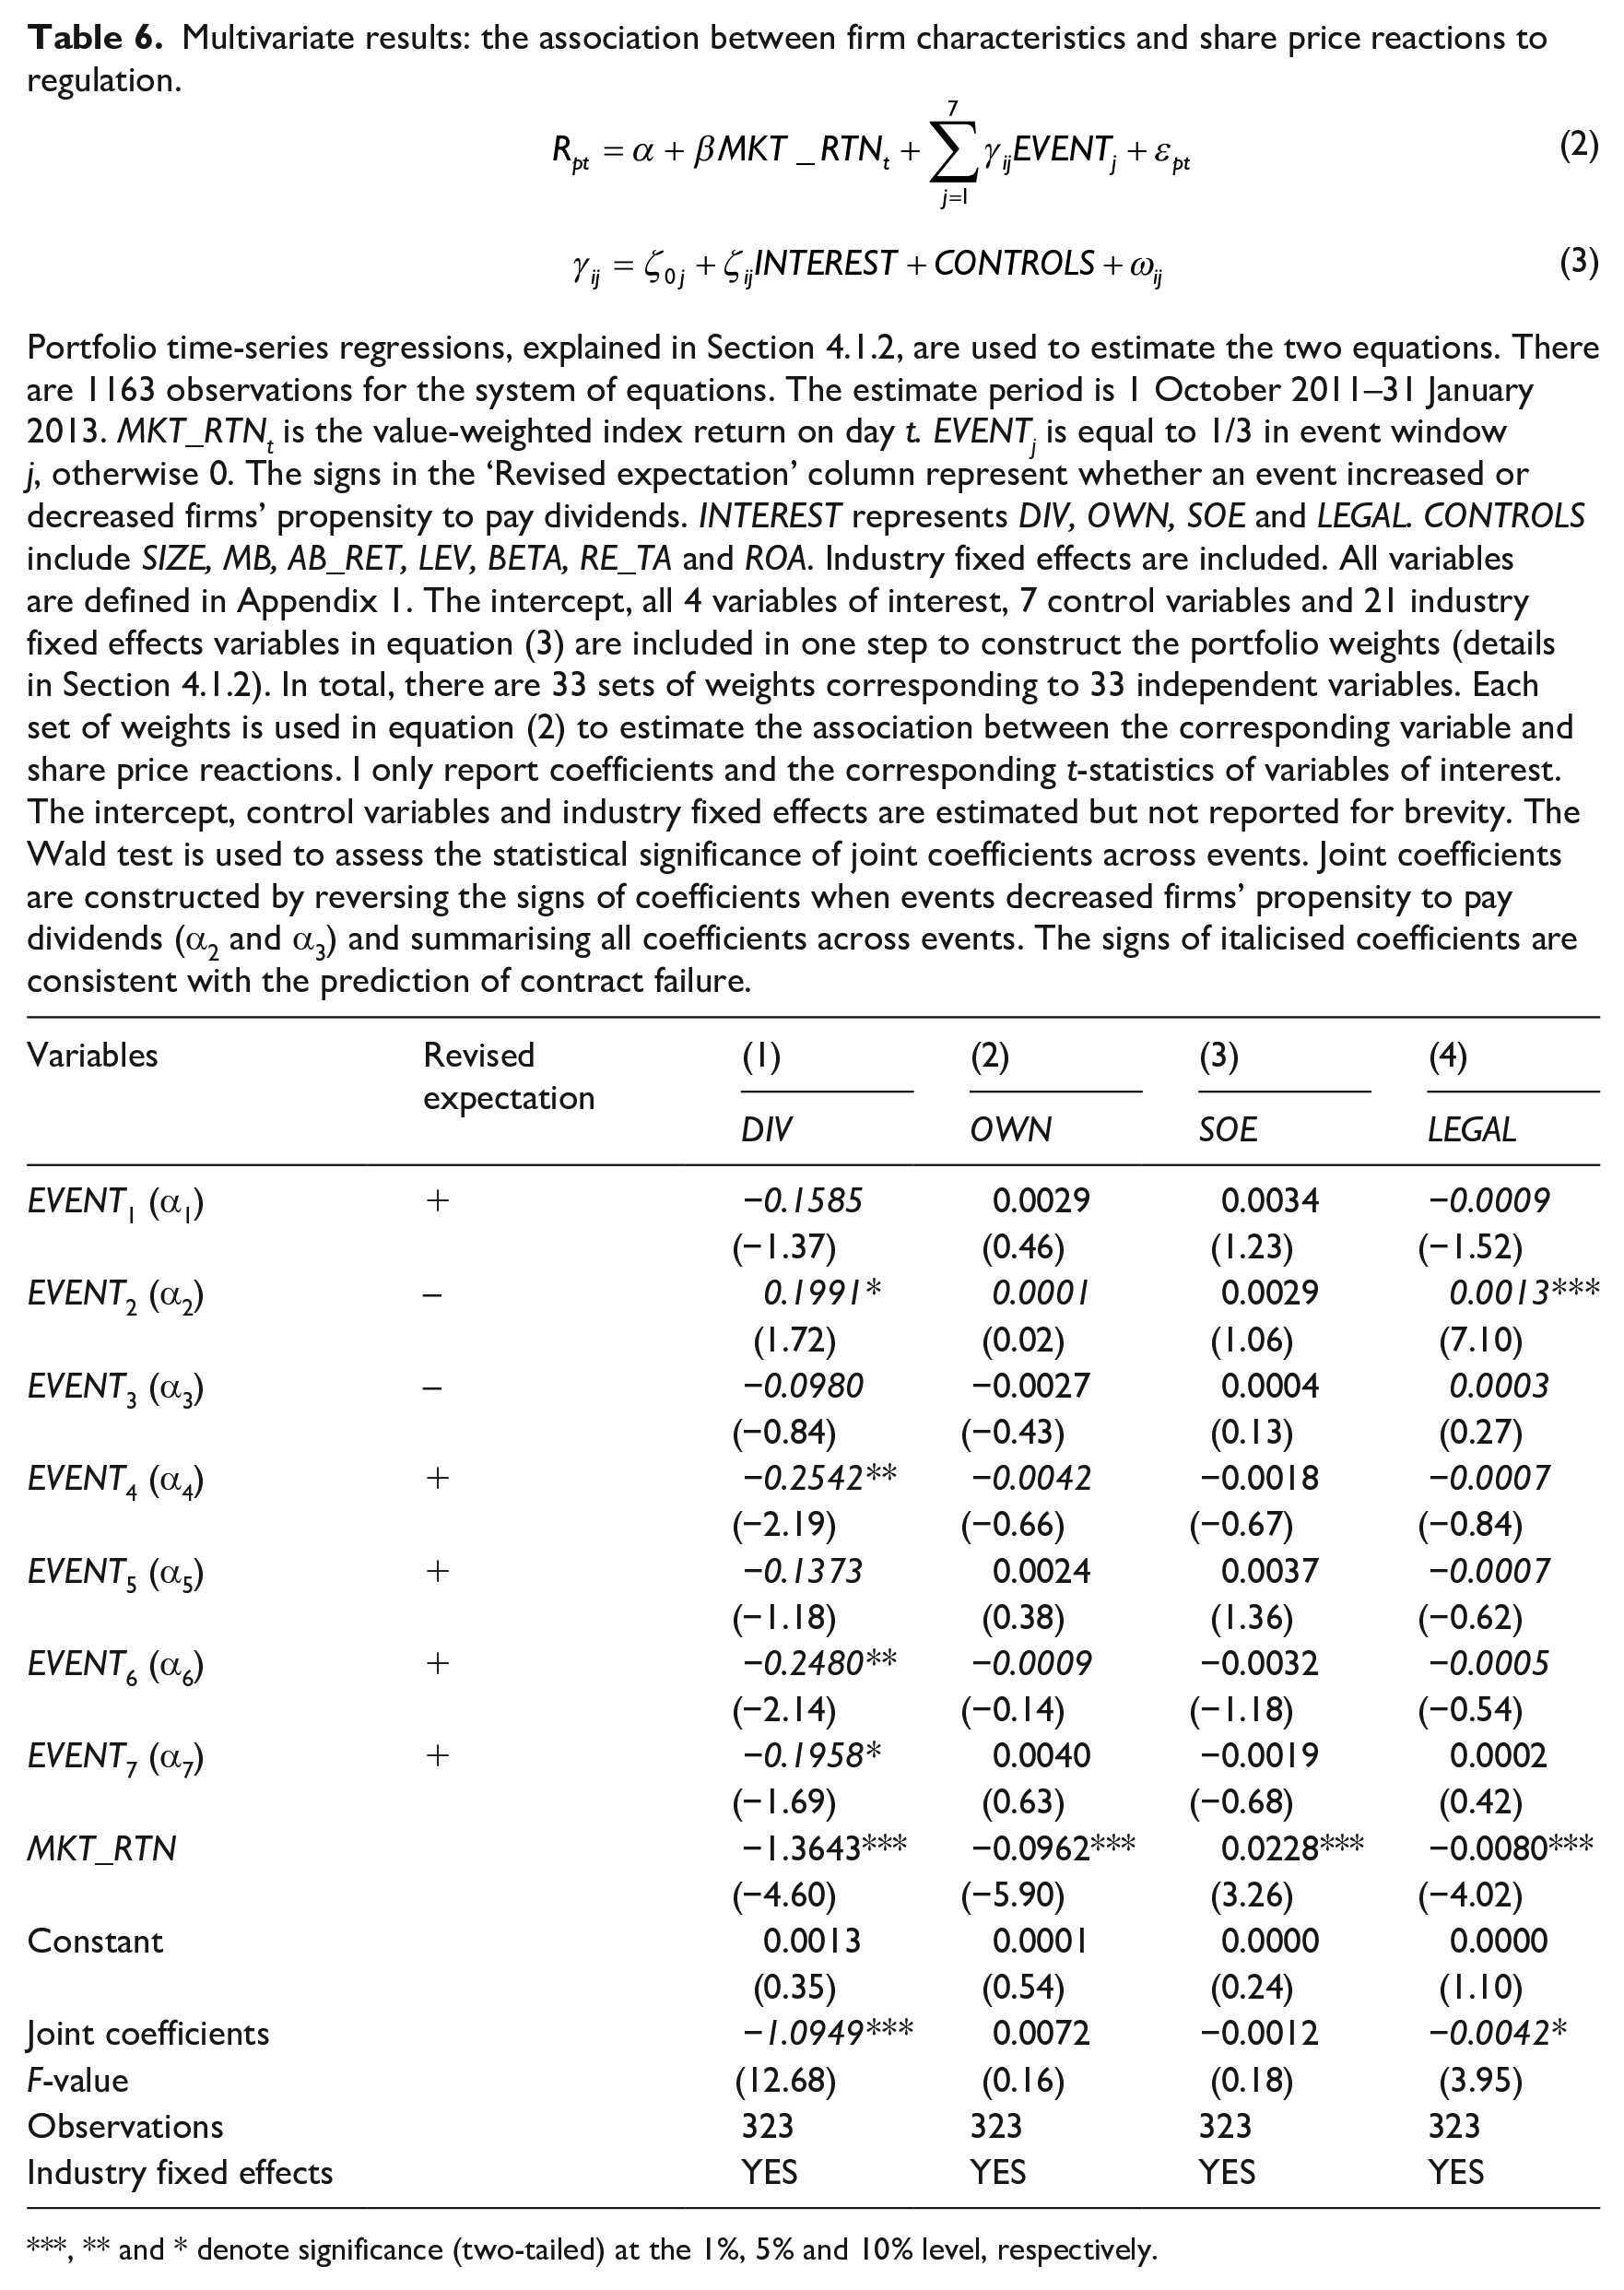
5.2. Cross-sectional market responses
Following the portfolio time-series regression designs in Section 4.1.2, Table 6 shows the multivariate results depicting abnormal returns to each event surrounding the introduction of Reg-2012 on firm characteristics. Of the seven events that changed firms’ propensity to pay dividends, the coefficients on DIV in six events are consistent with the prediction that increasing dividends benefitted low dividend payers more. Compared to univariate results, at EVENT2, high dividend payers experienced significantly lower share price returns (0.1991 with a t-statistic of 1.72) than low dividend payers when firms’ likelihood to pay dividends decreased. 25 At EVENT4, EVENT6 and EVENT7 where investors’ expectations of dividend increases increased, high dividend firms experience lower market returns. At EVENT2 and EVENT7, both the overall and cross-sectional tests show significant cross-sectional effects. 26 The aggregate coefficient on DIV across all events remains significantly negative after controlling for other firm characteristics. 27 Therefore, regulation expected to increase firms’ dividends enhances shareholders’ wealth in low dividend payers more, providing evidence supporting H1 that contract failure leads to low dividends in China.
Multivariate results: the association between firm characteristics and share price reactions to regulation.


Portfolio time-series regressions, explained in Section 4.1.2, are used to estimate the two equations. There are 1163 observations for the system of equations. The estimate period is 1 October 2011–31 January 2013. MKT_RTNt is the value-weighted index return on day t. EVENTj is equal to 1/3 in event window j, otherwise 0. The signs in the ‘Revised expectation’ column represent whether an event increased or decreased firms’ propensity to pay dividends. INTEREST represents DIV, OWN, SOE and LEGAL. CONTROLS include SIZE, MB, AB_RET, LEV, BETA, RE_TA and ROA. Industry fixed effects are included. All variables are defined in Appendix 1. The intercept, all 4 variables of interest, 7 control variables and 21 industry fixed effects variables in equation (3) are included in one step to construct the portfolio weights (details in Section 4.1.2). In total, there are 33 sets of weights corresponding to 33 independent variables. Each set of weights is used in equation (2) to estimate the association between the corresponding variable and share price reactions. I only report coefficients and the corresponding t-statistics of variables of interest. The intercept, control variables and industry fixed effects are estimated but not reported for brevity. The Wald test is used to assess the statistical significance of joint coefficients across events. Joint coefficients are constructed by reversing the signs of coefficients when events decreased firms’ propensity to pay dividends (α2 and α3) and summarising all coefficients across events. The signs of italicised coefficients are consistent with the prediction of contract failure.
, ** and * denote significance (two-tailed) at the 1%, 5% and 10% level, respectively.
Three of the seven coefficients on OWN surrounding the introduction of Reg-2012 are consistent with the conjecture that increasing dividends benefitted firms more where controlling shareholders have lower cash flow rights. The statistical significance of coefficients aggregated across events is insignificant (0.0072 with an F-statistic of 0.16) after controlling for the effects of other firm characteristics. As a result, there is no evidence consistent with H2 that controlling shareholders’ cash flow rights reduces the contract failure. 28
Signs of these coefficients of SOE across individual events are inconsistent. None of the coefficients on SOE at any individual event are significant. After controlling for other firm characteristics, the aggregate coefficient on SOE across events turns negative but insignificant. I do not find consistent evidence regarding the association between firms’ abnormal returns to events altering firms’ dividends and the nature of the controlling shareholder, which does not support H3.
Turning to H4, six of the seven coefficients on LEGAL switch their signs in a pattern consistent with the prediction that increasing dividends benefitted firms located in weak legal environments. In particular, at EVENT2 the coefficient on LEGAL is 0.0013 with a t-statistic of 7.10. The coefficient on LEGAL pooled over all events (−0.0042 with an F-statistic of 3.95) yields evidence regarding the prediction of H4 that the regulation would be enforced in weak legal environments. These results are consistent with La Porta et al.’s (2000b) findings that poorly protected investors are not able to extract sufficient dividends.
With respect to the results on control variables in Table 6, untabulated results show that the coefficient on SIZE pooled across all events is significantly negative, with an F-statistic of 5.72. This result implies that investors expected Reg-2012 to be more costly for larger firms. The coefficient on AB_RET across all events is positive and significant (with an F-statistic of 3.87), suggesting that increasing dividends benefitted firms with poor stock price performance more. The coefficients on other control variables are not significant.
Overall, the level of a firm’s dividend yield or legal environment was negatively (positively) associated with the abnormal returns to events that increased (decreased) a firm’s propensity to pay dividends. These results yield considerable evidence regarding H1 and H4, that is, investors expected that dividend regulation increasing firms’ propensity to pay dividends would benefit low dividend payers or firms located in weak legal environments.
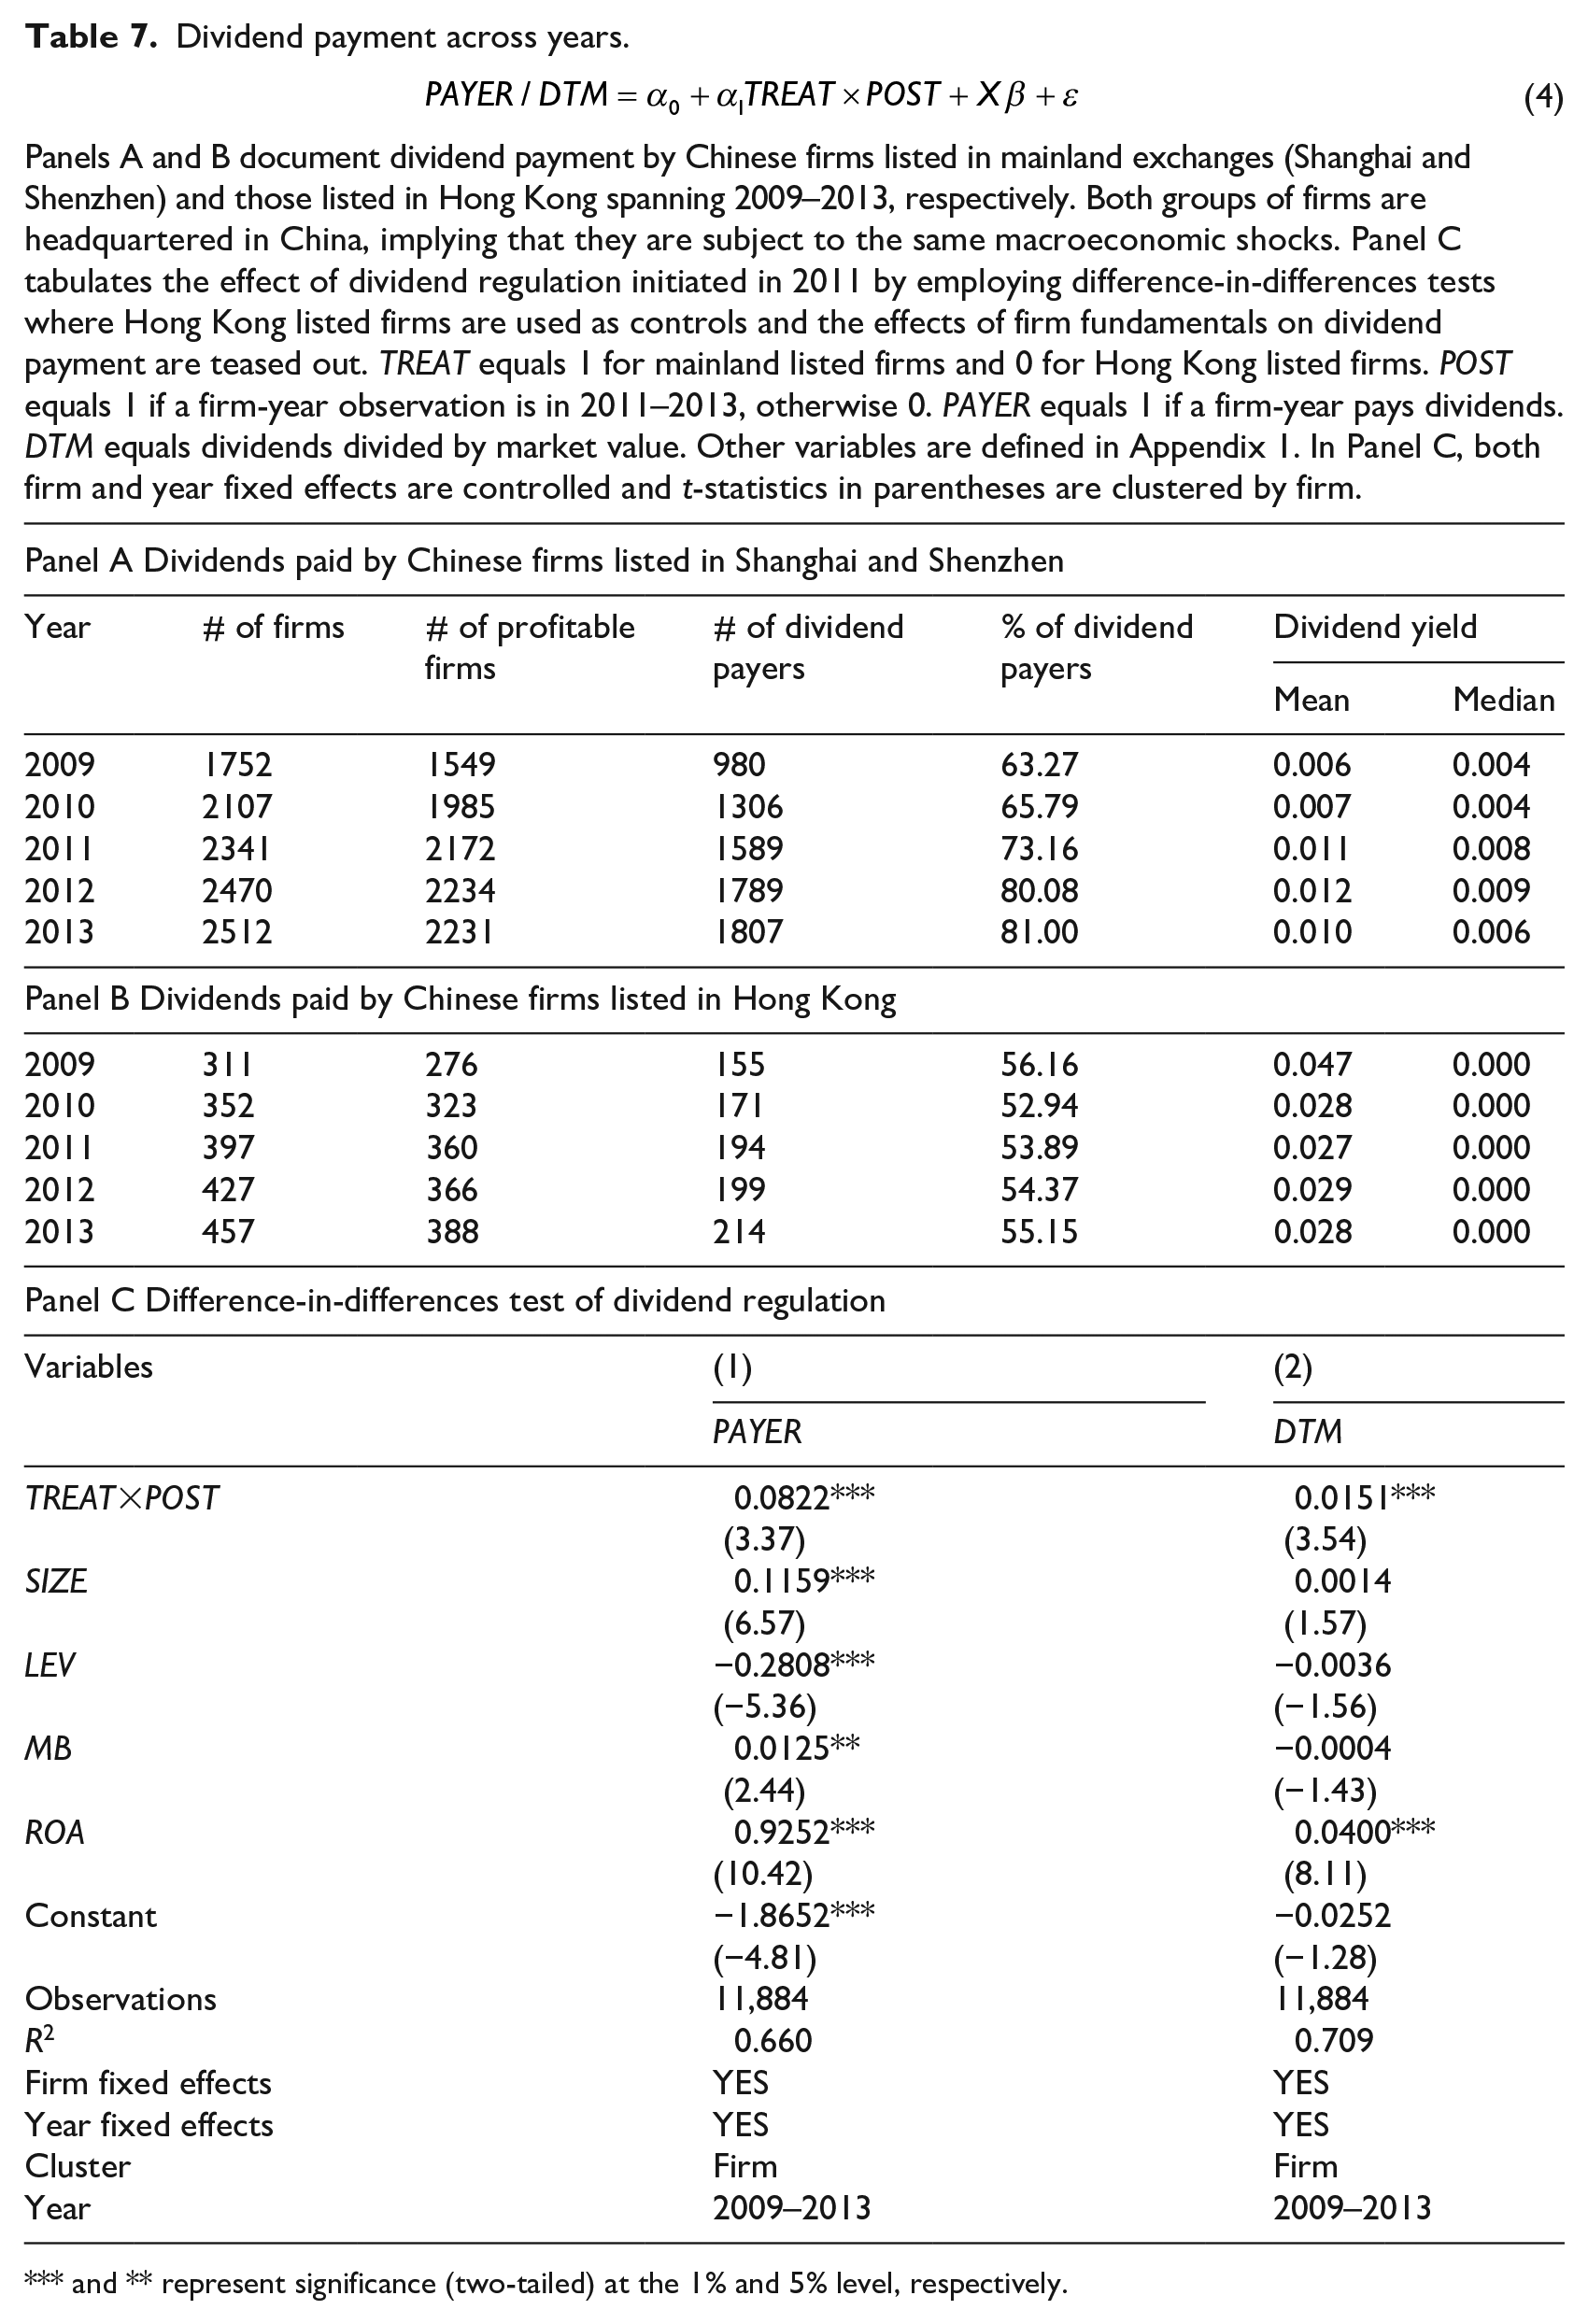
5.3. Actual dividends surrounding the regulatory change
Above I developed hypotheses based on the assumption that Reg-2012 increased investors’ expectations of dividends. To validate this assumption, I investigate whether firms listed in mainland China on the Shanghai and Shenzhen exchanges increased their dividends after the introduction of Reg-2012. To isolate the effects of Reg-2012, I choose all firms headquartered in China but listed in Hong Kong as the control sample to construct a difference-in-differences test over 2009 to 2013. The main advantage of using Hong Kong firms in the difference-in-differences test is that both the Hong Kong and mainland China listed firms are subject to the same macroeconomic conditions, but only mainland firms are affected by Reg-2012. To conduct the difference-in-differences test, I specify the following model

where PAYER equals 1 when a firm-year observation declares dividends, otherwise 0. DTM equals dividends declared divided by total market value. TREAT equals 1 if a firm is listed in Shanghai or Shenzhen exchanges. POST equals 1 if a firm-year observation is in 2012/2013, otherwise 0. X collects firm fundamental variables which determine a firm’s propensity to pay dividends. I include both firm and year fixed effects. When the dependent variable is PAYER (an indicator variable), I estimate a linear probability model rather than a probit model (He and Li, 2018). Firms headquartered in China but listed in Hong Kong are extracted from Global Compustat.
Panels A and B of Table 7 report the number of mainland and Hong Kong listed firms from 2009 to 2013 and the summary statistics of their dividends. There are considerable changes in the sample in both markets, as indicated by the increasing number of firms over the sample period. The use of firm fixed effects in model (4) mitigates the concern that any potential changes in dividends are driven by changes in the sample. The summary statistics on dividends show that there are stark increases in both the percentage of dividend payers and the average DTM in 2011 in the mainland listed sample, whereas there is no such pattern in the Hong Kong listed sample. Because the first event related to Reg-2012 occurred before the end of 2011, this regulatory change started to affect firms’ dividend policies in 2011. Therefore, Panel A and Panel B document some preliminary evidence that Reg-2012 did increase firms’ propensity to pay dividends.
Dividend payment across years.

Panels A and B document dividend payment by Chinese firms listed in mainland exchanges (Shanghai and Shenzhen) and those listed in Hong Kong spanning 2009–2013, respectively. Both groups of firms are headquartered in China, implying that they are subject to the same macroeconomic shocks. Panel C tabulates the effect of dividend regulation initiated in 2011 by employing difference-in-differences tests where Hong Kong listed firms are used as controls and the effects of firm fundamentals on dividend payment are teased out. TREAT equals 1 for mainland listed firms and 0 for Hong Kong listed firms. POST equals 1 if a firm-year observation is in 2011–2013, otherwise 0. PAYER equals 1 if a firm-year pays dividends. DTM equals dividends divided by market value. Other variables are defined in Appendix 1. In Panel C, both firm and year fixed effects are controlled and t-statistics in parentheses are clustered by firm.
and ** represent significance (two-tailed) at the 1% and 5% level, respectively.
Panel C of Table 7 presents further evidence that Reg-2012 compelled mainland listed firms to increase dividends after removing the effects of firm fundamentals. Signs of the coefficients of firm fundamentals are consistent with prior literature (Fama and French, 2001; He and Li, 2018). The coefficients of TREAT×POST are 0.0822 with a t-statistic of 3.37 and 0.0151 with a t-statistic of 3.54 when PAYER and DTM are dependent variables, respectively. Consequently, firms’ actual dividend payment surrounding Reg-2012 provides supportive evidence on the assumption that the dividend regulatory change in China increased firm dividends.
6. Robustness checks
I use information available to investors prior to EVENT1 to construct variables in the previous analyses, thus one concern is whether the above results still hold if variables are constructed based on recent information prior to each event date. In this section, I employ both Larcker et al.’s (2011) research design and Fama and MacBeth’s (1973) approach to address this concern.
6.1. Larcker et al.’s (2011) research design
Larcker et al. (2011) average market returns across multiple events to improve the power in detecting the association between governance variables and firms’ abnormal returns to events surrounding the introduction of governance regulation. The multiple event analysis aggregates associations between explanatory and dependent variables across all events. 29 Therefore, if these associations across events have ‘sufficient consistency’, they can be captured by this pooled event design even if each of them cannot be observed at individual events. Regarding the cross-correlation issue in regulatory event study, Larcker et al. (2011) report standard errors clustered by event. I specify the following regression model, consistent with Larcker et al. (2011)

where γij are the 3-day cumulative abnormal returns centred on the event date in Table 1 for firm i at EVENTj, calculated from equation (1). All variables on the RHS of equation (5) are defined in Appendix 1 and measured using the latest information prior to each event.
Table 8 reports the results of estimating equation (5), which corroborate the findings in the main analyses. The abnormal return is negatively correlated with DIV or LEGAL and the t-statistics are −3.15 and −4.28, respectively. These negative relations are insensitive to the inclusion of industry fixed effects. The SIZE and AB_RET coefficients corroborate the above findings that larger or well-performing firms suffered from Reg-2012.
Larcker et al.’s (2011) research design.

CARij is the 3-day window cumulative abnormal returns centred on event dates in Table 1 for firm i at event j. Industry fixed effects are included. All other variables are defined in Appendix 1. The ordinary least squares (OLS) is used to estimate equation (5). t-Statistics based on standard errors clustered by event are reported.
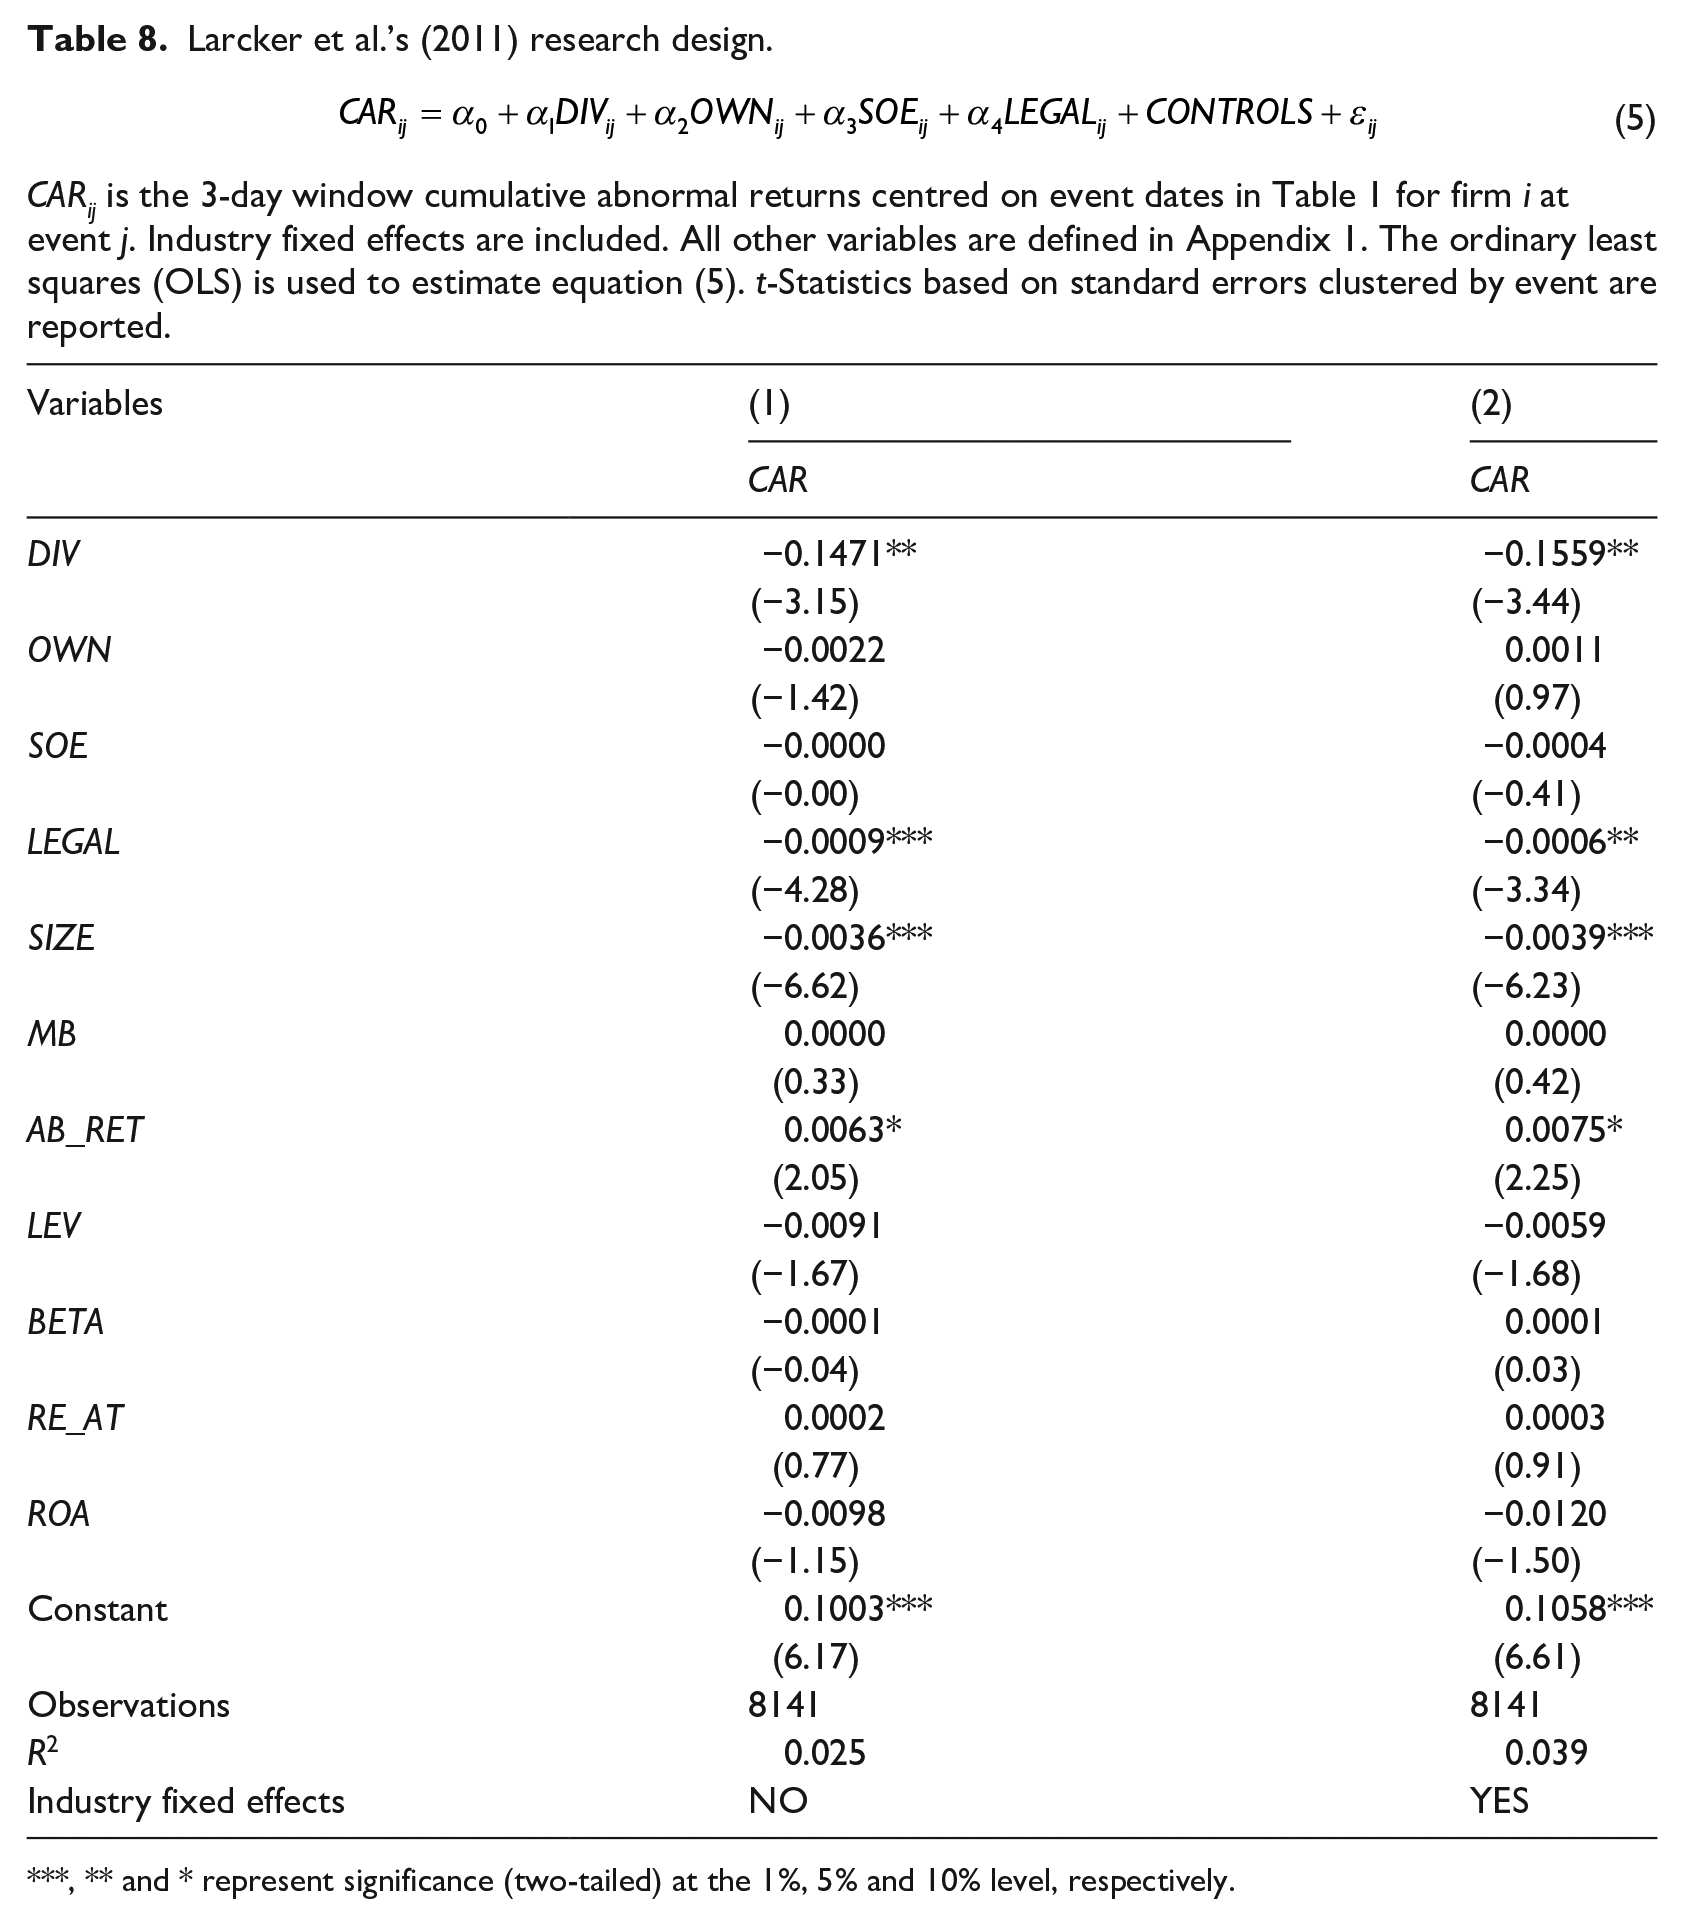
, ** and * represent significance (two-tailed) at the 1%, 5% and 10% level, respectively.
However, the above clustering procedure may not sufficiently address the bias of standard errors introduced by the cross-correlation in my study, because I only have seven clusters (Petersen, 2009). 30 Thus, to mitigate concern about biased standard errors and incorporate updated information in variables, I employ Fama and MacBeth’s (1973) approach in the next subsection.
6.2. Fama and MacBeth’s (1973) approach
Table 9 documents the results of Fama and MacBeth (1973) regressions across EVENT1–EVENT7 with and without industry fixed effects. The negative associations between abnormal returns and DIV, LEGAL, SIZE and AB_RET are robust to the inclusion of industry fixed effects and confirm the findings in the main analyses.
Fama-MacBeth regression.

CARij is the 3-day window cumulative abnormal returns centred on event dates in Table 1 for firm i at event j. Industry fixed effects are included. All other variables are defined in Appendix 1. Ordinary least squares (OLS) is used to estimate the equation. t-Statistics based on Fama and MacBeth’s (1973) standard errors are reported.
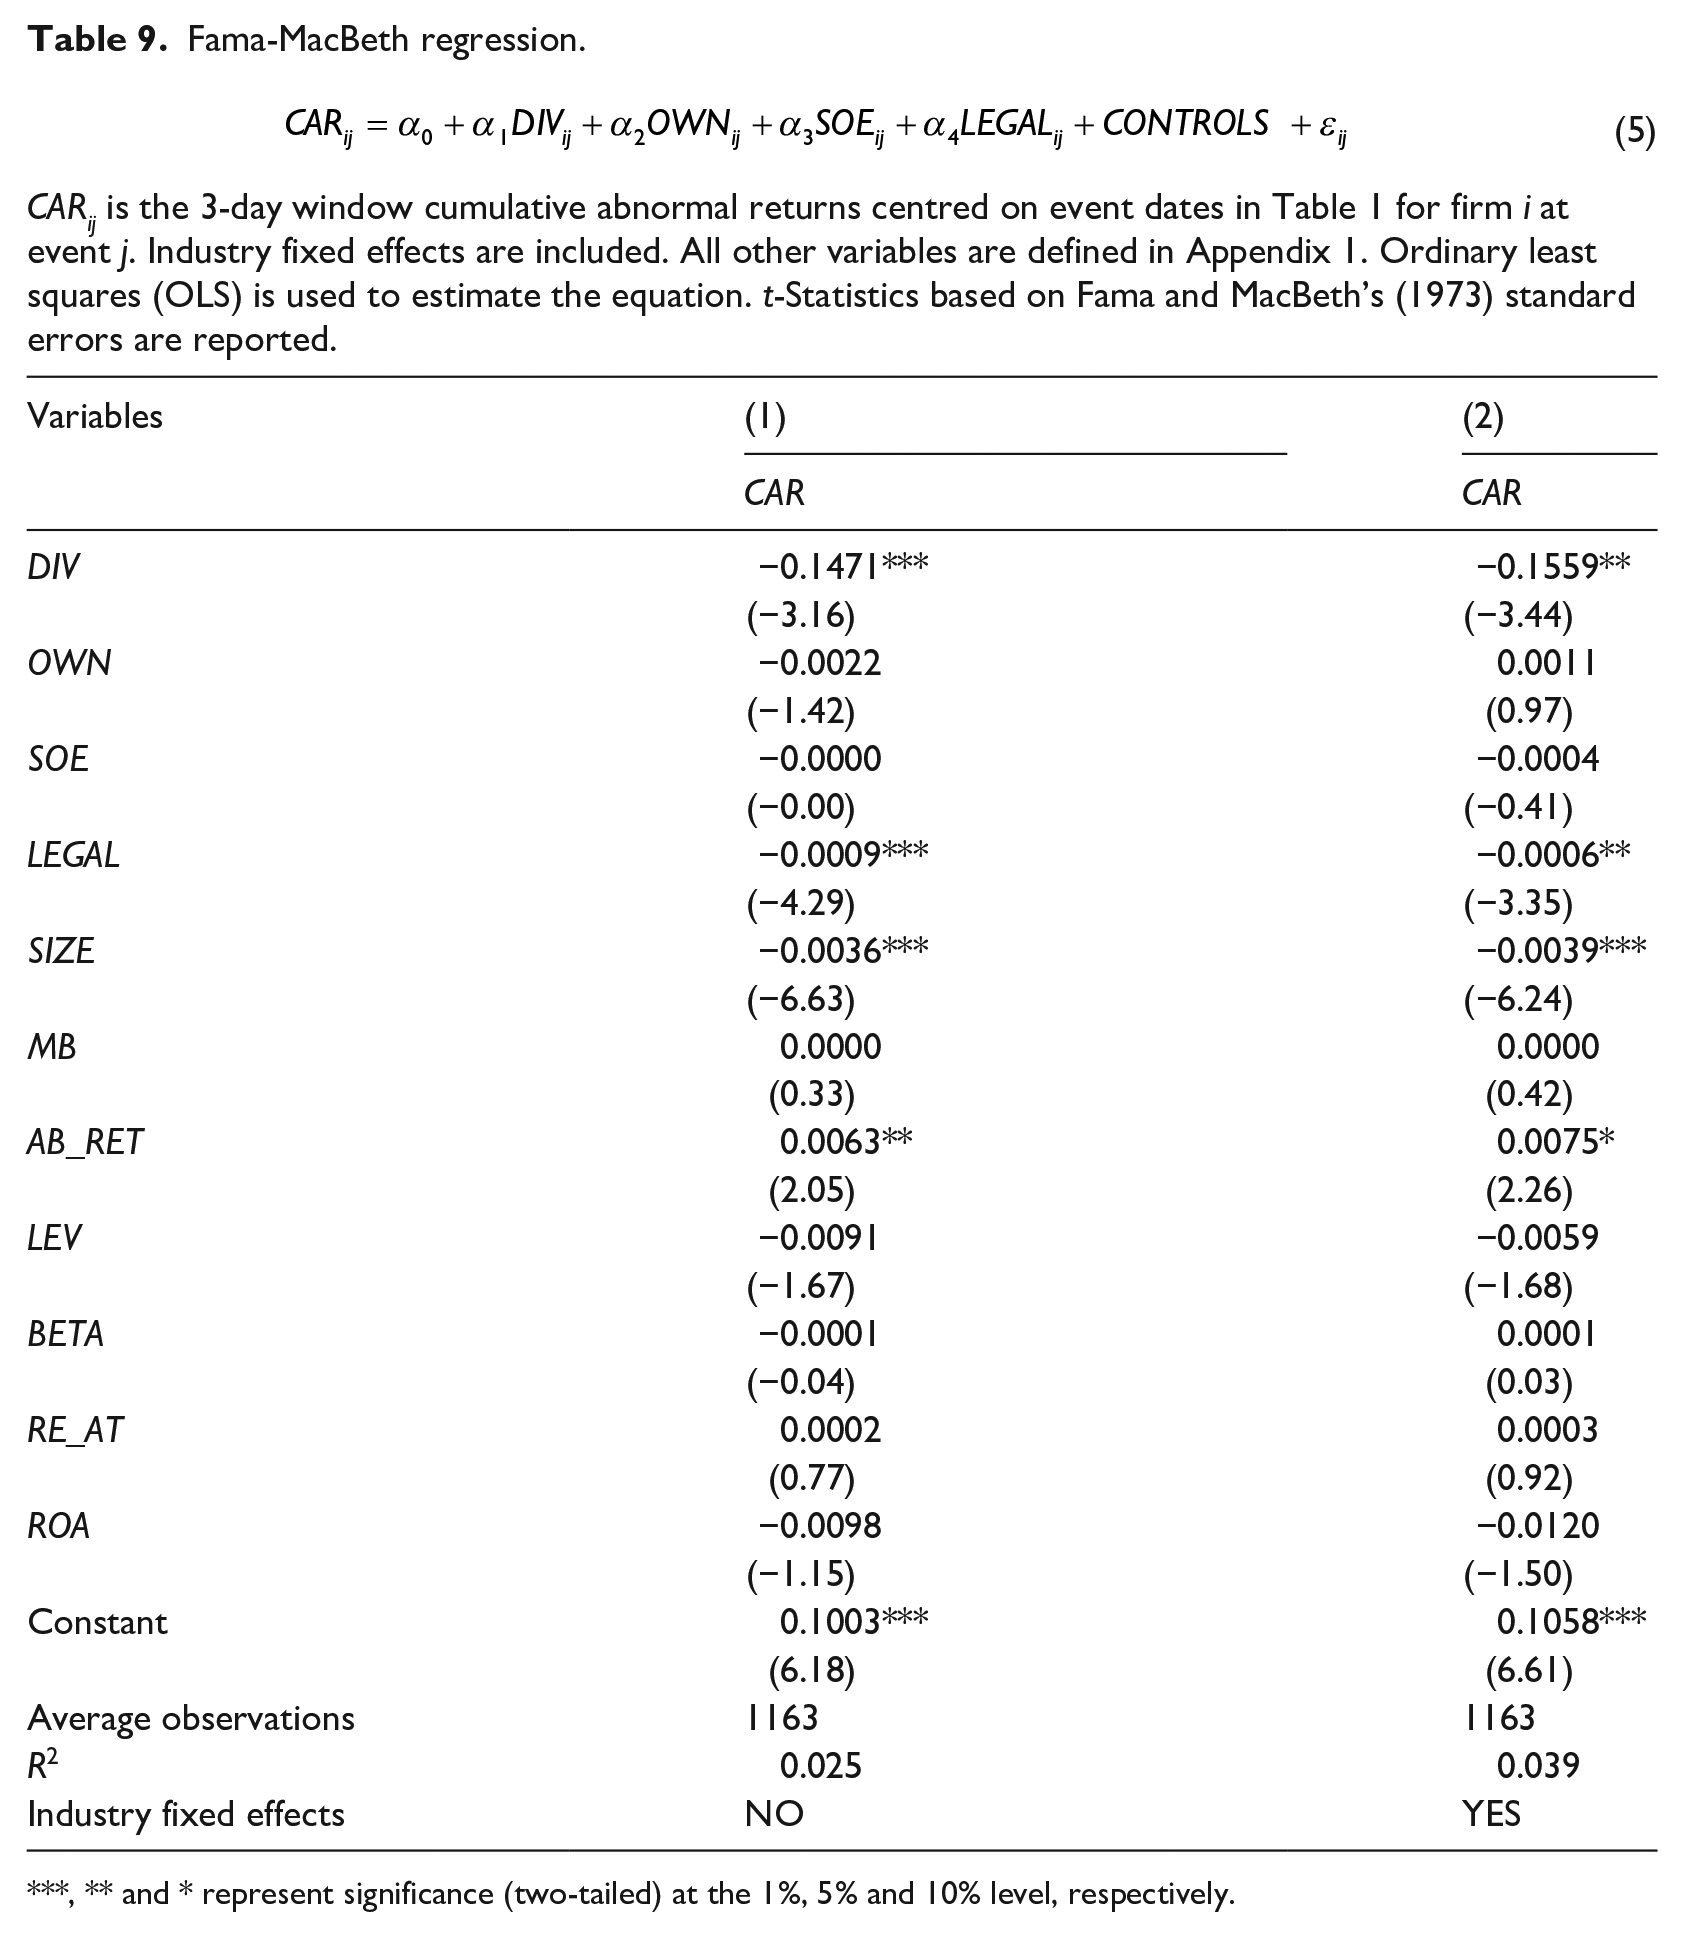
, ** and * represent significance (two-tailed) at the 1%, 5% and 10% level, respectively.
Thus, the incorporation of the latest information into the construction of variables in the empirical analysis does not change the observed negative association between abnormal returns and DIV or LEGAL. Furthermore, I obtain evidence on the negative association between market reactions to events around the introduction of Reg-2012 and firm size and prior stock return performance.
7. Conclusion
By exploring an unexpected regulatory change related to dividends in China (Reg-2012), I conduct an event study to examine the wealth effects of dividend regulation that increases firms’ dividends. The market average reaction test yields initial descriptive evidence that dividend regulation benefits the market, consistent with the contention that implicit contract failure on dividends occurs in China.
Results from cross-sectional tests that associate firms’ abnormal returns to events surrounding the introduction of Reg-2012 with their characteristics provide additional evidence to the overall market tests. Specifically, share price reactions were negatively associated with the level of firms’ dividend yield or the strength of the legal environments where firms were located, when regulatory events were expected to increase dividends. These findings are robust to various research designs. The results suggest that low dividend firms or firms located in weak legal environments are faced with implicit contract failure more than others. However, I caution readers that regulation is not the only solution to mitigate this contract failure (Coase, 1960). In future research, market mechanisms should be compared with direct regulation to yield the most appropriate strategy.
Footnotes
Appendix 1
Appendix 2
Acknowledgements
This research is based on one chapter in my PhD thesis. I thank my PhD supervisor Professor Greg Clinch and Dr Yunyan Zhang. I also thank comments from Doug Skinner (Discussant at the MIT Asia Conference 2014, Chengdu), Wen He, Wayne Landsman and Qingbo Yuan and participants in AAA Annual Conference 2014 and Financial Market and Corporate Governance Conference 2014. All errors are my own.
Final transcript accepted 28 May 2020 by Sue Wright (AE Accounting).
Funding
The author(s) received no financial support for the research, authorship and/or publication of this article.