
Abstract
Bitcoin is becoming a popular financial asset and means of transacting. However, little is known about an important aspect of the bitcoin market: its liquidity. We consider whether various dimensions of liquidity evident in other asset classes are present in bitcoin spot and futures liquidity. We find variations in spot liquidity across bitcoin exchanges and a strong commonality in bitcoin spot and futures market liquidity. The pricing of spot and futures bitcoin is relatively inefficient, and liquidity plays an important role. Deterioration in liquidity also contributes to bitcoin crash risk and large return declines.
JEL Classification:
Keywords
1. Introduction
The popularity of bitcoin as a financial asset and means of transacting has been rapidly increasing. Easley et al. (2019) note that an estimated 100,000 companies worldwide accept payment in bitcoin and a likely 10 million individuals hold a nontrivial amount of bitcoin as an asset. By early 2018, the market capitalization of bitcoin exceeded the market capitalization of several developed equity markets that attract global investment flows, 1 and Foley et al. (2019) note that there are now more than 100 hedge funds solely focused on bitcoin and related cryptocurrencies. Moreover, in late 2017, the Chicago Mercantile Exchange (CME) launched a bitcoin futures contract responding to demand from traders and hedgers.
While the literature on bitcoin and other cryptocurrencies mainly focuses on regulation, criminality, and price efficiency, the liquidity aspect of the bitcoin market is still relatively under-researched. 2 This is in sharp contrast to the many studies that highlight the significance of liquidity in equity, bond, currency, and commodity markets. 3 The spot bitcoin market has many features that differentiate it from most other markets, such as continuous trading, various market structures, and trading platforms that lack regulation or transparency (especially bitcoin’s trading anonymity), so it is unclear whether liquidity findings from traditional markets will apply in the bitcoin market. To address this question, we use different liquidity frameworks from stock markets and study the various characteristics of bitcoin liquidity, its comovement, its role in market efficiency, and the link between bitcoin spot and futures markets. First, we investigate whether there is variation in transaction costs across different bitcoin spot and futures exchanges. Second, we consider the extent to which aspects of trading activity influence bitcoin liquidity, as documented by Stoll (2000) in equity markets. Third, we consider whether liquidity commonality (e.g. Chordia et al., 2000), or comovement, is prevalent, despite the fragmented nature of the bitcoin market and the fact that the explanation of Koch et al. (2016) of correlated trading by institutional investors is likely to be less relevant. Fourth, we investigate whether there is a liquidity spillover between bitcoin spot and futures markets, using the framework of Chordia et al. (2005). Fifth, we follow Brunnermeier et al. (2008) and check whether variables such as the Chicago Board Options Exchange Volatility Index (VIX) and the TED spread, which have been shown to influence stock liquidity, are determinants of bitcoin liquidity. Sixth, we document the role that liquidity plays in the efficient pricing of bitcoin, using the framework of Chordia et al. (2008). Last, we investigate whether liquidity contributes to bitcoin crash risk.
Following Brauneis et al. (2021), we use spot bitcoin data of three large bitcoin exchanges: Bitfinex, Bitstamp, and Coinbase. 4 Our sample period spans from January 2017 to October 2020. We show variation in liquidity across exchanges and over time. On average, the quoted spread (QSP) varies from 0.0082% at Coinbase to 0.0805% at Bitstamp, and the effective spread (ESP) ranges from 0.1614% at Coinbase to 0.3455% at Bitfinex. Moreover, we document that average bitcoin futures QSP and ESP are 0.1389% and 0.0951%, respectively. 5
These findings will be of interest to many parties. For instance, those wishing to diversify portfolios by adding bitcoin exposure can use these costs to estimate net benefits to bitcoin diversification. De Roon et al. (2001) note that what appears to be diversification benefits can disappear when transaction costs are taken into account. Active traders of bitcoin can also use these costs to assess the net gains to their strategies. For example, Lesmond et al. (2004) show that transaction costs are important when determining whether market timing techniques add value. Finally, exchanges can also use these results. Harris (2003) points out that transaction cost levels are an important aspect that exchanges compete for business.
We find a positive (negative) relation between return volatility (price level) and bitcoin illiquidity in spot and futures markets. These results are consistent with Stoll’s (2000) New York Stock Exchange (NYSE) stock evidence. We also find an overall negative relation between spreads and the average dollar value of trades, which is consistent with Stoll’s (2000) results. However, we find mixed evidence on the impact of the number of trades.
Chordia et al. (2000) show that stock liquidity has a systematic component. A change in the liquidity of stocks across the entire market impacts the liquidity of individual stocks. We find that liquidity comovement is also prevalent in the spot bitcoin market, despite its fragmented nature. There is a strong link between bitcoin liquidity across the bitcoin trading venues we examine.
Changes in the liquidity of bitcoin futures contacts are correlated with changes in bitcoin liquidity. Bitcoin futures liquidity changes Granger-cause changes in spot market bitcoin liquidity. There is also evidence that changes in spot market bitcoin liquidity influence liquidity in bitcoin futures contracts. Bitcoin liquidity can be influenced by factors that have been shown to affect stock liquidity, implying potential integration between bitcoin and other financial markets. Brunnermeier and Pedersen (2009) develop a model that links the liquidity of assets to the liquidity of funding markets. The authors’ premise is that the ability of traders to provide market liquidity is dependent on their ability to obtain funding. We follow Brunnermeier et al. (2008) and use the TED spread, which is the difference between the London Interbank Offered Rate (LIBOR) and the risk-free T-bill rate as a proxy for funding liquidity. We find evidence that increases in the TED spread reduce bitcoin liquidity. However, changes in the VIX, regularly used as a proxy for uncertainty and investor fear, increase bitcoin liquidity. This finding is consistent with Shahzad et al. (2019), suggesting that bitcoin can be considered a weak safe-haven asset. 6
Another contribution we make is documenting that liquidity plays a vital role in price discovery and efficient bitcoin pricing. Unlike stocks, which Chordia et al. (2005) show have efficient pricing, our bitcoin pair returns are predictable from lag order imbalance at 5-minute horizons. Moreover, the predictive ability of lag order imbalance is stronger (i.e. the pricing is less efficient) on days when liquidity is lower. Bitcoin returns are much more volatile than stock returns and are subject to frequent crashes. We show that changes in bitcoin liquidity contribute to bitcoin return crashes. This finding is evident in both the bitcoin spot and futures markets.
Our article contributes to the literature on bitcoin liquidity. Kim (2017) considers bitcoin priced in 16 different currencies and concludes that transaction costs are lower than those in the retail foreign exchange market. Dyhrberg et al. (2018) use bitcoin data on three US exchanges over an 8-month period and find that the highest levels of trading activity occur during US trading hours. The authors also examine the QSP and ESP of bitcoins and show that bitcoins are highly investible assets. Jain et al. (2019) document the commonality in bitcoin returns and volume using a 5-month period in 2018. Brauneis et al. (2021) examine which low-frequency liquidity proxies are the best to capture actual bitcoin liquidity (i.e. high-frequency liquidity measures). Our study differs from prior studies in several important ways. First, we consider different aspects and implications of liquidity, including a range of different determinants, its link to market efficiency, and its implications for crash risk. Second, we examine bitcoin liquidity in both spot and futures markets. Moreover, we use three benchmark liquidity measures from the literature and an extended sample period of 4 years for empirical analysis.
The remainder of the article is organized as follows. Section 2 provides more detail on the bitcoin market and summarizes the related literature. The data and liquidity measures we adopt are described in Section 3. Section 4 presents the results, and Section 5 concludes the article.
2. The bitcoin market and related literature
2.1. Background
Bitcoin is a digital currency, or cryptocurrency, which was first introduced by Nakamoto (2008). 7 As Yermack (2015) notes, bitcoin differs from fiat money in that its growth rate is linked to mathematics, which is applied in a decentralized manner by transparent computer code. As Easley et al. (2019) point out, “miners” create new bitcoins by solving mathematical problems and receiving new bitcoin as payment. 8 Yermack (2015) highlights that the rate of bitcoin growth slows over time, with the last bitcoin due to be released in the year 2140, bringing the total to 21 million units. Harvey (2014) mentions that bitcoins differ from fiat money in that the history of every transaction is known. Yermack (2017) notes that blockchain technology is a significant advance in financial recordkeeping. Stock exchanges worldwide have started evaluating this technology as a mechanism by which company shares can be listed and traded. However, Huberman et al. (2021) highlight that bitcoin cannot provide services such as reversing fraudulent transactions. While the use of bitcoin for legal transactions and as an investment asset is rapidly increasing, bitcoin has also become a popular means of transacting for those involved in illegal activity. Foley et al. (2019) estimate that one-quarter of bitcoin users are engaged in criminal activity, although they note “declines with mainstream interest in Bitcoin and with the emergence of more opaque cryptocurrencies” (p. 1798). This finding is consistent with the study of Tasca et al. (2018) who conclude that the bitcoin market has progressed away from being dominated by “sin” activities, toward legitimate business activity.
Hileman and Rauchs (2017) note that although the second cryptocurrency, Namecoin, did not emerge until April 2011, hundreds of cryptocurrencies are now being traded. However, the authors estimate that, in March 2017, the market capitalization of Bitcoin was over 3.5 times that of all the other cryptocurrencies combined.
2.2. Literature review
In addition to papers that explain the features of the bitcoin market and those that touch on aspects of bitcoin liquidity, several consider various other dynamics of the bitcoin market. Li and Wang (2017) suggest the price of bitcoin is influenced by economic fundamentals. In contrast, Detzel et al. (2018) show that bitcoin returns are largely unpredictable by economic variables. However, simple technical trading strategies based on moving-average rules generate statistically significantly greater returns than a buy-and-hold strategy. Scaillet et al. (2017) show that jumps occur frequently, have a short-term positive impact on market activity, and cause persistent price changes. Brandvold et al. (2015) consider the role of various exchanges in price discovery and show that the information shares of different exchanges have changed significantly through time. Easley et al. (2019) find that the level of transaction fees in the bitcoin market will, over time, play an important role in influencing both bitcoin miners and those transacting in bitcoin. Elendner et al. (2016) consider the comovement between bitcoin and assets such as stock indices, real estate, gold, and US Treasury bills. They find consistently low correlations, indicating that the inclusion of bitcoin in a portfolio provides essential diversification benefits. However, Bouri et al. (2017) find that while bitcoin can provide safe-haven protection against extreme downward movements in Asian stocks, it is less effective at hedging risk for holders of other asset classes. The authors also document evidence that questions the extent to which bitcoin is freely and efficiently priced.
Baur and Dimpfl (2019) find the bitcoin spot price leads the CME futures price due to higher trading volumes and longer trading hours. Entrop et al. (2020) consider price discovery across spot and CME bitcoin futures markets and find that increases in price discovery are mostly driven by relative trading costs and volume. In Augustin et al. (2021), the introduction of bitcoin futures improves bitcoin price efficiency. Alexander et al. (2020) show that derivatives on the unregulated BitMEX exchange lead spot prices and effectively hedge against spot price volatility. Reynolds et al. (2018) find that newer bitcoin currency–exchange pairs create mispricing, allowing triangular arbitrage profit opportunities. Moreover, Griffin and Shams (2018) suggest that Tether, a digital currency pegged to the US dollar (USD), is used to manipulate the prices of other cryptocurrencies. Finally, Cheah and Fry (2015) propose that bitcoins have no fundamental value, while Biais et al. (2020) build a cryptocurrency pricing model, in which the fundamental values of bitcoin are its transactional costs and benefits.
3. Measuring bitcoin liquidity
3.1. Data
We follow Brauneis et al. (2021) and consider the bitcoin exchange against US dollar (BTCUSD) at three large bitcoin exchanges: Bitfinex, Bitstamp, and Coinbase. As noted in Brauneis et al. (2021), trading volume in Bitfinex, Bitstamp, and Coinbase represents economically meaningful transactions, while other cryptocurrency exchanges are likely to overstate trading volume. 9 We report our core results across exchanges and at the exchange level, so the reader can have confidence that the overall results are consistent with those from the individual exchanges. We obtain spot data from Kaiko (https://www.kaiko.com), which provide trade data at millisecond intervals and order book snapshots. Both the trade and order book data are reported in universal time. Our sample period spans from January 2017 to October 2020 (a total of 1382 trading days). 10
In addition, we source the futures data for CME-traded bitcoin futures contracts from Refinitiv’s DataScope Select (previously known as Thomson Reuters Tick History). We follow Marshall et al. (2012) to create a continuous series of the most actively traded contracts by replacing a contract that expires in a given month with the contract that is next nearest to maturity on the last day of the previous month. The futures data cover the period from December 2017 to October 2020 (i.e. 889 trading days). The CME Globex trading hours for bitcoin are 5:00 p.m. to 4:00 p.m. Central Standard Time, Sunday to Friday.
3.2. Liquidity across exchanges
The high-frequency trade and order book data allow us to calculate standard intraday liquidity measures rather than relying on low-frequency liquidity proxies (e.g. Goyenko et al., 2009; Brauneis et al., 2021). We use three intraday liquidity measures throughout our empirical analysis. The first two liquidity metrics we consider are ESP and QSP, as described in Goyenko et al. (2009) Our third liquidity measure is price impact (PI), as per Brauneis et al. (2021) 11 Appendix 1 summarizes the formulas for calculating the liquidity measures from the existing literature. Similar to Marshall et al. (2012), we use the technique of Brownlees and Gallo (2006) to mitigate the influence of data errors in high-frequency data.
We present mean liquidity measures for each BTCUSD pair in Table 1. Panel A presents summary statistics for spot bitcoin exchanges over our entire sample period. The mean QSP varies from 0.0082% at Coinbase to 0.0805% at Bitstamp. The average QSP across three exchanges is 0.0339%, compared to 1.7% for global stocks (e.g. Fong et al., 2017), 0.015%–0.083% for currencies (e.g. Mancini et al., 2013), 0.176% for the median commodity spread (e.g. Marshall et al., 2012), and a mean spread of 1.286% for bonds (e.g. Schestag et al., 2016).
Summary statistics.
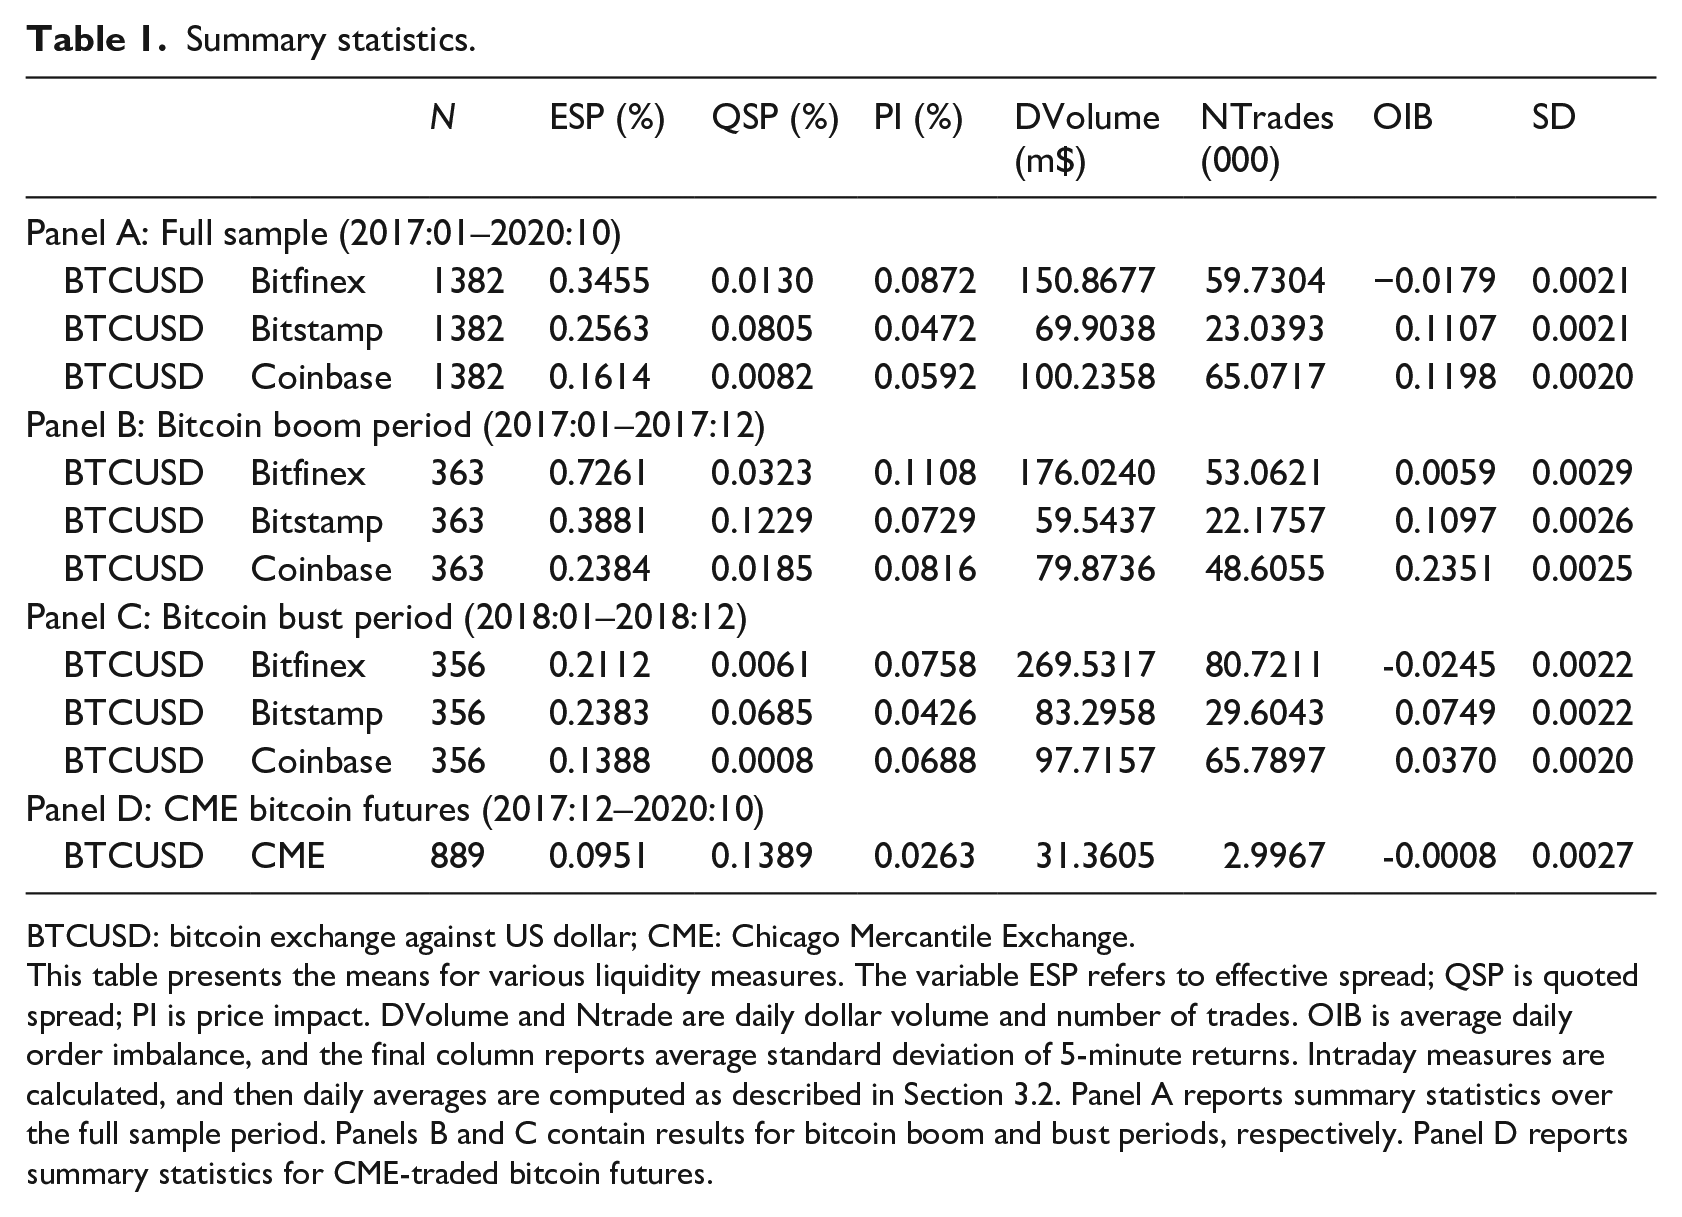
BTCUSD: bitcoin exchange against US dollar; CME: Chicago Mercantile Exchange.
This table presents the means for various liquidity measures. The variable ESP refers to effective spread; QSP is quoted spread; PI is price impact. DVolume and Ntrade are daily dollar volume and number of trades. OIB is average daily order imbalance, and the final column reports average standard deviation of 5-minute returns. Intraday measures are calculated, and then daily averages are computed as described in Section 3.2. Panel A reports summary statistics over the full sample period. Panels B and C contain results for bitcoin boom and bust periods, respectively. Panel D reports summary statistics for CME-traded bitcoin futures.
ESPs capture transaction costs for larger trades and are typically higher than QSPs. The mean ESP varies from 0.1614% at Coinbase to 0.3455% at Bitfinex, and the average ESP across all three exchanges is 0.2544%. The PI results point to bitcoins traded at Bitstamp as being the most liquid. In Figure 1, we depict the average of our liquidity measures across spot bitcoin exchanges over the entire sample period. Overall, the figure shows strong correlations between our liquidity measures. The correlation matrices of our liquidity measures are presented in Appendix 2.
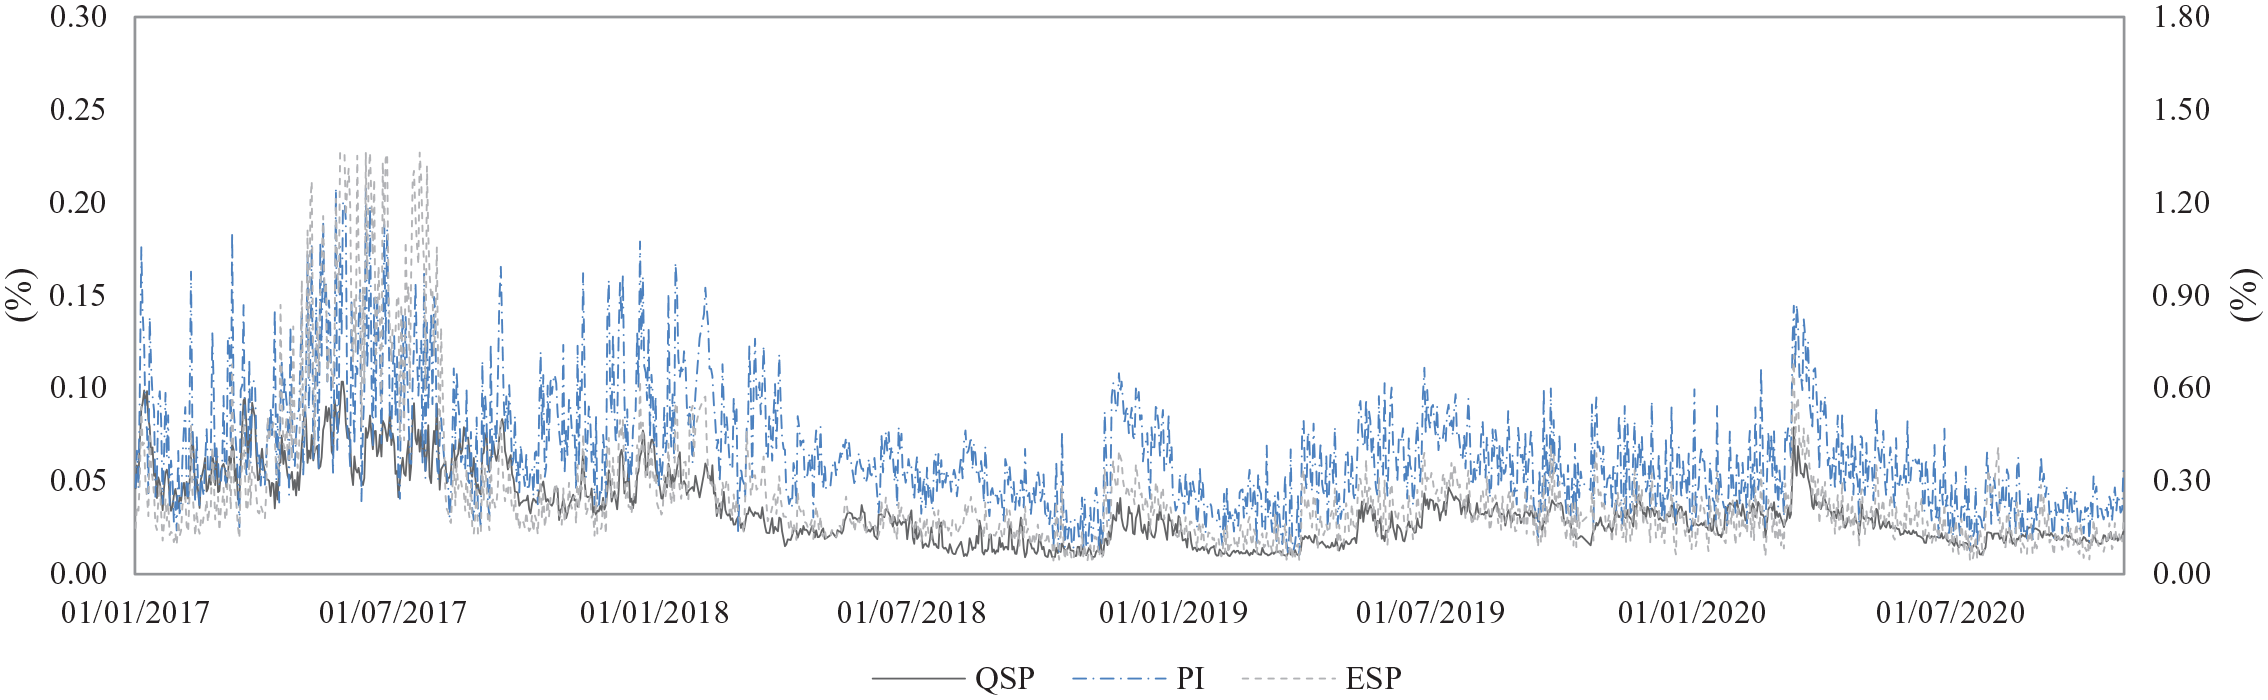
Bitcoin liquidity measures. This figure plots the average quoted spread, price impact, and effective spread across bitcoin exchanges. The sample period is January 2017 to October 2020.
Moreover, Panel A of Table 1 shows that Bitfinex experiences the highest daily trading value, while Coinbase exhibits the highest number of trades. The final column presents a similar standard deviation of 5-minute returns across exchanges. Panels B and C show summary statistics for sub-periods of our sample: (a) the boom period in 2017 and (b) the burst period in 2018. Panel D documents that average bitcoin futures ESPs, QSPs, and PI are 0.0951%, 0.1389%, and 0.0263%, respectively. Bitcoin futures liquidity is higher in terms of ESP and PI, and lower when liquidity is measured by QSP.
We hope that the results in this article for bitcoin liquidity and transaction costs are of assistance to the growing number of researchers investigating the bitcoin market. For example, Detzel et al. (2018) show that simple moving-average technical trading rules are effective in the bitcoin market. Part of their analysis involves estimating break-even transaction cost levels that would remove any alpha compared to the buy-and-hold strategy. Our results indicate that actual transaction costs are lower than their estimates, suggesting economic gains after costs to the strategy they test.
4. Results
4.1. Bitcoin liquidity determinants
We use the control variables Stoll (2000) adopted for the equity market to measure the determinants of bitcoin bid-ask spreads. We apply the following time-series regression

where ILLIQUIDITY is one of our three liquidity measures discussed in Section 3.3, logV is the log of the average dollar volume of trading within a day, σ is the standard deviation of 5-minute intraday bitcoin returns, logP is the log of the average trading price, and logN is the log of the number of trades in a day. Equation (1) is estimated across bitcoin exchanges with exchange fixed effects and then for each exchange. The regression results are reported in Panels A to D of Table 2.
Bitcoin liquidity determinants.
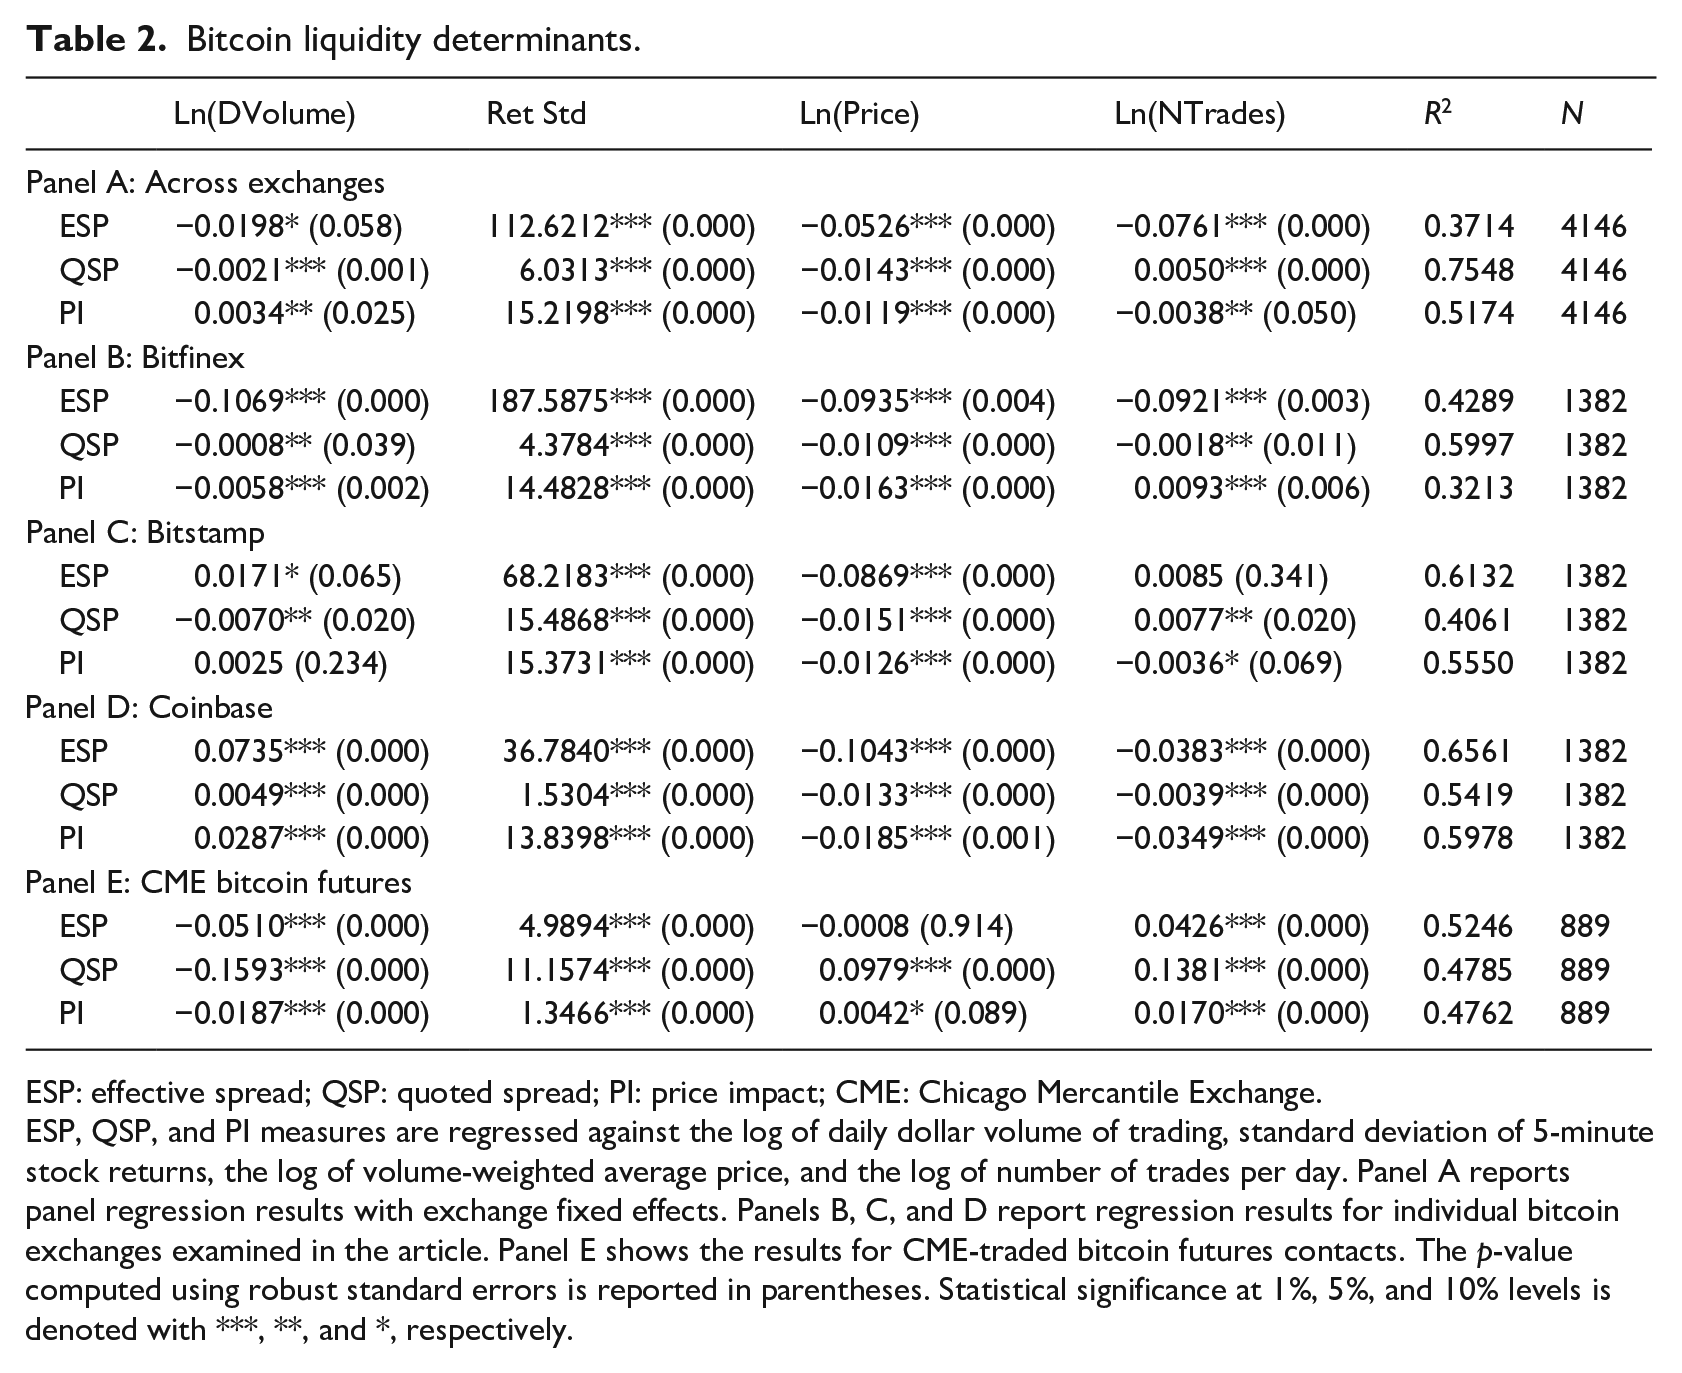
ESP: effective spread; QSP: quoted spread; PI: price impact; CME: Chicago Mercantile Exchange.
ESP, QSP, and PI measures are regressed against the log of daily dollar volume of trading, standard deviation of 5-minute stock returns, the log of volume-weighted average price, and the log of number of trades per day. Panel A reports panel regression results with exchange fixed effects. Panels B, C, and D report regression results for individual bitcoin exchanges examined in the article. Panel E shows the results for CME-traded bitcoin futures contacts. The p-value computed using robust standard errors is reported in parentheses. Statistical significance at 1%, 5%, and 10% levels is denoted with ***, **, and *, respectively.
Across Bitfinex, Bitstamp, and Coinbase, there is a statistically significant and positive relation between return volatility and bitcoin illiquidity, as measured by spreads and PI. In contrast, the relation between bitcoin illiquidity and price level is negative. Both results are consistent with the evidence of Stoll (2000) for NYSE stocks. We find mixed evidence on the impact of trading volume and number of trades. The positive relation between bitcoin spreads and number of trades (or volume) is consistent with recent evidence from Dyhrberg et al. (2020) showing that exceedingly small tick sizes in cryptocurrency markets encourage undercutting behavior and lead traders to convert limit orders to market orders, which widens spreads.
The results by exchange in Panels B to D are generally consistent with the overall results. In Panel E, we present the results for CME-traded bitcoin futures. Consistent with the spot results, the bitcoin futures spread and PI are larger in volatile periods with greater return standard deviation. Unlike the overall spot liquidity results, we find significant evidence that bitcoin futures ESP, QSP, and PI measures are negatively correlated with trading value and positively with bitcoin futures prices.
4.2. Bitcoin liquidity commonality
Chordia et al. (2000) show a market-wide systematic dimension to stock liquidity. Changes in aggregate liquidity have an important impact on the liquidity of individual stocks. Establishing the existence, or otherwise, of liquidity commonality is an important pursuit since a common market-wide aspect to liquidity motivates investigation into the factors that influence changes in liquidity across all securities in the market. Researchers thus establish the presence of liquidity commonality in other markets, such as currencies (e.g. Mancini et al., 2013) and commodities (e.g. Marshall et al., 2012). However, it is not clear whether one should expect to see common movements in bitcoin liquidity. First, it is interesting to see whether commonality exists while cryptocurrencies, such as bitcoin, lack fundamentals. 12 Second, the bitcoin market is more fragmented and segmented than other markets. Third, Koch et al. (2016) show a demand-side explanation for commonality in stocks due to mutual funds’ correlated trading in many stocks. However, while institutional investor interest in bitcoin has grown over time, it seems unlikely that this would be at the same level as mutual fund ownership in stocks, and, therefore, the likelihood of demand-side factors resulting in liquidity commonality in bitcoin seems to be lower. 13
We follow Chordia et al. (2000) and regress the liquidity change for a BTCUSD pair on the daily percentage change in the liquidity measure for the market, as follows

where, for day t,
Liquidity commonality.
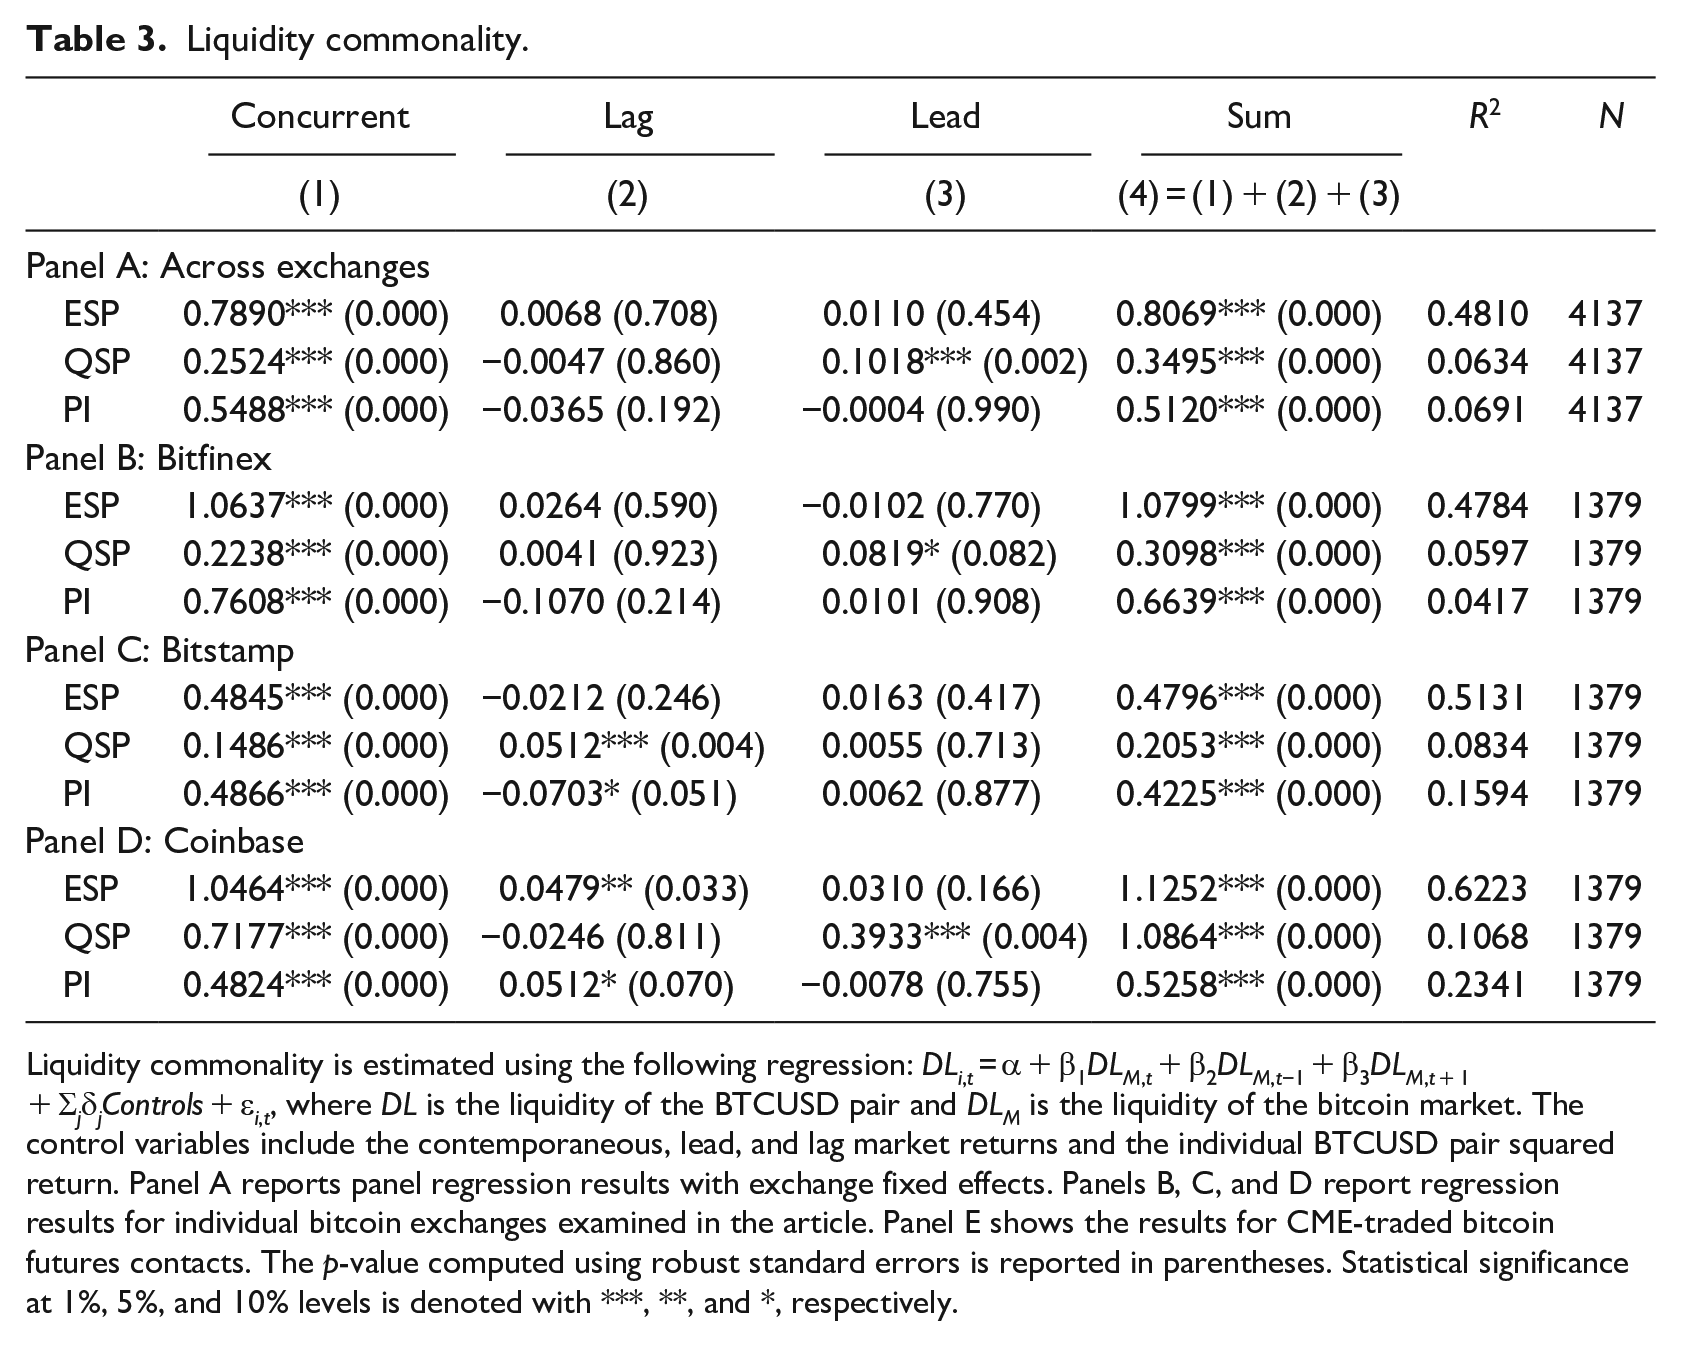
Liquidity commonality is estimated using the following regression: DLi, t = α + β1DLM, t + β2DLM,t−1 + β3DLM, t + 1 + ΣjδjControls + εi, t , where DL is the liquidity of the BTCUSD pair and DLM is the liquidity of the bitcoin market. The control variables include the contemporaneous, lead, and lag market returns and the individual BTCUSD pair squared return. Panel A reports panel regression results with exchange fixed effects. Panels B, C, and D report regression results for individual bitcoin exchanges examined in the article. Panel E shows the results for CME-traded bitcoin futures contacts. The p-value computed using robust standard errors is reported in parentheses. Statistical significance at 1%, 5%, and 10% levels is denoted with ***, **, and *, respectively.
Panel A results indicate that a one-unit movement in market liquidity results in an average contemporaneous movement in the liquidity of a given BTCUSD pair of 0.7890, 0.2524, and 0.5488 units for ESP, QSP, and PI, respectively. There is also some evidence of a 1-day lead and lag influence across Panels A to D. The Wald test results show that the sum of coefficients on the concurrent, lag, and lead changes in bitcoin market liquidity is statistically significant and positive across bitcoin exchanges.
4.3. Other determinants of bitcoin market liquidity
The existing literature suggests that derivative markets participants can process information and improve efficiency in the underlying assets (e.g. Augustin et al., 2021). We now use the daily average liquidity measures of spot bitcoin exchanges (depicted in Figure 1) and investigate the influence of futures market bitcoin liquidity on spot bitcoin liquidity. The results in Panel A of Table 4 show daily Pearson correlation coefficients between spot and futures bitcoin liquidity of 0.4132, 0.4949, and 0.4371 for ESP, QSP, and PI, respectively, with all correlation coefficients being statistically significantly different from zero at the 1% level.
Link to bitcoin futures liquidity.
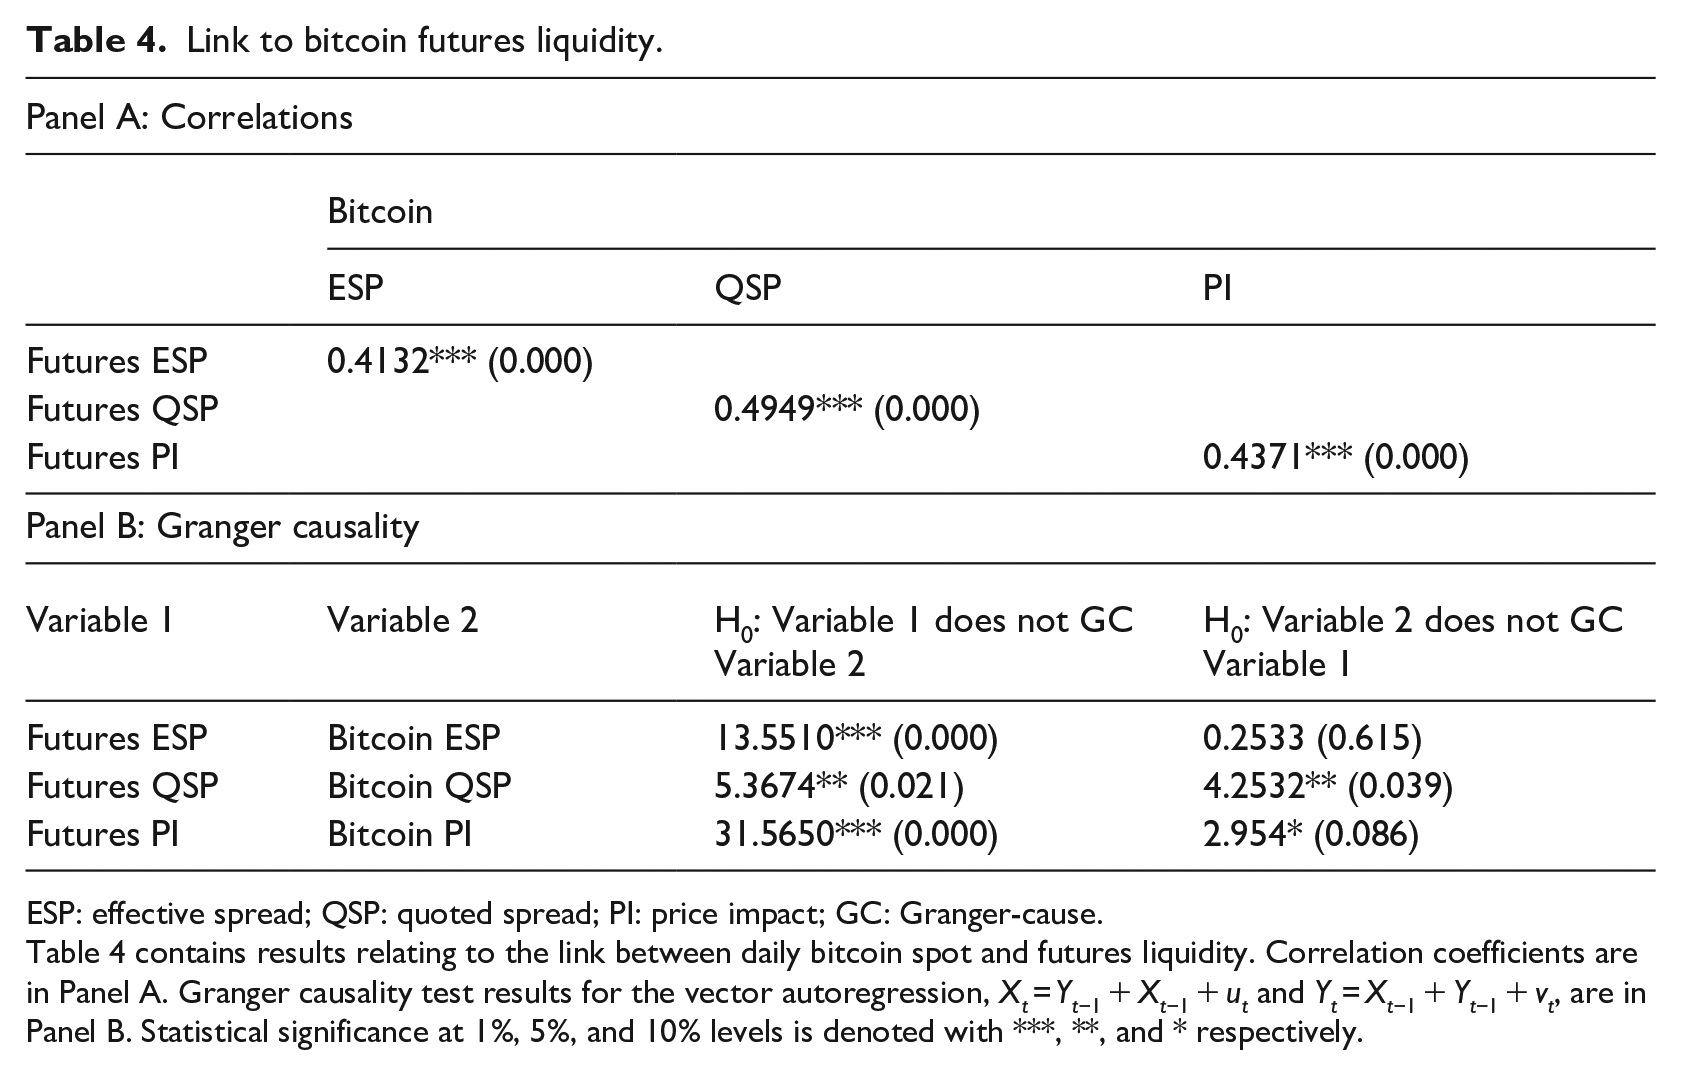
ESP: effective spread; QSP: quoted spread; PI: price impact; GC: Granger-cause.
Table 4 contains results relating to the link between daily bitcoin spot and futures liquidity. Correlation coefficients are in Panel A. Granger causality test results for the vector autoregression, Xt = Yt−1 + Xt−1 + ut and Yt = Xt−1 + Yt−1 + vt, are in Panel B. Statistical significance at 1%, 5%, and 10% levels is denoted with ***, **, and * respectively.
We follow Chordia et al. (2005) and consider bidirectional causalities using the following vector autoregression


We adopt one lag for each variable in our core tests. However, we also generate results with the optimal lags calculated based on the corrected Akaike information criterion and obtain similar results. Panel B shows futures market bitcoin liquidity Granger-causes the spot bitcoin ESP, QSP, and PI. There is also evidence that causality runs in the opposite direction when QSP and PI are used as liquidity measures.
We now turn our attention to the extent to which bitcoin liquidity is influenced by factors that have been shown to affect stock liquidity, which has an important implication on the degree of integration between bitcoin exchanges and traditional financial markets. Brunnermeier and Pedersen (2009) suggest that the ability of traders to obtain funding influences the provision of liquidity. The authors use the TED spread as a proxy for funding liquidity. We follow this approach and find a consistent and robust link between the TED spread and bitcoin liquidity. As shown in Table 5, there is a consistent and positive impact of the TED spread on bitcoin ESP, QSP and PI measures. Despite increases in evidence of TED spread leading to lower liquidity, higher VIX tends to increase bitcoin liquidity. VIX is regularly used as a proxy for uncertainty and investor fear (e.g. Nagel, 2012). Our results support the view that bitcoin may be considered a weak safe-haven asset (e.g. Shahzad et al., 2019).
Other liquidity determinants.
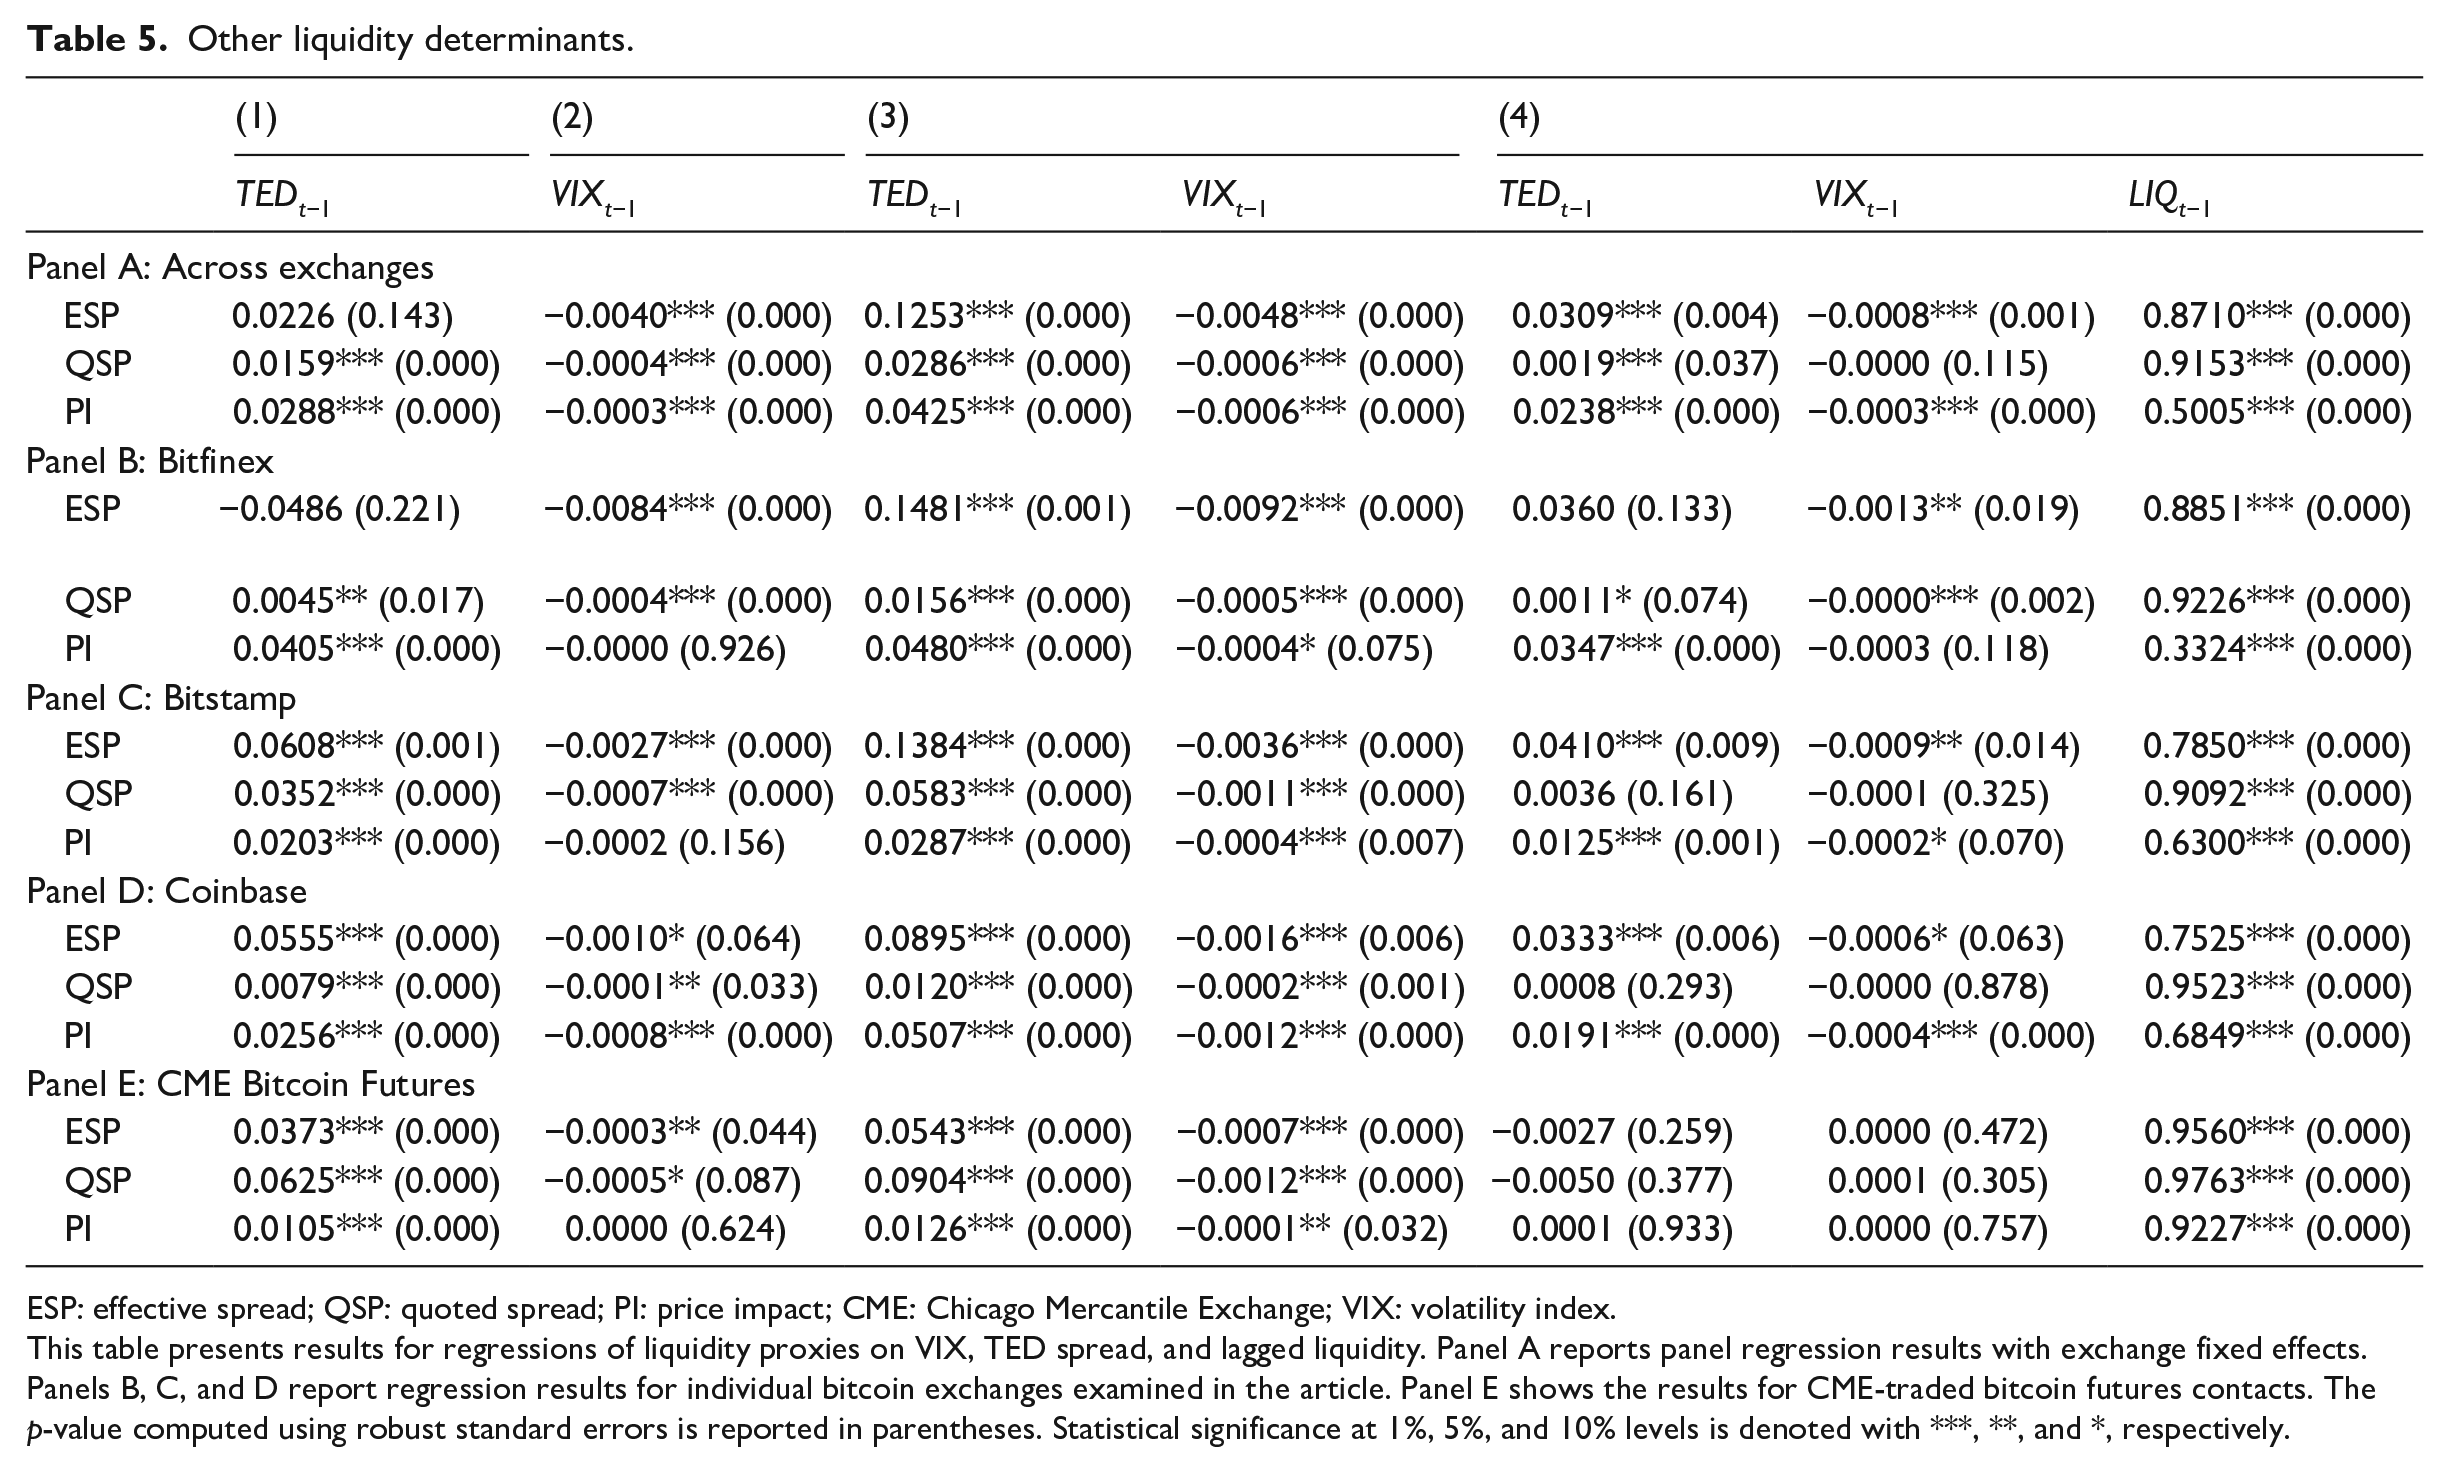
ESP: effective spread; QSP: quoted spread; PI: price impact; CME: Chicago Mercantile Exchange; VIX: volatility index.
This table presents results for regressions of liquidity proxies on VIX, TED spread, and lagged liquidity. Panel A reports panel regression results with exchange fixed effects. Panels B, C, and D report regression results for individual bitcoin exchanges examined in the article. Panel E shows the results for CME-traded bitcoin futures contacts. The p-value computed using robust standard errors is reported in parentheses. Statistical significance at 1%, 5%, and 10% levels is denoted with ***, **, and *, respectively.
4.4. Market liquidity and market efficiency
We consider whether there is a link between the liquidity of spot bitcoin and price efficiency within this market. Chordia et al. (2008) find that short-horizon return predictability, which they point out is an inverse measure of market efficiency, declines when liquidity is higher. Higher liquidity appears to stimulate arbitrage activity, which results in markets becoming more efficient.
We investigate the influence of liquidity on returns using the following predictive regression

where Returnt is the return in a 5-minute interval, OIBt−1 is the order imbalance in bitcoin units in interval t−1, and ILDt−1 is a dummy variable that equals 1 if the daily ESP is at least 1 standard deviation above the detrended expected ESP for the trading day and zero otherwise.
We run equation (5) across spot bitcoin exchanges in Panel A and separately for each exchange in Panels B to D of Table 6. Then Panel E presents the results for CME-traded bitcoin futures. The coefficient of OIB is positive and statistically significant in each set of results. This finding indicates that 5-minute returns can be positively predicted by OIB in the previous interval, or, put another way, there is evidence of inefficiency in bitcoin pricing. The results also show strong evidence that the positive impact of OIB on bitcoin returns is more pronounced on days when bitcoin liquidity is relatively low at the 1% significance level. Our finding supports the notion of stronger predictability or more inefficient pricing when liquidity is abnormally low (i.e. spreads and PI are unusually high) and suggests that trade orders are likely to play a more significant role in the absence of fundamentals. Results of Table 6 highlight the pricing inefficiency in both spot and futures markets for bitcoin.
Liquidity and market efficiency.
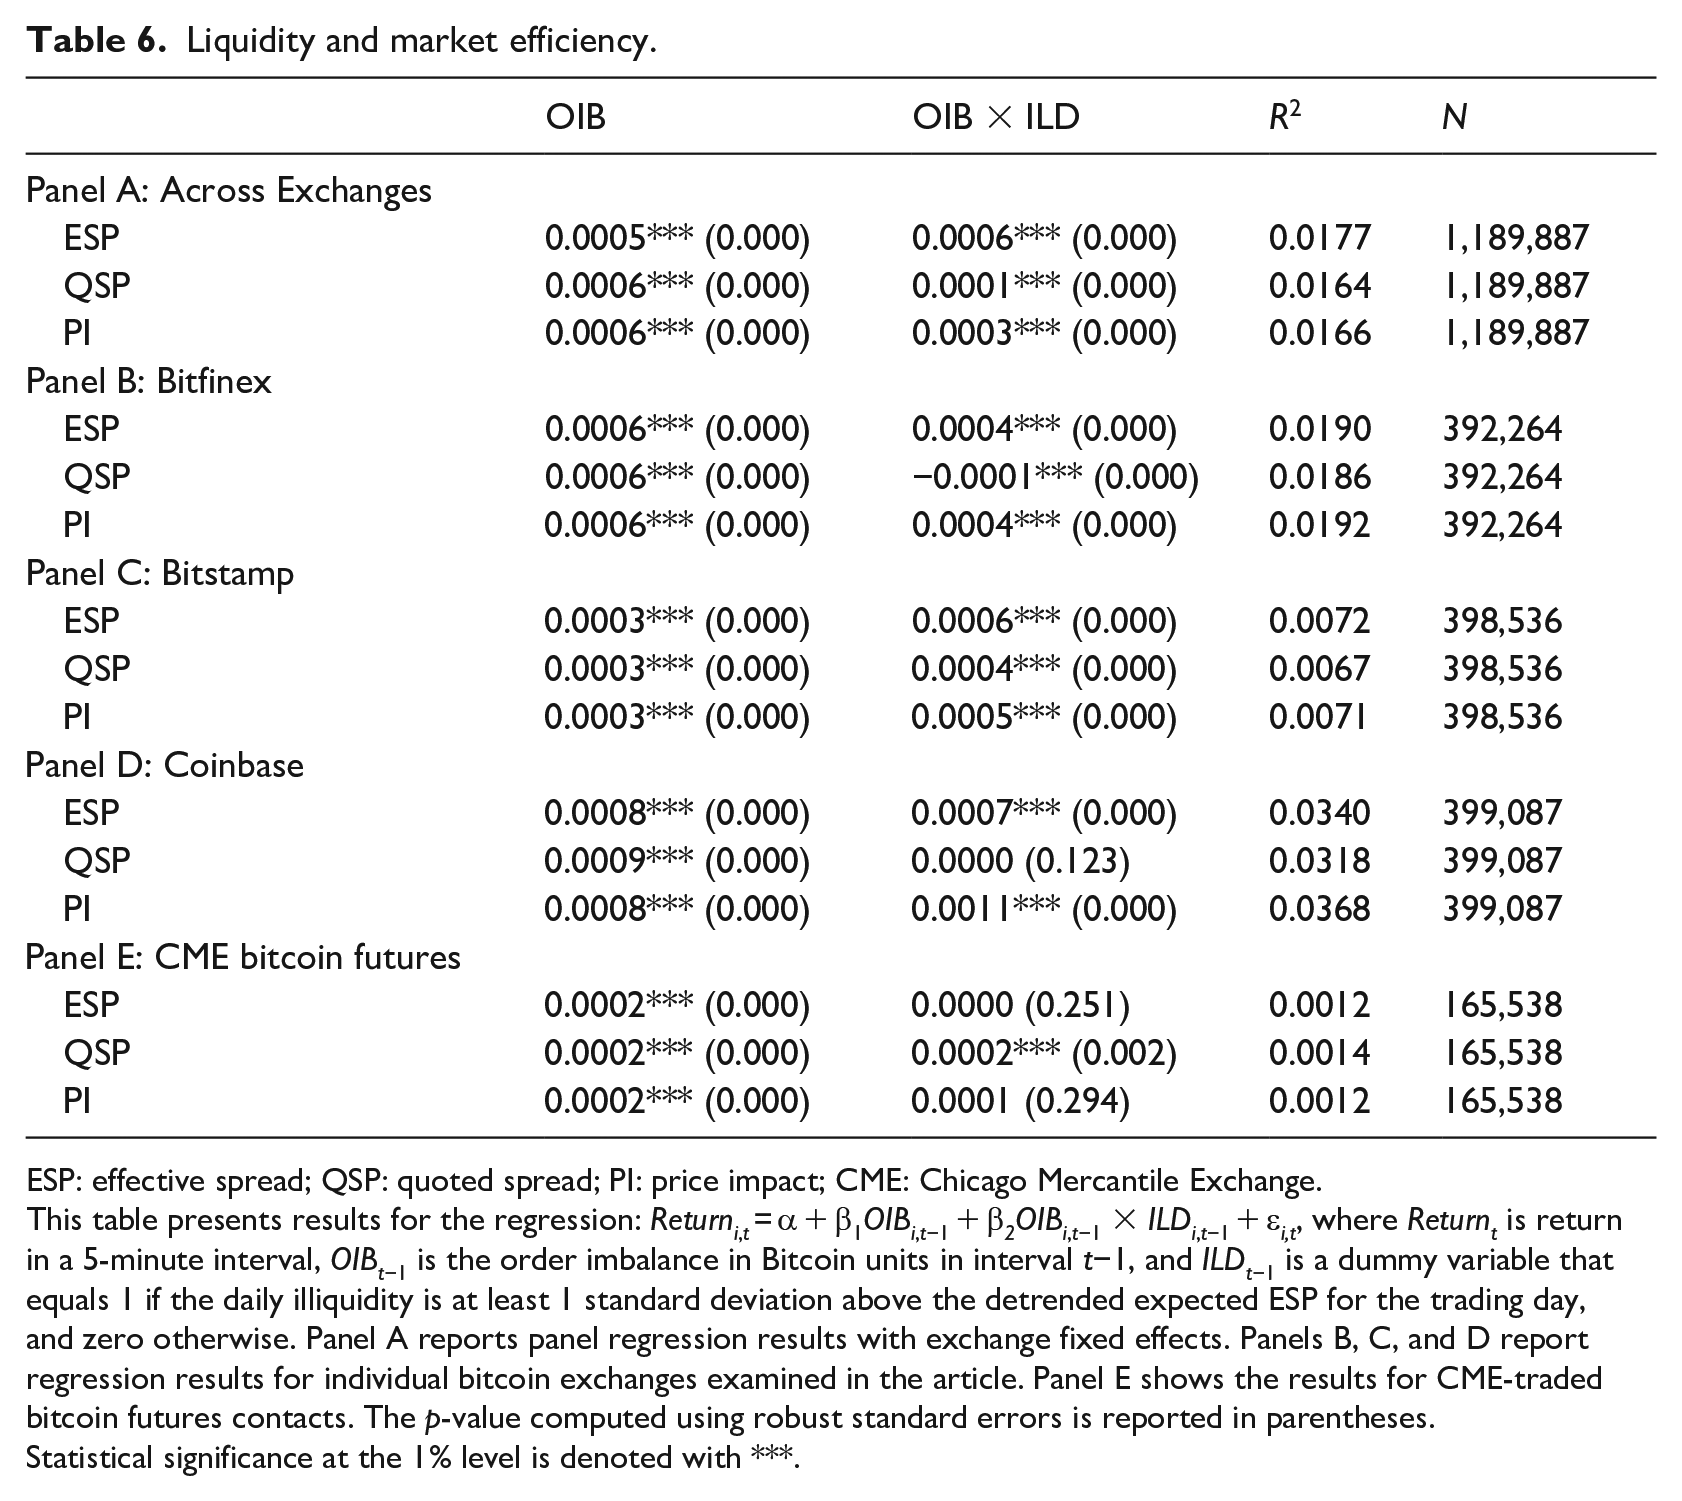
ESP: effective spread; QSP: quoted spread; PI: price impact; CME: Chicago Mercantile Exchange.
This table presents results for the regression: Returni, t = α + β1OIBi,t−1 + β2OIBi,t−1 × ILDi,t−1 + εi,t, where Returnt is return in a 5-minute interval, OIBt−1 is the order imbalance in Bitcoin units in interval t−1, and ILDt−1 is a dummy variable that equals 1 if the daily illiquidity is at least 1 standard deviation above the detrended expected ESP for the trading day, and zero otherwise. Panel A reports panel regression results with exchange fixed effects. Panels B, C, and D report regression results for individual bitcoin exchanges examined in the article. Panel E shows the results for CME-traded bitcoin futures contacts. The p-value computed using robust standard errors is reported in parentheses.
Statistical significance at the 1% level is denoted with ***.
4.5. Market liquidity and crash risk
Crash risk has attracted the attention of researchers in recent times due to sharp declines in prices of a range of prominent financial assets. For example, Callen and Fang (2015) examine crash risk in stock returns, while Chernov et al. (2018) document crash risk in currency returns. There is also evidence of a link between liquidity and extreme volatility or price crashes. For instance, Dow and Han (2018) suggest that, when informed market participants are liquidity constrained, prices become less informative, which leads to a decrease in valuations by uninformed investors, who become reluctant to provide capital to support the price. This can then lead to fire sales and sharp price declines. 15 We consider whether there is a link between spot bitcoin crash risk and bitcoin liquidity and liquidity risk as follows

Following Hutton et al. (2009) and Chang et al. (2017), we define crash days as those with returns that are 3.09 standard deviations (approximately 0.1th percentile in a normal distribution) below its mean value. 16 CRASHi,t is a crash month dummy variable equal to 1 if the BTCUSD pair experiences one or more crash days in a given month. ILLIQi, t and ILLIQ_RISKi, t are the liquidity measure (i.e. ESP, QSP, or PI as indicated in the first column of Table 7) and standard deviation of the liquidity measure on day t, respectively.
Liquidity and crash risk.
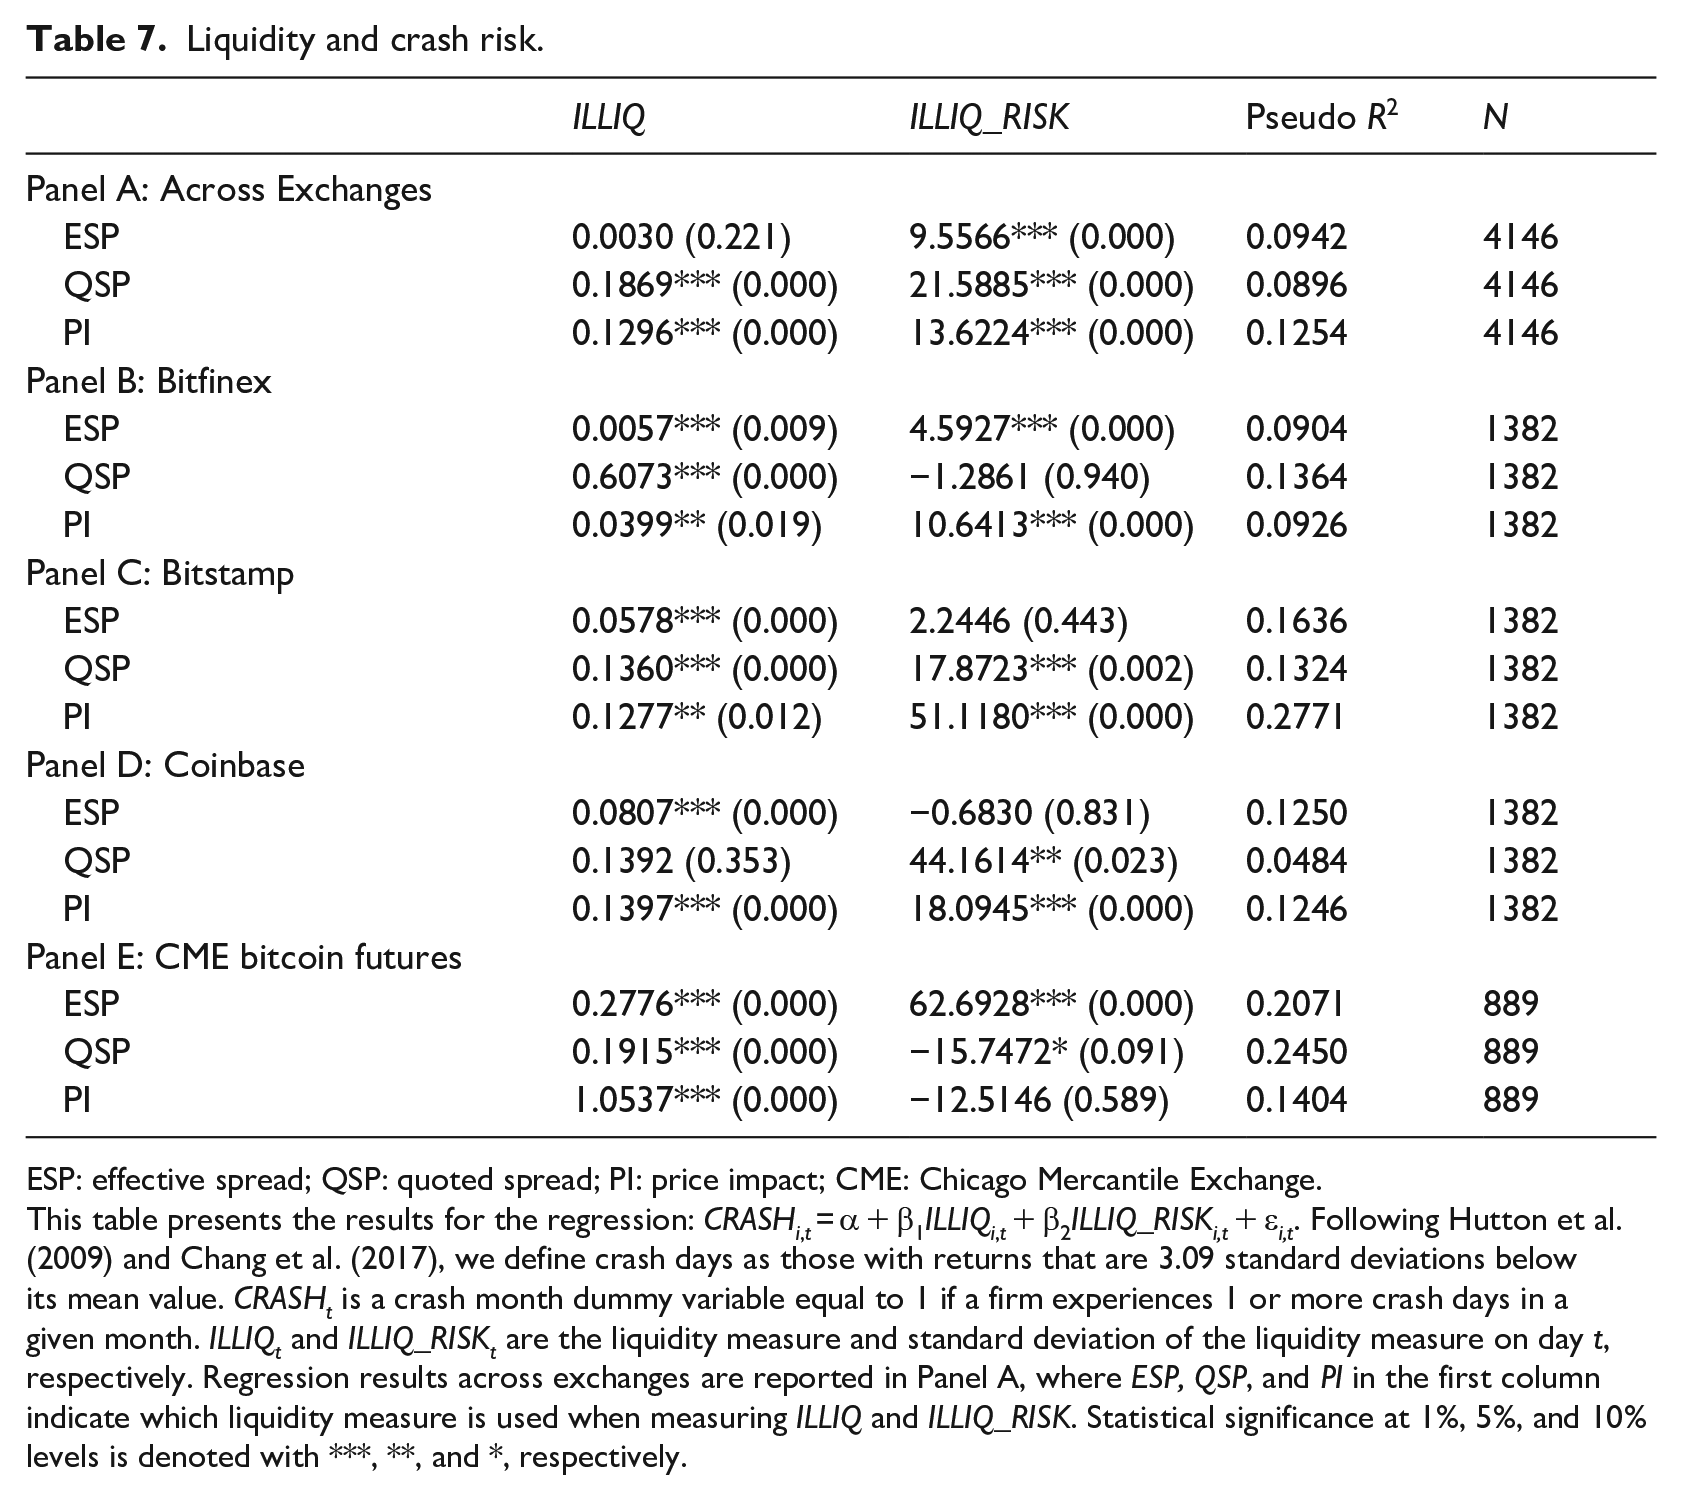
ESP: effective spread; QSP: quoted spread; PI: price impact; CME: Chicago Mercantile Exchange.
This table presents the results for the regression: CRASHi, t = α + β1ILLIQi, t + β2ILLIQ_RISKi,t + εi,t. Following Hutton et al. (2009) and Chang et al. (2017), we define crash days as those with returns that are 3.09 standard deviations below its mean value. CRASHt is a crash month dummy variable equal to 1 if a firm experiences 1 or more crash days in a given month. ILLIQt and ILLIQ_RISKt are the liquidity measure and standard deviation of the liquidity measure on day t, respectively. Regression results across exchanges are reported in Panel A, where ESP, QSP, and PI in the first column indicate which liquidity measure is used when measuring ILLIQ and ILLIQ_RISK. Statistical significance at 1%, 5%, and 10% levels is denoted with ***, **, and *, respectively.
Bitcoin crashes occur more frequently than in stocks. The results in Table 7 indicate that an increase in illiquidity corresponds to an increase in crash risk across liquidity measures. An increase in illiquidity risk coincides with an increase in crash risk. This relation is evident in both spot and futures markets. Overall, we conclude that illiquidity contributes to crash risk. 17
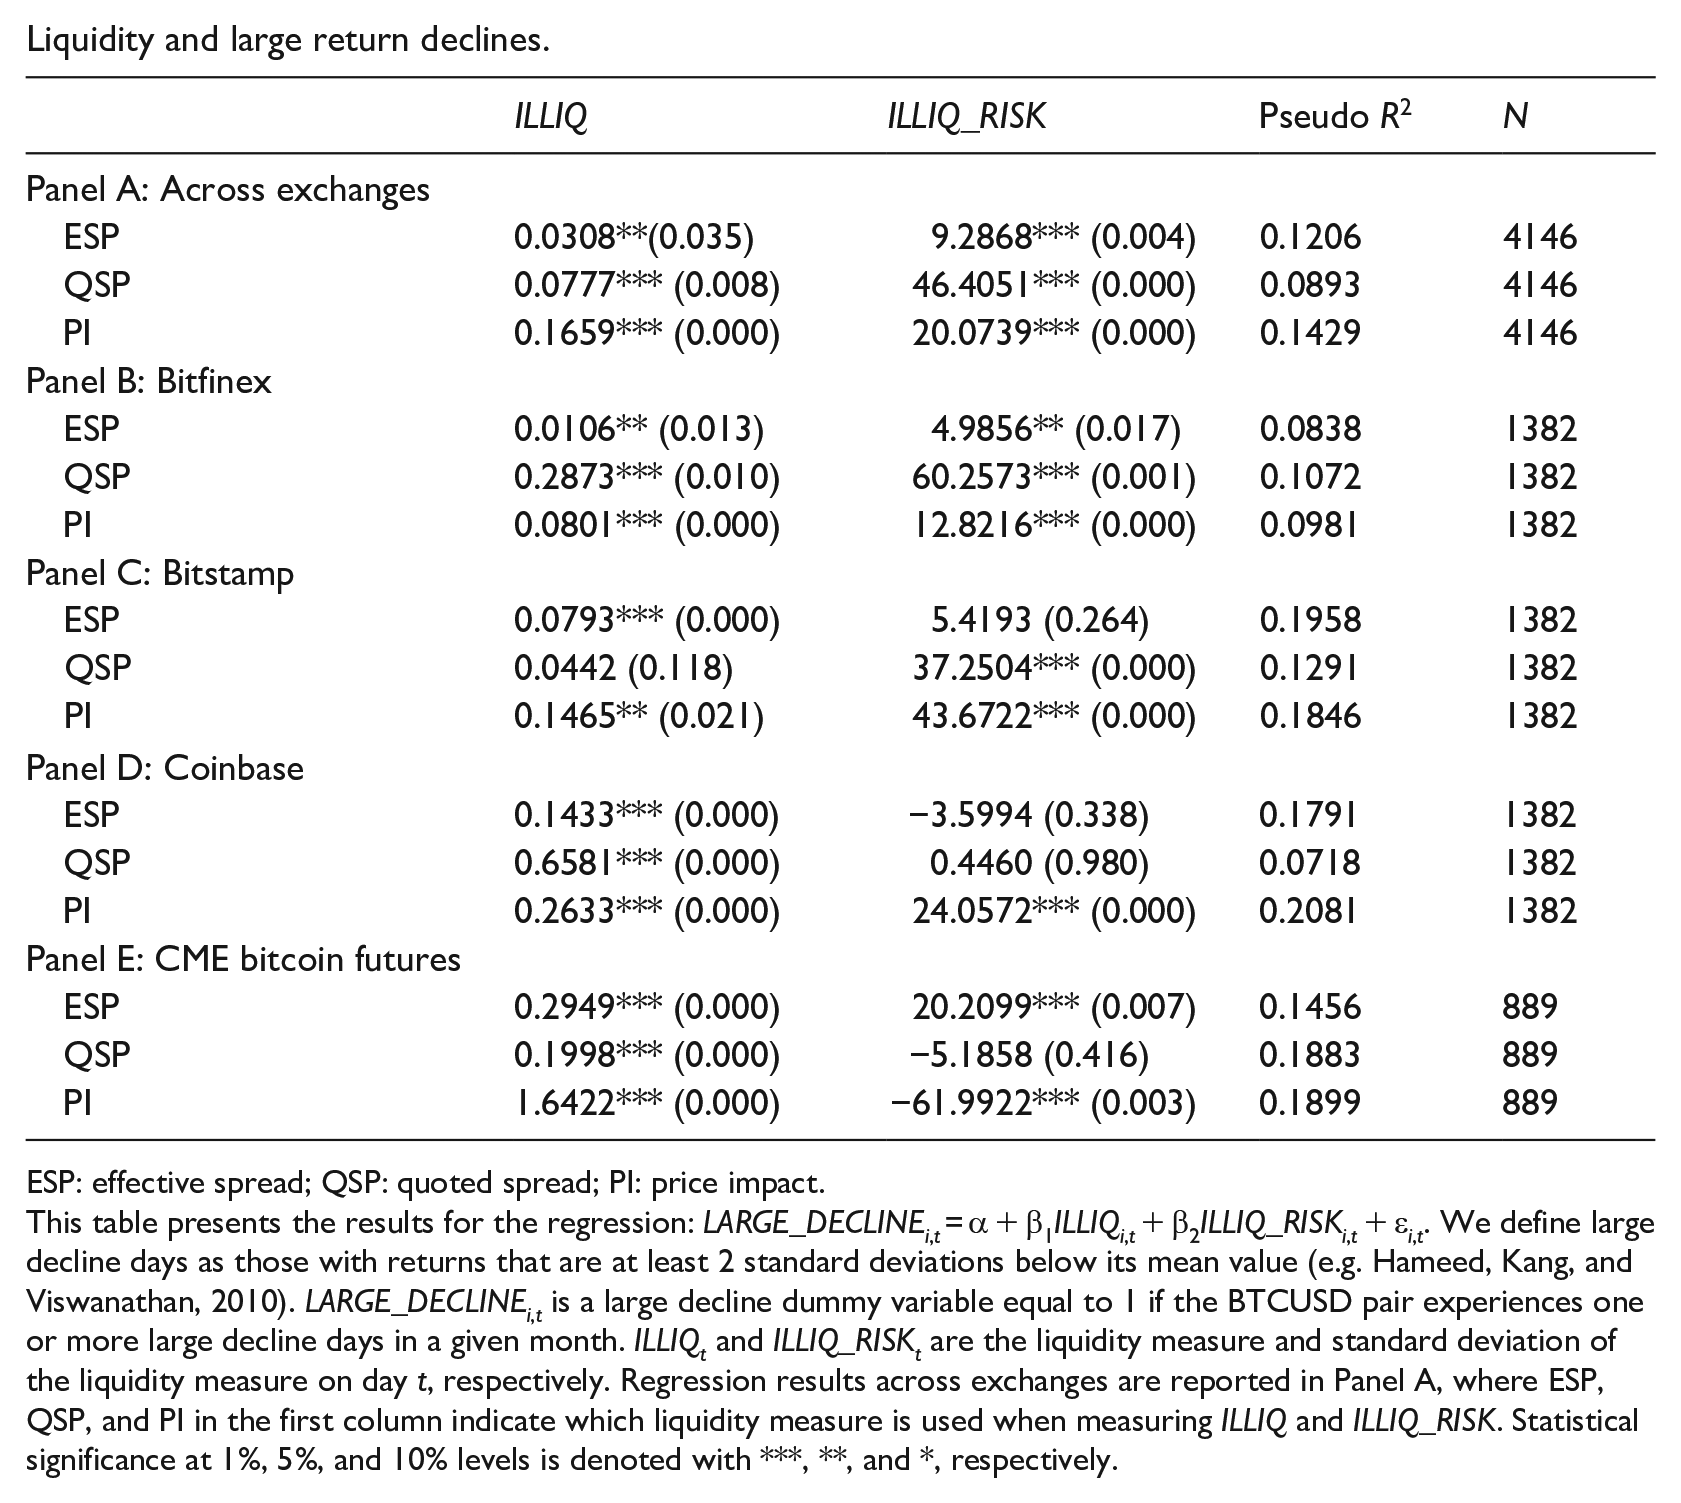
Furthermore, we define large decline days as those with returns at least 2 standard deviations below their mean value (e.g. Hameed et al., 2010). We then replace CRASHi, t in equation (6) with LARGE_DECLINEi, t , a large decline dummy variable equal to 1 if the BTCUSD pair experiences one or more large decline days in a given month. Our results become stronger, as indicated in Appendix 3.
5. Conclusion
Bitcoins are growing in popularity as a financial asset and means of transacting; however, little is known about its liquidity. This article investigates whether spot and futures bitcoin liquidity acts like that of a traditional financial asset. Using a database of intraday spot bitcoin data over the 2017–2020 period, we document variation in liquidity across different bitcoin exchanges, with the average QSP ranging from 0.0082% at Coinbase to 0.0805% at Bitstamp.
There is strong evidence of a systematic component to spot bitcoin liquidity, despite the fragmented nature of the market and lack of fundamentals in cryptocurrencies. We find strong correlations between spot and futures bitcoin liquidity. Changes in bitcoin futures liquidity consistently Granger-causes changes in spot bitcoin liquidity. Our finding is consistent with the existing literature showing that participants at derivative markets help improve the efficiency of the underlying assets. Moreover, spot and futures bitcoin liquidity can be influenced by factors that have been shown to affect stock liquidity, such as changes in TED spread and VIX, which has implications on the degree of integration between bitcoin and other traditional financial markets.
We also show that liquidity plays an important role in price formation in spot and futures bitcoin markets. Price discovery is generally slower in the bitcoin market than what has been documented in stock markets. We show that all our BTCUSD pairs have inefficient pricing at 5-minute intervals, which is also influenced by liquidity. Pricing inefficiency lasts longer when bitcoin markets are more illiquid. Liquidity also contributes to bitcoin crash risk and large declines in returns. Increases in both illiquidity and illiquidity risk can be associated with higher incidences of crash risk in bitcoin markets.
Footnotes
Appendix 1
Appendix 2
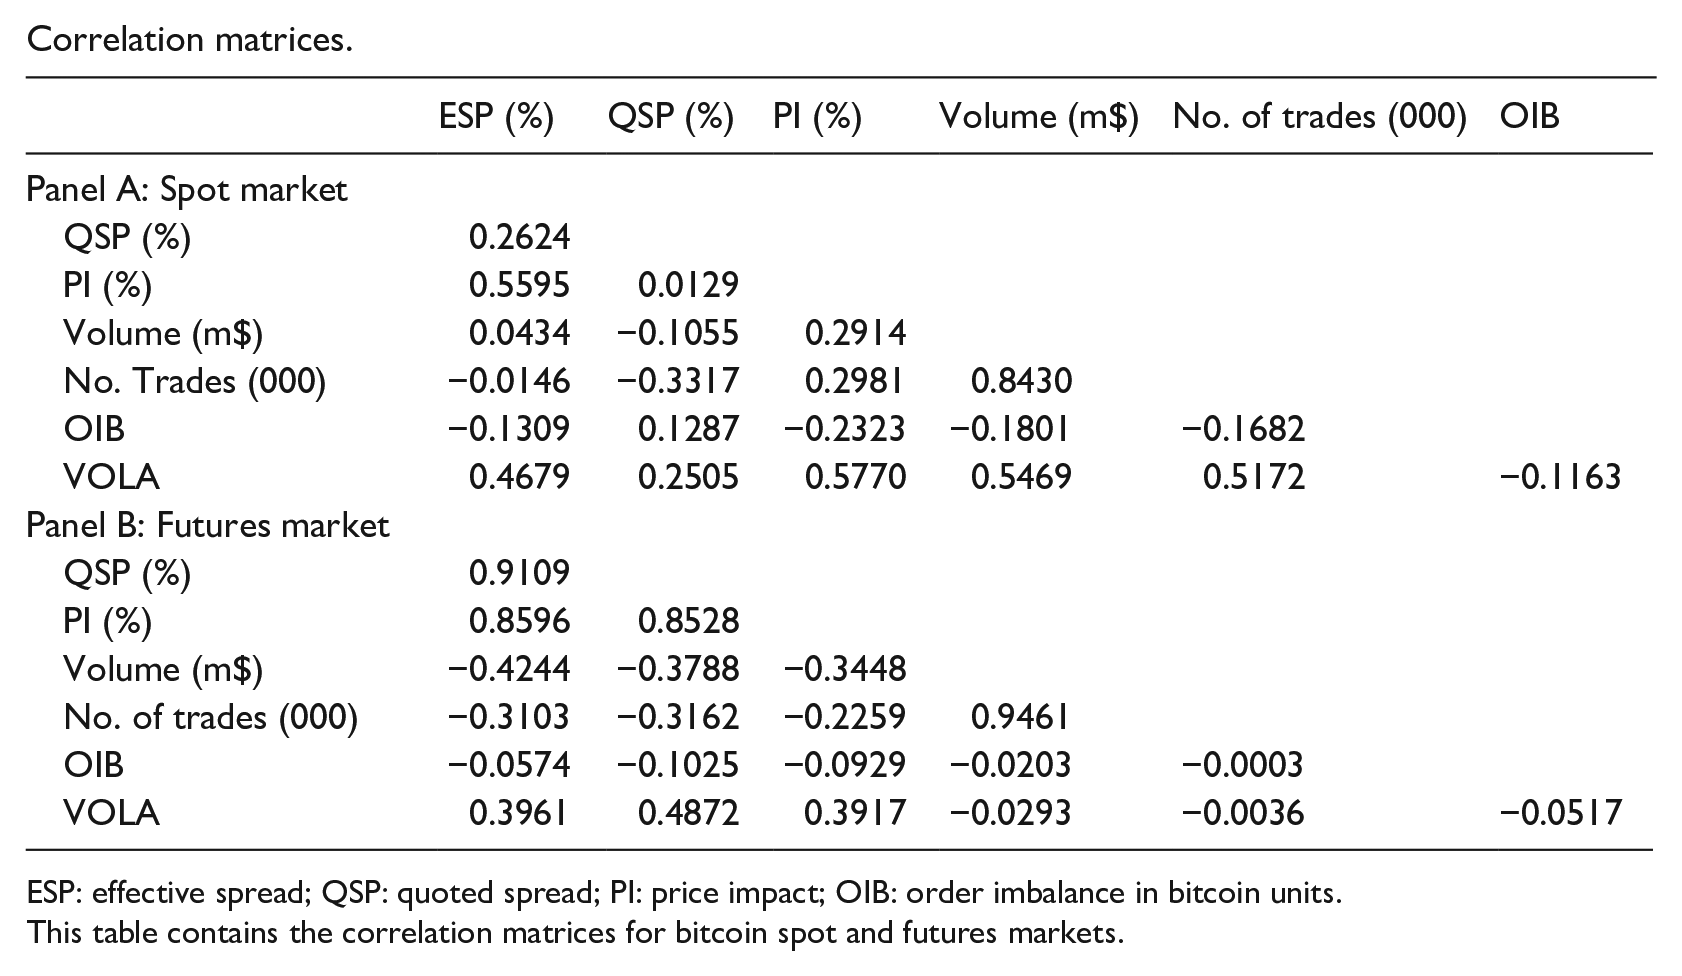
Correlation matrices.
| ESP (%) | QSP (%) | PI (%) | Volume (m$) | No. of trades (000) | OIB | |
|---|---|---|---|---|---|---|
| Panel A: Spot market | ||||||
| QSP (%) | 0.2624 | |||||
| PI (%) | 0.5595 | 0.0129 | ||||
| Volume (m$) | 0.0434 | −0.1055 | 0.2914 | |||
| No. Trades (000) | −0.0146 | −0.3317 | 0.2981 | 0.8430 | ||
| OIB | −0.1309 | 0.1287 | −0.2323 | −0.1801 | −0.1682 | |
| VOLA | 0.4679 | 0.2505 | 0.5770 | 0.5469 | 0.5172 | −0.1163 |
| Panel B: Futures market | ||||||
| QSP (%) | 0.9109 | |||||
| PI (%) | 0.8596 | 0.8528 | ||||
| Volume (m$) | −0.4244 | −0.3788 | −0.3448 | |||
| No. of trades (000) | −0.3103 | −0.3162 | −0.2259 | 0.9461 | ||
| OIB | −0.0574 | −0.1025 | −0.0929 | −0.0203 | −0.0003 | |
| VOLA | 0.3961 | 0.4872 | 0.3917 | −0.0293 | −0.0036 | −0.0517 |
ESP: effective spread; QSP: quoted spread; PI: price impact; OIB: order imbalance in bitcoin units.
This table contains the correlation matrices for bitcoin spot and futures markets.
Appendix 3
Liquidity and large return declines.
| ILLIQ | ILLIQ_RISK | Pseudo R 2 | N | |
|---|---|---|---|---|
| Panel A: Across exchanges | ||||
| ESP | 0.0308**(0.035) | 9.2868*** (0.004) | 0.1206 | 4146 |
| QSP | 0.0777*** (0.008) | 46.4051*** (0.000) | 0.0893 | 4146 |
| PI | 0.1659*** (0.000) | 20.0739*** (0.000) | 0.1429 | 4146 |
| Panel B: Bitfinex | ||||
| ESP | 0.0106** (0.013) | 4.9856** (0.017) | 0.0838 | 1382 |
| QSP | 0.2873*** (0.010) | 60.2573*** (0.001) | 0.1072 | 1382 |
| PI | 0.0801*** (0.000) | 12.8216*** (0.000) | 0.0981 | 1382 |
| Panel C: Bitstamp | ||||
| ESP | 0.0793*** (0.000) | 5.4193 (0.264) | 0.1958 | 1382 |
| QSP | 0.0442 (0.118) | 37.2504*** (0.000) | 0.1291 | 1382 |
| PI | 0.1465** (0.021) | 43.6722*** (0.000) | 0.1846 | 1382 |
| Panel D: Coinbase | ||||
| ESP | 0.1433*** (0.000) | −3.5994 (0.338) | 0.1791 | 1382 |
| QSP | 0.6581*** (0.000) | 0.4460 (0.980) | 0.0718 | 1382 |
| PI | 0.2633*** (0.000) | 24.0572*** (0.000) | 0.2081 | 1382 |
| Panel E: CME bitcoin futures | ||||
| ESP | 0.2949*** (0.000) | 20.2099*** (0.007) | 0.1456 | 889 |
| QSP | 0.1998*** (0.000) | −5.1858 (0.416) | 0.1883 | 889 |
| PI | 1.6422*** (0.000) | −61.9922*** (0.003) | 0.1899 | 889 |
ESP: effective spread; QSP: quoted spread; PI: price impact.
This table presents the results for the regression: LARGE_DECLINEi, t = α + β1ILLIQi, t + β2ILLIQ_RISKi, t + εi, t . We define large decline days as those with returns that are at least 2 standard deviations below its mean value (e.g. Hameed, Kang, and Viswanathan, 2010). LARGE_DECLINEi, t is a large decline dummy variable equal to 1 if the BTCUSD pair experiences one or more large decline days in a given month. ILLIQt and ILLIQ_RISKt are the liquidity measure and standard deviation of the liquidity measure on day t, respectively. Regression results across exchanges are reported in Panel A, where ESP, QSP, and PI in the first column indicate which liquidity measure is used when measuring ILLIQ and ILLIQ_RISK. Statistical significance at 1%, 5%, and 10% levels is denoted with ***, **, and *, respectively.
Acknowledgements
We thank Andrea Bennett, Hamish Anderson, Candie Chang, Jianguo Chen, David Tripe, Martin Young, and seminar participants at Massey University for valuable comments. We also acknowledge numerous valuable comments from our Editor, Philip Gray, our Associate Editor, Philip Gharghori, and two anonymous referees.
Final transcript accepted 9 December 2021 by Philip Gharghori, (AE Finance)
Funding
The author(s) disclosed receipt of the following financial support for the research, authorship, and/or publication of this article: Financial support by La Trobe University ASSC Research Start-up Grant is gratefully acknowledged.