
Abstract
As digital access to all sources of information continues to expand at an accelerating rate, libraries around the world are working to transform themselves in response to their changing role in the communities they serve and support. Academic libraries face particular challenges as a generation of students enters university having embraced online, mobile, anytime, anywhere access to information. At the center of an academic community that increasingly values intellectual collaboration among faculty and students, and learning in and out of the classroom, the 21st century academic library must continually recreate itself as a place that fosters curiosity, engagement, collaboration, and lifelong learning. Typical 20th-century capital investment cycles in academic libraries in the United States were characterized by large-scale once-a-generation investments in facilities expansion and enhancement. In the first decade of the 21st century the drive to transform is greater than ever before, but there is less capital funding available, increasing the pressure on institutions to reduce the capital investment cycle time in order to remain responsive to rapid changes in technology, pedagogy, scholarship, and user expectations. The end of any project is the start of evaluation and planning for the next cycle of change and investment. This paper will explore and discuss library efforts at two major academic institutions in the United States, one receiving public funds and one private, to develop innovative ways to evaluate library spaces, functions, services, operations and maintenance. The speakers will highlight projects intended to operationalize capital investment, shorten cycle times and provide incremental interventions, within a general framework of planning big and implementing small. Data encompass exit counts, occupancy rates, and peer comparisons; data sources include surveys, focus groups, and simulations. Particular projects and initiatives will address user needs, program innovation, and facilities enhancement, with the aim of continually refreshing and renewing library spaces that enhance learning, inspire scholarship, and foster community.
Introduction
Academic libraries are reinventing themselves as learning spaces for 21st century students and faculty. Cognitive research informs and shapes emerging pedagogies to foster problem-based, experiential, active learning. Our campuses and parent institutions are working hard to understand and respond to the implications of these new relationships among learners, learning experiences and learning spaces.
Academic libraries are increasingly willing to characterize their communities of users as ‘customers’; some are prepared to take another page from business in an attempt to transform themselves from service providers to collaborative partners in learning and research, embracing and deploying powerful technologies for distribution, access and manipulation of massive quantities of digital information in a variety of formats–print, image and sound. The virtual library accessible from the “anywhere, anytime” of the Internet, is complemented by the human scale and human experience of the library as place, providing a unique user experience that creates and supports the academic community, the basis for the modern residential campus.
The customer experience
In The Experience Economy Pine and Gilmore propose a model for understanding the transition they see underway from a goods and services economy to an experience economy. The service economy supplanted the goods-based economy in your lifetime. We’re now moving into the experience economy, where the target “commodity” is your experience as a customer. Goods are useful and service is helpful, but experiences are memorable. Experiences leave a lasting impression and can be transformative.
In the information world, data is a commodity, the raw material of research and learning. Compiling and analyzing the raw material of data, information aggregators package and deliver information goods, “tangible items sold to largely anonymous customers who buy them off the shelf, from the lot, out of the catalog, and so on.” 1 Libraries select and acquire these information goods (books, journals, databases, other resources) as the foundation for programs of services, intangible activities customized to the individual request of known clients; services employ an estimated 80 percent of the workforce. 2 But the dominance of services in the modern economy leads to their commoditization; the Internet is the greatest force for commoditization, for both goods and services. Automation promotes disintermediation; the end user is increasingly able to go “straight to the source” of information, decreasing reliance on intermediaries such as libraries. 3 Will the end result be to take libraries completely out of the equation? What value do libraries add?
Pine and Gilmore suggest that services can be differentiated based on the quality of the customer experience. The focus on the customer experience occurs whenever a company intentionally uses services as the stage and goods as props to engage an individual. While goods are tangible and services intangible, experiences are memorable. 4 Figure 1 summarizes this transformation of the customer relationship in libraries.

Transformation of the customer relationship in libraries.
When the patron’s mode of interaction with the library was the transaction, the library’s goal was control, and its primary role was that of gatekeeper, with the aim of exercising effective stewardship over limited, shared resources. With information packaged and deployed in print-on-paper physical containers (books and journals), the library worked to organize and manage scarce physical resources, focusing on policies and rules governing access and use; the library loaned and the patron borrowed. The library’s success was measured in terms of its investments in the resources it made available, the inputs in the information transaction (such as volume count, number of subscriptions, total staff, or total expenditures).
When the library patron evolved into the library customer, the primary mode of interaction became service. The library’s goal was the provision of customer assistance, connecting the prepared user with the appropriate source of information or set of resources. The library’s success was measured not in terms of what it had (inputs) but of what it did, the activities it supported, its outputs (such as circulation transactions, reference questions answered, classes taught and students served).
In the transition to the experience economy the library’s resources and services (its inputs and outputs) are used to set the stage for the customer experience. When the library customer is seen as a guest (in the all-inclusive resort sense, rather than the hotel/motel or restaurant sense), the library begins to pay attention to all the factors that contribute to the quality of the total user experience. Library staff become collaborative partners, setting the stage and attending to the library’s guests on a number of levels. The library’s success is measured not by what it has or what it does, by how it’s used or the activities it supports, but what happens as a result of those activities and encounters, the impacts or outcomes of what goes on in the library (such as fostering student learning success, supporting faculty productivity, and enhancing institutional reputation).
After the library deploys its resources in support of its activities, the question becomes one of results: What difference has it made? Transactions are useful, service is helpful, but experience is memorable–and potentially transformative.
Measuring success
Libraries count. We count volumes added and volumes withdrawn, subscriptions received and back issues bound, total circulation and gate count. We use this data to let our user communities and our funding agencies know what we’re doing and, perhaps more importantly, how well we’re doing. We compare our present to our past to document our growth, and justify our requests for ongoing support or additional resources. We compare our own library to other libraries, to demonstrate our success or highlight our shortcomings. We plan for the future by projecting growth and setting measurable goals.
The ARL Statistics is an annual data series that describes the collections, expenditures, staffing and service activities for the more than 120 member libraries of the Association of Research Libraries (ARL). The whole data series from 1908 to the present represents the oldest and most comprehensive continuing library statistical series in North America. 5 For most of its history, the ARL Statistics has reported data on library inputs, such as total volumes in collection, volumes added, serials received, number of staff, and expenditures in broad categories. In response to a call for more meaningful and relevant measures of library activity, in the mid-1990s ARL added a handful of output measures to its annual survey, including number of reference transactions and number of classes taught. 6
More recently, in response to increased demands for institutional accountability, research libraries are being challenged to provide measures that document their contributions to teaching, research, scholarship, and community service. ARL’s Statistics & Measurement program is supporting member efforts to develop new models for measurement that address issues of service quality, electronic resource usage, and outcomes assessment. In 1999, the ARL membership endorsed the “New Measures Initiative,” aimed in part to develop tools for comprehensive collection, compilation and reporting of outcome measures, including surveys of user satisfaction and measures of service effectiveness. 7 One of the first surveys to emerge from this effort was the LibQUAL+™ initiative. 8
These new initiatives aim to document the library’s contributions to institutional mission in large part by asking the library’s users what they think about the quality and accessibility of information resources, the friendliness and helpfulness of staff, and the comfort and functional effectiveness of library as place. Local surveys, focus groups, and other sociological and anthropological research protocols bring the authentic voice and observed behavior of the user to the process of designing new types of library spaces. These emergent methodologies for assessing the usefulness and effectiveness of those new spaces are based not solely on traditional measures of investment (inputs) and activity (outputs) but on the library’s influence on enhanced learning and quality research (outcomes). 9
In the broad area of inputs, widely available guidelines ask about the adequacy of space to the intended purpose: Is there enough shelving to house the collection at efficient and effective working density? Are there enough group studies proportionate to the size and pedagogical needs of the student body? In the area of outputs, efforts build on basic activity measures: Is the library used? Are gate counts and occupancy rates commensurate with expectations, and comparable to peers? Is seating generally adequate, and especially during peak demand periods around midterms and finals?
These investments and activities, these inputs and outputs, are tactical and short-term, observable on regular cycles (quarterly, semester to semester, annually), familiar and relatively easy to measure. Outcomes and impacts, on the other hand, are strategic and long term, are often only measurable over several annual cycles, and are more difficult to define and measure validly and reliably. But critical to accountability is the ability to answer the question: When you add up the investment, and review all the activity, what difference did it make?
The customer survey is the cornerstone of outcomes assessment, asking users themselves about their satisfaction with library resources, services, staff and facilities. Student pre- and post-testing can begin to demonstrate the positive value of library instruction and library use. Do students self-report a positive value for certain types of library spaces? Is it possible to demonstrate a correlation between certain types of facilities designed for student group work and the quality of student collaborative projects? Does the library contribute to developing a sense of academic community? What’s the connection between student perceptions of the library as a welcoming and inviting facility, and their self-reported satisfaction with library staff and services? Are users staying away from the library, perhaps going elsewhere, preferring other on-campus or off-campus spaces–and if so, why? The answers to such questions can inform strategic planning, helping to frame initiatives whose implementation period is often measured in years.
Case study: Emory University
Emory University is a private research university in metropolitan Atlanta, Georgia, United States. The University was founded as Emory College in 1836 in Oxford, Georgia by a small group of Methodists, who named the town for the school's prestigious British cousin, and the school itself for Methodist bishop John Emory, who dreamed of an American education that molded character as well as the mind. A land-grant by Asa G. Candler, then president of The Coca-Cola Company, enabled the small college to relocate to metropolitan Atlanta in 1915 where it was chartered as Emory University. The University currently enrolls nearly 14,000 students in nine academic divisions: Emory College of Arts and Sciences, Oxford College, Goizueta Business School, Laney Graduate School, School of Law, School of Medicine, Nell Hodgson Woodruff School of Nursing, Rollins School of Public Health, and the Candler School of Theology.
Libraries at Emory
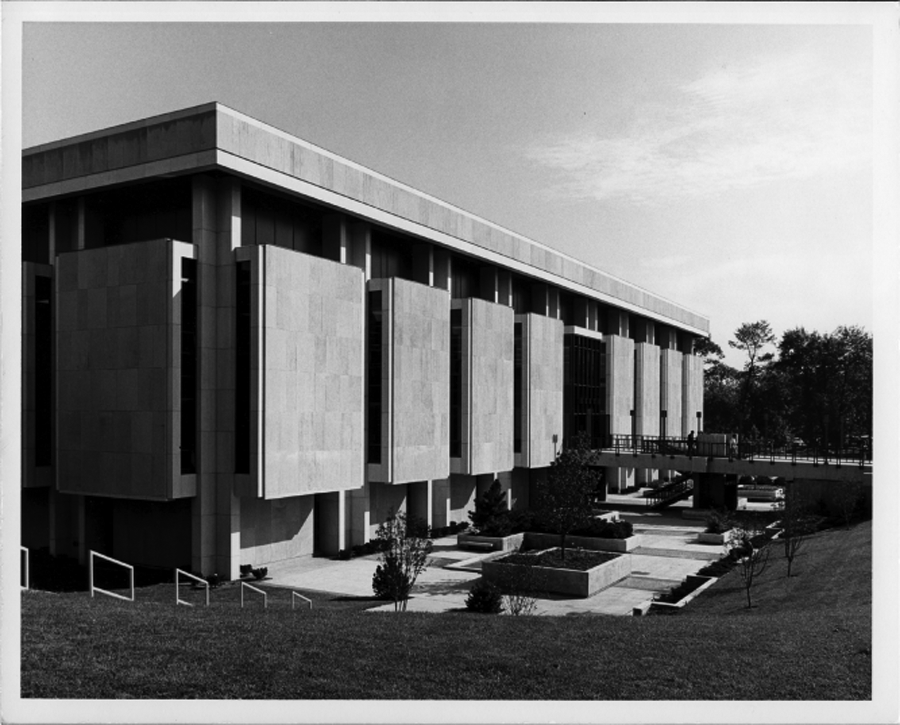
There are libraries for Business, Law, Health Sciences, Special Collections, and Theology. Opened in 1969, the Robert W. Woodruff Library, named for another president of The Coca-Cola Company, is the main library at Emory.
Library development at Emory University has followed a typical cycle of major capital investment about once a generation, typical of 20th century academic libraries in the United States. The 30 year cycle starts with a new library or a major capital investment in an existing library, followed by a decade of optimal operations. Then come 10 years of decreasing satisfaction culminating in a strong call for remediation and action, initiating a capital planning process that typically takes another decade to produce a new library or a major capital investment in an existing library, at which point the cycle begins all over again.
This thirty-year generational cycle of development can be seen in the development of the main library at Emory. The University received its charter in Atlanta in 1915, and began to build its new campus within a few years. The first free-standing main library on campus, the Asa G. Candler Library, opened in 1926. Thirty years later, in the mid-1950s, the Candler Library was partially renovated by adding an infill floor to the grand reading room and two story lobby, increasing assignable square footage but severely compromising the character of these spaces. The inadequacy of this renovation soon became apparent, and 15 years later the campus built a new main library, the Robert W. Woodruff Library, which opened in 1969. The Woodruff Library in turn underwent a major expansion and renovation nearly 30 years later in 1997, creating the Center for Library and Information Resources (CLAIR). In 2003 the renovation of the Candler Library, including the restoration of the lobby and reading room, completed the upgrading and updating of the main library complex.
A major capital investment can have a dramatic influence on the use of library facilities; potentially doubling gate counts. Figure 2 shows 20 years of exit counts in the Woodruff Library. The opening of CLAIR produced an 80 percent increase in the exit count in 1998. Increased traffic counts were also seen after the opening of the new Music and Media Library in 2001 and the library coffee shop in 2005. New spaces and novel services produced enduring in baseline rates of library use.
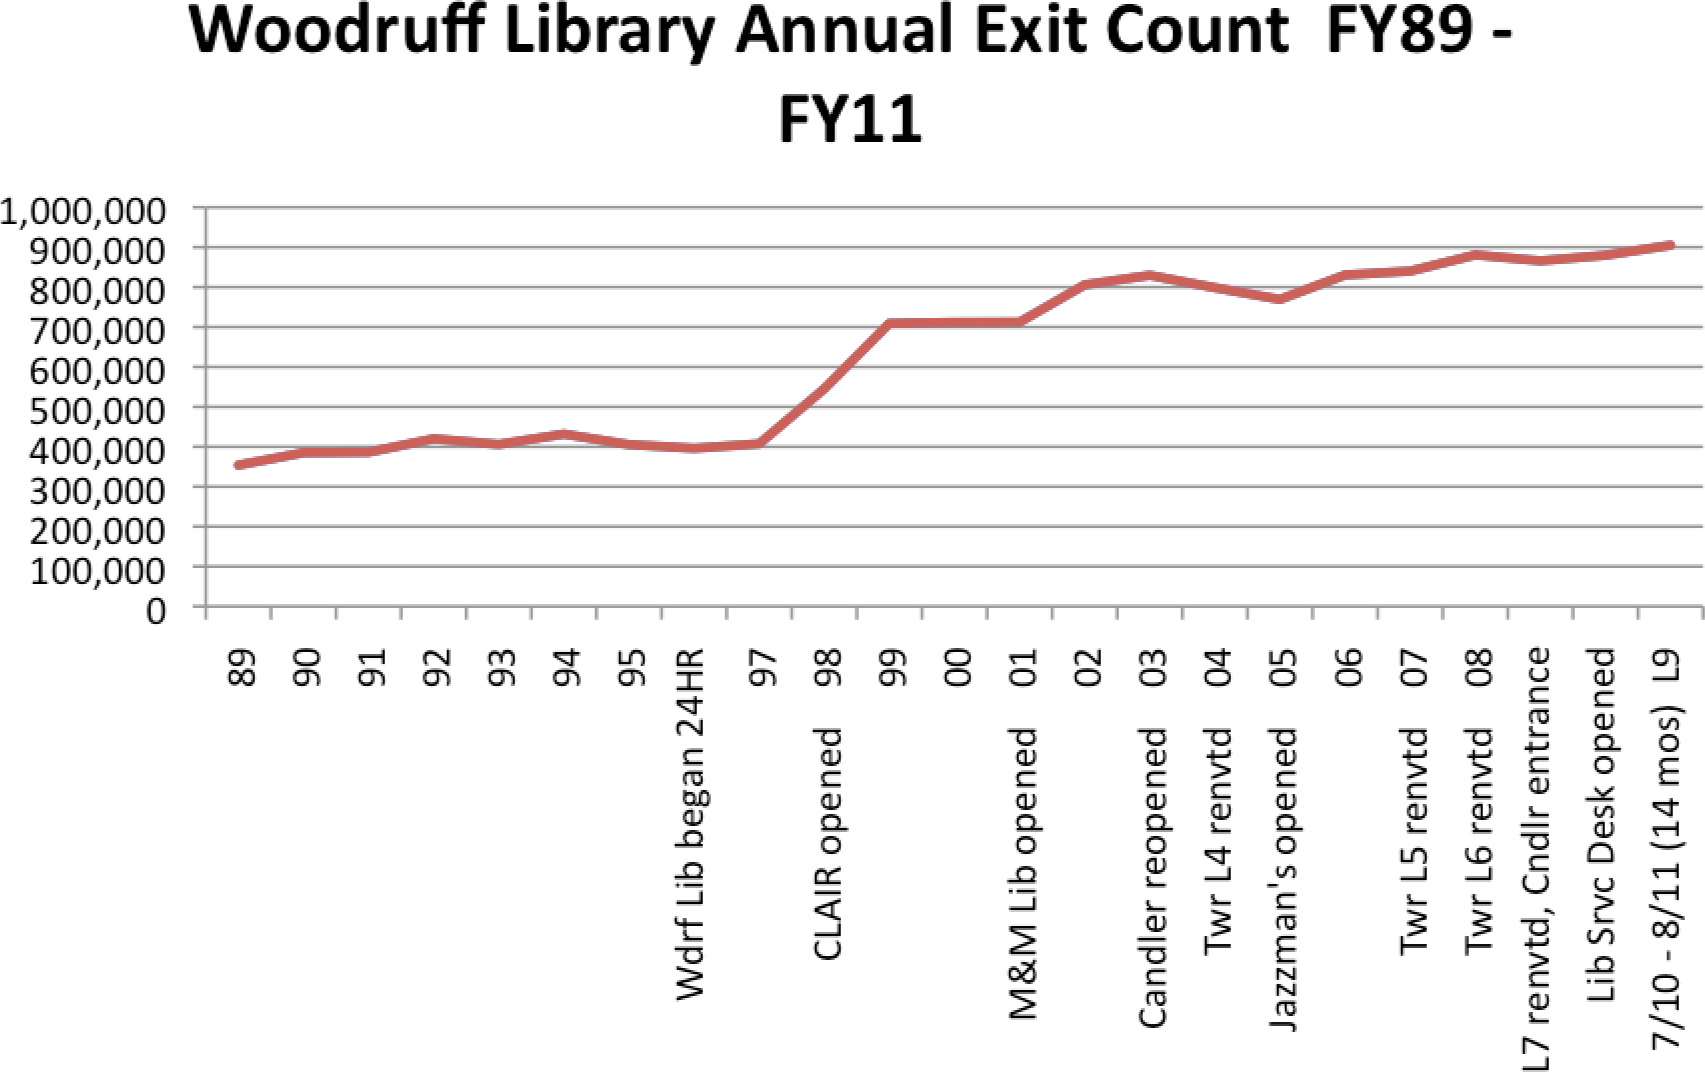
Emory University Main Library annual exit count fiscal year ending 1989 through fiscal year ending 2011.
Shortening the capital cycle: “opportunistic incrementalism”
The pace of change is accelerating. Facilities enhancements that take up to a decade or more to implement do not produce flexible, responsive, innovative library spaces, and can result in library facilities that are “frozen in time”. Planning big and implementing small means a growing number of smaller, phased projects on an annual basis, an approach that Emory’s Director of Libraries Rick Luce has called “opportunistic incrementalism”. Figure 3 shows the number of Emory Library facilities projects for the last five fiscal years with a price tag of at least US$50,000.
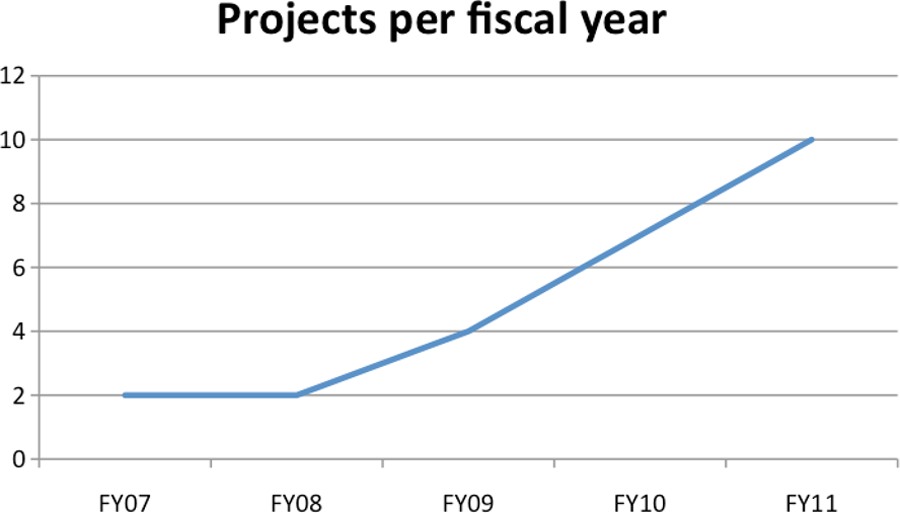
Number of facilities projects, each at least $50K USD, last 5 fiscal years.
Group studies
Data on use formed the basis for decision-making about furnishing group studes. A review of group study use in the main library from Spring 2011 revealed that the two most unconventionally furnished group studies (565 and 756) also had the lowest use. During the summer of 2011, more standard conference tables and chairs were installed to replace the low table and cushions in 656 (affectionately nicknamed the “tea room”, modeled after three sit-on-the-floor individual workstations in the Cox Hall Computing Center at Emory) and the café height table and stools in 756 (which were relocated to L1 Learning Commons).
Figure 4 shows the resulting increase in reservations for these two rooms in the fall of 2011. Note especially the increase in use of 656 (formerly the tea room).

Tech Equipped Group Studies: Change in # of reservations, Spring 2011 to Fall 2011.
The data further suggest that the availability of the newly refurnished 656 and 756 could acount for the drop in traffic in 764 and especially 213. A site visit to group study 213 revealed that it needs a general AV and furniture refurbishment and upgrade. Likewise, observation of the use of 764 suggests that the furniture is less than effective; students move one of the benches to gain better access to the markerboards. Both rooms now appear on the list of proposed renovations.
Hours of operation
Occupancy data helped inform decision-making when Emory students requested that the library offer longer hours. Representatives from Emory University’s Student Government Association approached the Woodruff Library to request an expansion of operating hours to 24 hours per day, seven days per week (24 x 7). At the time of the student request, the main library at Emory opened at 12 noon on Sunday, and remained open 24 hours a day during the week, closing again at 20:00 pm on Friday evening. The students claimed that Emory is the only top 20 library in the US that doesn’t provide 24 x 7 access. The first thing we did was test that claim.
Figure 5 shows total weekly hours of operation across top 20 US universities which revealed three tiers of hours of operation, each tier representing roughly a third of the sample population. The top tier institutions offer at least one library, or space within a library, that is available 24 hours a day, 7 days a week, for at least part of the year, usually the fall and spring semesters. The second tier (including Emory University) offered 24-hour library access at least part of the week, typically five days Monday through Friday. The third tier of libraries did not offer 24-hour access. While Emory does provide 24-hour access five days a week, it is at the bottom of the middle tier (by a small margin), so it seemed reasonable to think there was an opportunity to consider an expansion of hours of operation.

Total weekly hours of operation for 20 large US academic libraries.
On the Library side we had always claimed “we don’t remain open because there’s insufficient demand to justify remaining open”. But how can we say anything about demand if we’re closed? We decided to test our own claim as well.
We remembered that the Library remains open continuously for two and a half weeks at the end of the fall and spring semesters. So we examined the data from the month of April 2011, during part of which we were open continuously, round the clock and through the weekend.
Figure 6 shows that on the days the Library closed at 20:00 pm use fell off quickly beginning around 17:00 pm. On the days the Library remained open 24 hours, use held fairly steady until about twelve midnight, when it began to fall off until it reached its lowest level around 6:00 am or 7:00 am. The top line shows occupancy for the last day of April, during the middle of final exam week, always one of the busiest days of the year. It’s interesting to note that although the occupancy rate is higher on April 30, the pattern of decline after 12 midnight is the same. So overall, although occupancy remains high through midnight, it falls off significantly by around 2:00 am.
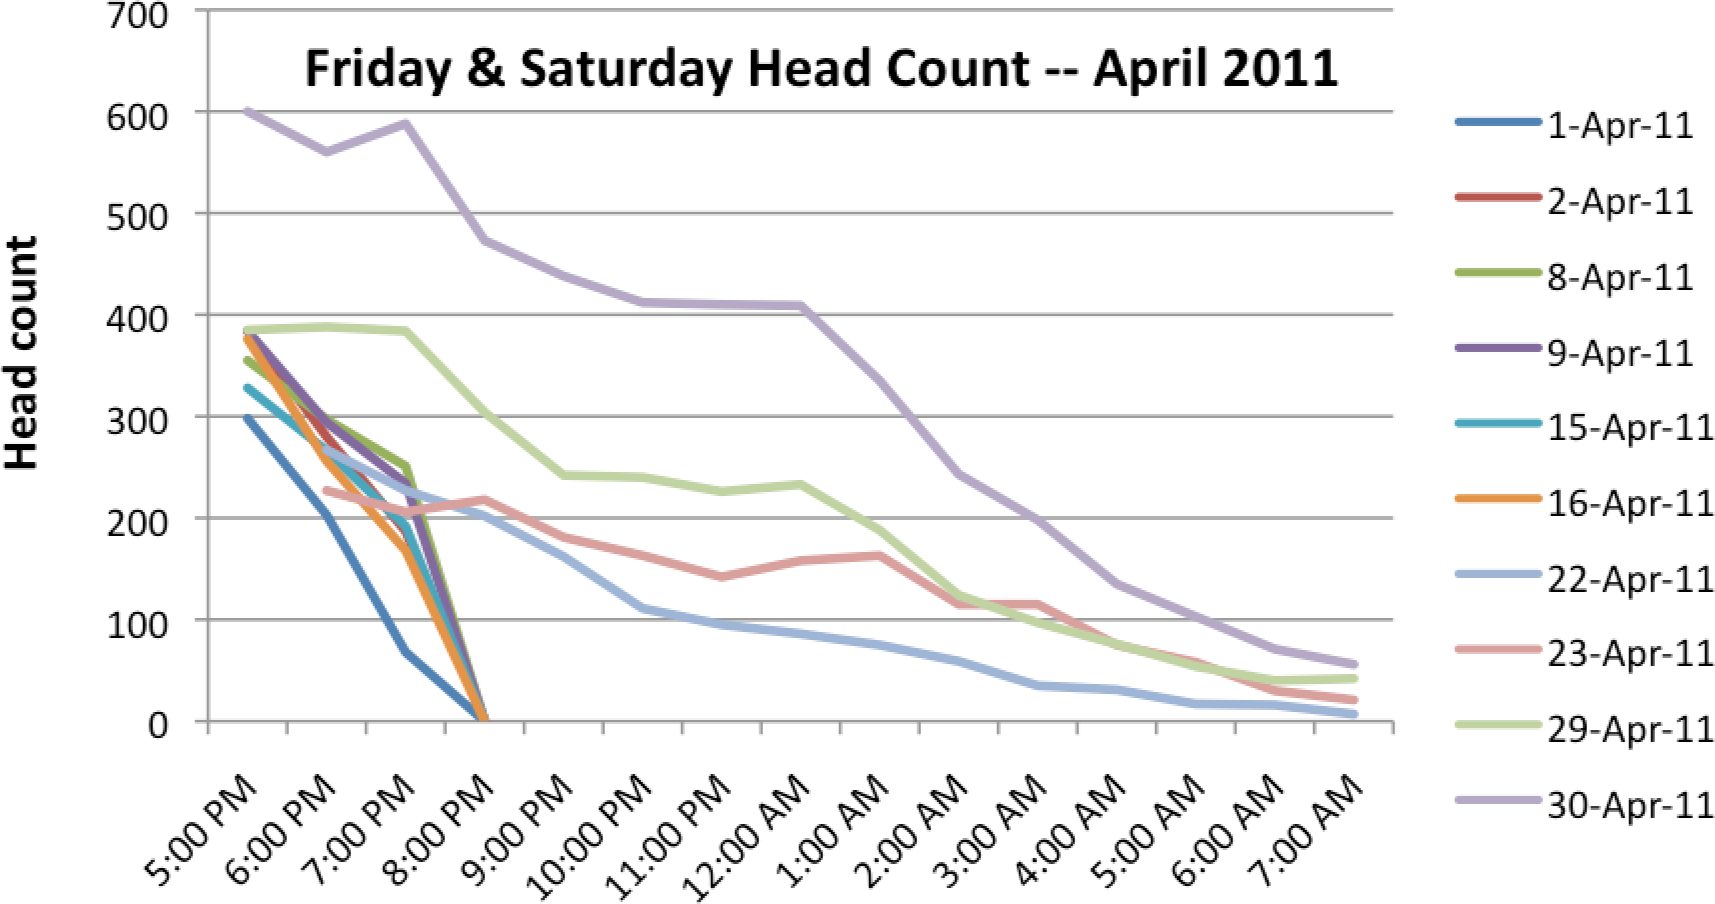
Head count Friday & Saturday nights, continuous 24 hour operation, April 2011.
The data suggested the library could meet the needs of a large number of students by remaining open an additional four hours until 12 midnight on Friday and Saturday evenings, instead of closing at 20:00 pm.
The Library is continuing to collect occupancy data, including during the new hours of operation on Friday and Saturday evenings. The data will be reviewed, and the Library will decide to continue the changed schedule into the fall, or revert to the previous hours of operation, based on the actual level of use.
Case Study: The University of Missouri-Kansas City
The University of Missouri-Kansas City (UMKC) Libraries date back to 1933, when the university was called the University of Kansas City. Back then the library was located in the only building on campus. Lack of space became a problem almost immediately and the collections moved to several places, sometimes separated. The urgent need for new library space was understood, but funding was not made available for a true library building until 1966. The General Library was completed in 1969, providing a permanent home for the collections. Even at that time there was awareness that the size would soon be insufficient and the design for the General Library included plans for an additional two floors to be added at a later time. That time came in 1989 when the fourth and fifth floors were built, funded by an appropriation from the Missouri General Assembly and supplemented by a generous gift from local businessman and philanthropist Miller Nichols. The expanded building was then named the Miller Nichols Library.

University of Kansas City Library, 1950s.
University of Missouri-Kansas City Miller Nichols Library, 1989.
The Miller Nichols Library remained functional for many years, but by the late 1990s it became apparent that once again, more space was needed. Several plans were created for a major renovation, but funding never followed. That was the time when truly looking at opportunities for incremental renovations began. While the unfunded plans for an expansion languished, a great deal of interest was exhibited on the campus in the new concept of information commons. A plan was developed to take space on the first floor and transform it into an innovative, physically attractive and accessible space for study and learning. A variety of furniture styles were incorporated, and the technology was placed in areas designed to be the most efficient. The Miller Nichols Foundation provided funding, and the Information Commons opened in 2000.

University of Missouri Kansas City Miller Nichols Library, Information Commons, 2000.
The Information Commons was a great asset to library services and was used heavily. It did not reach the maximum number of students however, because it was on one side of the first floor, and students tended to enter the library and go straight ahead to the stack floors without looking to the side. It was, however, very useful, and served as a model for future plans. The future plans still, at that time, included the goal of renovating and expanding the entire Miller Nichols Library. In 2004 a design team (Sasaki Associates, Boston and PGAV Architects, Kansas City) was hired to prepare a conceptual study, looking at collection, study and staff space. In 2007 they were asked to provide a schematic design, utilizing the following vision:
“Transform the library from a “book vault” into a facility that embraces both the University and the surrounding communities by renovating Miller Nichols Library’s existing 169,733 gross square feet and adding approximately 68,296 gross square feet.”
The total cost of the building was not funded. It was then that the idea of renovating in increments began in earnest. The initial design was divided into phases. A study determined that installing an automated storage and retrieval system (ASRS, or robot) was a cost effective and efficient way of safely storing books and making them easily accessible, while at the same time creating the type of space needed to begin the transformation of the library into a student centered collaborative learning environment.

Automated storage and retrieval system.
A combination of private and university funding allowed the construction of the first phase, which was the extension to house the ASRS as well as its purchase. The costs were actually considerably less than estimated, and a substantial amount of funds remained. It was decided to alter the phases, and use the unexpected funds to renovate the first floor once again, greatly expanding and updating the old information commons. It was also decided to use the project as a way to test ideas for future building renovations, creating in essence a “prototype information commons”. This phase of the project was completed in 2011, creating a variety of collaborative learning spaces. These spaces are relevant now and also will guide future renovations.
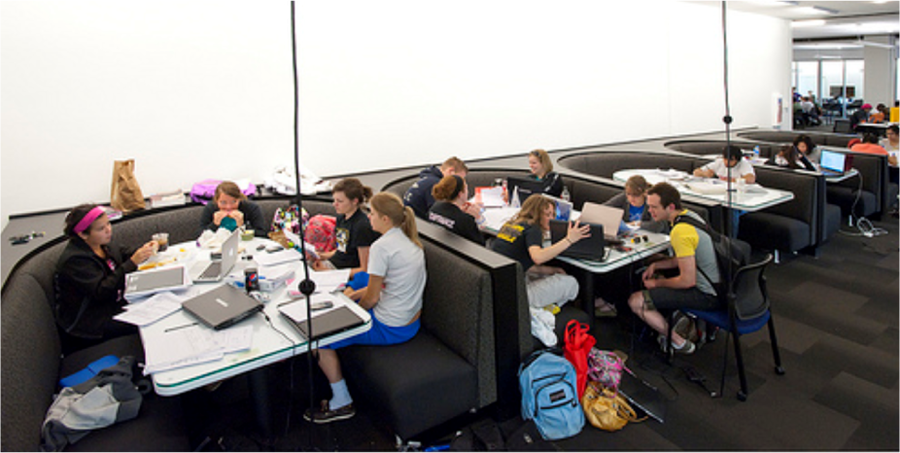
Example of a collaborative learning space, 2011.
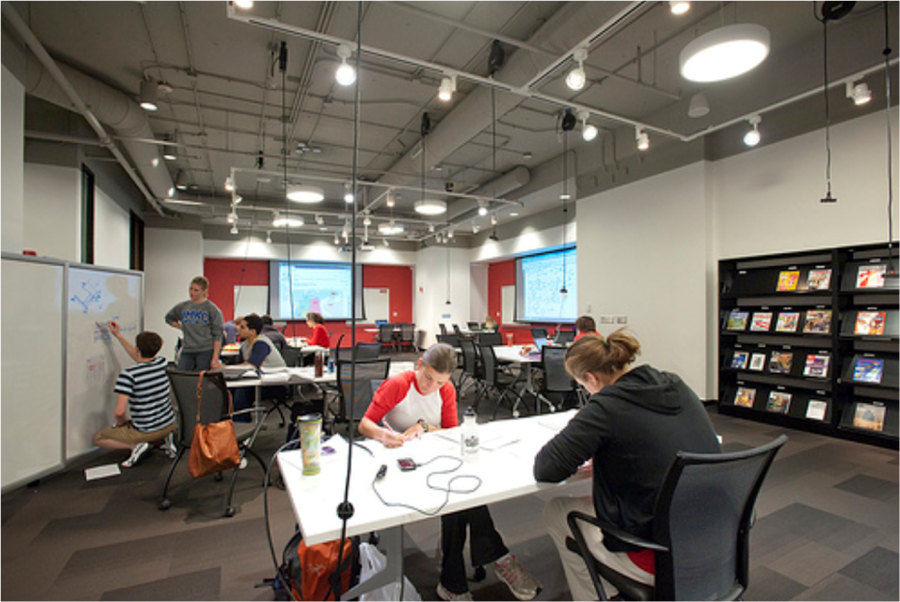
Example of a collaborative learning space, 2011.
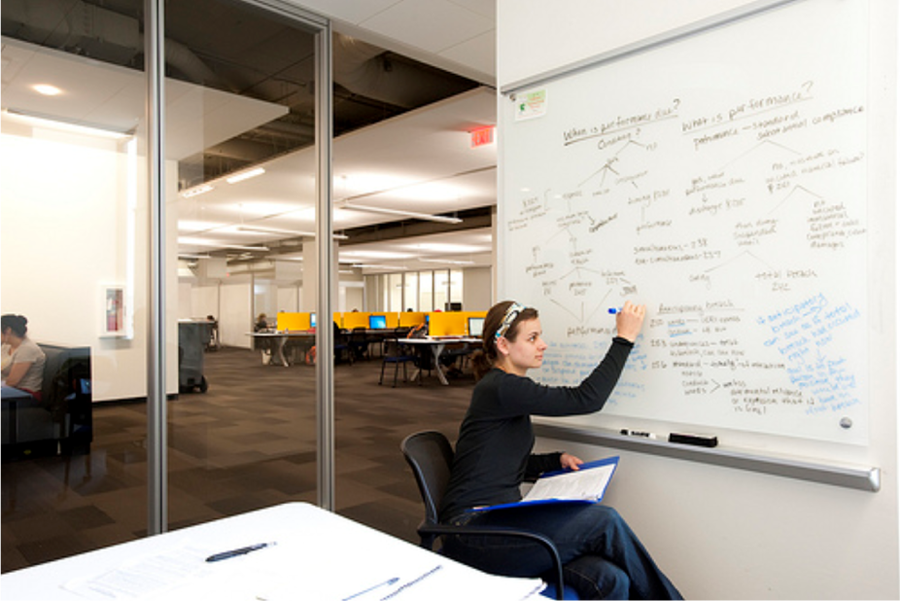
Example of a collaborative learning space, 2011.
This new space was evaluated in 2012, and the most basic measure–building usage statistics–indicated an amazing 40 percent increase between 2010 and the same time in 2011.

University of Missouri-Kansas City Miller Nichols Library. Usage statistics, 2010–2011.
As this part of the project was nearing completion, another opportunity arose. Bond money was unexpectedly made available explicitly for another phase. This one, as of this writing, is under construction. It will provide a classroom addition and grand entrance to the Miller Nichols Library. The distinct phases that were originally planned have ended with this addition. Instead, discrete areas are being selected for planning and focused fundraising. The Library is now fully in the incremental mode for renovations. In the meantime, evaluation of the completed areas is in process. It is different sort of evaluation because it is not an entire building or even all of the related services. This type of evaluation both addresses the success of the new areas, and informs the planning for future ones.
Evaluation takes several forms, including punch lists for the very new areas and several types of usage statistics. The University Libraries also participates in the LibQUAL+ assessment tool, a nationally-normed survey that helps library staff assess and improve library services, including the library as a place. In addition to input about how the new and older spaces work for students, they are also able to give input about what they would like to see happen in the library. The results are posted online in a multi-page LibGuide (http://libguides.library.umkc.edu/content.php?pid=277782&sid=2288913), along with the Libraries’ responses to date. Library users also are invited to comment, thereby continuing the evaluation in a less scientific manner. The University Libraries run a new LibQUAL+ survey every 3 years.
Publicity for the LibQUAL+ results.
Qualitative evaluation is done periodically, often via focus groups. Focus groups are also used when planning for new renovations. Library advisory groups also provide qualitative input.
Another very important and sometimes very informal evaluation procedure is observation. Librarians and library management do walk around the library and note usage patterns and styles. Sometimes it is just visual; sometimes notes are taken, particularly in selected areas. Since further renovations and improvements are now opportunistic, this type of information is very valuable.
What does an opportunistic renovation strategy means for UMKC? There are many positive reasons for such a strategy. Pragmatically, it is better, and often cheaper, than doing nothing. It allows for experimentation since much is done in smaller increments, and there is the opportunity for “as you go” evaluation. It is a good strategy for working with visionary donors, as has been possible with UMKC’s relationship with the Miller Nichols Foundation.
Some challenges exist as well. The library may be essentially living in a constant state of renovation, which can be disrupting and discouraging. There may be side effects. For example, to expand the area for a Special Collections department, space from another, adjacent service may be required and they then must have space elsewhere. It can also be challenging to have a constantly changing infrastructure.
Planning is essential to a good opportunistic renovation strategy. A strong, up-to-date strategic plan is essential to take full advantage of opportunities, and to provide the framework to evaluate them, before, during and after.
Conclusion: creating a culture of assessment for library facilities
A commitment to systematic and ongoing collection, compilation, analysis and reporting of data about library activity and user satisfaction can be the basis for developing a “culture of assessment” in an academic library. Continuous improvement requires continuously updated, regularly reported information.
The library’s user community can be a rich source of management information, and should be formally and informally consulted on a regular basis. It is important to ask library users what it is they want from the library, and whether or not they are getting it. Statistical tools and data are not intended to replace current sources of information, but rather to supplement and complement what is already known. Statistical data and survey results should be distributed throughout the organization to inform management processes, shape decision-making and, ultimately, improve service to users.
The information marketplace has become more competitive in recent years, with academic libraries no longer holding a clear monopoly. As we struggle to understand the library’s new roles and responsibilities among its communities of users, there is inspiration and value to be found in the best practices and innovations of the commercial, retail and even entertainment sectors. We have all been customers, and can rethink our approach to designing services and facilities based on a deeper and more nuanced understanding of that shared customer experience.
If we can create experiences for our students, faculty, and visitors that linger in their memory long after they have left our libraries and our campuses, we will remain central to the academic enterprise. Delivering experiences that produce lifelong memories, informing and transforming thought and behavior long after those experiences have ended, is as good a working definition of the educational enterprise as one might hope to find.
Footnotes
Paper presented at the World Library and Information Congress: 78th IFLA General Conference and Assembly, 11–18 August 2012, Helsinki, Finland, in session 190: Making the case for change through evaluation: post-occupancy evaluation of library buildings. Library Buildings and Equipment.