
Abstract
Supplementary cementitious materials (SCMs) are natural or industrial by-product materials which are used to improve the performance, durability, and sustainability of concrete mixtures. Motivated by the recent reports on shortage of conventional SCMs, impure calcined clays (CCs) are receiving attention as abundant alternative pozzolans for concrete. In this study, a clay slurry resulting from washing aggregates in a commercial sand and gravel pit was investigated. This source clay was dried and calcined, and the properties and pozzolanic performance of the resulting CC was evaluated. It was observed that despite having a large (>50%wt.) inert quartz content, the CC met all ASTM C618-19 (AASHTO M295) requirements for natural pozzolan. A pavement-grade concrete mixture containing 20%CC as a cement replacement (by weight) produced desired workability and fresh and hardened air content. Strength development was slightly below the control. The use of CC improved the durability of concrete with respect to chloride penetration, alkali–silica reaction, and drying shrinkage in comparison with a control (100% Portland cement) mixture. In addition, ternary limestone-calcined clay–cement and slag-calcined clay–cement mortar mixtures showed excellent strength development while replacing nearly 50% of the Portland cement.
Portland cement concrete is by far the most widely produced construction material, thanks to its low cost, versatility, performance, and reliance on abundant ingredients. Supplementary cementitious materials (SCMs) are key components of today’s concrete and are used to improve the workability, sustainability (e.g., embodied energy and CO2 reduction), and durability (e.g., against corrosion, alkali–silica reaction [ASR], sulfate attack, and thermal cracking) of concrete ( 1 ). SCMs also reduce the life-cycle cost of concrete by providing potential materials cost savings while reducing the maintenance needs of concrete structures.
In recent years, the supply of conventional SCMs (such as fly ash and ground granulated blast furnace slag) has not kept up with the growth in concrete industry’s demand ( 2 – 4 ), and this is forecasted to become more severe in the future ( 5 , 6 ). Thus, finding ecologically and financially sustainable alternative SCMs is significant ( 7 ). Impure kaolinite clays are abundant in many regions of the world (e.g., in Mid-Atlantic and Southeastern United States) and may prove to be an ideal pozzolanic material to deliver high-quality concrete at a low cost. This paper investigates one such clay source for its properties and performance in concrete.
Summary of the Existing Knowledge
There are three common groups of clay minerals; kaolinite, montmorillonite–smectite, and illite–micas ( 8 ). Among them, kaolinite has the greatest potential to be used as SCM because of its bi-layer t-o structure (a silica tetrahedra layer connected to an alumina octahedra later), with hydroxyl groups connected to the octahedral layer and located at the interface between adjacent repeat t-o units ( 9 ). This facilitates thermal activation (i.e., calcination) of kaolinite at lower temperatures, leading to a partial or complete breakdown of the clay structure by removing OH¯ groups (i.e., the dehydroxylation process) and producing a highly reactive pozzolan ( 10 , 11 ). In contrast, in smectite and illite clays, OH¯ groups are located at the middle of individual tri-layer t-o-t units, and this mitigates dehydroxylation.
The optimum calcination temperature of kaolinite has been reported to be in the range of 650–850°C depending on its composition and availability of flux agents (
10
,
12
–
14
). Calcination produces a poorly crystalline aluminosilicate compound, which is metastable and can dissolve in the alkaline pore solution of concrete. Most commonly, calcined clays (CCs) can react pozzolanically with calcium hydroxide (CH) and produce calcium (alumino-)silicate hydrate (C-S-H and C-A-S-H), serving as the major binder phase in concrete. Other reaction products of CCs in concrete include hemi- and mono-carboaluminate AFm phases (C4A
The maximum replacement level of Portland cement with CCs is reported to be approximately 30% by weight. This limit is not because of complete consumption of portlandite (CH). Rather, it is caused by the negative impact of CCs on the workability of concrete ( 17 ), and this cannot be fully counteracted by the use of superplasticizers (SP), as the required SP dosage may exceed the recommended limit by the SP manufacturer and such a high dosage may severely affect the setting and strength development of concrete ( 18 ). Past research has shown that the use of CC can improve the mechanical properties (i.e., the compressive, tensile, and flexural strength) and durability of concrete ( 8 , 12 , 16 – 20 ). Some studies reported that CC is quite effective in enhancing the early- and later-age strength of concrete ( 7 , 8 , 15 , 17 ). Moreover, CC has been demonstrated to improve the resistance of concrete against sulfate attack and chloride ion penetration ( 17 ). The water requirement to achieve normal consistency was found to depend on the type and fineness of clay minerals and their degree of dehydroxylation ( 17 , 21 ).
Over the last few decades, many studies have been performed on the activation of raw clays ( 22 , 23 ), optimization of calcination protocol for pure kaolinite ( 21 , 24 ), and evaluating the effect of metakaolin (pure calcined kaolinite clay) on the properties of concrete ( 16 , 24 ). Generally however, the abundant clay deposits include a mixture of kaolinite and other clay minerals plus impurities such as quartz and iron oxide ( 12 ). Limited literature is available on impure CCs and their performance in concrete. It has been recently reported that clays containing as low as 40% kaolinite may be used to produce acceptable pozzolans for concrete ( 14 ). In this study, an impure source clay (SC) as a by-product of a large commercial aggregate production facility was examined. As shown in the following sections, SC contained only 26% kaolinite and 53% inert quartz. However, the resulting CC met the requirements of ASTM C618-19 and showed good performance in concrete.
Materials and Methods
Production of Calcined Clay
ASTM and AASHTO specifications for concrete aggregates (ASTM C33-18, AASHTO M6 and M80) place a limit on the maximum allowable fines (particles smaller than #200 sieve) that can be included in aggregates. To meet this limit, aggregate producers often need to wash their aggregates to remove dusts and fines. This practice results in a washout slurry that needs to be properly treated and recycled or disposed of. In this study, the aggregate washout slurry from a large sand and gravel pit in Maryland was investigated. The pit produces ∼700 tons/day of by-product fines (dry weight) which were believed to primarily contain clay minerals.
A 275 gallon sample of the washout slurry (<5% solid content) was acquired. The solids were allowed to settle naturally, and the resulting mud was dried in an oven at 110°C for 24 h, and then ground to pass sieve #18 (1.00 mm). The resulting SC was calcined at a heating rate of 8°C/min up to a maximum temperature of 750°C (approximately half of the required temperature for producing cement clinker). The resident time at maximum temperature was 3 h. The clay was then allowed to cool down to room temperature within 15 min. The resulting CC was milled for 2 h in a ceramic ball mill to produce a desired level of fineness (<34% retained on #325 sieve) while meeting ASTM C618’s water requirement limit of 115% max.
Characterization of the Source and Calcined Clays
The CC was characterized to evaluate its compliance with ASTM C618-19 specifications for Class N pozzolan. Tests included the moisture content (ASTM C311-17), fineness (ASTM C430-17), particle size distribution (using laser diffraction), density (using helium pycnometry), loss on ignition (LOI) (ASTM C311-17), carbon and sulfur contents (using infrared spectroscopy), water requirement (ASTM C311-17), strength activity index (ASTM C311-17), and soundness (ASTM C151-18). The specific surface area of cement and CC was measured using N2 gas adsorption (BET method) at the temperature of liquid N2 (77.35°K). The samples were dried and degassed before the BET measurement.
In addition, the chemical and mineralogical compositions of both SC and CC were determined via X-ray fluorescence spectroscopy (XRF) and X-ray diffraction (XRD). One sample per material was tested for each XRF and XRD. For XRF, a small portion of each material was mixed with lithium borate flux and heated up to 1,000°C. The resulting glass bead was analyzed using XRF. Semi-quantitative XRD with Rietveld refinement was performed to identify and quantify the mineral and amorphous phases present in each material. Samples were ground to pass sieve #400, mixed with 15% internal standard (ZnO), and placed on a spinner stage rotating at 4 rev/s. The incident X-ray beam was Cu Kα radiation at 45 kV and 40 mA. Incident settings were: 0.125° divergence slit, 0.25° anti-scatter slit, 0.04 rad. Söller slits, and 15 mm beam mask. Diffracted settings were: 0.125° receiving slit, 0.04 rad. Söller slits, and 0.02 mm nickel filter. Diffraction patterns were collected over the range 5–70° 2θ with step size of 0.02°, for a total duration of ∼30 min. A PIXcel detector in scanning line mode was used.
Scanning electron microscopy (SEM) was used to obtain 2D (polished surface) images of SC powder. The sample was prepared using a mixture of epoxy with SC powder (1:1 by weight). The resulting material was poured into a cavity inside a molded epoxy disk with the diameter of 25 mm and height of 12.5 mm ( 25 ). After the epoxy had set, the sample was polished to 0.25 µm and carbon coated. Imaging was performed at 1,000× magnification using a 15 kV, 2 nA electron beam. A working distance of ∼10 mm was used.
Performance of the Calcined Clay in Mortar and Concrete
The strength activity index (SAI) of the CC was measured after 7 and 28 days of curing in saturated lime water, in accordance with ASTM C311-17. The control mortar was prepared with w/c = 0.48, using type I/II Portland cement and standard sand with the absorption capacity of 0.58%. In the test mixture, 20% of cement was replaced with CC and enough water was added to reach a flow of ±5% of that of the control mixture (ASTM C1437-15). Mixture proportions are provided in Table 1. In addition to the SAI mortar (S1), a second set of test mortars (S2) were prepared with 20%CC and w/cm = 0.48 (same as the control) to eliminate the effect of the increased w/cm on the compressive strength of mortars. A polycarboxylate-based SP was added to achieve the target flow of ±5% of the control. All mortars were mixed according to ASTM C305-14.
Mixture Proportions for Measuring SAI and Compressive Strength of CC Mortars
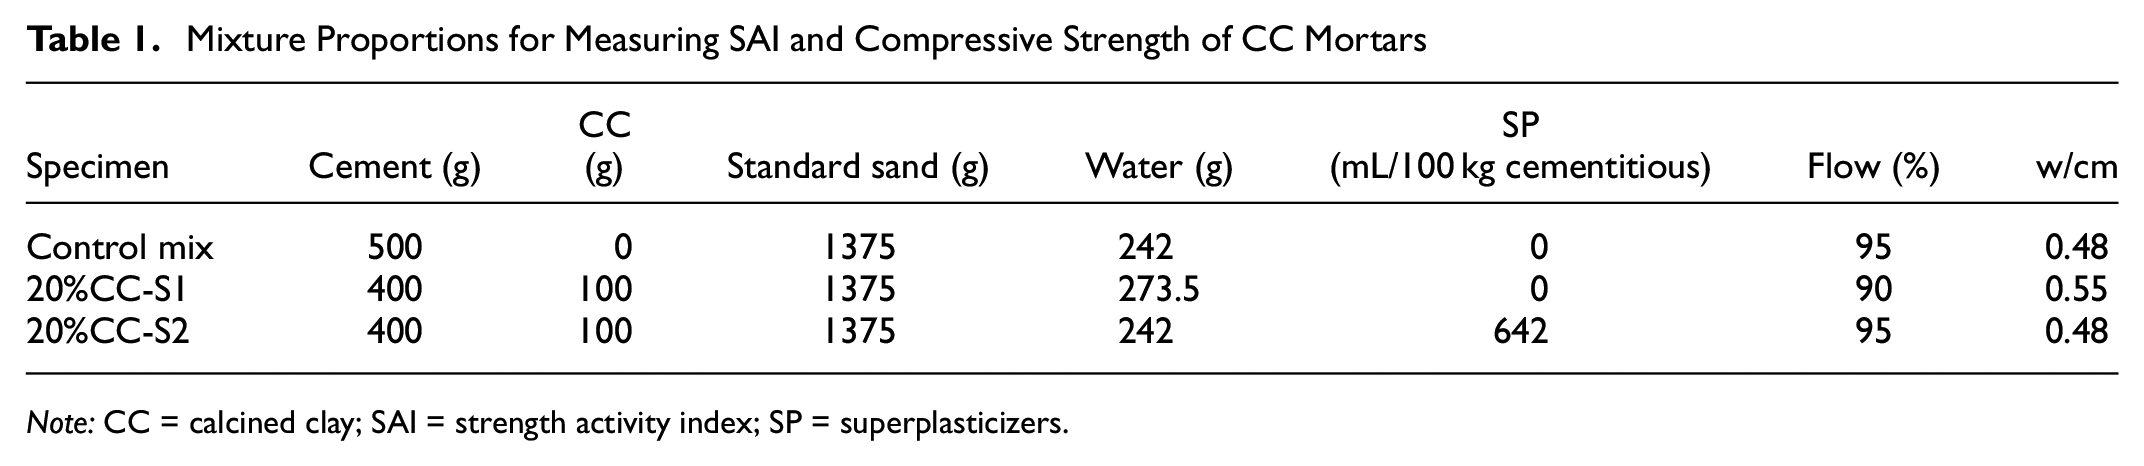
Note: CC = calcined clay; SAI = strength activity index; SP = superplasticizers.
In addition, ternary limestone-calcined clay–cement (LC 3 ) and slag-calcined clay–cement (SC 3 ) mortar samples were prepared and tested for compressive strength development. In these mortars, 47.4% of Portland cement was replaced with a mixture of 15% ground limestone or grade 120 slag, 30% CC, and 2.4% gypsum. A constant w/cm = 0.48 was used and SP was added to achieve the acceptable flow. The mixture proportions are provided in Table 2.
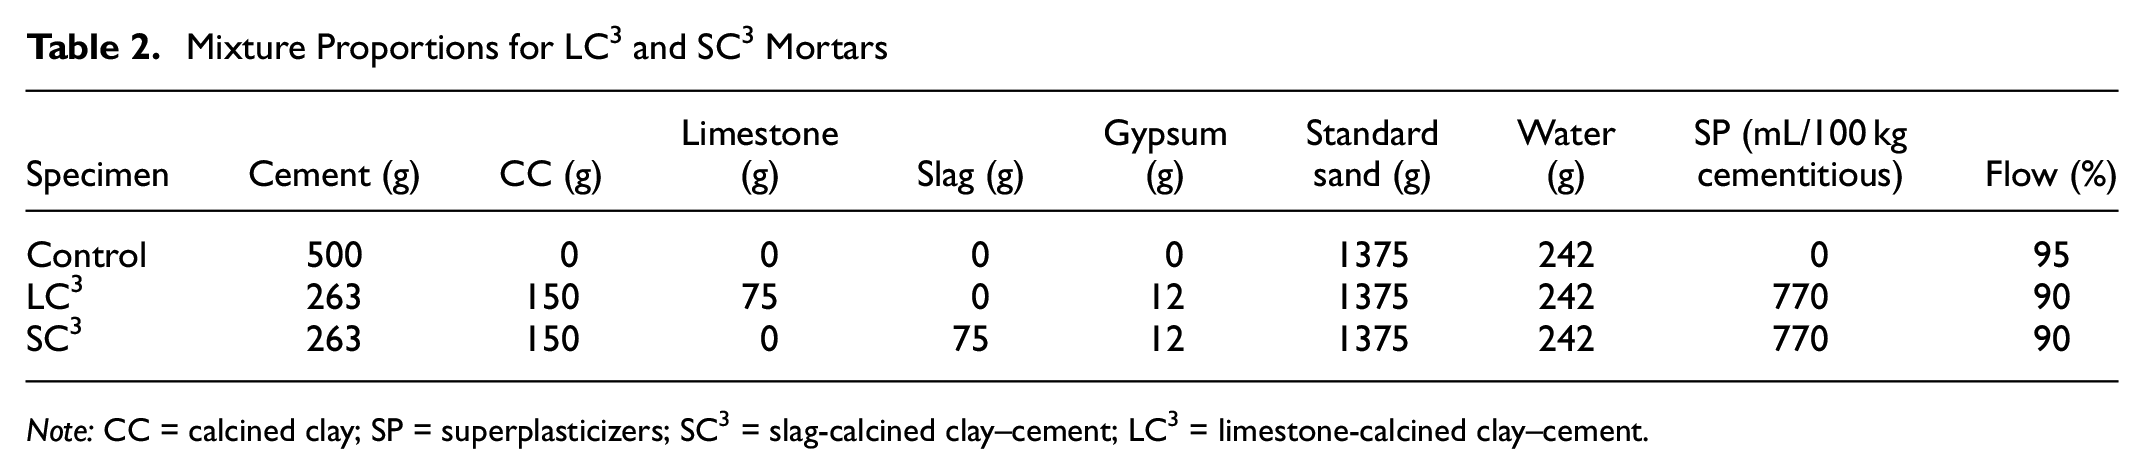
Note: CC = calcined clay; SP = superplasticizers; SC3 = slag-calcined clay–cement; LC3 = limestone-calcined clay–cement.
The control and 20%CC-S2 mixtures (Table 1) were also evaluated for their time of setting (ASTM C403-16) and drying shrinkage (ASTM C157-17). Mortar mixtures were poured into cylinder containers (150 × 150 mm), capped, and stored at 23°C and 100% relative humidity (RH). The setting time was recorded as the time at which the penetration resistance was 3.45 MPa (500 pounds per square inch [psi]) and 27.58 MPa (4,000 psi) for the initial and final setting time, respectively. Three replicates of each mixture were tested. For drying shrinkage testing, four mortar bars (25 × 25 × 285 mm) were cast per mixture and moist-cured for 24 h followed by demolding and submerging in a saturated lime bath for 6 days. Next, initial mass and length measurements were taken, and the samples were moved to a 50 ± 5% RH, 23°C environmental chamber for drying. The mass and length changes of each prism were monitored according to ASTM C157-17 for 3 months. In addition, the performance of CC to mitigate ASR was evaluated according to ASTM C1567-13 using highly reactive aggregates and moderately reactive aggregates (Class R2 and R1, respectively, per ASTM C1778-16). A control mortar mixture was prepared with 100% Portland cement as binder with both types of aggregates, and several test mixtures were made with various dosages of CC as a replacement for cement. Mixture proportions for all ASR mixtures are provided in Table 3. A w/cm = 0.47 was maintained for the control and test mixtures.
Proportions for Alkali-Silica Reaction (ASR) Mortar Mixtures

Note: CC = calcined clay.
Finally, the performance of CC in a pavement-grade concrete mixture was evaluated by measuring the fresh properties such as slump (ASTM C143-15a), density (ASTM C138-17a), and fresh air content (ASTM C231-17a). Moreover, concrete’s hardened properties were measured, including the compressive strength at 7, 28, and 56 days (ASTM C39-18), hardened air structure (ASTM C457-16), and rapid chloride ion permeability (ASTM C1202-18). The control mixture was prepared using proportions that are typically used for pavement applications in Pennsylvania (compliant with PennDOT specifications). It contained an ASTM C150-17 type I/II Portland cement, natural sand (with SSD specific gravity of 2.62, absorption capacity of 1.66%, and fineness modulus of 2.94), and #57 natural gravel (SSD specific gravity of 2.61, absorption capacity of 1.32%, dry rodded unit weight of 97.05 kg/m3). Air-entraining admixture (AEA) and SP were dosed according to their manufacturer’s recommendation to achieve a target air content of 6 ± 1% by volume and target slump of 10 ± 2.5 cm (4 ± 1 in.). In the test mixture, 20% of the Portland cement was replaced with CC, and the dosages of AEA and SP were adjusted as needed while other proportions remained the same (Table 4). As reported in the results section, 15%CC was sufficient to mitigate ASR associated with a moderately reactive (R1) aggregate and 30%CC was sufficient to mitigate ASR for a highly reactive (R2) aggregate. As such, for concrete performance testing, 20%CC was chosen as an intermediate dosage that will be sufficient for most concretes and to demonstrate the trends of how this pozzolan affects various concrete properties. For each concrete mixture, 11 cylindrical specimens (diameter of 100 mm and height of 200 mm) were cast and moist-cured at 23°C and 100% RH.
Proportions for the Control and the 20%CC Concrete Mixtures

Note: CC = calcined clay; AEA = air-entraining admixture.
Results and Discussion
Characterization of the Source and Calcined Clays
The bulk chemistry of SC and CC, as measured by XRF, is provided in Table 5. The composition of the Portland cement as provided by its manufacturer is also included. Based on the results, the CC sample met the chemical requirements of ASTM C618-19. The sum SiO2 + Al2O3 + Fe2O3 for the CC was 96.49%, which is higher than the 70% minimum limit of the ASTM for Class N pozzolan. The CaO content of the CC was negligible, likely indicating that it is non-cementitious. The SO3 content was also negligible, which is good for volume stability and durability of concrete containing this CC. LOI at 750°C as required by ASTM C618-19 was quite low, suggesting a low risk of negative interactions with AEAs. The equivalent percentage of sodium oxide (Na2Oeq) of the CC was 0.73, which is considered low. The SC sample showed a similar chemistry as the CC, except for having a high LOI, which is associated with the mass loss resulting from thermal dehydroxylation of the clay.
The Bulk Chemistry (Dry wt%) of the Portland Cement, Source Clay (SC), and Calcine Clay (CC)

Note: NA = not available. Italics indicate these are not part of the XRF analysis (raw data) but it can be calculated based on the provided data from XRF.
Figure 1 shows the QXRD results for SC and CC samples. The SC contained 52.6% quartz, 36.2% clay phases (kaolinite, nontronite [smectite group], and muscovite [mica group]), and 6.5% hydroxides of iron and aluminum (likely to be alteration products of kaolinite). The non-crystalline content was less than 5%. In the CC sample, the quartz remained unaltered and at a similar wt% after calcination. The kaolinite, nontronite, and majority of muscovite were altered into non-crystalline and potentially reactive phases, which made up 42.2% of the CC sample. According to the literature, different clay minerals dehydroxylate at different temperatures, and the duration of resident time at the maximum temperature also affects this process. The dehydroxylation temperature of gibbsite and kaolinite is around 300°C and 600°C, respectively ( 26 ). Muscovite starts losing its structural water at 400°C and fully dehydroxylates at 1,000°C ( 8 ). Following that, in this study, muscovite did not completely disappear at the calcination temperature of 750°C. Goethite was calcined to hematite which is non-reactive. In summary, the CC contained 54.6% inert phases and 45.4% potentially reactive phases.

X-ray diffraction patterns and quantitative analysis (wt%) for source clay (SC), and calcine clay (CC).
Figure 2 shows a SEM micrograph of the SC sample, suggesting a broad particle size distribution. Most importantly, the quartz particles (solid light gray) are intimately mixed within an agglomerated clay matrix (darker gray). This would make it difficult to separate the quartz from the clay. The bright white particles are iron oxide (goethite).
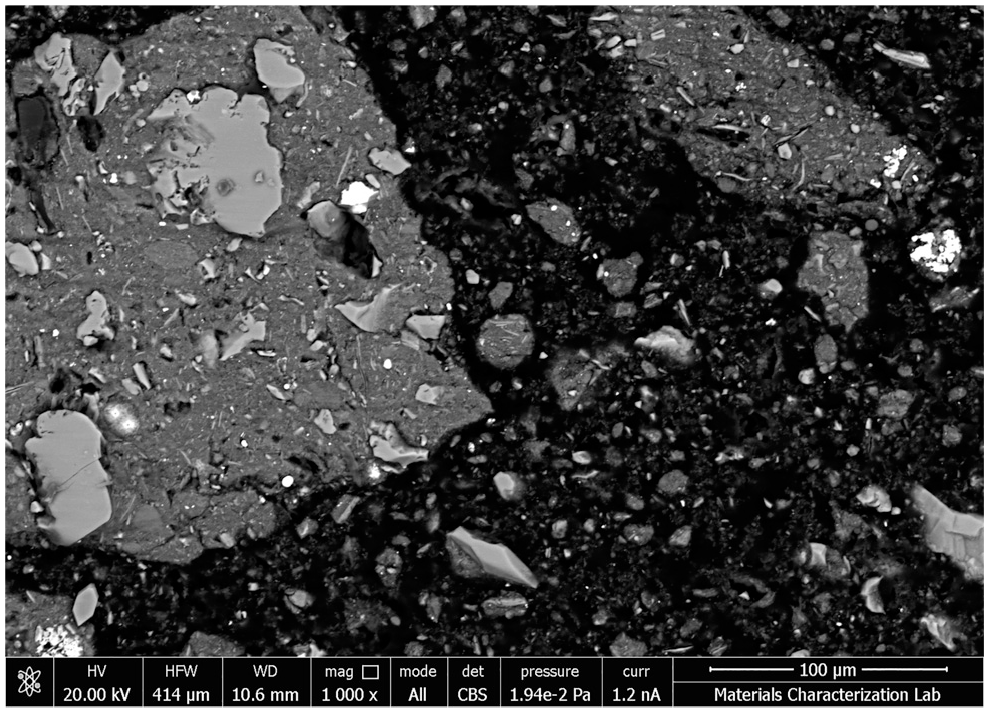
Scanning electron microscopy (SEM) image of source clay (SC) powder.
The measured physical properties of the CC are reported in Table 6. These all complied with the physical requirements of ASTM C618-19. The milling time of CC was chosen such that the samples satisfied the fineness and water requirement limits of the ASTM. This resulted in a median particle size of 8.89 µm for CC. The BET results show that CC had approximately 25× higher surface area compared with the Portland cement. The observed high water requirement of the CC is the result of this high surface area and is in agreement with the literature ( 18 ). This would result in a lower workability of concrete unless water reducing admixtures are dosed properly to mitigate this effect. The carbon content of the CC was quite low and in agreement with the LOI results presented earlier. Furthermore, the low soundness value suggests that CC does not pose a risk of deleterious expansion caused by the hydration of free CaO and/or MgO.
The Physical Properties of the Calcined Clay (CC)
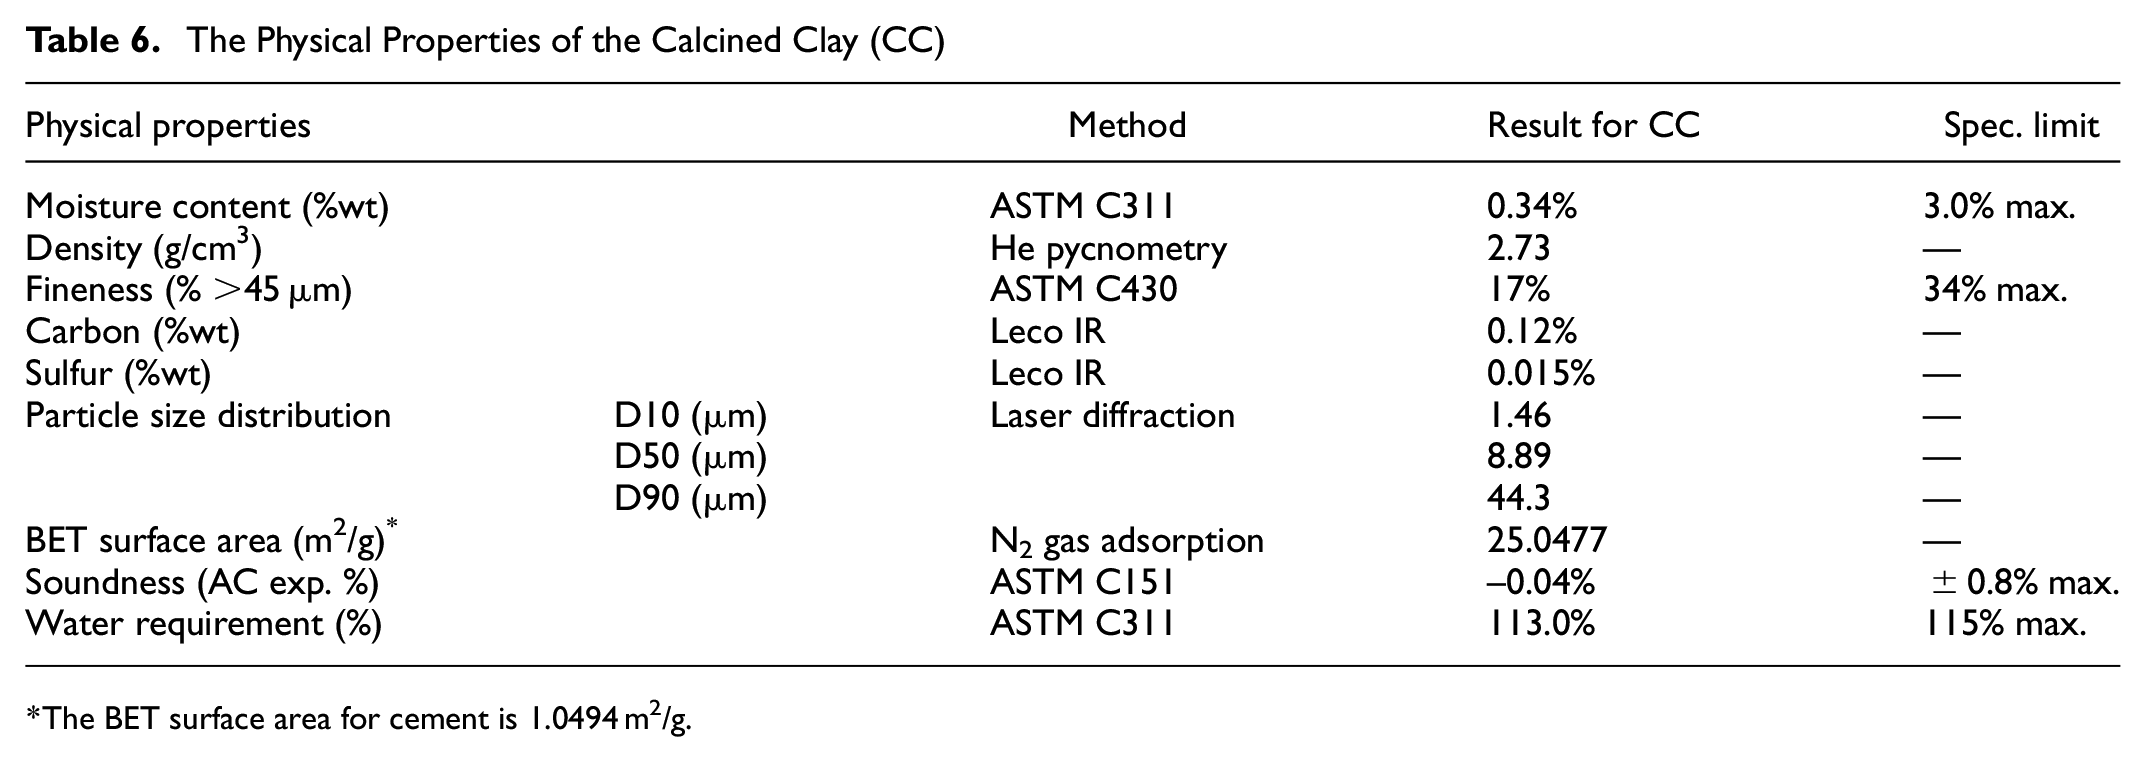
The BET surface area for cement is 1.0494 m2;/g.
Performance of the Calcined Clay in Mortar and Concrete
The SAI of the CC is reported in Figure 3 (20%CC-S1). As a reminder, SAI is the ratio of the compressive strength of the test mortar containing 20% pozzolan to that of the control mortar (100% cement) at a given age. The 28-day SAI value (81.6%) exceeded ASTM C618’s minimum requirement of 75%. It should be noted that a higher w/cm = 0.55 had to be used in mortar S1, in comparison with w/cm = 0.48 in the control mortar, to comply with ASTM C311 mandate to achieve a similar flow between the two mortars (see Table 1). This significantly higher w/cm put mortar S1 at a disadvantage (in comparison with the control) and lowered the measured strength of the CC mixture. Alternatively, in mortar S2, the same w/cm = 0.48 as in the control mortar was used and the flow requirement was achieved using a SP. In this case, the compressive strength of the test mortar S2 improved at both 7 and 28 days in comparison with S1. At 28 days, mortar S2 outperformed the strength of the control mortar by 12.4%. It is acknowledged that some of this strength improvement may be caused by the use of SP in mortar S2.
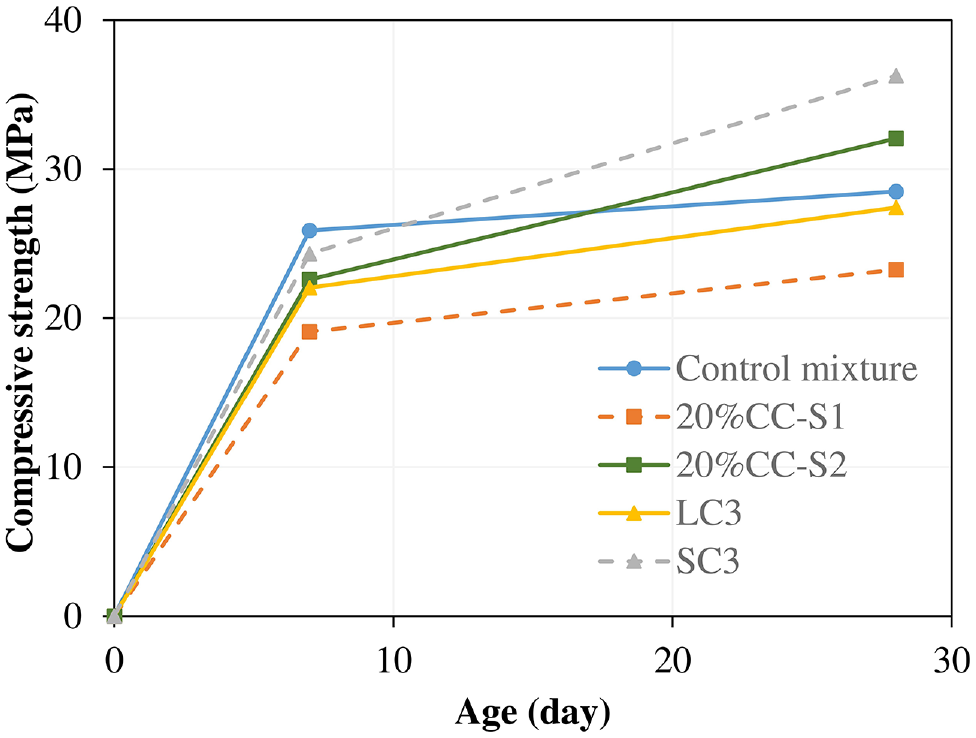
Compressive strength of binary and ternary mortar mixtures.
The compressive strength of the ternary mixtures LC 3 and SC 3 are compared against the control mortar in Figure 3. The LC 3 mixture showed a 28-day strength at 96.2% of the control, whereas the SC 3 mixture had a 28-day strength at 127.3% of the control mortar. These results are impressive given that these ternary mixtures contained only slightly more than 50% of Portland cement, and this could result in significant cost savings and environmental benefits. Such ternary mixtures should be explored further in future research.
The time of setting of the control and 20%CC-S2 mortars was measured using the penetration resistance method (ASTM C403-16) and the results for three replicate specimens per mixture were averaged (see Figure 4). The initial setting time for the control and S2 mixtures was 325 min and 390 min, respectively. The final setting time for the control and S2 mixtures was 475 min and 540 min, respectively. In short, the mortar containing 20%CC set approximately 1 h later than the control. This is often acceptable and even preferred during warmer construction seasons, but may not be favorable in colder seasons and may need to be compensated using accelerating admixtures. The delayed setting is attributed to the slower reactivity of CC in comparison with Portland cement, and a high SP dosage is mortar S2 may have also contributed to the slower setting as suggested in the literature ( 27 ).
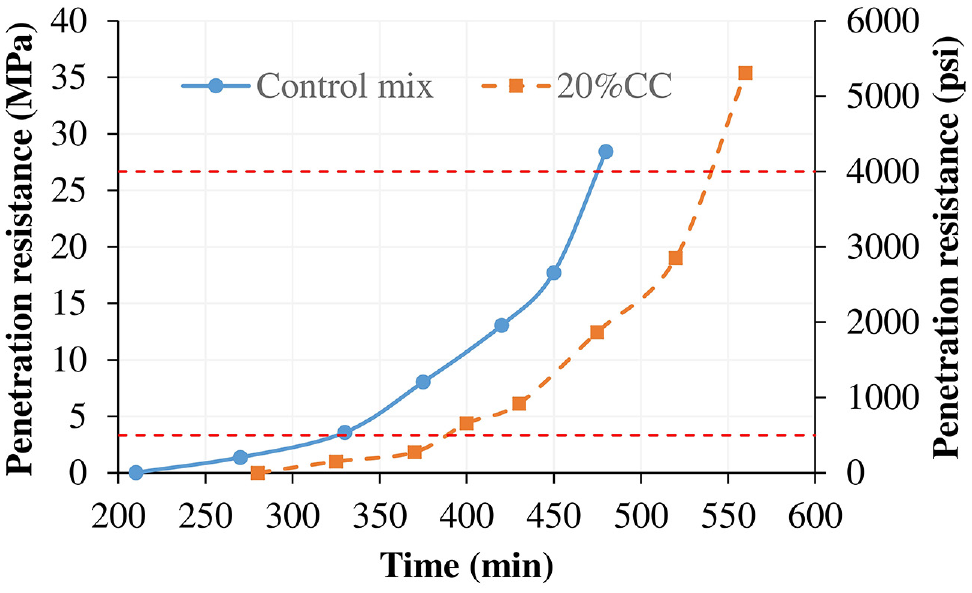
Time of setting for the control and 20%CC mortar mixtures.
The effects of 20%CC on the properties of the concrete mixture are reported in Table 7. Mixture proportions for these concretes were reported earlier in Table 4. As anticipated, a higher SP dosage was needed to achieve a target slump of 10 ± 2.5 cm in the 20%CC mixture. The fresh density and air content in both mixtures were similar, and were achieved using similar AEA dosages. A hardened air analysis (ASTM C457-16) was performed using a RapidAir instrument on concrete samples after 28 days of moist curing. The results showed that the hardened air content of the control and 20%CC mixtures were 6.3% and 7.1%, respectively, and the spacing factor for the two mixtures was 0.151 mm and 0.144 mm, respectively. These values are below the ASTM C457-16 threshold of 0.200 mm max., indicating that both concretes will likely haveadequate freeze–thaw durability in moderate exposure environments.
Impacts of the 20%CC as Cement Replacement (by Weight) on the Properties of the Concrete Mixture

The results for 7, 28, and 56-day compressive strengths of the control and 20%CC concrete mixtures are illustrated in Figure 5. The 20%CC mixture showed a lower strength (by ∼15%) at all ages. The reason for the lower compressive strength may be partially because of the higher hardened air content of the CC mixture and partially as a result of the inert quartz fraction of the CC. According to the literature, 1% increase in air content may cause ∼5% strength loss ( 28 ). Also, the reduction in compressive strength is explained as the result of a clinker dilution effect; increase in effective water-to-cement (w/cm) ratio by partially replacing cement with CC ( 29 ). A reduction in the w/cm of the CC mixture is recommended to improve its compressive strength to above the PennDOT limit of 25.9 MPa (3750 psi) at 28 days. It is also noted that although the compressive strength of mortar S2 containing 20%CC was similar or even better than the control (Figure 3), the strength of concrete with 20%CC was below that of the control. This is attributed to several reasons including significant differences in the aggregate size, volume fractions, mineralogy, surface characteristics, and bond strength with matrix between the mortar and the concrete, a difference in the SP dosage, and potentially a difference in the air content between mortar and concrete (although the air content of the control and test mortars was not measured).

Compressive strength of the control and 20%CC concrete mixtures.
According to ASTM C1567-13, the effectiveness of the CC in mitigating ASR is reported in Figure 6a for a highly reactive (R2) aggregate and in Figure 6b for a moderately reactive (R1) aggregate. A control mortar mixture was prepared with 100% Portland cement as binder, and several test mixtures were made with various dosages of CC as a replacement (by weight) for cement. The same w/cm = 0.47 was maintained in the control and test mixtures. In Figure 6a, it is observed that the 14-day ASR expansion was reduced from 0.33% in the control mixture to 0.26%, 0.13%, and 0.08% in mortars containing 10%, 20%, and 30%CC, respectively. Using 30%CC was sufficient to suppress ASR of the highly reactive aggregates below the ASTM innocuous limit of 0.10%. It is clear in Figure 6b that for the moderately reactive aggregates, a lower CC dosage of 15% was sufficient to mitigate ASR. The reasons behind mitigation of ASR expansion in CC specimens may include reduction in the alkalinity of the pore solution, reduction in the ion penetrability of the mortar (ASTM C1202 results are provided below), and a reduction in the portlandite content of the system. All these effects are generated as a result of the pozzolanic reaction of CC. Longer-term ASR testing using the concrete prism test (ASTM C1293-18) is recommended for future research to more reliably determine the CC dosage that is needed to mitigate ASR for given reactive aggregates.
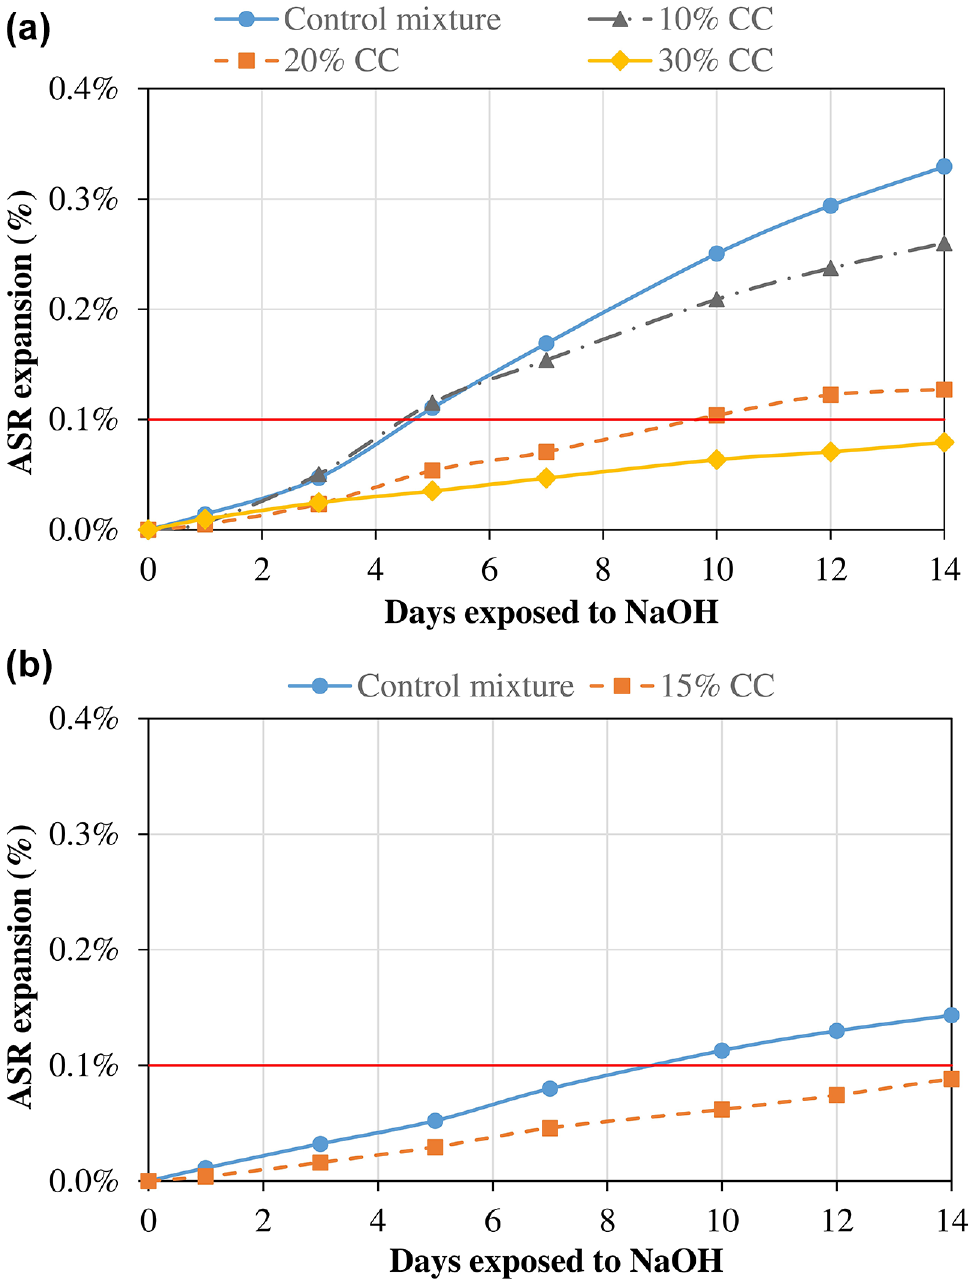
Alkali-Silica reaction (ASR) mitigation performance of calcined clay (CC) evaluated by ASTM C1567 test using: (a) highly reactive, R2, aggregate and (b) moderately reactive, R1, aggregate.
The results of the drying shrinkage and mass loss are presented in Figure 7. Both shrinkage and mass change were zeroed at 7 days of age, which was the end of moist curing. It is observed that the 20%CC mixture shrank faster initially but ultimately achieved a similar drying shrinkage as compared with the control mixture. A similar observation can be made with respect to the mass loss of the mortars. For 20%CC samples, approximately 52% and 71% of the total shrinkage occurred in the first 3 and 7 days, respectively; however, for the control samples, these values were 29% and 51%, respectively. Also, it is noted that 20%CC samples reached a constant mass after about 4 weeks, whereas the control mixture equilibrated after 7 weeks. Drying shrinkage did not stop after this moisture content equilibrium, indicating the presence of drying creep.
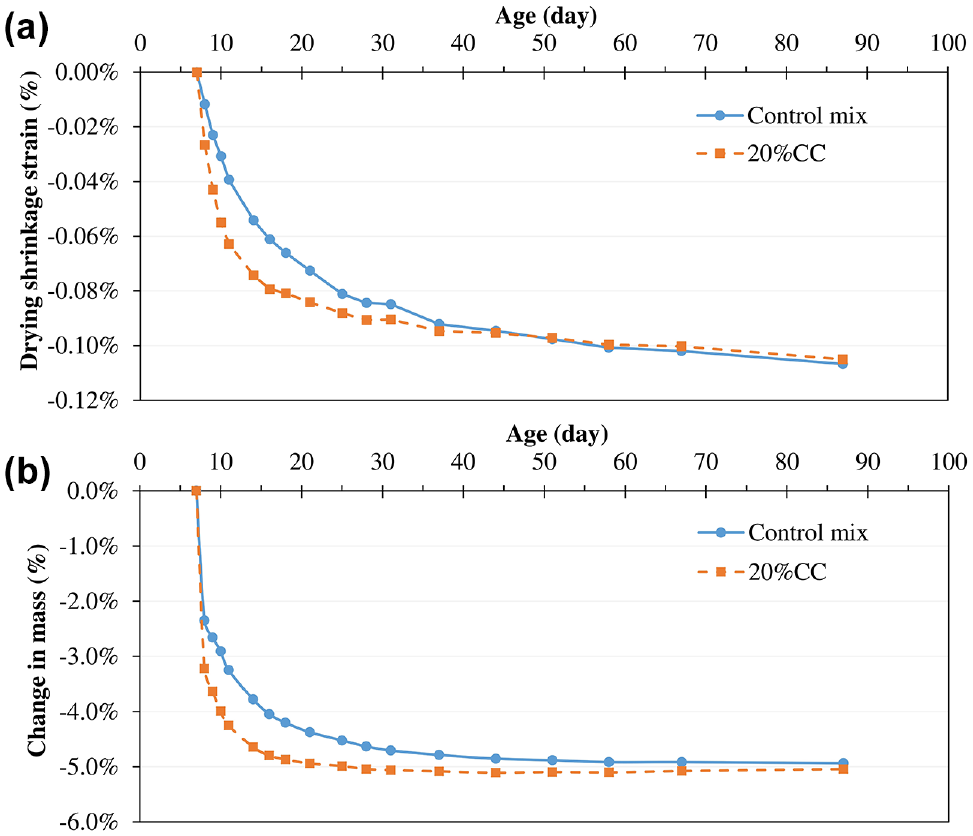
Drying shrinkage: (a) and change in mass and (b) versus age during drying of mortars at 23°C and 50% relative humidity.
Finally, the rapid chloride permeability test (ASTM C1202-18) was performed on the control and 20%CC concrete samples after 28 and 56 days of moist curing. According to previous studies ( 14 ), increasing the age at testing and decreasing the w/cm reduce the total charge passed through samples during the test. The 28-day results show that the 20%CC mixture had a better performance than the control mixture, with the total charge passed of 4815 and 3844 coulombs for the control and the 20%CC mixtures, respectively. A similar trend was observed at 56 days with coulomb values of 3752 and 3497 for the control and 20%CC mixtures, respectively. Overall, the risk of chloride intrusion into concrete was reduced by 7%–20% by inclusion of CC. This improvement is likely attributed to densification of the pore structure and reduction in the pore solution conductivity as a result of the pozzolanic reaction. Although direct measurement of the pore solution conductivity or pore size distribution was not performed in this study, it is well established in the literature that pozzolanic reaction leads to a reduced ionic strength of pore solution because of alkali binding within the pozzolanic C-S-H, thus reducing the pore solution conductivity. It is also well established that pozzolanic reaction results in pore structure densification through C-S-H occupying a larger space than CH and the reacted pozzolan combined ( 30 , 31 ).
Conclusion
This paper demonstrated new results on the characterization of an impure CC and its performance as a concrete pozzolan. The following major conclusions can be drawn:
Despite having an approximately 55% inert content, the impure CC produced and tested in this study met all the mandatory chemical and physical requirements of ASTM C618-19 for natural pozzolans, except for the uniformity requirements that were not tested.
As anticipated, the CC had an elevated water demand and reduced the workability of mortar and concrete. However, this could be resolved by using a SP.
A pavement-grade concrete mixture (w/cm = 0.47) was produced with 20%CC as cement replacement. This concrete met the required slump and fresh and hardened air content, but had compressive strength values that were ∼15% lower than a control mixture with 100% Portland cement. To compensate, the w/cm of the CC concrete can be slightly lowered.
In relation to impact on durability, the studied CC was proven effective in mitigating ASR and also modestly improved the chloride permeability of concrete. In comparison with the control mixture, similar drying shrinkage performance was observed.
In addition to the above binary mixtures, successful ternary mortar mixtures were prepared containing 52.6% Portland cement. A limestone-calcined clay–cement (LC 3 ) mortar showed a 28-day strength at 96.2% of the control, while a slag-calcined clay–cement (SC 3 ) mortar had a 28-day strength at 127.3% of the control. Such mixtures are promising because of their significant cost savings and environmental benefits, and should be explored in future research for potential implementation in practice.
Footnotes
Acknowledgements
The authors would like to acknowledge and greatly appreciate the fuding for this research by York Building Products Company, York, PA, and the USDOT’s Center for Integrated Asset Management for Multi-Modal Transportation Infrastructure Systems (CIAMTIS), the Region 3 UTC led by Penn State. The authors also thank Lehigh Cement and BASF for donating cement and chemical admixtures. Finally, the authors would like to thank Mr. Dan Fura for his invaluable help with the experiments in this study.
Declaration of Conflicting Interests
The author(s) declared no potential conflicts of interest with respect to the research, authorship, and/or publication of this article.
Funding
The author(s) received no financial support for the research, authorship, and/or publication of this article.
Any opinions, findings, conclusions, or recommendations expressed in this manuscript are those of the authors and do not necessarily reflect the views of the funding entities.