




Abstract
The unreasonable layout of taxi stands (TS) in urban areas not only fails to provide bidirectional guidance for drivers and passengers but also wastes spatial resources and aggravates the surrounding traffic. This paper compares the performance of three classical location models in optimizing TS spatial layout, and develops an extended model integrating the p-median and distance factor to support TS site selection in urban planning from multiple perspectives. To this end, taxi demand with spatial–temporal dynamics is extracted from taxi global positioning system (GPS) data to uncover the restrictive distribution characteristics of the setting areas and specific locations of TS with GIS platform. Taxi demand is then subdivided, and potential service points are set up on the road network. With the constraints of the supply and demand environment, we design the TS location models (TSLM) based on the set covering problem (SCP), the maximal covering location problem (MCLP), and the p-median problem (PMP), respectively. Furthermore, the TSLM based on PMP is extended to consider the maximum acceptable distance for passengers. A genetic algorithm-based procedure is introduced for solving the extended TSLM. An experiment conducted in China compares the facility coverage capacity, taxi demand allocation, and passenger access willingness of the optimal layout schemes obtained from four TSLMs. The number of parking spaces at TS is also evaluated. The result demonstrates that extended TSLM outperforms the other three models in the validity of locating TS.
Public transit plays an important role in urban transportation ( 1 ). As an important complement to traditional forms of public transit, taxis have been favored by people since the 19th century for their irreplaceable comfort and convenience ( 2 ). Compared with other modes of transport with fixed service times, taxis have a unique absolute advantage with their 24-h availability and capacity to provide door-to-door service for the public ( 3 ). In most cities, there is no absolute balance between supply and demand in the taxi market. During off-peak hours, taxi supply exceeds demand. Under the traditional operation mode, taxis cruise along the street searching for their next customer. This kind of collective behavior leads to a high empty running rate and carbon dioxide emissions ( 2 ). The phenomenon of passengers waiting a long time for taxis is particularly common, especially in urban hotspots. In addition, taxis pick up passengers randomly at busy intersections or sections, and sometimes do not even stop at the roadside. This can interfere with the operation of other vehicles and can severely affect road safety and traffic flow.
The TS (TS), a kind of transportation infrastructure set up in places where passengers gather and disperse, provides an identifiable, orderly, efficient, and quick waiting environment of benefit to both drivers and passengers ( 4 ). To alleviate the problems described above, more and more cities are locating TS on the side of main roads. However, the site selection of roadside TS usually depends on the personal experience of the traffic manager or a sampling survey of drivers and passengers, which lacks scientific decision-making criteria ( 5 ). The inappropriate organizational layout not only fails to allow TS to play a positive role but also wastes the space resources and aggravates traffic in the surrounding areas. This paper attempts to optimize the spatial layout of TS by using global positioning system (GPS) trajectory data mining and location model comparisons. It rovides a scientific reference for decision makers from multiple perspectives.
Unlike bus stops and subway stations, TS are not suitable for widespread deployment in urban areas as they would restrict the efficient travel of the public and lead to the loss of flexibility from taxi service. Consequently, two major considerations need to be addressed in the process for selecting sites for TS: (1) Which parts of the city require TS? and (2) What are the optimal locations for TS in those areas?
For the first issue, it is necessary to set up TS in areas where the users, that is, passengers and taxis appear frequently. As an example, TS at airports and railway stations usually have a high usage rate. But in major cities, TS can be a problem ( 2 ). In this complex context, the most appropriate choice can be found by analyzing and mining data generated from real taxi trips. Database management tools are helpful for efficient statistical processing of large-scale taxi track data. Spatial analysis of a GIS platform can quantify the density of taxi demand points, and its visual operating system is more conducive to identify the geographic spatial features of setting areas.
For the second issue, it should be clear that the optimal sites for TS depend on planning objectives. From the perspective of users, the scheme with the lowest access costs may be the optimal. From the perspective of investors, the scheme with the lowest construction and maintenance costs may be the best. Three classic problems in the location field—the set covering problem (SCP); the maximal covering location problem (MCLP); and the p-median problem (PMP)—investigate the site selection of facilities from different decision-making objectives. Existing abundant location models are based on them and are extended for complex practical applications.
This paper attempts to address the TS location problem (TSLP) from multiple perspectives. Taxi demand extracted from taxi GPS data is used to explore the appropriate area for locating TS. Refering to the actual characteristics of TS, we conduct the division of zones generating demand and the selection of supply and demand points. Different TS location models (TSLM) are established based on SCP, MCLP, and PMP. The TSLM based on PMP is extended by incorporating the maximum acceptable distance to compare and discuss the validity of four TSLM on TSLP. The main contributions of this paper are summarized as follows: (1) The optimal layout solutions of three classical site selection problems are compared and the results show that the p-median model is more applicable for TSLP because of its minimum control of passenger travel cost; (2) The extended TSLM investigates a PMP with the limit of maximum acceptable distance and achieves the enhancement of access willingness on the premise that the target demand is satisfied; and (3) Based on the judgment of the excess service capability, the number of parking spaces for each TS is optimized to a more reasonable value. The remainder of this article is organized as follows. The next section reviews the related studies on taxi GPS data mining and facility location approaches. We then describe the dataset used in the case study. Afterwards, we present the methodology for solving the TSLP. Several sets of comparative experiments are carried out in the case study. Lastly, we conclude this paper.
Literature Review
It is extraordinarily important to consider the movement of taxi passengers when conducting the research to improve the taxi operation market ( 6 ). In the early studies, travel information was collected by means of questionnaire survey, interview, and network sampling. However, these traditional methods have limitations such as the large workload, high cost, narrow coverage of respondents, and low accuracy of reports ( 7 ). With the widespread installation of GPS devices in city taxis, massive individual trajectory data can be easily accessed ( 8 , 9 ). Mining the potential information of taxi GPS data provides a new perspective for the research of taxi services and other relevant fields. Moreira et al. ( 10 ) predicted the spatial and temporal distribution of taxi passenger demand in the short term from the GPS data of a taxi company in Porto, Portugal. Qian et al. ( 11 ) used massive taxi data from New York to analyze and visualize the spatial variation of taxi ridership. Based on historical and real-time data, Zhang et al. ( 12 ) inferred the arrival time and demand of passengers through online training and presented an application to achieve the equilibrium between passenger demand and taxi supply. Apart from the demand analysis, digital trajectories are also widely applied to exploring the behavior patterns of taxis and passengers ( 13 , 14 ), uncovering taxi service strategies ( 15 , 16 ), inferring travel purpose ( 17 , 18 ), and so forth.
In metropolitan areas, the behavior decision-making of drivers and passengers may be affected by TS on the surrounding roads, which have attracted the attention of researchers. Kitamura and Yoshii ( 19 ) modeled the preferences for traveling toward TS based on a single-level discrete choice model and GPS data. Moreira et al. ( 20 ) used vehicle data to predict the spatial–temporal distribution of taxi demand and recommended a TS with the minimum waiting time for drivers in real time. Wong et al. ( 21 ) explored the preferences of taxi drivers in heading for a TS to seek passengers and waiting at TS and found that the decisions are influenced by the number of passengers waiting at TS. Wong et al. ( 6 ) modeled the search behavior of taxi customers and pointed out that both passengers and drivers make decisions about whether to use TS based on the real-time conditions. These studies about taxi drivers and passengers focused on the choices of areas in searching each other, which may be beneficial for giving some policy implications on how to improve the usage rates of TS and introduce additional TS in different regions. Nevertheless, these research projects were unable to determine the optimal number and locations for TS in each area.
Facility location problems have been studied for more than half a century ( 22 ). They have always been a hot topic, attracting wide attention and in-depth study. This section briefly reviews the fundamental location problems and their implementation in transport facilities siting. The PMP was introduced by Hakimi ( 23 ) with the objective of locating a certain number of facilities to minimize the total travel cost between demand and facilities. The p-center problem was to minimize the maximum travel cost. Both of them maximize the benefits of users to some extent, while ignoring the sensitivity of individual demand to travel cost changes. Covering problems, including SCP and MCLP, overcome the abovementioned shortcomings and consider the constraint of critical coverage distance. The SCP, proposed by Roth ( 24 ) and Toregas ( 25 ), aims to minimize the number or the construction cost of facilities under the condition that all demands have to be served by facilities within the coverage distance. The restriction on the full coverage of demand may lead to the absence of optimal solutions or the inability to implement optimal solutions with limited budgets. This issue of SCP can be solved by MCLP, which was developed by Church and ReVelle ( 26 ) to maximize the demand coverage by locating a certain number of facilities within the coverage distance. However, MCLP and SCP share a common deficiency, that is, the overall travel cost of users is not directly incorporated into the model. To summarize, it can be said that the differences of optimization objective lead to the relative advantages and disadvantages of the fundamental models. Considering other factors, many new problems with practical application background are extended to them, such as the Hub location problem ( 27 ), the flow capture location model (FCLM) ( 28 ), and the flow refueling location model (FRLM) ( 29 ).
Although these approaches have been successfully employed in the field of transportation service infrastructure such as the siting of bus stops ( 30 , 31 ), bike-sharing stations ( 32 , 33 ), charging stations for electric vehicles ( 34 , 35 ), park-and-ride facilities ( 36 , 37 ), and roads ( 38 ), they still leave a huge blank in the location decision-making applications for TS. In the latest relevant papers, Qu et al. ( 5 ) present a three-stage strategy to choose the location of TS. Their objective is to minimize the access cost of passengers and the construction cost of TS. Ocalir et al. ( 2 ) develop a decision support system to evaluate the number of TS in a certain region. They assessed the existing TS in parts of 99 traffic zones located in Ankara to decide whether to give permission for any new ones.
In this paper, taxi GPS Trajectory data are used to mine the spatial–temporal distribution of taxi demand and determine the setting area and potential spots for TS. The TSLP will be investigated from multiple angles by comparing the validity of four TSLM on the spatial layout optimization of TS.
Methodology
Basic Research Data
This paper reports a case study on optimizing the spatial layout of urban TS in a city in China. The taxi GPS data used in the research were collected from about 7,200 taxis in this city. All taxis were equipped with onboard GPS, which records vehicle identification, positioning time, latitude and longitude, speed, and other relevant information in real time. An intelligent terminal connected to the GPS device was also installed on the vehicles to obtain the vehicle status, which is a binary variable indicating whether the taxi is occupied by passengers; the status was 1 if the taxi is occupied and 0 if it is free. The sampling interval was generally around 20s. The raw data were collected over the course of a week in June 2015.
Generally, when the vehicle state converts from 0 to 1, the first GPS point with state of 1 is regarded as the approximate taxi pick-up point. By contrast, when the state converts from 1 to 0, the first GPS point with state of 0 is regarded as the taxi drop-off point. The pick-up point represents the origin of taxi trip, that is, the location where taxi demand was generated. Therefore, we first carried out the raw data preprocessing using the database Microsoft SQL Sever2008 and obtained more than 150 million valid data to extract effective taxi demand information with spatial–temporal dynamic attributes.
Recognition of Taxi Stand Setting Area
Determining the appropriate setting area is the premise for optimizing the spatial layout of TS. It would obviously be a waste of human, material, and spatial resources to conduct site selection in an area where TS are not required. So which areas need TS? What kind of features do they exhibit in geographical space? To answer these questions, we first define the taxi travel hotspots, that is, areas with high demand for taxis and dense distribution of pick-up points. Then we analyze the spatial–temporal dynamic characteristics of the pre-processed taxi demand points and identify the feasible setting area of TS on GIS platform.
In the time dimension, we count the daily variation frequency of taxi pick-up/drop-off points (Figure 1a). The statistics suggest that the highest and the lowest demand for taxis during a week occurs on Friday and Sunday, respectively. This is consistent with our experience that Friday is the last working day of the week when people tend to go out for entertainment after work, leading to more taxi trips. By contrast, Sunday is the second day of the weekend and people prefer to rest at home to prepare for the work week ahead, leading to fewer taxi trips.
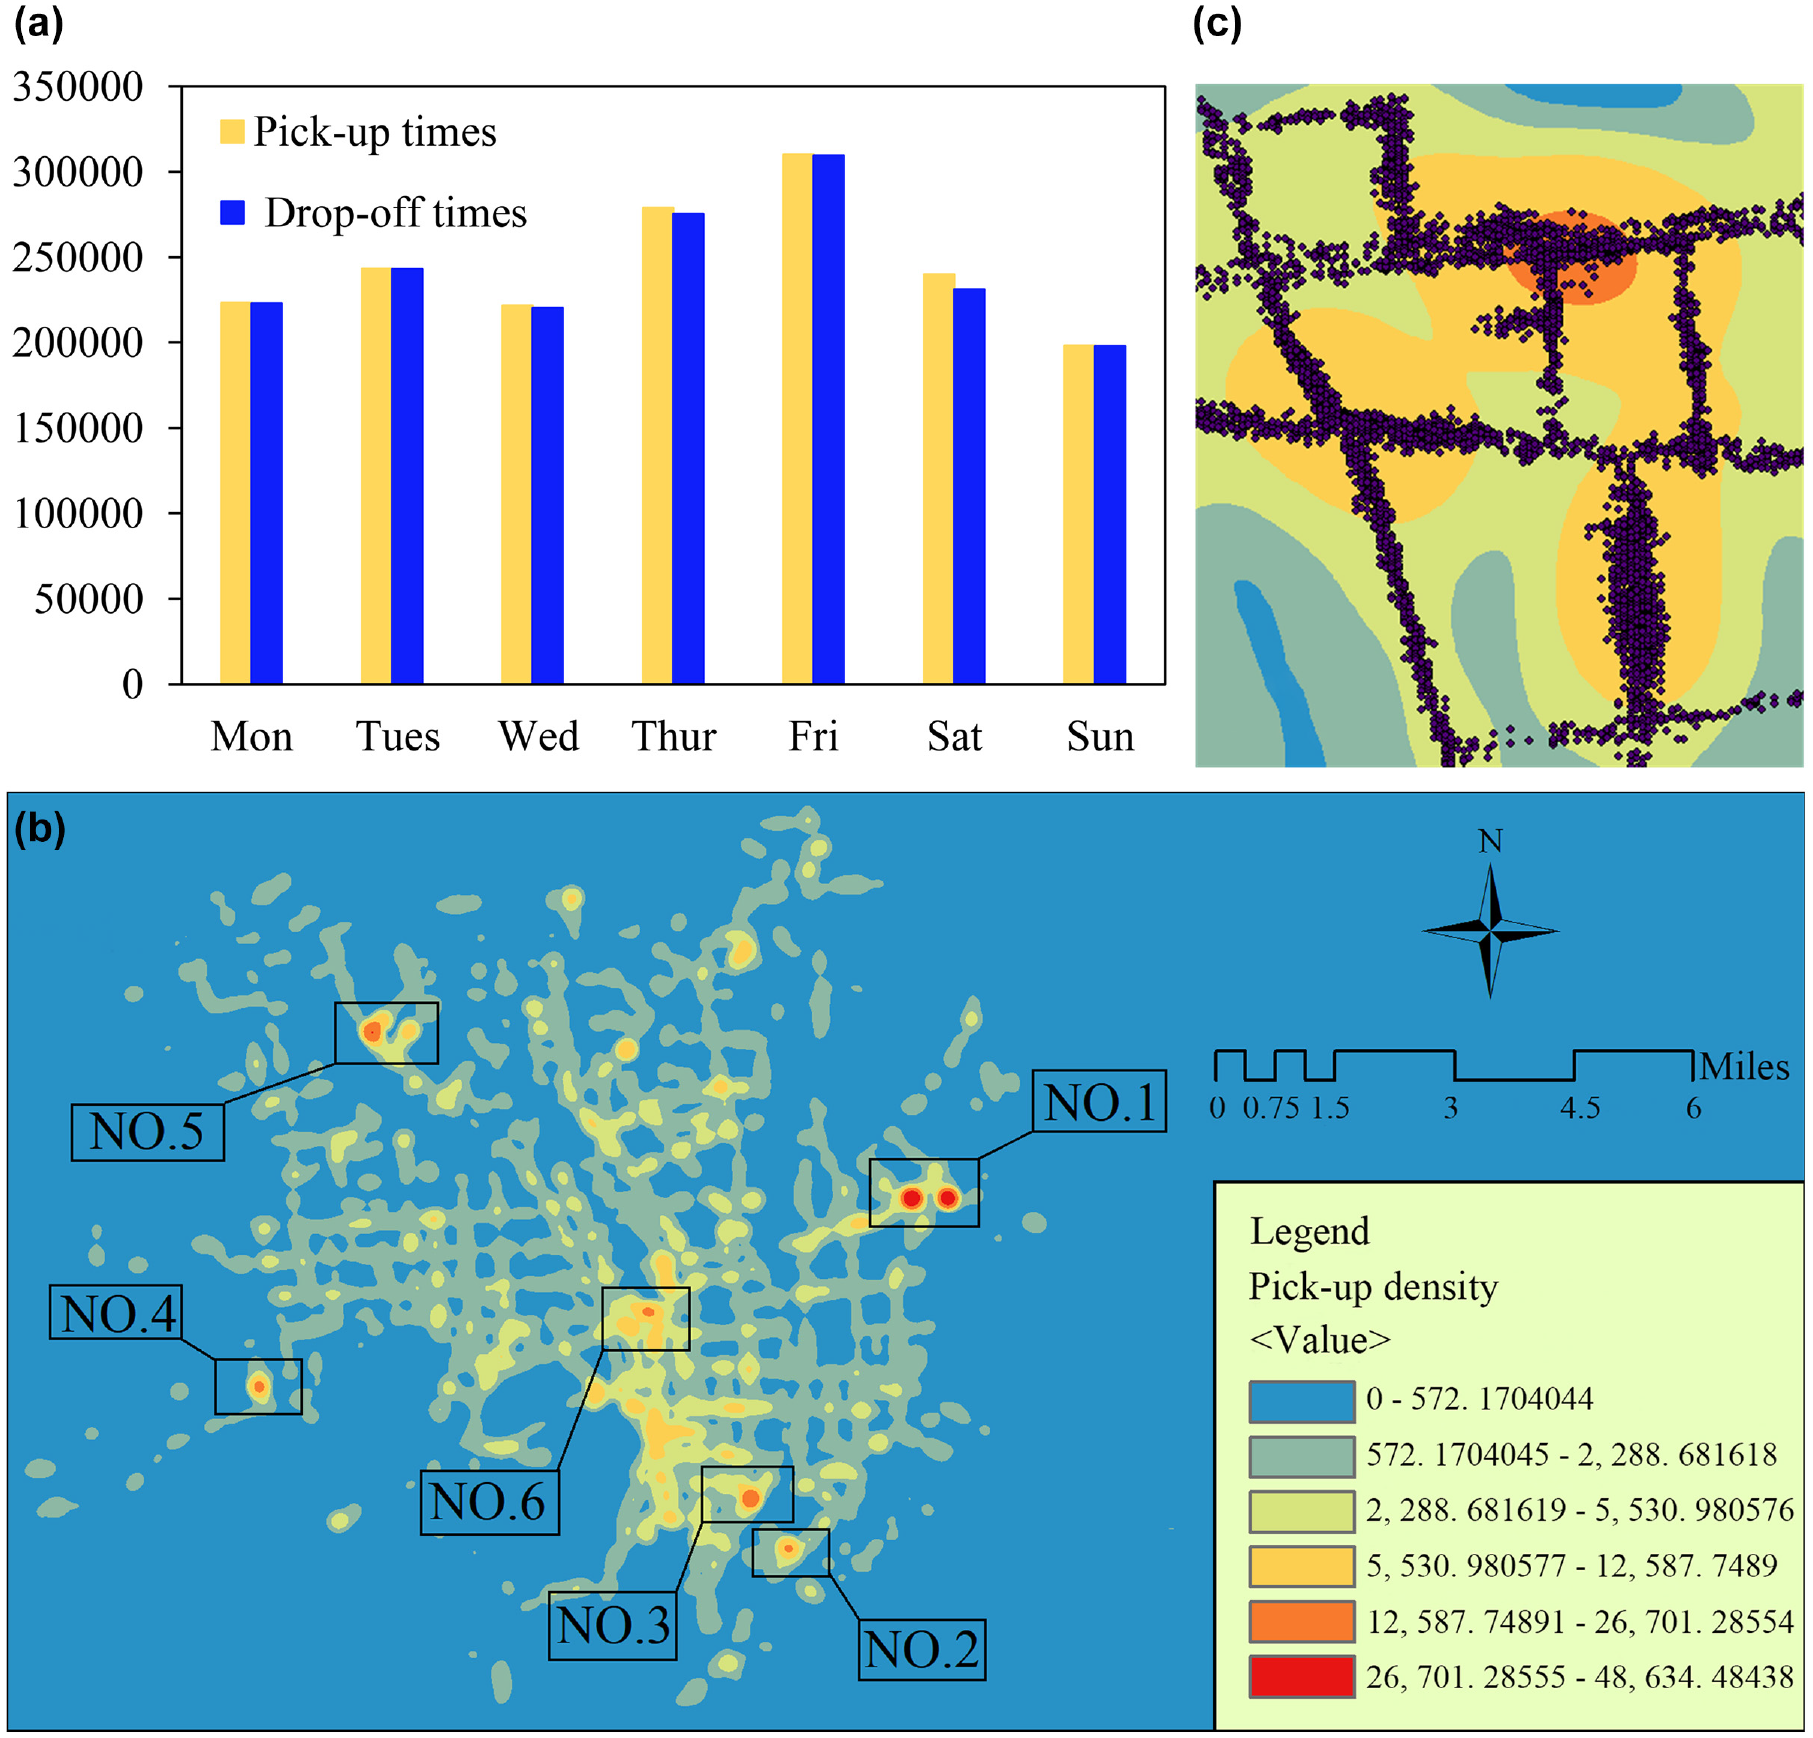
(a) Daily variation of taxi picking up/dropping off frequency; (b) heat map of taxi pick-up points within the urban area; (c) and regional characteristic map of taxi stand setting.
In the spatial dimension, we conducted the kernel density analysis on the 24-hr data from Friday to measure the dense grade of taxi demand and visualize the taxi travel hotspots with the help of ArcGIS10.2. The result (Figure 1b) indicates that there are six hotspots, of which the no. 1 to 5 belong to the railway station or coach station, while no. 6 is located in the central business district (CBD). As large public places where people and vehicles gather and distribute, stations are usually equipped with TS at fixed locations to satisfy passengers’ travel demands. Therefore, the hotspot with a clustered point status does not meet the research conditions of a roadside TS. On the contrary, the CBD has many busy streets with high travel volume leading to the high construction demand for TS. This kind of hotspot with a diffuse network status is suitable to be selected as the research area for TS siting (Figure 1c).
Estimation of Taxi Stand Potential
TS enable passengers to spot taxis quickly. Potential sites should, therefore, be determined based on the spatial generation pattern of demand. In practice, passengers appear on the street randomly, which makes the location of roadside TS particular in that they require opposite and staggered distribution. In view of this constraint, we divided the road network in the study area into adjacent zones according to a certain range
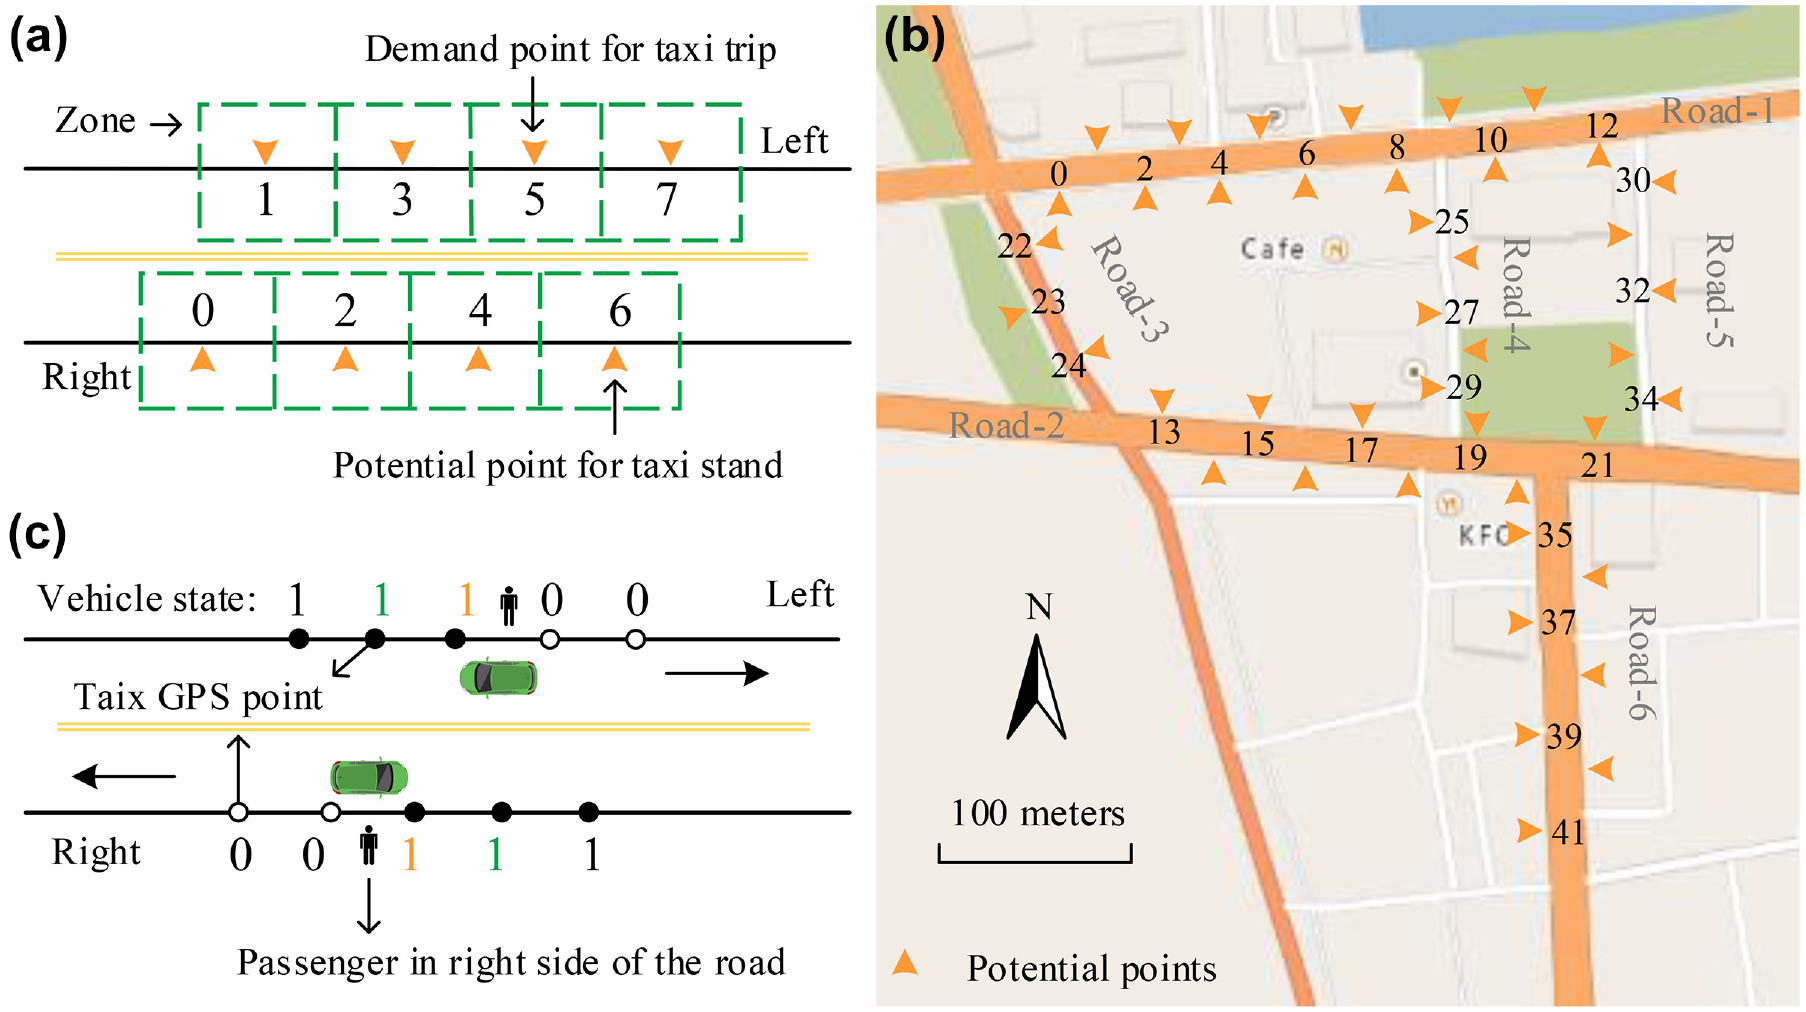
(a) Division of zones and distribution of supply and demand points; (b) potential locations of taxi stands (TS) in the setting area; and (c) principle diagram for judging passengers’ position and direction.
On the demand side, the difference between the longitude and latitude of two adjacent GPS points for the same taxi can reflect the direction of travel, indirectly indicating which side of the road the taxi trip occurs on (Figure 2c). After adding a new field of driving direction to taxi pick-up dataset, we extract the frequency of taxi trips nit in any demand point i at any time span t. Referring to the research of Qu ( 5 ), the average number of passengers per taxi trip np is 2. Therefore, we have the number of passengers, that is, the taxi demand:

On the supply side, the distance dij from demand point i to potential point j is calculated based on three spatial location relationships between them.
1) Same zone: Assuming that passengers appear uniformly on a straight line on both sides of the potential point j, we have:

2) Same side of the road, different zone: The distance dij equals the metropolitan distance between two points:

3) Different sides of the road, different zone: The distance dij is based on the addition of Equation 3 and the street width ds which can be expressed as Equation 4:

Description of Location-Allocation Models
In this section, we introduce and design different TSLM based on three classic facility location problems: SCP, MCLP, and PMP. To simplify the complexity of analysis and guarantee fairness of the comparative context, the following two basic assumptions are made in this paper: (1) Passengers at the same demand point will choose the same TS; and (2) In any time span, taxis can provide services for passengers without interruption. For ease of reference, some symbols and variables used in the model and analysis are listed as follows:
TSLM-SCP
The SCP was first adopted to address the siting of emergency service facilities such as fire and ambulance stations. The model focuses on the minimum construction cost or total number of facilities under the premise of covering all demand.
The mathematical expression of the TSLM based on SCP (TSLM-SCP) is as follows.

Subject to:





In TSLM-SCP, the objective function (5) is to minimize the total number of TS. Constraint (6) guarantees all taxi demand can be covered. Constraint (7) requires that the demand point i is covered by the potential point j only when a TS is located at point j. Constraint (8) specifies that the total taxi demand covered by the potential point j cannot exceed the maximum service capacity of the point j within any time span t. Constraints (9) and (10) indicate integer conditions on binary decision variables Xj and Yij.
TSLM-MCLP
The SCLP model concerns the maximum demand covered by service facilities under the condition that the number of facilities (P) and the critical coverage distance (Cd ) are determined.
The mathematical formulation of the TSLM based on MCLP (TSLM-MCLP) is as follows.

Subject to: (7)∼(10)


In TSLM-MCLP, the objective function (11) is to maximize the taxi demand covered by TS. Constraint (12) represents that there are some demand points that cannot be covered by any TS. Constraint (13) limits the number of TS to P.
TSLM-PMP
The PMP has always been a hot topic in the research field and has been widely used in public places and logistics warehouse location. The PMP model aims to minimize the sum of the weighted distance from the demand point to the nearest facility under the condition that the number of service facilities is determined. And the weighted distance usually refers to the product of the demand and the distance from the demand point and the service facility.
The mathematical formulation of the TSLM based on PMP (TSLM-PMP) is as follows.

Subject to:





In TSLM-PMP, the objective function (14) is to minimize the total walking distance of passengers. Constraint (15) guarantees all taxi demand can be covered. Constraint (16) limits the number of TS to P. Constraint (17) requires that the demand point i is covered by the potential point j only when a TS is located at point j. Constraint (18) specifies that the total taxi demand covered by the potential point j cannot exceed the maximum service capacity of the point j within any time span t. Constraints (19) and (20) indicate integer conditions on binary decision variables Xj and Yij.
E-TSLM-PMP
Since the PMP model ignores the sensitivity of individual demand point to travel satisfaction, the extended TSLM-PMP (E-TSLM-PMP) is established to consider the maximum acceptable walking distance for passengers which can be formulated as follows:

Subject to: (15)∼(20)

In E-TSLM-PMP, objective (21) is the same as objective (14). Constraint (22) ensures that the demand point i can be covered by points j only when the distance dij cannot exceed the critical coverage distance.
Computational Experiments
Genetic Optimization Procedure
Because of the inherent complexity of NP-hard, there is no polynomial-time algorithm for the facility location problem unless P = NP. In computational experiments, we adopt the genetic algorithm (GA) to solve all TSLM. The chromosomes of the location scheme are encoded by binary coding in which the variable on each code indicates whether a TS exists; the code length presents the number of potential TS. The initial population is generated randomly to represent the initial location schemes. The fitness function of each individual is obtained by transforming the objective function of corresponding TSLM. Through five basic steps of population generation, fitness evaluation, roulette wheel selection, one-point crossover, and single-point mutation, the iterative search process of the optimal solution is completed.
For the E-TSLM-PMP with the strict constraints of P, Dc, and Cd, a location-allocation scheme that satisfies all limits may not exist, which will lead to infinite iterations in the algorithm. To guarantee the problem feasibility, we pre-filter the number of TS entering the model. Under a certain Cd, the TSLM-SCP is first solved by GA to obtain the minimum P under full coverage. It should be noted that here we perform mutation operations by randomly selecting a gene on the individual coding string for deletion processing. Values not less than the minimum P are then incorporated into TSLM-PMP for the same Cd to ensure the existence of feasible solution.
Parking Spaces Evaluation
Assuming that the geometric size of TS is appropriate, the maximum service capacity per hour of a parking space in TS can be calculated as follows.

where g/C is the effective green time in each signal cycle (the roadside TS is 1.0), tc is the time interval between two consecutive taxis (unit: second), Za is the unilateral test quantity corresponding to the probability of queuing at a TS, cv and td respectively represent the deviation coefficient of residence time and the mean residence time. The relevant parameters refer to the conclusion values from an actual investigation conducted by Qu et al. ( 5 ). To simplify the algorithm process and improve the computational efficiency, we preset the number of parking spaces as a constant of 3. In the extreme case of one TS existing, this appropriate value still covers all demand at any time span. For the solutions of TSLM, we traverse the actual demand covered by TS and judge whether the maximum service capacity with three parking spaces is excessive. If is, the optimization continues; if not, we retain the original conclusion.
Optimal Schemes Comparison
In general, the service radius of public transport stations is calculated as 300 m ( 39 ). Accordingly, we set Cd to 300 m in the TSLMs. By solving the TSLM-SCP, we obtained the minimum P that can cover all taxi demand within the hotspot and input P=4 into the other three models to record the optimal results (Table 1). It should be noted that the demand coverage of TSLM-MCLP also reaches 100% without full coverage constraint. In four solutions, Dc remains the same while the locations of TS are completely different, which means that the TSLM-SCP only shows a possible location-allocation scheme under its optimization objective of P=4. In fact, there are more TS location solutions that satisfy the constraints of full coverage and critical coverage distance. Although the TSLM-MCLP and TSLM-PMP are not designed to obtain the minimum P, they are able to give the optimal locations that meet their own goals under the constraint of P. And the Td of E-TSLM-PMP is 987,876.090 m, which is the minimum in the results of three models with Cd =300. Since there is no constraint on the Cd, the Td of TSLM-PMP is 929,088.89 m, which is the minimum in the results of four models. However, the maximum travel distance exceeds 300 m for a portion of passengers in TSLM-PMP, such as the demand point of no. 41, while the E-TSLM-PMP can avoid such a situation effectively.
Comparison Results of Four Models with Cd =300

In addition, it can be seen that all TS in four layout schemes can be configured with no more than two parking spaces to meet service demand. This can be explained by the number of parking spaces pj being set as a uniform constant in the process of solving models, therefore the result of demand assignment ensures that the demand served by TS is within the maximum service capacity of TS. However, the final optimization results indicate that the service capacity for each TS is in surplus. To avoid the waste of space resources, the pj will be optimized to a minimum that can satisfy the actual demand.
The access willingness of passengers can seriously affect the usage rate of TS. To this end, we increase the Cd from 100 m to 500 m, with an increment of 50 m for each time, and explore the influence of the Cd on the sites selection (Table 2). Since the TSLM-PMP ignores the constraint of Cd, we exclude it from this experiment to ensure fairness. Similarly, the same access limits are used to make a comparison. P values obtained from TSLM-SCP are incorporated into the other two models. The results indicate that the Dc of TSLM-MCLP reaches 100% in all cases. The Td of E-TSLM-PMP is always the minimum among three schemes, while there is no significant difference in comparison between TSLM-SCP and TSLM-MCLP. This further proves that the location-allocation scheme is not unique under the triple restrictions of Cd, full coverage, and P. Different TSLMs will choose the solutions that are consistent with their own objectives from feasible solutions. TSLM-SCP and TSLM-MCLP only focus on whether the demand point is within the Cd of TS. As long as the distance does not exceed Cd, it is not a problem for them. On the contrary, the absolute distance is the most relevant factor in the target of E-TSLM-PMP.
Optimal Solutions of TSLM-SCP, TSLM-MCLP, and E-TSLM-SCP with Different Cd
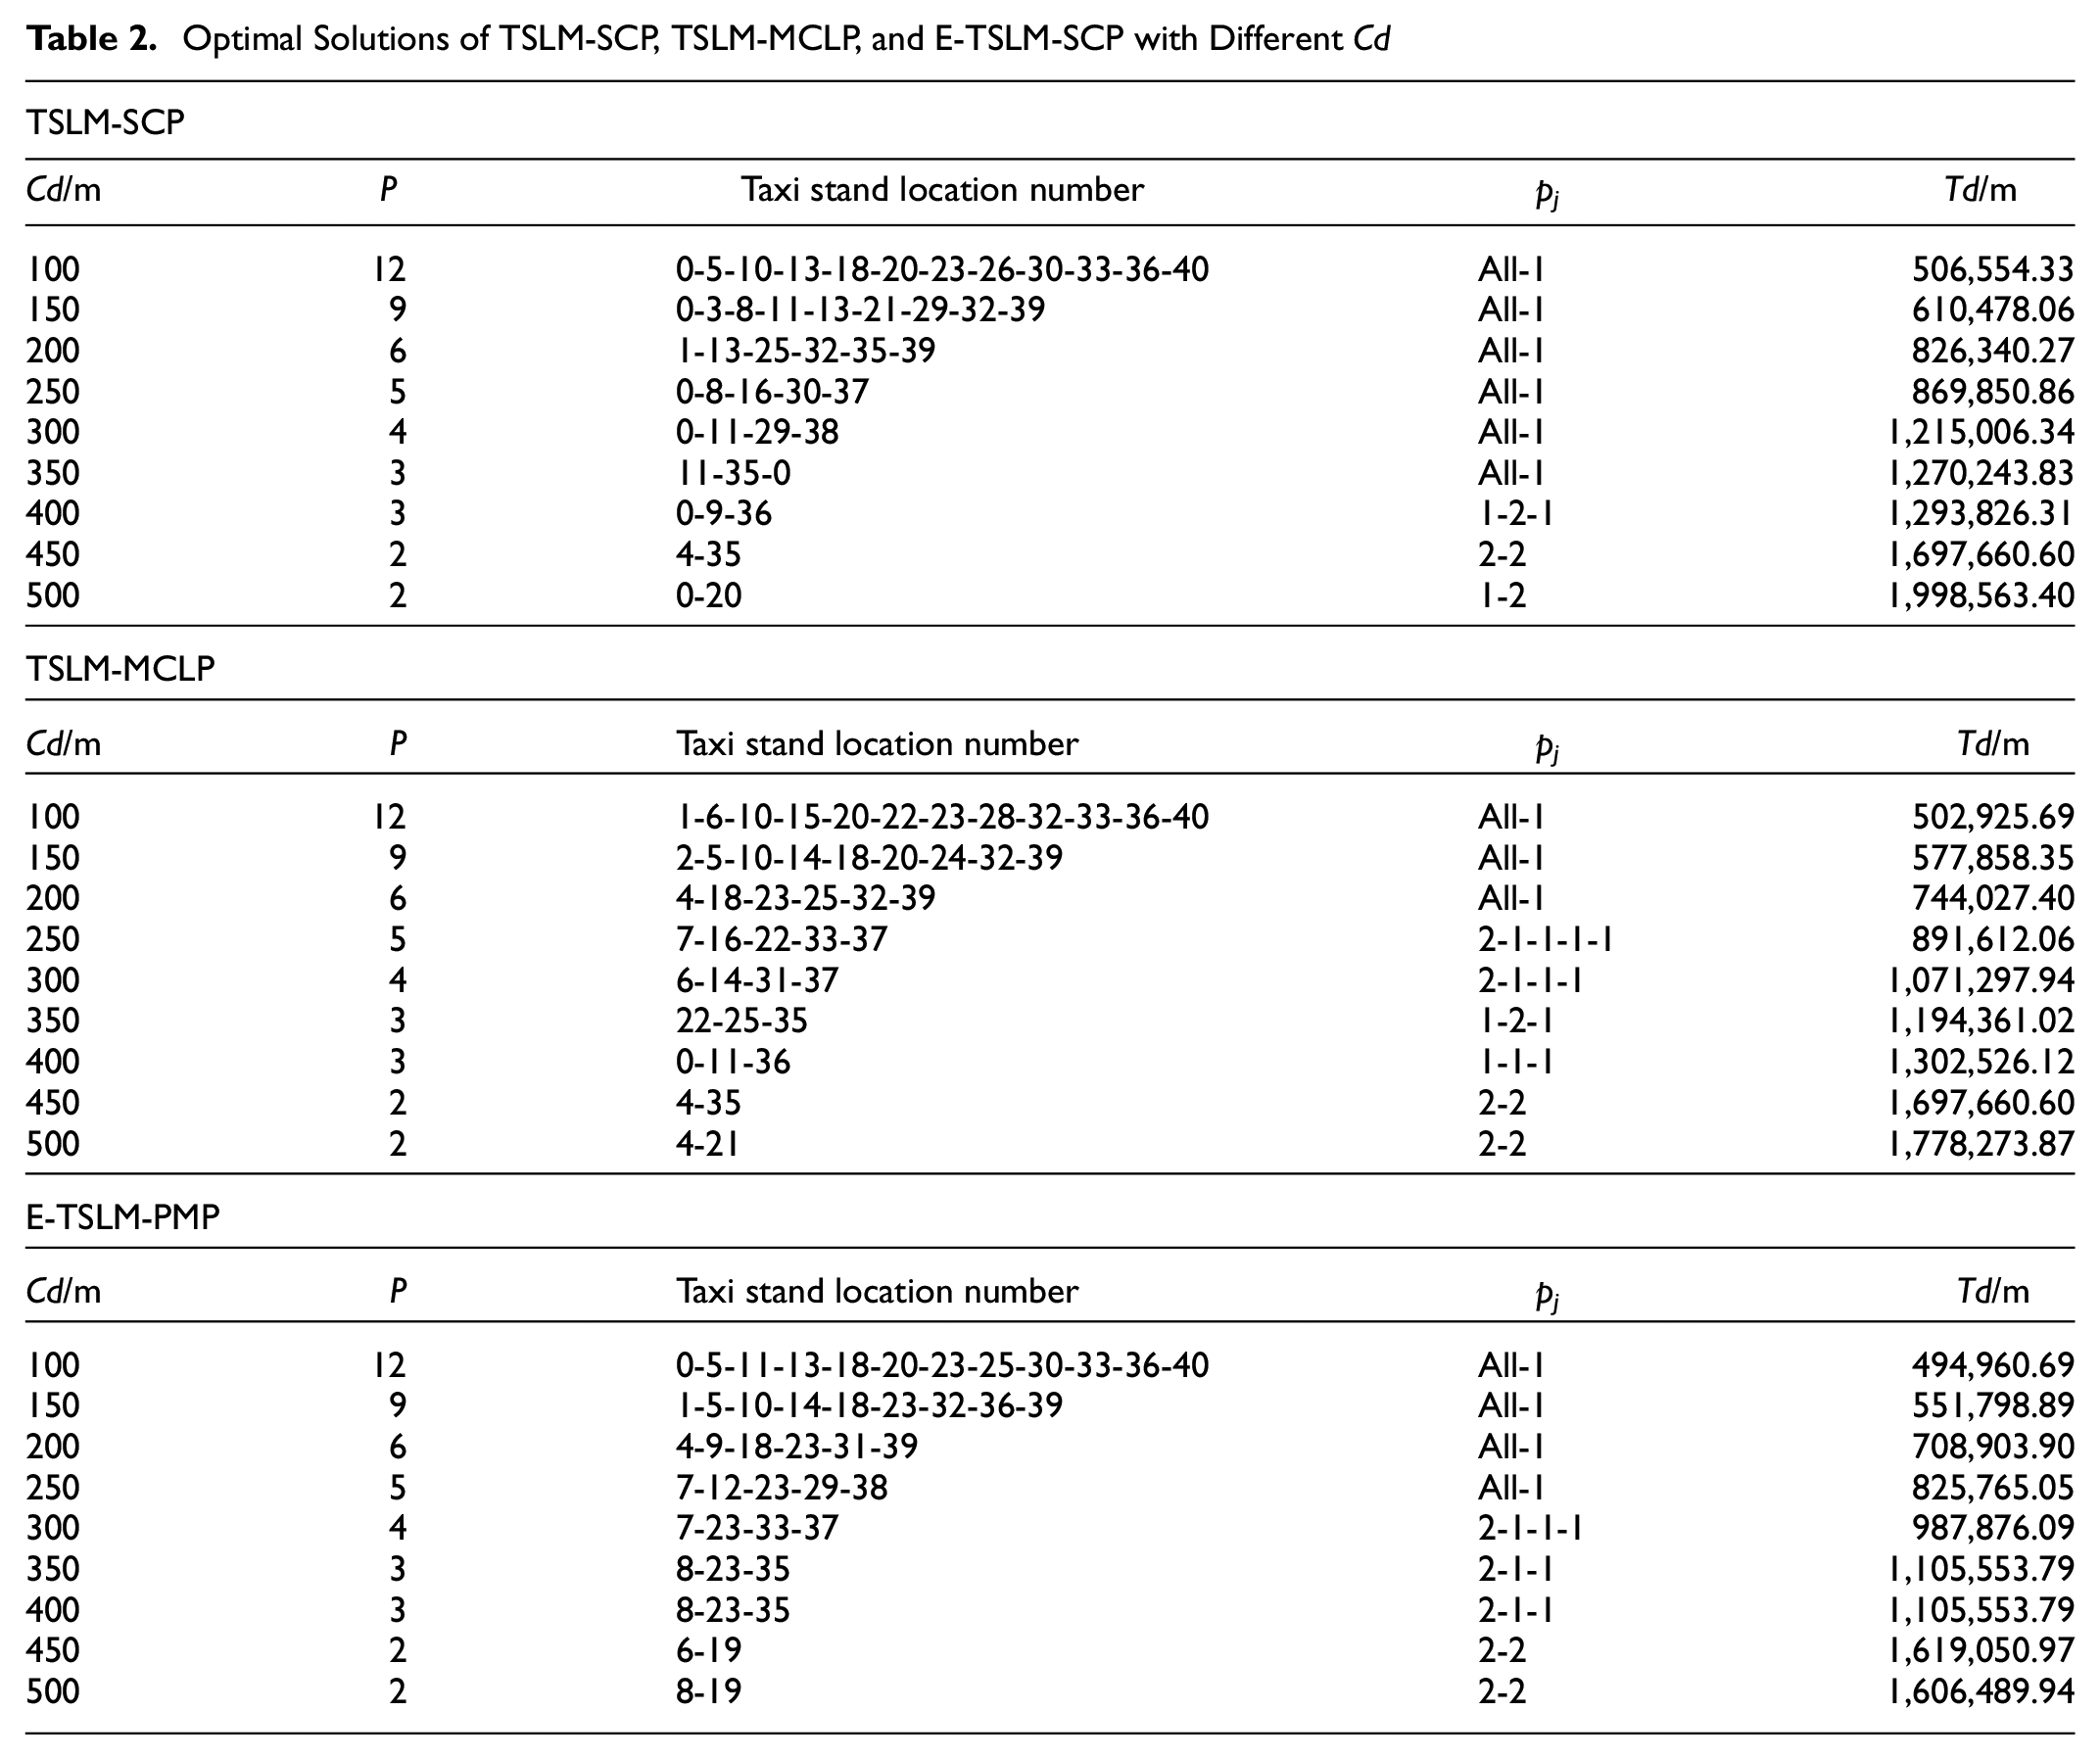
In the process of Cd increasing from 100 m to 500 m, the minimum P reduces from 12 to 2. The minimum Td increases from 494,960.69 to 1,606,489.94, which is consistent with our intuition. The smaller Cd states that passengers are reluctant to travel a long way to take a taxi. Therefore, it is necessary to set more TS close to taxi demand, which makes the minimum P value with Cd = 100 become the maximum in nine cases. Meanwhile, the increase of facilities is beneficial for passengers to head for TS at shorter distances, which explains the minimum Td value. The larger Cd indicates that passengers can accept a longer distance to take a taxi. Therefore, there are more choices for deciding where to locate TS. For TSLM-SCP, the location scheme is always the one with the minimum P. The fewer TS there are, the farther the distance between passengers and TS. This induces an increase of Td. These comparisons verify that the critical coverage distance has a significant impact on the location selection of TS.
As for parking spaces, when Cd is less than 200, one should be allocated for TS under all schemes. While two parking spaces may be allocated under some schemes when Cd is greater than 200. This can be explained by the increase of Cd leading to a decrease in P and the constant Dc leading to an increase in the demand covered by individual TS. Under the premise that the Sp is limited, to serve more passengers, the pj will be increased to improve the overall service capacity of TS.
In practice, the municipal authorities may have different opinions on the number of TS. We conduct another comparison between TSLM-MCLP and TSLM-PMP to examine the impact of the P value on the site selections. In this set of computational experiments, we increase the P from 1 to 12 with the Cd of 100, and record the Td, Dc, and the average walking distance Ad (Figure 3).
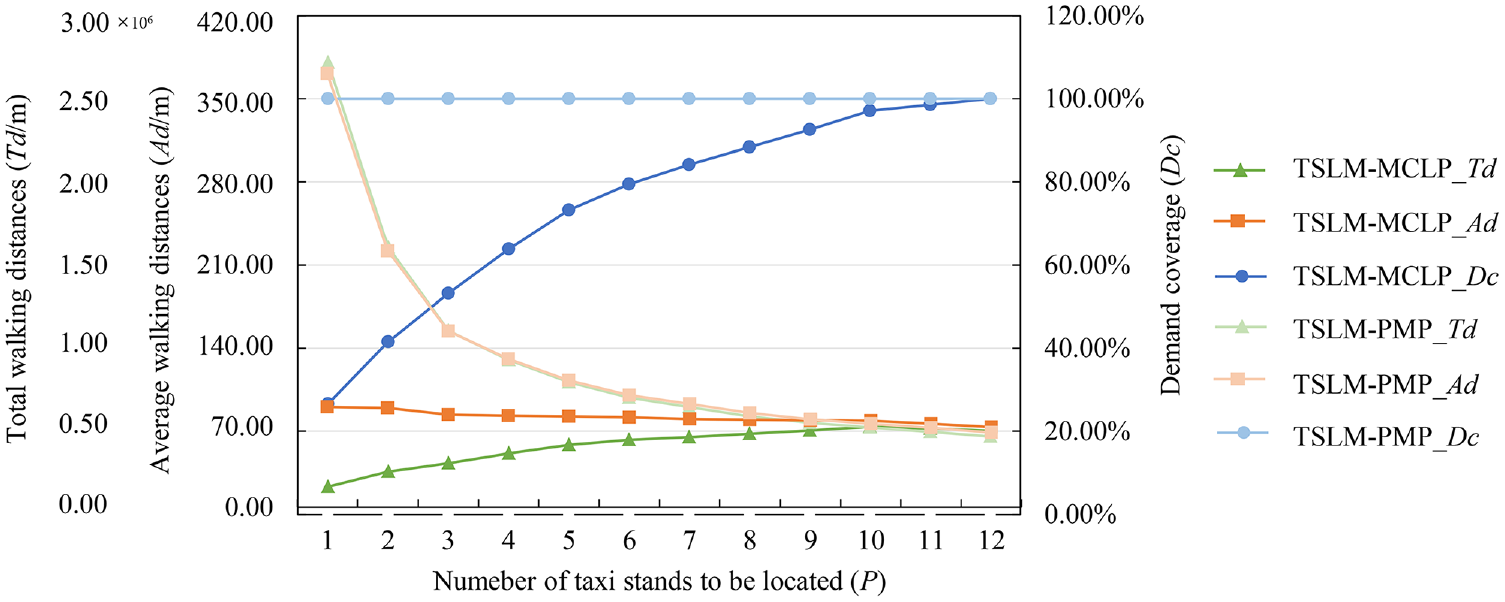
Comparison of TSLM-MCLP and TSLM-PMP with P increased from 1 to 12.
When only one TS is located in the study area, most demand points are far away from the TS. As a result, the distance between them even exceeds the Cd. In TSLM-MCLP, only demand points within the Cd can be served by TS, resulting in extremely low Dc and the minimum Td. In TSLM-PMP, whether the distance between the demand point and TS is within the range of Cd or not, the demand point will be covered by TS, which results in Td being large. With the increase of P, more and more demand can be covered in TSLM-MCLP, leading to the increase of Dc and Td. For TSLM-PMP, the increase of P means that passengers have more choices and tend to give priority to TS closer to them, which explains the significant decrease of Td. The results shown in Figure 3 indicate that increasing the available number of TS from 1 to 12 decreases the Td by 82.80%. When P = 12, the Dc of both schemes reaches 100%. TSLM-MCLP guarantees that the travel distance of each passenger is within Cd, while TSLM-PMP aims to minimize the Td without considering whether the individual walking distance is constrained by Cd. The Ad is the ratio of the total walking distance Td to the total demand covered by TS. Therefore, the Ad of TSLM-PMP decreases with the decrease of the Td, while that of TSLM-MCLP shows a slight decline because of the co-growth of Td and Dc. The above analysis results are beneficial for policymakers to evaluate the effect of the number of TS on the demand coverage and the travel cost.
Conclusion
Locating TS in a reasonable way is of great help in improving the use of the TS and efficiency of taxi services, which facilitates public transport. In this paper, we conduct a case study on optimizing the spatial layout of urban TS in China. The primary task of this work is to identify the setting area of TS. Using taxi GPS data collected from about 7,200 taxis, we extract the taxi pick-up/drop-off points and explore their spatial–temporal distribution on the GIS platform. The kernel density analysis visualizes the hotspots with high taxi trips in a city. Through the recognition of their geographic features, the area with a diffuse network status is selected for the location of TS.
In relation to supply and demand, we generate interlaced and adjacent zones on the road network, which are consistent with the actual location characteristics of TS. Meanwhile, the geometric center of each zone is regarded as the point where taxi demand occurs and the potential point for TS. Based on the difference of longitude and latitude between two adjacent GPS points, we judge the position and direction of passengers on both sides of the road and calculate the taxi demand in each zone. The distance between demand points and potential points is measured according to the specific location.
Referring to three classical location problems—SCP, MCLP, and PMP—we design the corresponding TSLM—called TSLM-SCP, TSLM-MCLP, and TSLM-PMP—and develop an extended TSLM (E-TSLM-PMP) by incorporating the critical coverage distance into the PMP model. A genetic algorithm-based procedure is introduced for solving the extended E-TSLM-PMP. In addition, we also optimize the number of parking spaces, and discuss the impact of the maximum acceptable distance for passengers on the spatial layout of TS. The results of several comparative experiments on four TSLM state that both TSLM-PMP and E-TSLM-PMP guarantee full coverage of taxi demand and pursue the minimum access cost for customers under the condition of meeting the construction requirements. Since the individual travel satisfaction is not taken into account in TSLM-PMP, some passengers may still give up TS for a long walking distance. Compared with the other three models, the scheme of E-TSLM-PMP confirms the validity and practicability in the TS layout optimization. Our research, by integrating the TS location problem with multiple considerations, can provide transportation and municipal planners with different alternative solutions for conducting site selection.
Nevertheless, the research also demonstrates some notable limitations. Firstly, passengers in the same zone are assumed to use the same TS. In practice, because of the impact of travel purpose, travel direction, and other personal attributes of the traveler, passengers at the same point may have a different choice. In the future, the work presented should be extended by modeling passengers’ chosen behavior. The second limitation is the neglect of the variability of the traveling mode. Taxi passengers near bus stations or metro stations may transfer to the bus or the metro system. Therefore, more variable parameters should be further involved in the work presented. The last limitation is about the distance between TS. At present, there is no clear specification or standard to a recommended value for reference about the TS setting distance. Therefore, the partition length of the roads remains to be discussed further.
Footnotes
Acknowledgements
The authors would like to thank Monica Zhong for graciously providing the guidance on the ways to solve the grammatical issues. We would also like to thank other anonymous reviewers for their work on improving the paper.
Author Contributions
The authors confirm contribution to the paper as follows: study conception and design: Zhaowei Qu, Xin Wang; data collection: Xianmin Song; analysis and interpretation of results: Xin Wang, Haitao Li, Zhaotian Pan; draft manuscript preparation: Xianmin Song, Xin Wang. All authors reviewed the results and approved the final version of the manuscript.
Declaration of Conflicting Interests
The author(s) declared no potential conflicts of interest with respect to the research, authorship, and/or publication of this article.
Funding
The author(s) disclosed receipt of the following financial support for the research, authorship, and/or publication of this article: This work was supported by the Jilin Provincial Science and Technology Project: Urban Traffic Intelligent Control Strategy and Method Based on Big Data (Grant number 20180101063JC), and the Science and Technology Project of the Jilin Provincial Department of Education: Optimization Design of Public Transportation Stops Based on Urban Travel Data Features (Grant number JJKH20190153KJ).
Data Accessibility Statement
The data is not available for sharing because of Research Ethics Protocol terms.