
Abstract
Truck platooning has been demonstrated to possess several advantages in relation to energy savings. To implement this technology in the future, a better understanding of the effects of truck platooning on bridges is needed in relation to safety, serviceability, and remaining service life. This research aims at investigating the effects of truck platooning on the fatigue of steel girder bridges. Different types of platoons are simulated in line girder analysis for simple spans and two-equal continuous spans bridges. Then the rainflow counting method is applied to obtain the stress ranges and cycles. Miner’s rule is used to quantify the fatigue damage. The fatigue damage of different platoons is normalized by American Association of State Highway Transportation Officials Load and Resistance Factor Design Fatigue Load for comparison. The effects of the number of trucks and gap distances of truck platoons are further investigated. In some cases, truck platooning helps decrease the fatigue damage since, although truck platooning brings higher load effects, it also decreases the number of cycles. For platoons with different truck wheelbases, there are specific span to wheelbase ratios, beyond which fatigue damage decreases as gap distance increases. In addition, depending on the platoon configurations, there are ranges of span lengths where it is more beneficial to travel as truck platoons rather than traveling individually in relation to fatigue damage.
Truck platooning technology is considered by various researchers to yield positive results in relation to fuel consumption, decrease in CO2 emissions, and increase in highway capacity. The studies completed in 2011 by California’s PATH Program conducted experiments on truck platoons made up of three single-trailer five-axle trucks, longitudinally automated with gaps of 33 ft. The gap was defined as the headway distances between trucks. The results showed a 10% improvement in fuel consumption ( 1 ). Additionally, between 2008 and 2013, the Japanese Energy Intelligent Transportation System (ITS) program performed a study of platoons made up of three 25-ton trucks plus one light truck with gaps of 33 ft and 15 ft. The results indicated 8% and 15% of fuel savings for the cases of 33 ft and 15 ft gap, respectively. In addition, the study concluded that if 40% of the heavy trucks on expressways were within platoons, the total CO2 reduction along expressways would be 2.1% at 33 ft gap and 4.8% at 15 ft gap ( 2 ).
To implement this technology in the future and better understand the effects of truck platooning on bridges, further analysis in relation to the safety, serviceability, and remaining life is needed. Yarnold and Weidner evaluated the bending moments and shear forces caused by truck platoons made of Florida C5 legal load ( 3 ). Different truck arrangements ran over simple and continuous spans bridges of varying lengths. They performed line girder analysis to evaluate the bending moments and shear forces by truck platoons configured with gaps between 20 ft and 40 ft. The authors concluded that for the most cases, steel girder bridges designed by American Association of State Highway Transportation Officials (AASHTO) Load and Resistance Factor Design (LRFD) Bridge Design Specifications (BDS) are adequate while concerns are made for a small portion of long-span bridges subjected to closely spaced truck platoons ( 3 , 4 ). However, these results were based on truck platoons configured with only one truck. A more comprehensive approach is needed to contemplate a range of legal trucks that could form platoons. Although many existing bridges are structurally adequate to carry the truck platoons, fatigue of steel bridges is another critical concern related to the cyclical applications of the truck platoons. Lou et al. developed a probabilistic approach for fatigue evaluation of steel railway bridges with new resistance model ( 5 ).
This study investigated the effects of truck platooning on the fatigue damage of steel girder bridges for simple-span and two-equal continuous span bridge. Only longitudinal members were considered. The analysis focused on three objectives:
Compare the fatigue damage of truck platoons with different legal trucks;
Investigate the effect of number of trucks and gap distance of platooning on the fatigue damage;
Identify the cases where it is more beneficial to travel as truck platoons rather than as an individual truck.
Both AASHTO LRFD BDS and the AASHTO Manual for Bridge Evaluation (MBE) consider the stress-life method for load-induced fatigue design and fatigue life evaluation, respectively ( 4 , 6 ). In the current AASHTO LRFD BDS, two fatigue limit states are provided: (1) Fatigue I, infinite fatigue life design, and (2) Fatigue II, finite fatigue life design ( 4 , 6 ). This paper assumes that all stress cycles in this study cause cumulative fatigue damage. The fatigue damage analysis used in this paper is following the procedure used in calibrating Fatigue II limit state. For Fatigue I limit state, a different procedure is used, which is based on determining whether the stress from the vehicle or the platoon is exceeding the constant-amplitude fatigue threshold (CAFT). This study also assumes that trucks in the platoons have the same axle weights and axle configurations. This means that the variation in the configurations and axle weights are not considered. It is important to mention that bridges will behave differently in relation to dynamic impact for trucks traveling in platoons and traveling individually. Nassif and Nowak concluded the structural response caused by dynamic load, in absolute terms, is practically constant and does not depend on truck weight ( 7 ). However, this study focuses on the relative fatigue damage of truck platoons, which is defined as the ratio between the average fatigue damage by each truck in the truck platoons and fatigue damage caused by the AASHTO LRFD fatigue truck. To simplify the analysis, the authors assume the same dynamic impact for trucks traveling in platoons and traveling individually. Therefore, the effect of dynamic impact is not discussed in this study. An in-depth study is needed to investigate the dynamic behavior of bridges under the truck platoons and how it will impact the current AASHTO LRFD specifications and AASHTO MBE.
Methodology
A set of state legal loads, including AASHTO’s legal loads, were used to form the platoons made of two, three, and four trucks. In this study, the gap distance is defined as the spacing between the rear axle of the front truck and the front axle of the rear truck. The considered gap distance ranges from 20 ft to 40 ft with intervals of 10 ft. The truck platoons are then simulated in line girder analysis with span lengths ranging from 20 ft to 300 ft, for both simple spans and two-equal continuous spans. The moments are then extracted from the line girder analysis at the midspan of simple spans and at the middle support of continuous spans. Since the beam cross-sections are not defined, the beam stiffnesses are unknown. Thus, the bending moments are used to analyze fatigue loading in lieu of stress ranges. The rainflow counting method is applied to extract the moment ranges, Mi, and their corresponding number of cycles, ni, for each live load case. This approach counts the number of full reversal cycles, as well as partial cycles, and their range amplitude for a given load time history ( 8 ). From the outputs of the rainflow counting method, the average fatigue damage caused by each truck in a platoon is then calculated using Miner’s rule criteria, as shown in Equation 1:

where
MPi is the ith moment range caused by the truck platoon,
nPi is the number of stress cycles for the stress range caused by MPi,
A is a material constant,
Sx is the elastic section modulus, and
j is the number of trucks of the platoon.
Based on the basis of Equation 1, the average fatigue damage by each truck in the truck platoons is then normalized by the fatigue damage caused by the AASHTO LRFD fatigue load, as shown in Equation 2. Equation 2 is defined as the relative damage in this study.

where
DF is the fatigue damage caused by the AASHTO LRFD fatigue load,
MFi is the ith moment range caused by the AASHTO LRFD fatigue load, and
nFi is the number of stress cycles for the stress range caused by the moment range MFi.
Another investigated aspect in this research was to identify the situations when truck platoons are more beneficial than trucks traveling individually. The damage ratio is defined as the average damage caused by one truck in a platoon divided by the damage caused by the same truck but traveling individually. If the damage ratio is less than one, it means that running the trucks as platoons results in less fatigue damage than running the trucks individually. The damage ratio is defined in Equation 3 below:

where
DTRUCK is the fatigue damage caused by the individual truck,
MTi is the ith moment range caused by the individual truck, and
nTi is the number of stress cycles for the stress range caused by the moment range MTi.
Based on results from previous studies, it has been shown that single-trailer five-axle trucks are the most promising truck configuration for platooning. Table 1 shows the configuration of legal loads selected from various states for the analysis: (1) AASHTO Type 3S2; (2) Colorado Type 3S2; (3) Delaware T540; (4) Florida C5; (5) Illinois IL-PS5-36; and (6) Ohio 5C1. The Florida C5 has the shortest wheelbase while the Illinois IL-PC5-41 has the longest wheelbase. The Illinois IL-PC5-41 has the maximum tandem weight and the Colorado Type 3S2 has the maximum gross vehicle weight (GVW).
Selected Single-Trailer Five-Axle Trucks Configurations

Note: AASHTO = American Association of State Highway Transportation Officials; AS = axle spacing; AW = axle weight; GVW = gross vehicle weight; TW = truck wheelbase (distance between the first axle and the last axle of the truck).
Results and Discussions
The effects of the number of trucks and gap distances of truck platoons on the relative damage were investigated as shown in the following sections. In this study, the span to wheelbase ratio is defined as the ratio of span length and truck wheelbase and denoted as SR.
Relative Fatigue Damage
for Simple Span
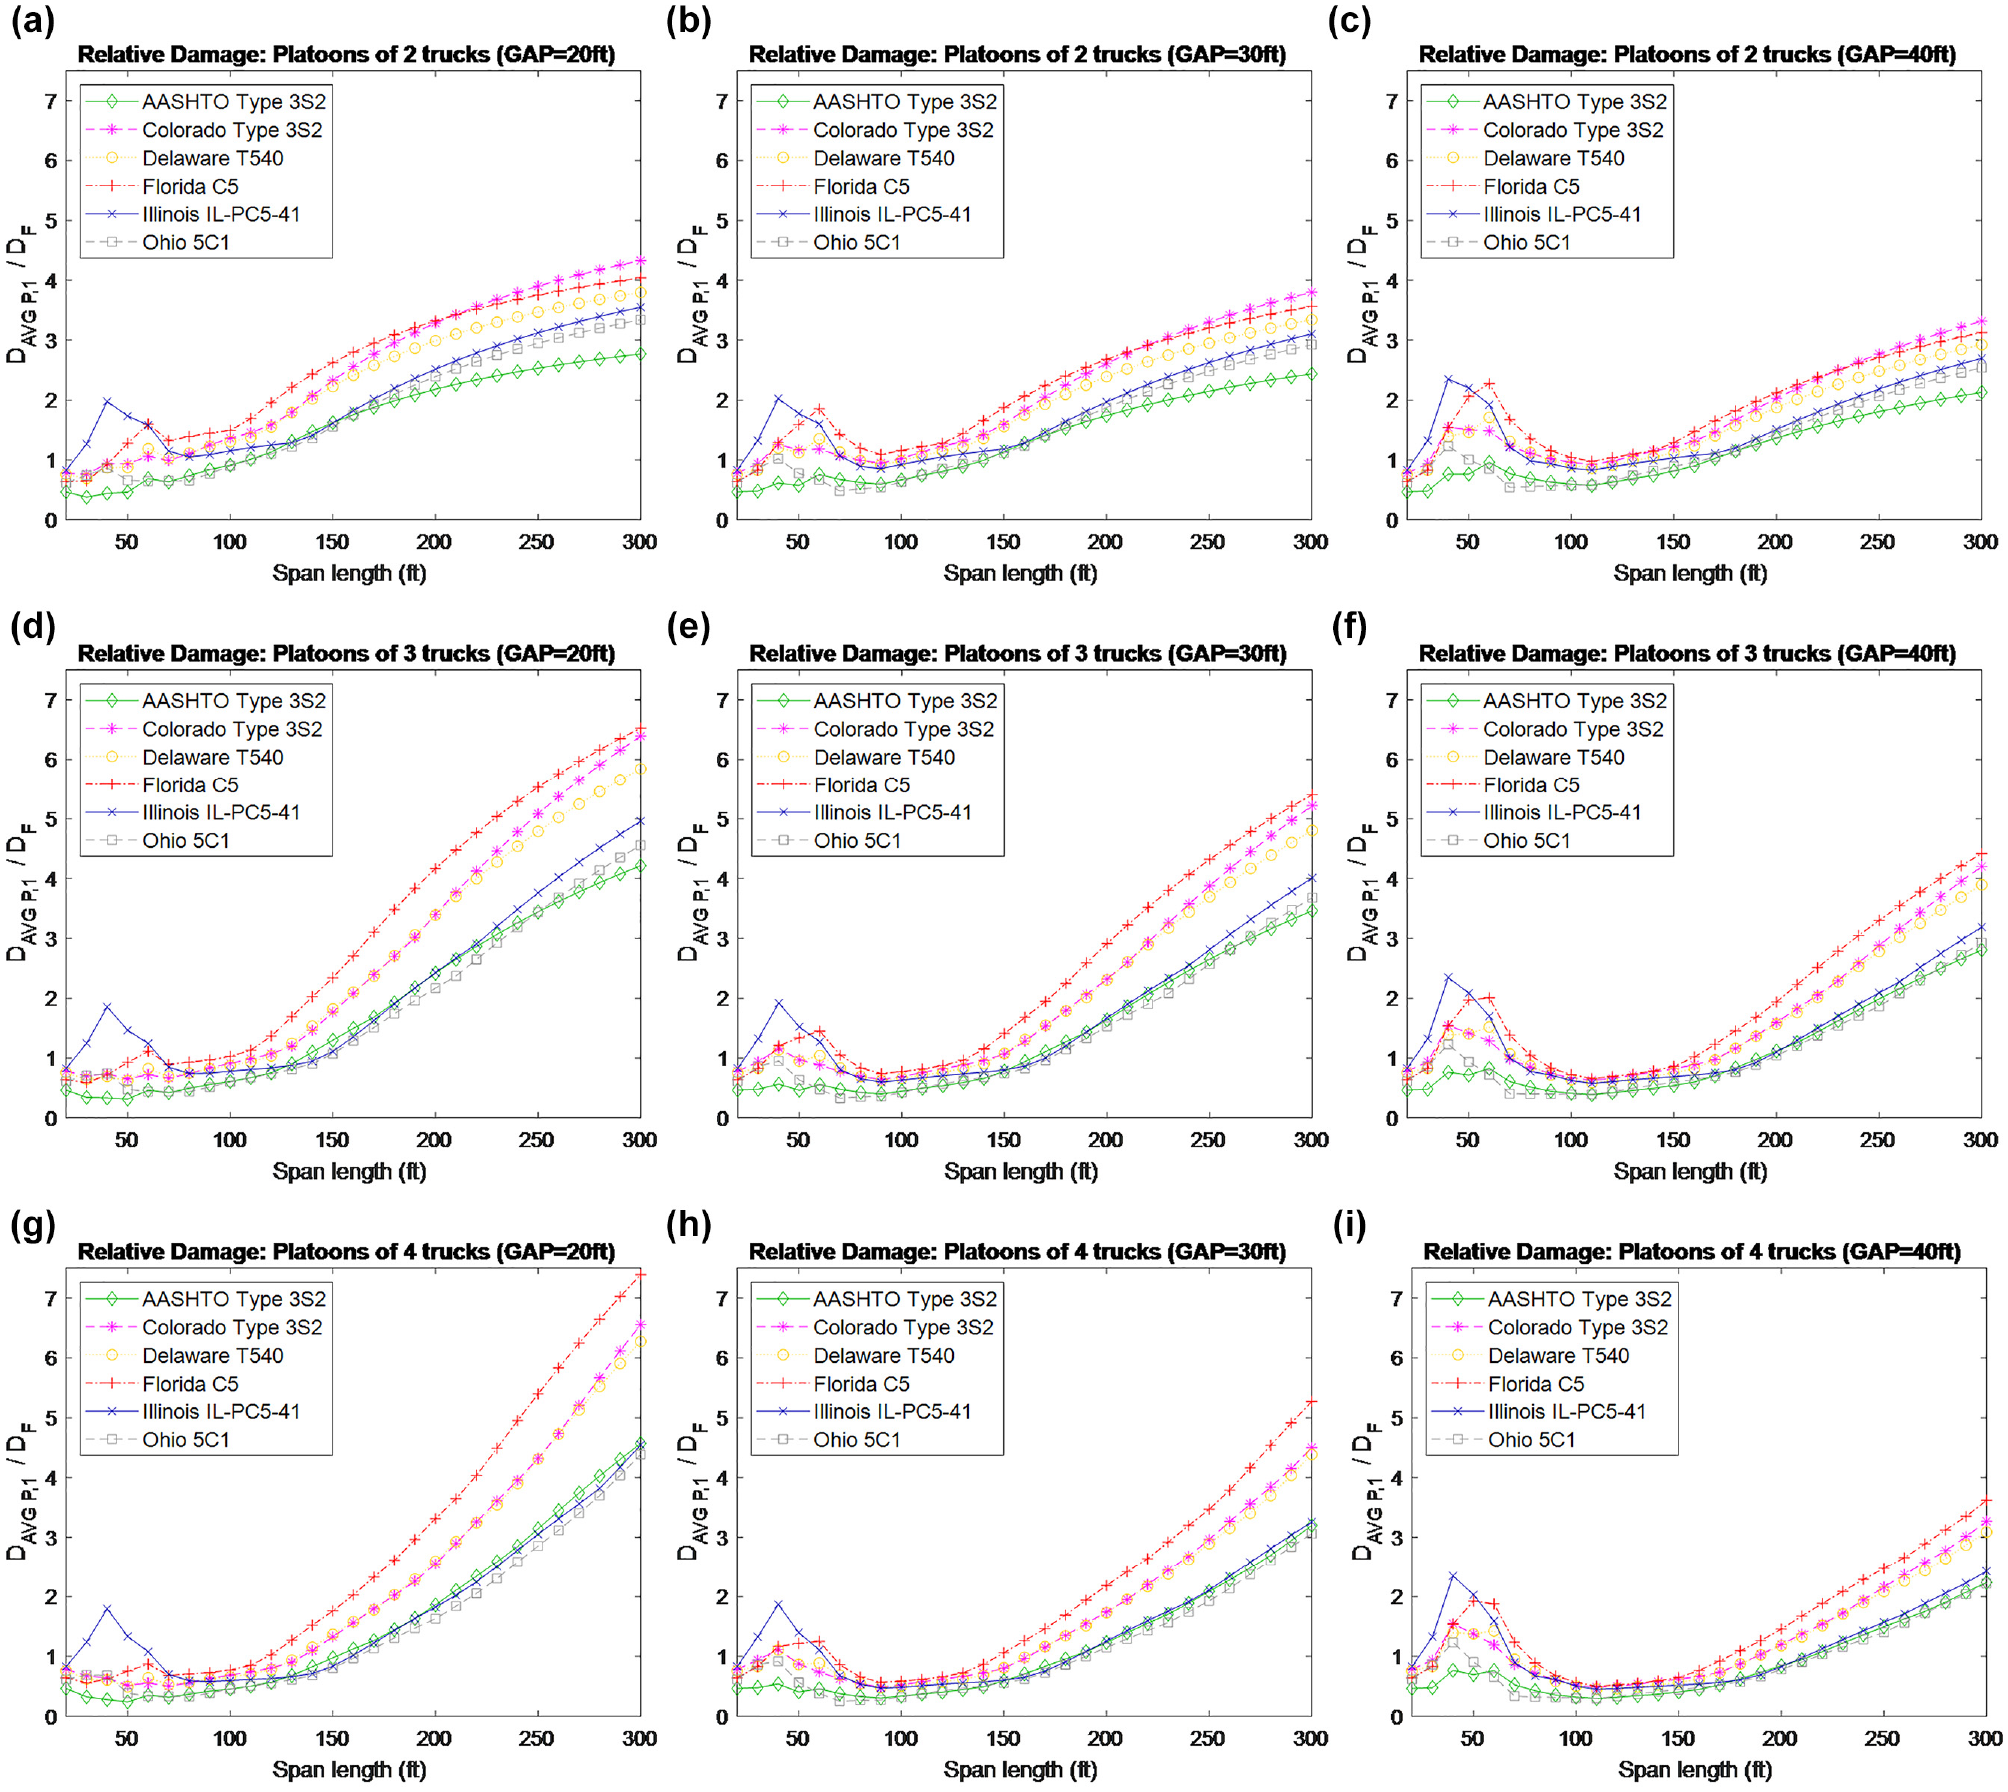
Figure 1 shows a series of plots for the relative damage produced from different platoons for simple span bridges. Each plot shows the relative damage caused by different platoon configurations in relation to the number of trucks and gap distances.
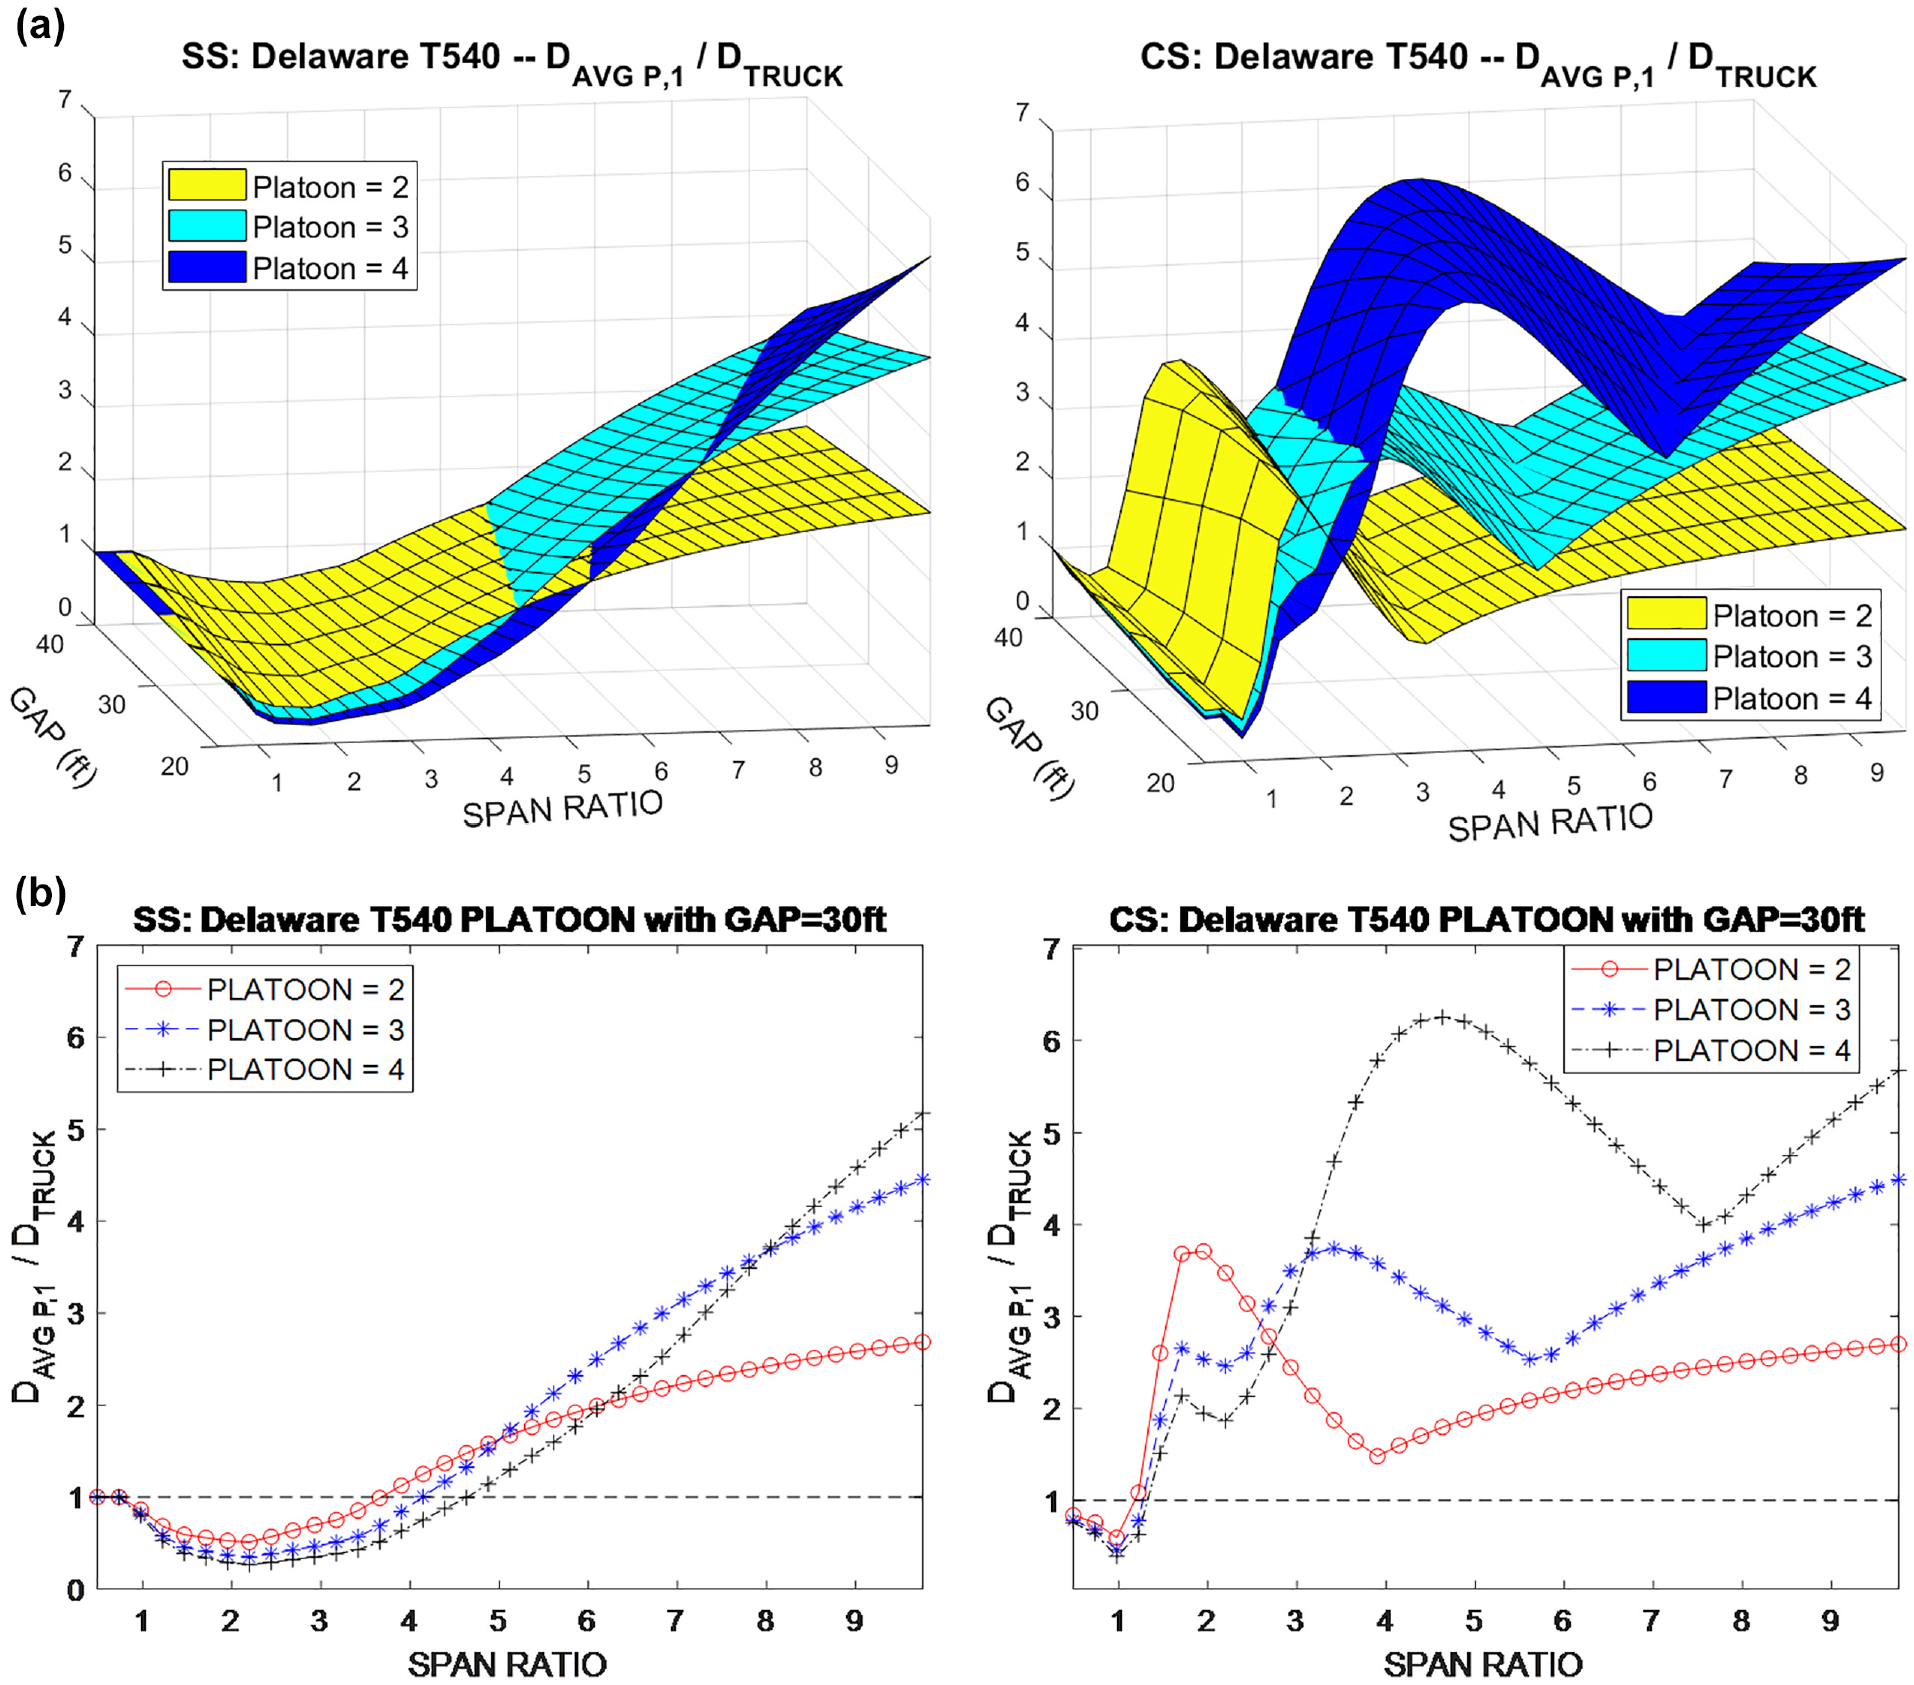
In the cases of spans less than 55 ft (SR < 1.5), the Illinois IL-PC5-41 caused the highest damage among all cases because of its heavy tractor tandem based on the results from Figure 1, a–i . The Ohio 5C1 has similar GVW and configuration to the Illinois IL-PC5-41; however, the Ohio 5C1 has lower tandem weight. Therefore, for short spans, the fatigue damage is controlled by the tandem weight. For spans greater than 55 ft (SR > 1.5), either the Florida C5 with the shortest wheelbase, or the Colorado Type 3S2 with the heaviest GVW, produced the highest fatigue damage. It is observed that for trucks with the same GVW, for example, the Florida C5, the Delaware T540, and the Ohio 5C1, the longer the wheelbase, the lower the fatigue damage. In some cases, platoons comprised of four trucks cause less fatigue damage than platoons made of two or three trucks. This happens at span lengths of 40 ft to 100 ft (Figure 1, a , d , and g ), 70 ft to 150 ft (Figure 1, b , e , and h ), and 90 ft to 170 ft (Figure 1, c , e , and f ), for 20 ft gap, 30 ft gap, and 40 ft gap, respectively. This indicates that more trucks in platoons could help decrease the average fatigue damage. This can be explained by the finding that although truck platoons might bring higher load effects, it decreases the number of cycles. The effect of decreasing the number of cycles outweighs the effect of increasing the load effects. Another finding is that, for spans greater than 100 ft, the relative damage decreases as the gap distance increases. The effects of gap distance are discussed in more details in the next section.
Fatigue Damage Ratio
Relative Fatigue Damage
for Continuous Spans
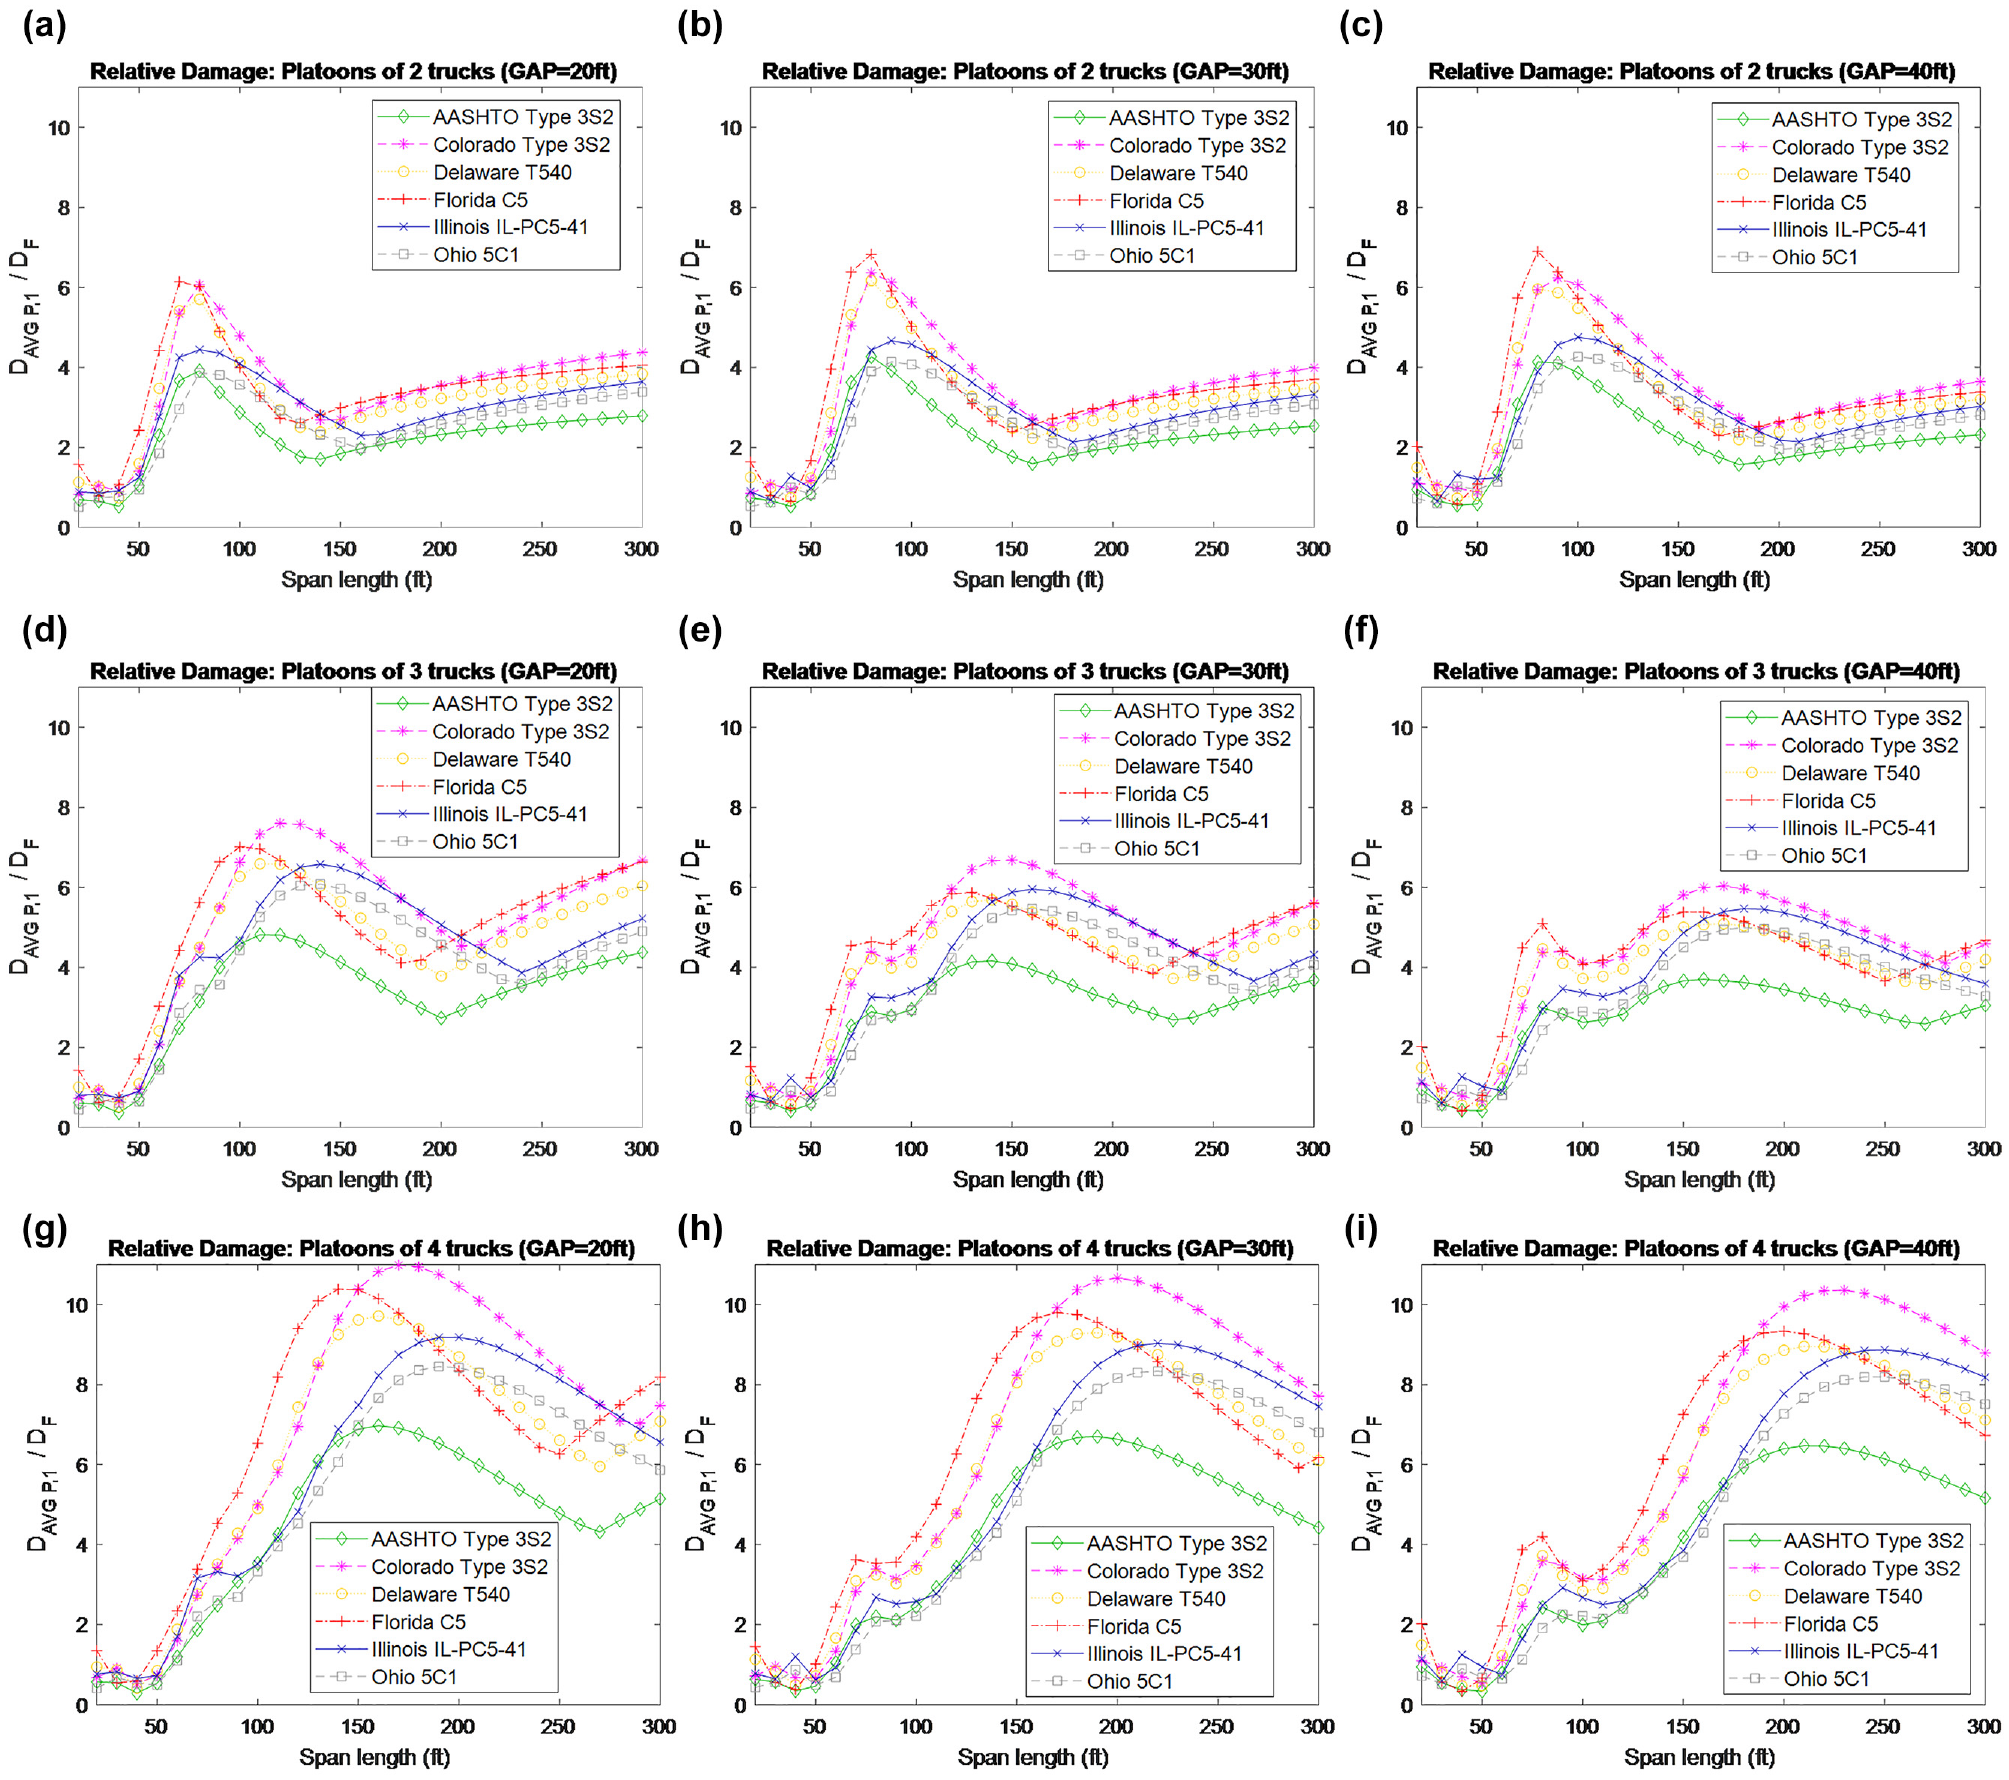
For the cases of two-equal continuous spans, the results of
Fatigue Damage Ratio
Effect of Gap Distance on Fatigue Damage
The effects of gap distance on the fatigue damage was analyzed for different span lengths and truck wheelbases. The relationship “


Relative damage
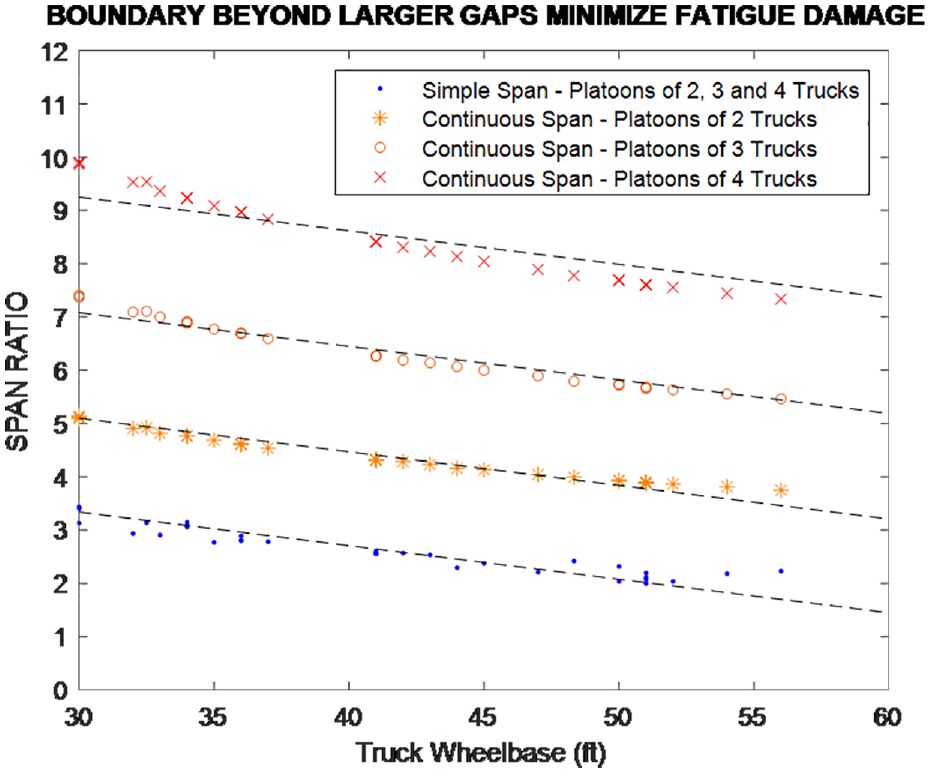
Boundary of span to wheelbase ratio (SR).
Damage ratio
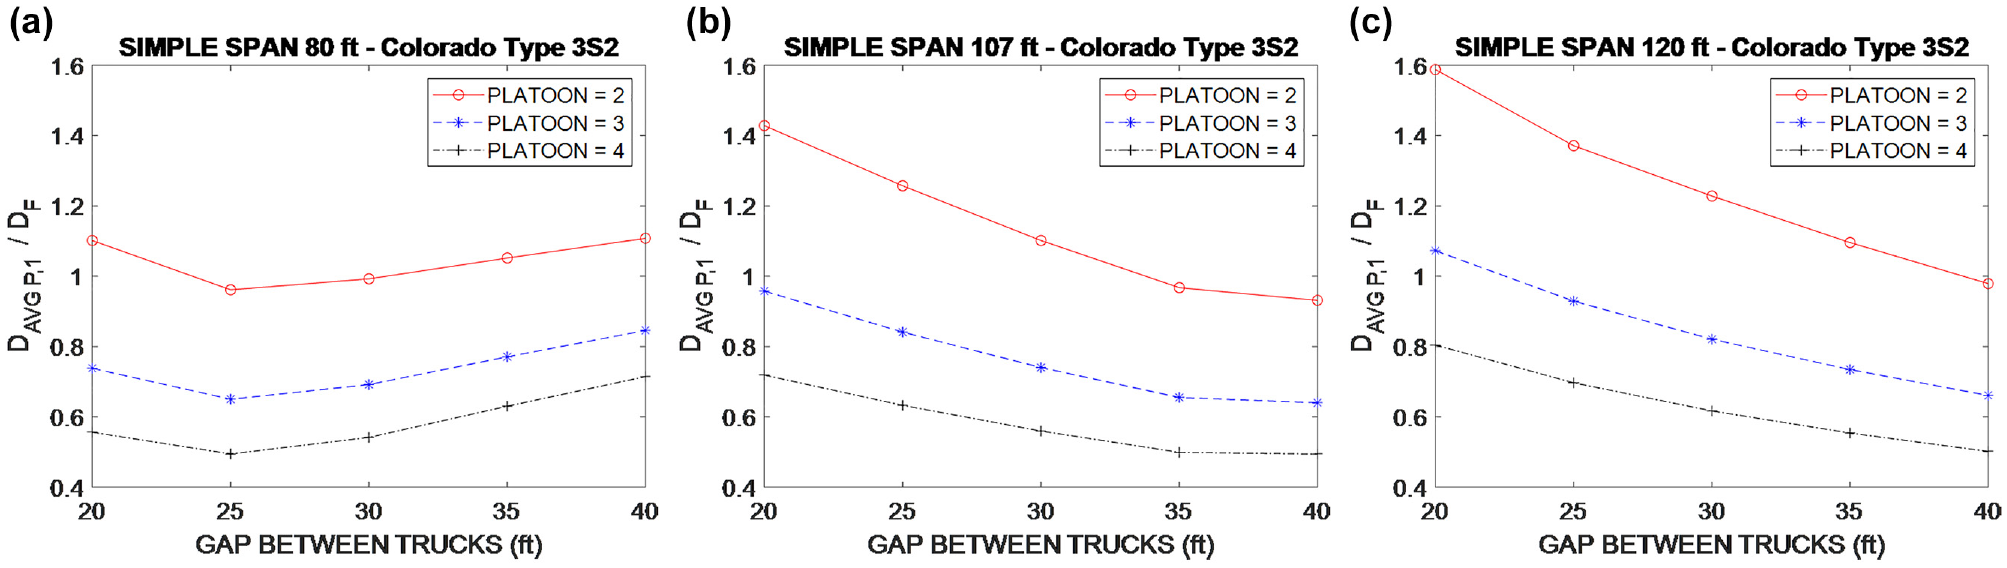
Based on the results shown above, various cases can be identified when transporting loads through truck platoons are more beneficial than using individual trucks. The damage ratio is calculated based on Equation 3. When
Fatigue damage ratio
Based on Figure 5, for the cases of simple span,
Conclusion
A set of state legal loads, including AASHTO LRFD legal loads, were used to simulate truck platooning configured with two, three, and four trucks, on a range of hypothetical bridge span lengths. This study focused on the single-trailer five-axle trucks. The fatigue damage was evaluated at midspan of simple spans and middle support section of two-equal continuous spans bridges. The average fatigue damage produced by each truck within platoons was normalized by the fatigue damage produced by the AASHTO LRFD fatigue load. The average fatigue damage caused by each truck within platoons is also compared with the fatigue damage caused by truck traveling individually, to identify the cases when transporting loads through truck platoons is more beneficial.
Based on the analysis results of this study, the following conclusions can be drawn:
For simple spans with span length less than 55 ft, or span to wheelbase ratio less than 1.5, the fatigue damage of truck platoon is controlled by the tandem weight. For simple spans with span length greater than 55 ft, or span to wheelbase greater than 1.5, shorter wheelbase and larger GVW produce higher fatigue damage.
For simple spans with span lengths greater than 100 ft, the relative damage decreases as the gap distance increases. In some cases, platoons comprised of four trucks cause less fatigue damage than platoons made of two or three trucks. This indicate that platoons with more trucks could help decrease the average fatigue damage, since, although truck platoons bring higher load effects, it also decreases the number of cycles. The effect of decreasing the number of cycles outweighs the effect of increasing load effects in relation to fatigue damage.
For continuous spans, the maximum relative fatigue damage happens at span to wheelbase ratio of 2, 2–4, and 4–6, for platoons of two trucks, platoons of three trucks, and platoons of four trucks, respectively. For span to wheelbase ratio less than 2.5, the lowest relative fatigue damage comes from the platoons of four trucks and the highest relative fatigue damage comes from the platoons of two trucks.
For different truck wheelbases, there are specific span to wheelbase ratios, beyond which fatigue damage decreases as gap distance increases. These specific span to wheelbase ratios are defined as “boundaries” and are represented with linear regressions.
Depending on the platooning configuration, there are ranges of span lengths where it is more beneficial to travel as platoons than as an individual truck.
A full calibration study should be performed to develop new live load factors for Fatigue I and II limit states assuming platoons are present in the load spectra.
Footnotes
Acknowledgements
The authors would like to acknowledge the financial support from New Jersey Department of Transportation (NJDOT). The help and support from the late Eddy Germain (passed away in April 2020 during the COVID-19 crisis), Ali Najem, Xiaohua (Hannah) Cheng, and Ankur Patel in Bureau of Structural Engineering, are greatly appreciated. The authors would also like to acknowledge the support of the Connected Cities for Smart Mobility towards Accessible and Resilient Transportation (C2SMART) Tier 1 University Transportation Center at New York University.
Author Contributions
The authors confirm contribution to the paper as follows: study conception and design: P. Lou, H. Nassif; data collection: T. Braguim, P. Lou; analysis and interpretation of results: P. Lou, T. Braguim, H. Nassif; draft manuscript preparation: T. Braguim, P. Lou, H. Nassif. All authors reviewed the results and approved the final version of the manuscript.
Declaration of Conflicting Interests
The author(s) declared no potential conflicts of interest with respect to the research, authorship, and/or publication of this article.
Funding
The author(s) disclosed receipt of the following financial support for the research, authorship, and/or publication of this article: This study is sponsored by New Jersey Department of Transportation (NJDOT) through the Bridge Resource Program (BRP), Task Order (TO) 349 / Contract ID Number 17-60139 / Federal Project Number Z240D00S001, and Connected Cities for Smart Mobility towards Accessible and Resilient Transportation (C2SMART) Tier 1 University Transportation Center at New York University, Path-Through Entity (PTE) Federal Award No. 69A3551747124.
The contents of this paper reflect the views of the authors who are responsible for the facts and accuracy of the data presented here. The contents of the paper do not necessarily reflect the official views or policies of the agencies.