
Abstract
Child-care centers are major trip generators for households with pre-school aged children (< 5 years). This paper presents a framework to analyze the factors affecting daily travel choices and challenges of child-care going households. Through rigorous literature review, this study first identifies important variables affecting mode choice, child-care center choice, transit use, and intention to drive. Next, it develops and distributes an online survey questionnaire to the registered child-care centers in Halifax Regional Municipality, Canada, to get data on individual households’ travel choices, challenges, factors affecting those choices, and importance level of those factors, as well as socio-demographic information. The study collects data from over 200 households, which is then analyzed using structural equation modeling to examine the effects of the identified factors such as safety, cost, distance, location, affordability, and convenience on day-to-day child-care trip decisions. The findings suggest that most of the families (73%) rely on private vehicles to make child-care trips as a result of family time, travel freedom, and parking availability. Other variables that motivate them to drive are travel safety, convenience, and opportunity to do trip chaining. Results show that 57% of the households group their child-care trip with a work trip. Distance to nearest bus stop, carrying child belongings, and length of trip to child-care are considered major barriers for transit use. The results of this study are expected to assist policy makers to understand travel patterns and barriers of households with pre-school aged children and help in designing communities to promote sustainable travel behavior.
Child-care facilities have become an essential part of modern society. These facilities take care of children when their parents or guardians work outside the home. In recent times, many families depend on child-care services to look after their children, which makes these facilities a crucial component in society. Child-care centers influence household expenditures, community health, transportation systems, economy, and environment. The transportation network, services, and infrastructure that connects child-care with other locations have a significant impact on household transport decisions, community development, and personal well-being, as well as the efficiency of the overall transportation system ( 1 – 3 ).
To ensure accessibility to child-care centers, maintaining social, environmental, and economic benefits for both households and communities, careful planning is essential ( 1 , 2 ). Authorities use municipal planning strategies, development regulations, and land use by-laws to make sure that growth of communities are pertaining to the sustainability goals of communities. These tools used by policy makers have major impacts on overall transportation accessibility, equity, and services to important neighborhood features such as child-care facilities ( 1 , 2 ). Before thinking about these control measures, it is imperative for policy makers to understand the travel priorities and preferences of households utilizing child-care centers, when considering transportation facilities in a community.
Daily travel, when accompanied by young children, can place restrictions on a household’s travel choices ( 4 – 6 ). Considering the factors such as convenience, privacy, time, and distance, most households with young children usually choose private vehicles as their primary mode of transportation ( 1 , 4 ). However, the transport system of a city should also offer sustainable and affordable transportation options so that low-income or environmentally conscious families can easily access their everyday destinations ( 1 – 3 , 7 ). While there is a lack of clearer understanding of the travel patterns of households with young children, some studies offer insights into households’ transportation choices. A study that investigated transit use of parents found that the chances of negative child behavior, such as tantrums and crying, and the need to carry items (e.g., strollers, diaper bags, and snacks) that are associated with travel with young children, are considered barriers that are preventing parents from considering public transit as a viable travel option ( 4 ). Several studies have found that families with children face barriers and challenges while accessing childcare facilities between home and work ( 8 ). This finding is intelligible as more and more parents are working outside the home nowadays. This can make daily travel decisions for these families difficult ( 4 , 6 ). Another study examined the use of sustainable travel behavior among working people. They found that employees of different companies who have children are less likely to bike, walk, or use transit for their daily travel. The rationale behind this behavior is that their child may need their assistance during the day and a private car provides the greatest convenience to travel to their child at any time of the day ( 6 ).
Several studies have found that the best way to study behavioral patterns of families with young children is through their child-care centers ( 4 , 9 ). Child-care location and facilities have a significant influence on how households using child-care centers travel. If child-care locations are not convenient, households are forced to spend more time commuting in vehicles (not choosing active transportation), contributing to traffic congestion and greenhouse gas emissions. They may end up spending less time physically active or participating in the community with their family ( 1 ). If the child-care locations are not far, and households can walk or bike, they will be physically more active, which can contribute to the overall improvement of community health, happiness, and prosperity ( 1 – 3 ). Besides, it has been found that choices and behavior of parents contribute to their children’s perception of the world around them which, in turn, will influence their future decisions. If children see their parents using sustainable travel options (i.e., walking, biking, public transport), they become familiar with those modes and begin to form habits of understanding their importance ( 10 ). In relation to long-term planning to reduce traffic congestion and traffic emissions, encouraging households with toddlers to use sustainable modes is a good strategy to affect the transportation choices of future generations. With more and more households switching to sustainable modes for travel, air quality, road network efficiency, and destination accessibility may significantly improve ( 7 ). In order for this to happen, it is necessary to plan and design infrastructure in such a way that sustainable travel options are viable and accessible for these households. Understanding household travel patterns and choices is the first step to developing policies and strategies that aim to shift behavior. Limited information is available related to travel behavior of households that use child-care facilities ( 3 ). These households face many barriers when it comes to their daily travel. For example, if child-care centers are not located conveniently, people may want to use private cars. Households that can afford to own a vehicle and choose to drive must navigate roads and congestion and search for parking, and, as a result, they often suffer increased stress levels ( 11 – 13 ). Very few studies have explored the variables that affect travel choices and challenges of households with children in child-care. Moreover, limited guidelines exist for designing child-care centers which are easily accessible for families. Based on the gap in the literature discussed, it can be said that child-care center-based studies of households’ transportation behavior and challenges are required to provide insights into opportunities for increasing sustainable travel behavior for families with young children. The findings of this research can be helpful while planning for cities, communities, and particularly facilities like child-care centers.
Taking Halifax, Canada, as study area, this study explores the factors that affect the daily travel choices of households with young children going to child-care centers. It first conducts an extensive literature review to identify crucial factors that affect child-care households’ day-to-day travel choices and barriers to using sustainable transport modes, which include public transit, biking, and walking. Then, it develops an online survey questionnaire and collects travel-related data from households that use licensed child-care facilities in the Halifax Regional Municipality (HRM). The purpose of this survey was to collect data on travel choices, factors affecting these choices, and factors contributing to the transportation challenges, barriers, and opportunities of those households in HRM. After collecting and filtering the data, a structural equation modeling (SEM) method is used to examine the effects of those factors on household transport choices. This study determines the interrelationships between the manifest (observable) variables and latent (unobservable) variables related to daily travel characteristics to have a clearer understanding of the travel behavior of those households. From the results of this study, it is possible to identify the significant factors affecting travel choices and recognize the transport barriers households face in their daily activities while traveling to and from child-care centers. The outcomes of this study illustrate mathematically to what level these factors are significant, which allows the variables to be ranked based on their importance. This research may assist policy makers to make informed decisions while planning to promote sustainable travel behavior across communities, especially among households with pre-school aged children.
Data and Methods
The authors of this paper conducted a web-based survey in 2014, designed and distributed through Dalhousie University’s Opinio Survey Software, to all licensed child-care facilities in HRM. The child-care centers were identified through a directory from the Early Childhood Development Services Section Household and Children’s Services Division of the Nova Scotia Department of Community Services. A total of 187 licensed child-care centers were identified in HRM and the authors attempted to contact all. The circulated survey was a questionnaire that also contained a letter of consent explaining the project and requesting the respondents’ participation. Child-care centers were recruited through an email that contained an electronic link to the web-based survey, a poster advertising the project, a letter inviting families to participate, and a request that the child-care center confirmed participation. The survey provided instructions stating that the participant responding to the survey should be the person within the household who most often performs the trip to their child-care center. The questionnaire was available for a total period of 8 months from the date of distribution. The web-based survey was approved through the Dalhousie University Social Sciences and Humanities Research Ethics Board.
In the questionnaire, households were asked to state the importance of factors such as accessibility, convenience, freedom, cost, availability, sustainability, parking, family time, and physical activity on their decision to choose their primary mode of transport; the importance of factors such as availability, location of work, location of home, special care, cost, and reputation on choosing their child-care center; and the importance of factors such as distance, safety, convenience, weather, and trip chaining on choosing to drive to child-care. Respondents were also asked to state the importance of factors such as length of trip, child’s behavior, carrying child’s belongings, and dealing with strangers as contributors to the barriers of using public transport while going to or coming from child-care centers with their children. The questionnaire had a specific section to collect data on a household’s primary mode choice, mode choice when traveling to child-care centers from home, and mode choice when traveling home from child-care centers. Along with these, socio-demographic information, such as household income and number of vehicles, as well as general information, such as number of children going to child-care, number of people aged 16 or older in the household, frequency of attending child-care in a week, whether child-care fees are subsidized or not, and whether they do trip chaining with the trips involving child-care, were also collected.
Structural Equation Modeling (SEM)
SEM is a statistical analysis method that can be used to model causal relationships among latent variables and their complex relationships with large numbers of endogenous variables ( 14 ). Existing literature indicates that structural equation models (SEMs) have been widely used for travel behavior analysis ( 14 , 15 ). Generally, SEM has two main components—the structural model and the measurement model. The parameter estimation process of SEM is iterative, and it produces a best-fit model for data provided as input to the model. The iteration is based on a covariance analysis. It assumes that the population covariance matrix of observed parameters can be expressed as a function of unknown parameters ( 16 ). Through iteration, SEM seeks to minimize the difference between the sample covariance matrix and model-implied covariance ( 17 ). The unknown parameters of the model are calculated making sure that the covariance matrix of the model is as close as possible to the sample covariance matrix. The “lavaan” package in R software is used for the SEM analysis in this study ( 18 ). The default estimator in the “lavaan” package is maximum likelihood (ML) which was adopted in this study. The reason behind choosing ML is that, if the estimator is ML, it is possible to obtain the normalized and the standardized residuals. Besides, many estimators have “robust” variants, meaning that they provide robust standard errors and a scaled test statistic. If an ML estimator is used, “lavaan” provides robust variants, which is another benefit.
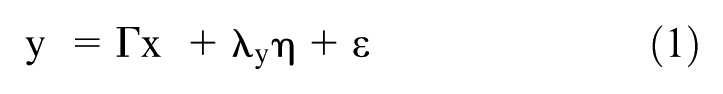
In relation to the structure, SEM consists of different manifest and latent variables which are classified into endogenous and exogenous nature among themselves. The manifest variables are the observable variables. Latent variables are not directly observed variables, but rather inferred from other variables that are observed (directly measured). The following parameters and variables form the structural equation (SE) path models (notation in parentheses): endogenous latent variables (η), exogenous latent variables (ξ), dependent manifest variables (y), independent manifest variables (x), error terms related to η (ζ), error terms related to y (ε), error terms related to x (δ), covariance of ξ (φ), structural parameters (regression coefficients) relating the endogenous latent variables to the exogenous latent variables (γ), structural parameters (regression coefficients) relating the endogenous manifest variables to the exogenous manifest variables (Γ), structural parameters relating the endogenous variables to one another (β), and confirmatory factor analysis parameters (λ). In this study, three SE models are developed to evaluate and understand the relationship between the underlying factors affecting daily travel choices of child-care going households. The final objective is to reveal the significant and insignificant variables, and to what level they are significant or insignificant. Commencing from an initial candidate model in which a set of parameters is suggested, these models are re-inspected in new candidate models, revising the structure of the variables. For each model, the process of model formation and relationship between the endogenous and exogenous variables followed the approach of a trial and error method complying with existing literature ( 14 , 15 ). Through the trial and error process, the models having the minimum values of standard errors to the variables are selected. The SEM building process in this study involved, in total, 46 variables. Their types and notations are listed in Table 1.
Variables Selected for the Structural Equation Models (SEMs)
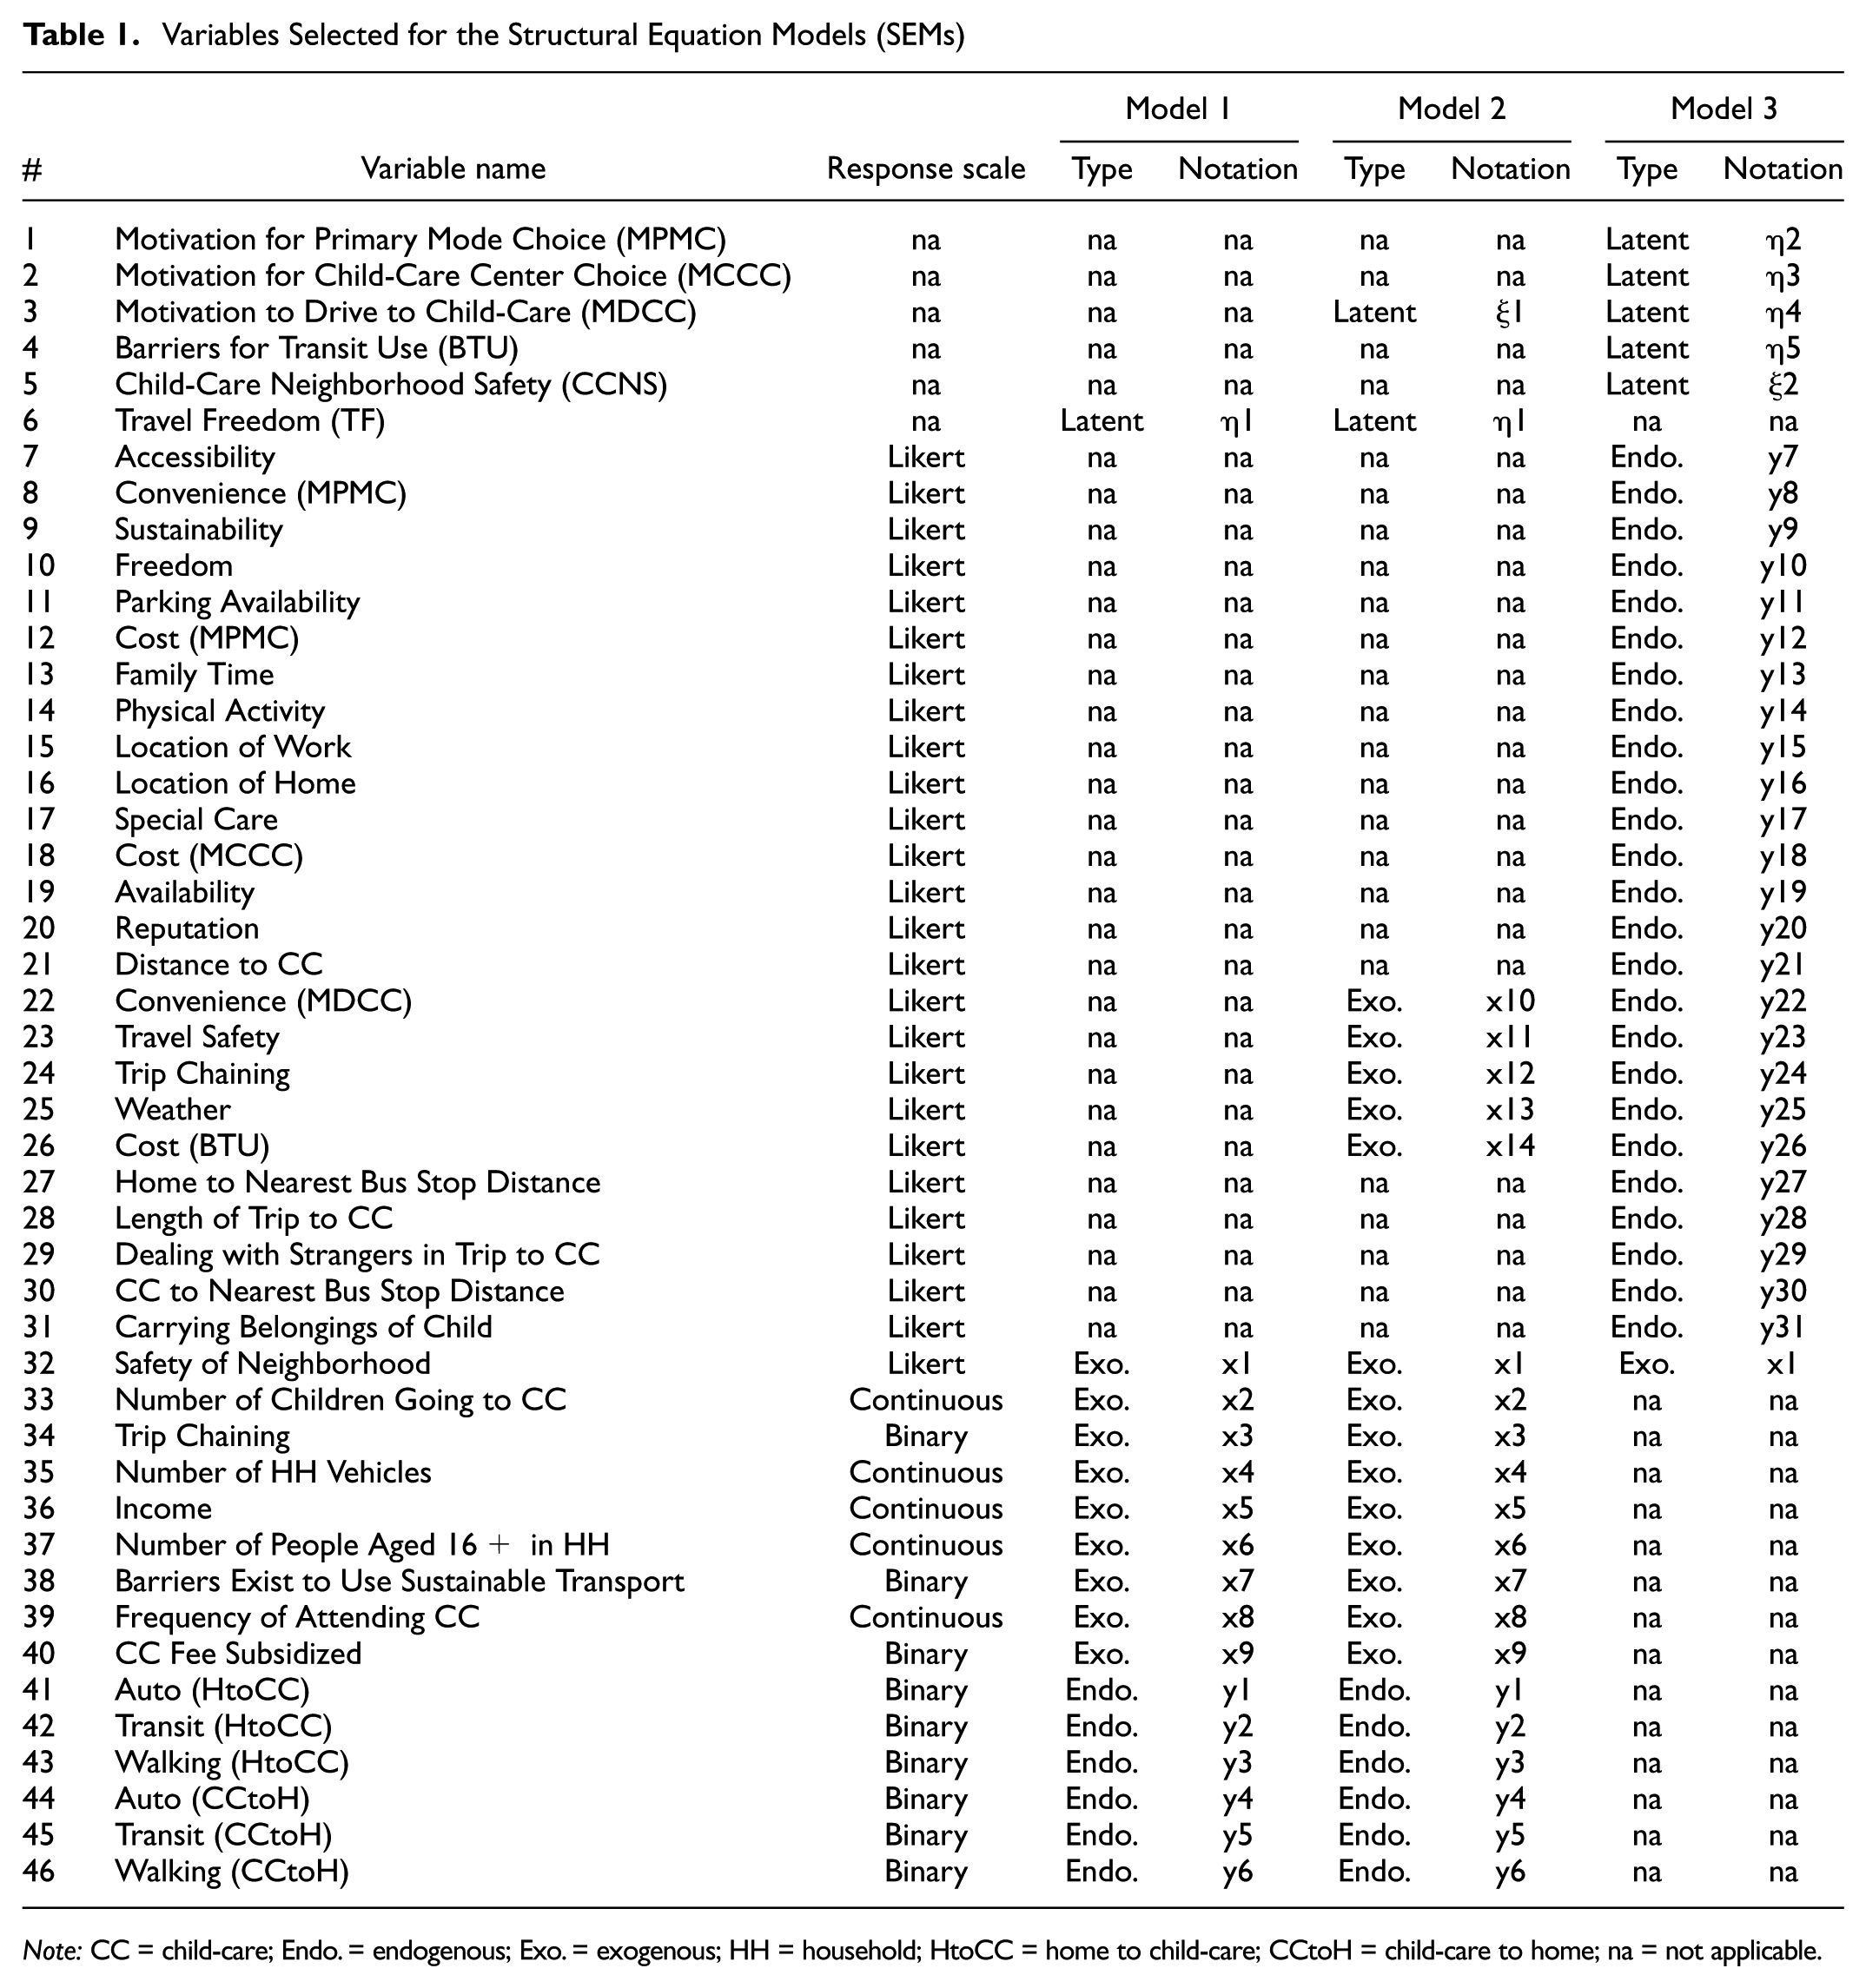
Note: CC = child-care; Endo. = endogenous; Exo. = exogenous; HH = household; HtoCC = home to child-care; CCtoH = child-care to home; na = not applicable.
While constructing the path diagrams, the variables are connected by confirmatory factor analysis (CFA). Before conducting CFA, tests were conducted, such as Bartlett’s Test of Sphericity to check whether factor analysis is applicable to the data. If Bartlett’s Test of Sphericity comes out as significant, it means that the sample correlation matrix is significantly different from an identity matrix. It is an indication that it is appropriate to factor analyze the matrix. All the three SE models formed in this study passed the Bartlett’s Test of Sphericity. After connecting the variables by CFA, the manifest variable values are fed as input into the models to produce the output correlation matrix (λ), that is, the measurement model of SEM, which are then used as the input to the structural models. Finally, the values of γ and β are generated, and, from that, the structural relationship of the variables affecting travel choices of child-care households are explained. The structures of the three SE models are described in the following subsections. The model structures are finalized by shuffling the variables and evaluating their performances until the best structure (least standard error) is obtained.
Model 1
The SEM path diagram of Model 1 (M1) is illustrated in Figure 1. M1 is constructed with nine exogenous manifest variables, six endogenous manifest variables, and one endogenous latent variable. M1 develops the latent variable “Travel Freedom” based on mode choices to and from child-care centers. The mode choices are explained by “Safety of Neighborhood,”“No. of Children Going to CC,”“Trip Chaining,”“No. of HH Vehicles,”“Income,”“No. of People Aged 16+ in HH,”“Barriers Exist to Use Sustainable Transport or Not,”“Frequency of Attending CC,”“CC Fee Subsidized or Not.”
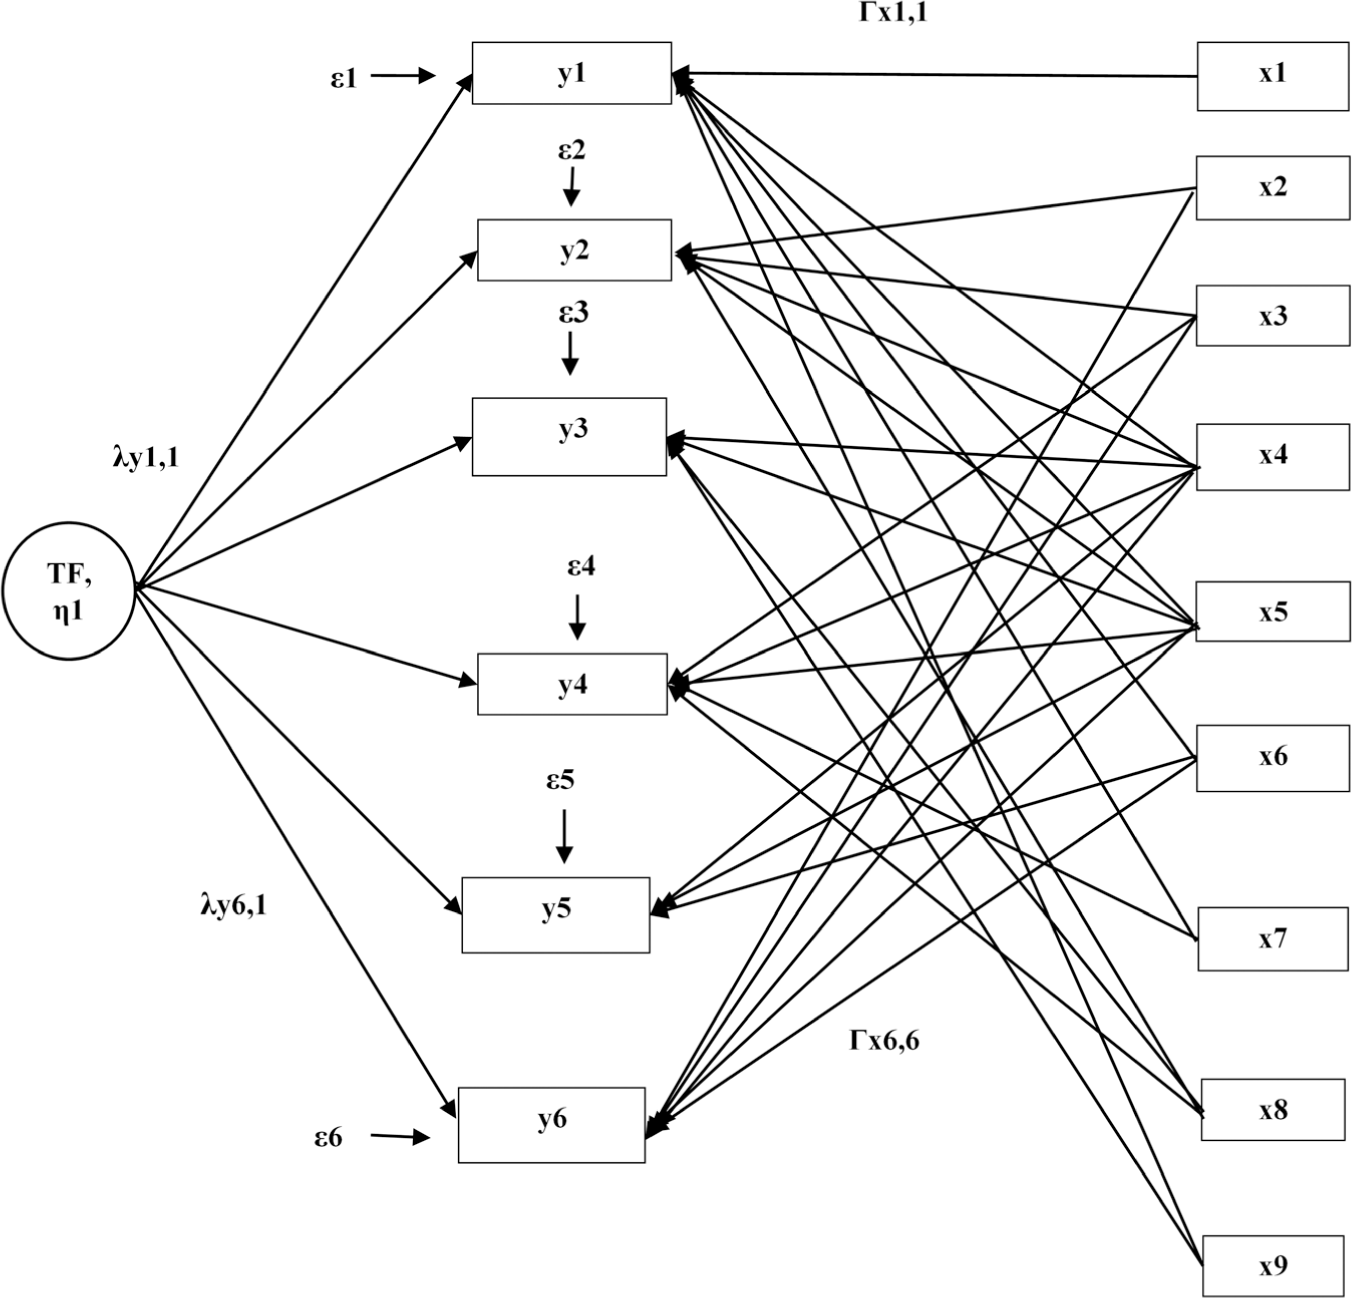
Structural equation modeling path diagram of Model 1.
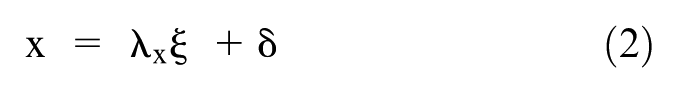
The following equation is obtained from the structure of Model 1:
Model 2
Model 2 (M2) is constructed with 14 exogenous manifest variables, six endogenous manifest variables, one exogenous latent variable, and one endogenous latent variable. The path diagram is shown in Figure 2. M2 develops the endogenous latent variable “Travel Freedom” in a similar way as in M1. M2 develops the exogenous latent variable “Motivation to Drive to Child-Care” based on “Convenience,”“Travel Safety,”“Trip Chaining,”“Weather,” and “Cost.”
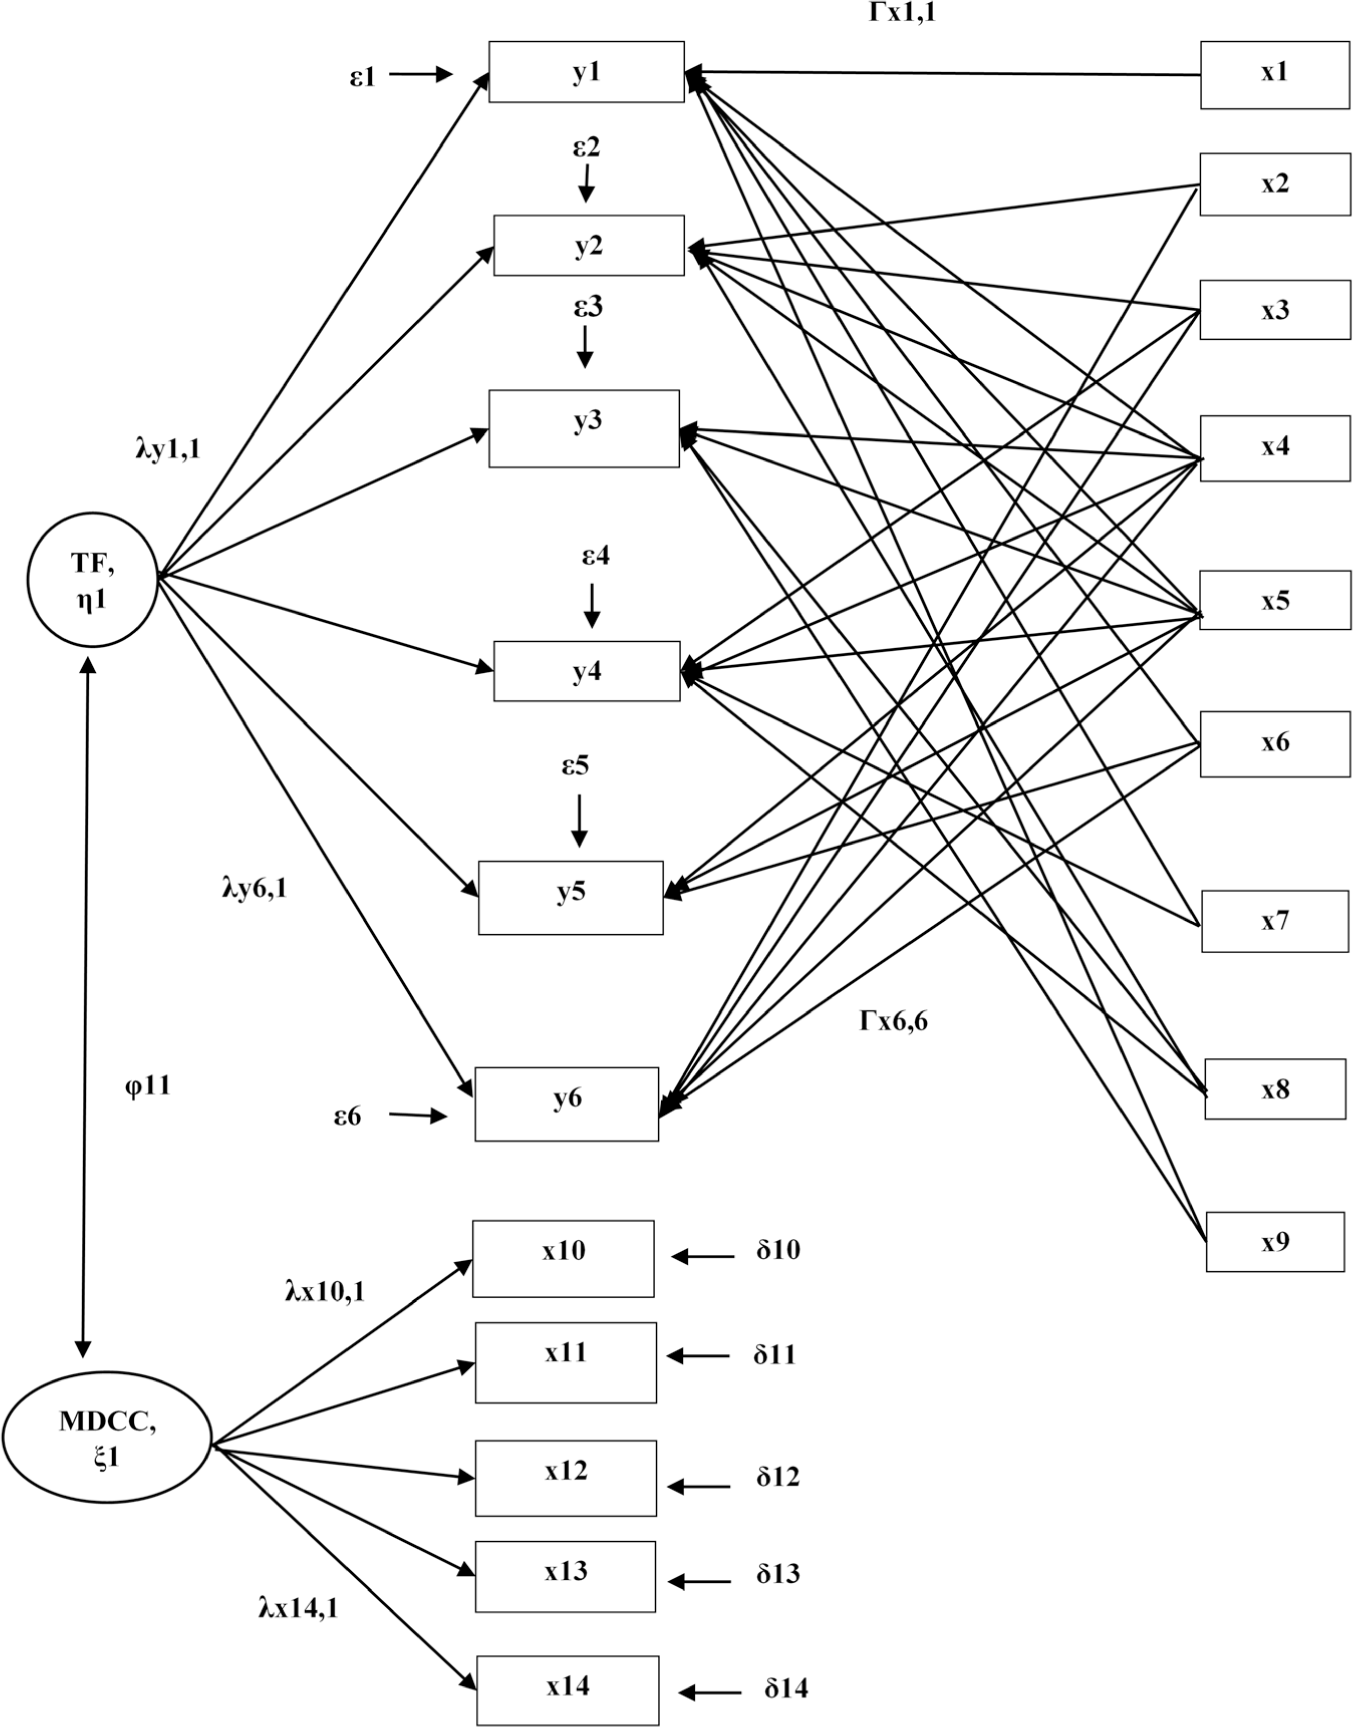
Structural equation modeling path diagram of Model 2. Note:η = endogenous latent variable; ξ = exogenous latent variables; y = dependent manifest variable; x = independent manifest variable; TF = travel freedom; MDCC = motivation to drive to child-care; y1 = auto(HtoCC); y2 = transit(HtoCC); y3 = walking(HtoCC); y4 = auto(CCtoH); y5 = transit(CCtoH); y6 = walking(CCtoH); x1 = safety of neighborhood; x2 = number of children going to CC; x3 = trip chaining (Likert); x4 = number of HH vehicles; x5 = income; x6 = number of people aged 16+ in HH; x7 = barriers exist to sustainable transport; x8 = frequency of attending CC; x9 = CC fee subsidized; x10 = convenience; x11 = travel safety; x12 = trip chaining (binary); x13 = weather; x14 = cost; λ = confirmatory factor analysis parameters; ε = error terms related to y; Γ = structural parameters (regression coefficients) relating the endogenous manifest variables to the exogenous manifest variables; δ = error term related to x; φ = covariance of ξ.
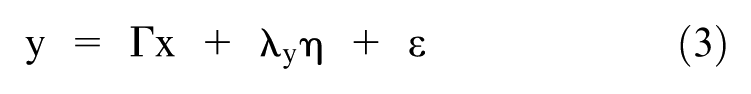
The following equations are obtained from the structure of Model 2:
Model 3
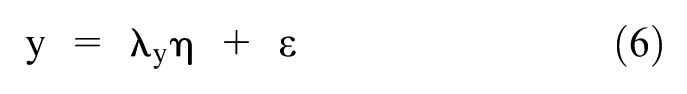
Model 3 (M3) is constructed with one exogenous manifest variable, 25 endogenous manifest variables, one exogenous latent variable, and four endogenous latent variables, as shown in Figure 3. The exogenous latent variable “CC Neighborhood Safety” is developed based on “Safety of Neighborhood.” The endogenous latent “Motivation for Primary Mode Choice” is developed based on “Accessibility,”“Convenience,”“Sustainability,”“Freedom,”“Parking Availability,”“Cost,”“Family Time,” and “Physical Activity.” The endogenous latent “Motivation for Child-Care Center Choice” is developed based on “Location of Work,”“Location of Home,”“Special Care,”“Cost,”“Availability,” and “Reputation.” The endogenous latent “Motivation to Drive to Child-Care” is developed in similar way as in M2. The endogenous latent variable “Barriers to Transit Use” is developed based on “Cost,”“Home to Nearest Bus Stop Distance,”“Length of Trip to CC,”“Dealing with Strangers in Trip to CC,”“CC to Nearest Bus Stop Distance,” and “Carrying Belongings of Child.” From the structure of Model 3, the following equations are obtained:
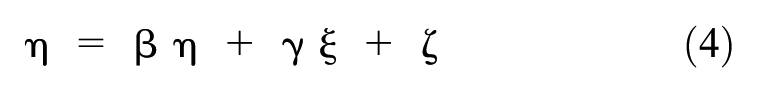
where ξ and η came from:
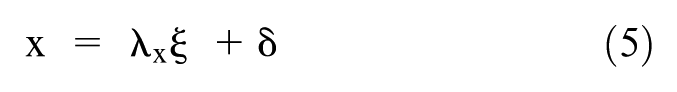
and,
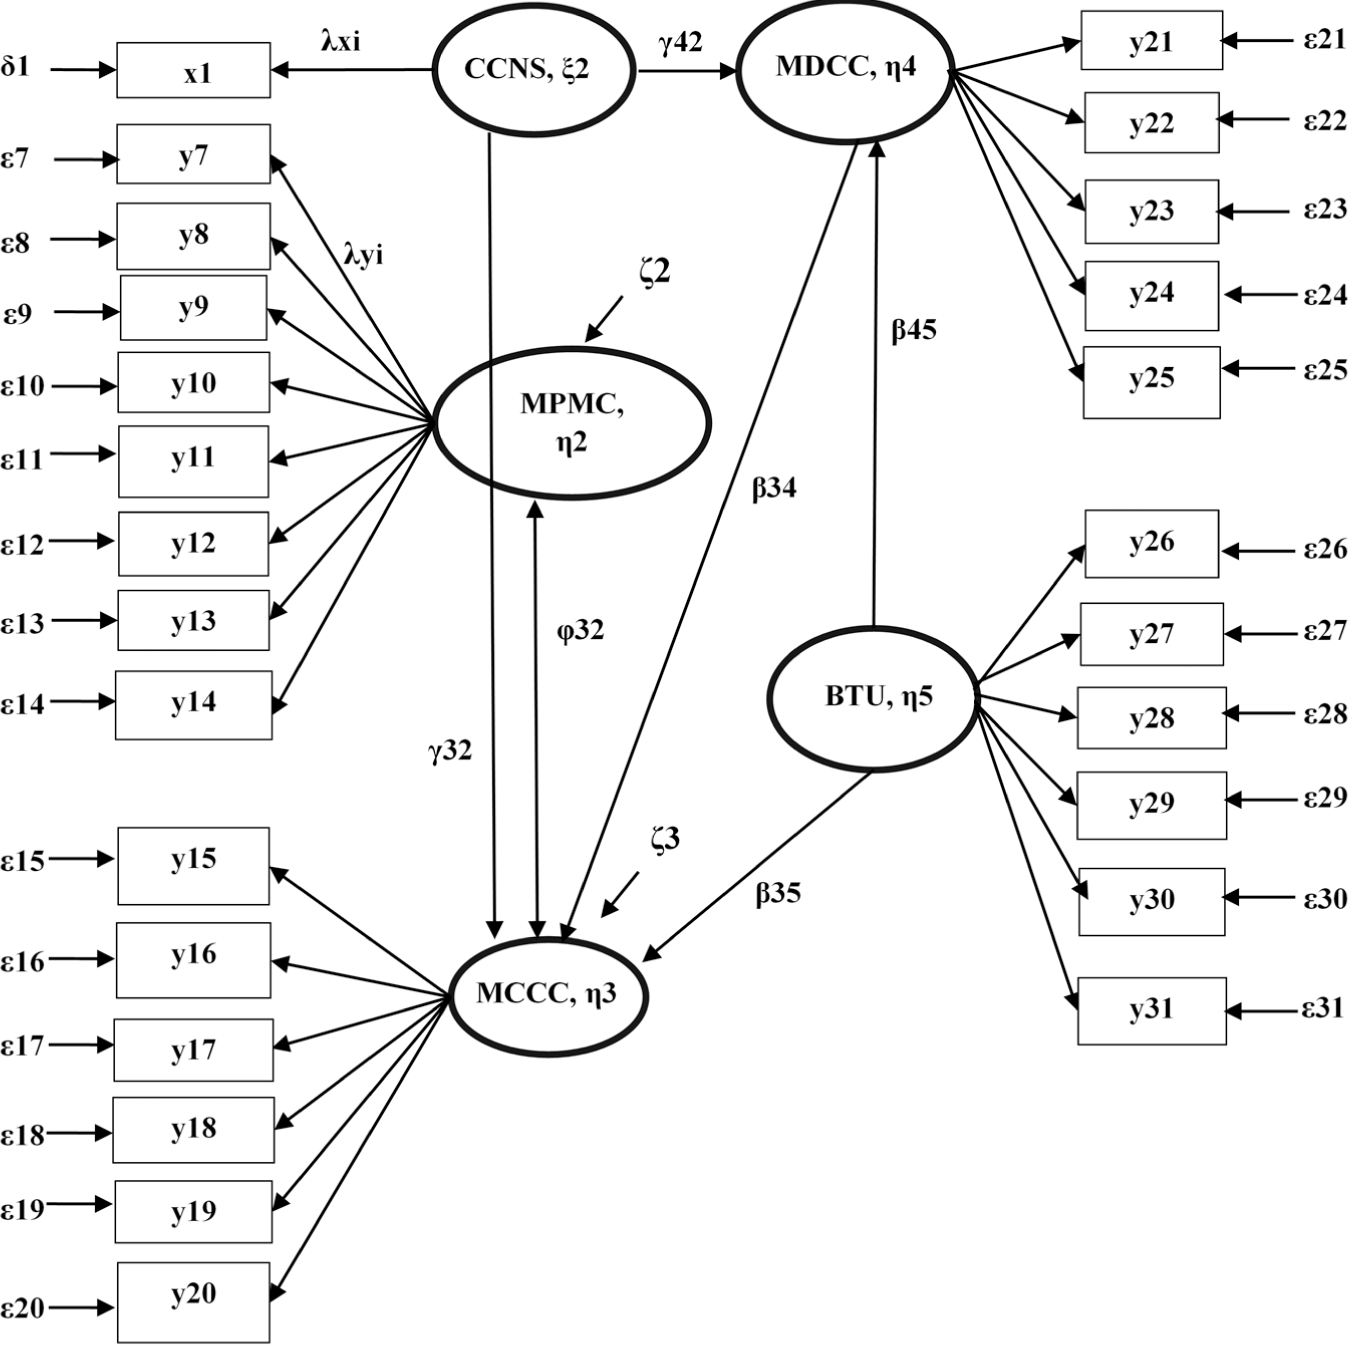
Structural equation modeling path diagram of Model 3.
Structural Equation Model Validation
To compare and choose the best model between the three SEMs, several fit indices assessing the goodness-of-fit are used in this study. Hooper et al. developed procedures to calculate model fit in which fit indices are discriminated in absolute, incremental, and parsimony indices ( 19 ). They have also recommended acceptable threshold limits for each of the described indices. Absolute fit indices examine how well a model fits the sample data and allows the model with best fit to be chosen ( 14 , 15 ). These fit indices include root mean square error of approximation (RMSEA), standardized root mean square residual (SRMR), comparative fit index (CFI), Tucker-Lewis index (TLI), Akaike’s information criterion (AIC), and Bayesian information criterion (BIC). For selecting the best model, a comparison of the three SEMs is conducted based on their goodness-of-fit measures. RMSEA is a measure that centers on the model-implied versus sample covariance matrix, and, all else being equal, is lower for simpler models and larger sample sizes. A value of less than 0.05 for RMSEA indicates a very good fit, and a value of less than 0.1 indicates good fit ( 20 ). SRMR is the mean absolute correlation residual, that is, the difference between the observed and the model-implied correlations. Existing literature suggests looking for values of less than 0.05, although less than 0.10 indicates a good fit. CFI compares the fitted model with a null model that assumes there is no relationship among the measured items. It is rounded to fall between 0 and 1. CFI values larger than 0.9, or specifically 0.95, are typically desired. However, like other completely arbitrary cut-offs, those values guarantee nothing. TLI is an incremental fit index that is developed by resolving the disadvantage of normed fit index (NFI) in relation to being affected by sample size. For a better fit, a model that produces a large TLI value, larger than 0.95, is interpreted as an acceptable fit ( 21 ). AIC and BIC are both penalized-likelihood criteria used for comparing models. The larger difference in either AIC or BIC indicates stronger evidence for one model over the other. The lower the values of AIC and BIC, the higher the likelihood of a model. Furthermore, these parameter values are utilized to compare the proposed models and to find out the optimal one, that is, the one most representative of the actual scenario.
Results and Analysis
Table 2 illustrates the preliminary statistics of the collected data. In total, 210 households participated in the questionnaire survey. After removing the incomplete responses, 201 samples were found to be complete with answers to all the questions asked and are taken as input to the SEMs. Table 2 contains mean and standard deviation of all the Likert scale responses (1 = not at all important; 2 = slightly important; 3 = important; 4 = fairly important; and 5 = very important). The question titled “the respondent’s opinion of the safety of their neighborhood for sustainable transportation” used a 5-point Likert scale, where 5 means strongly disagree, 3 means neutral, and 1 means strongly agree.
Preliminary Statistics of the Sample Questionnaire Data
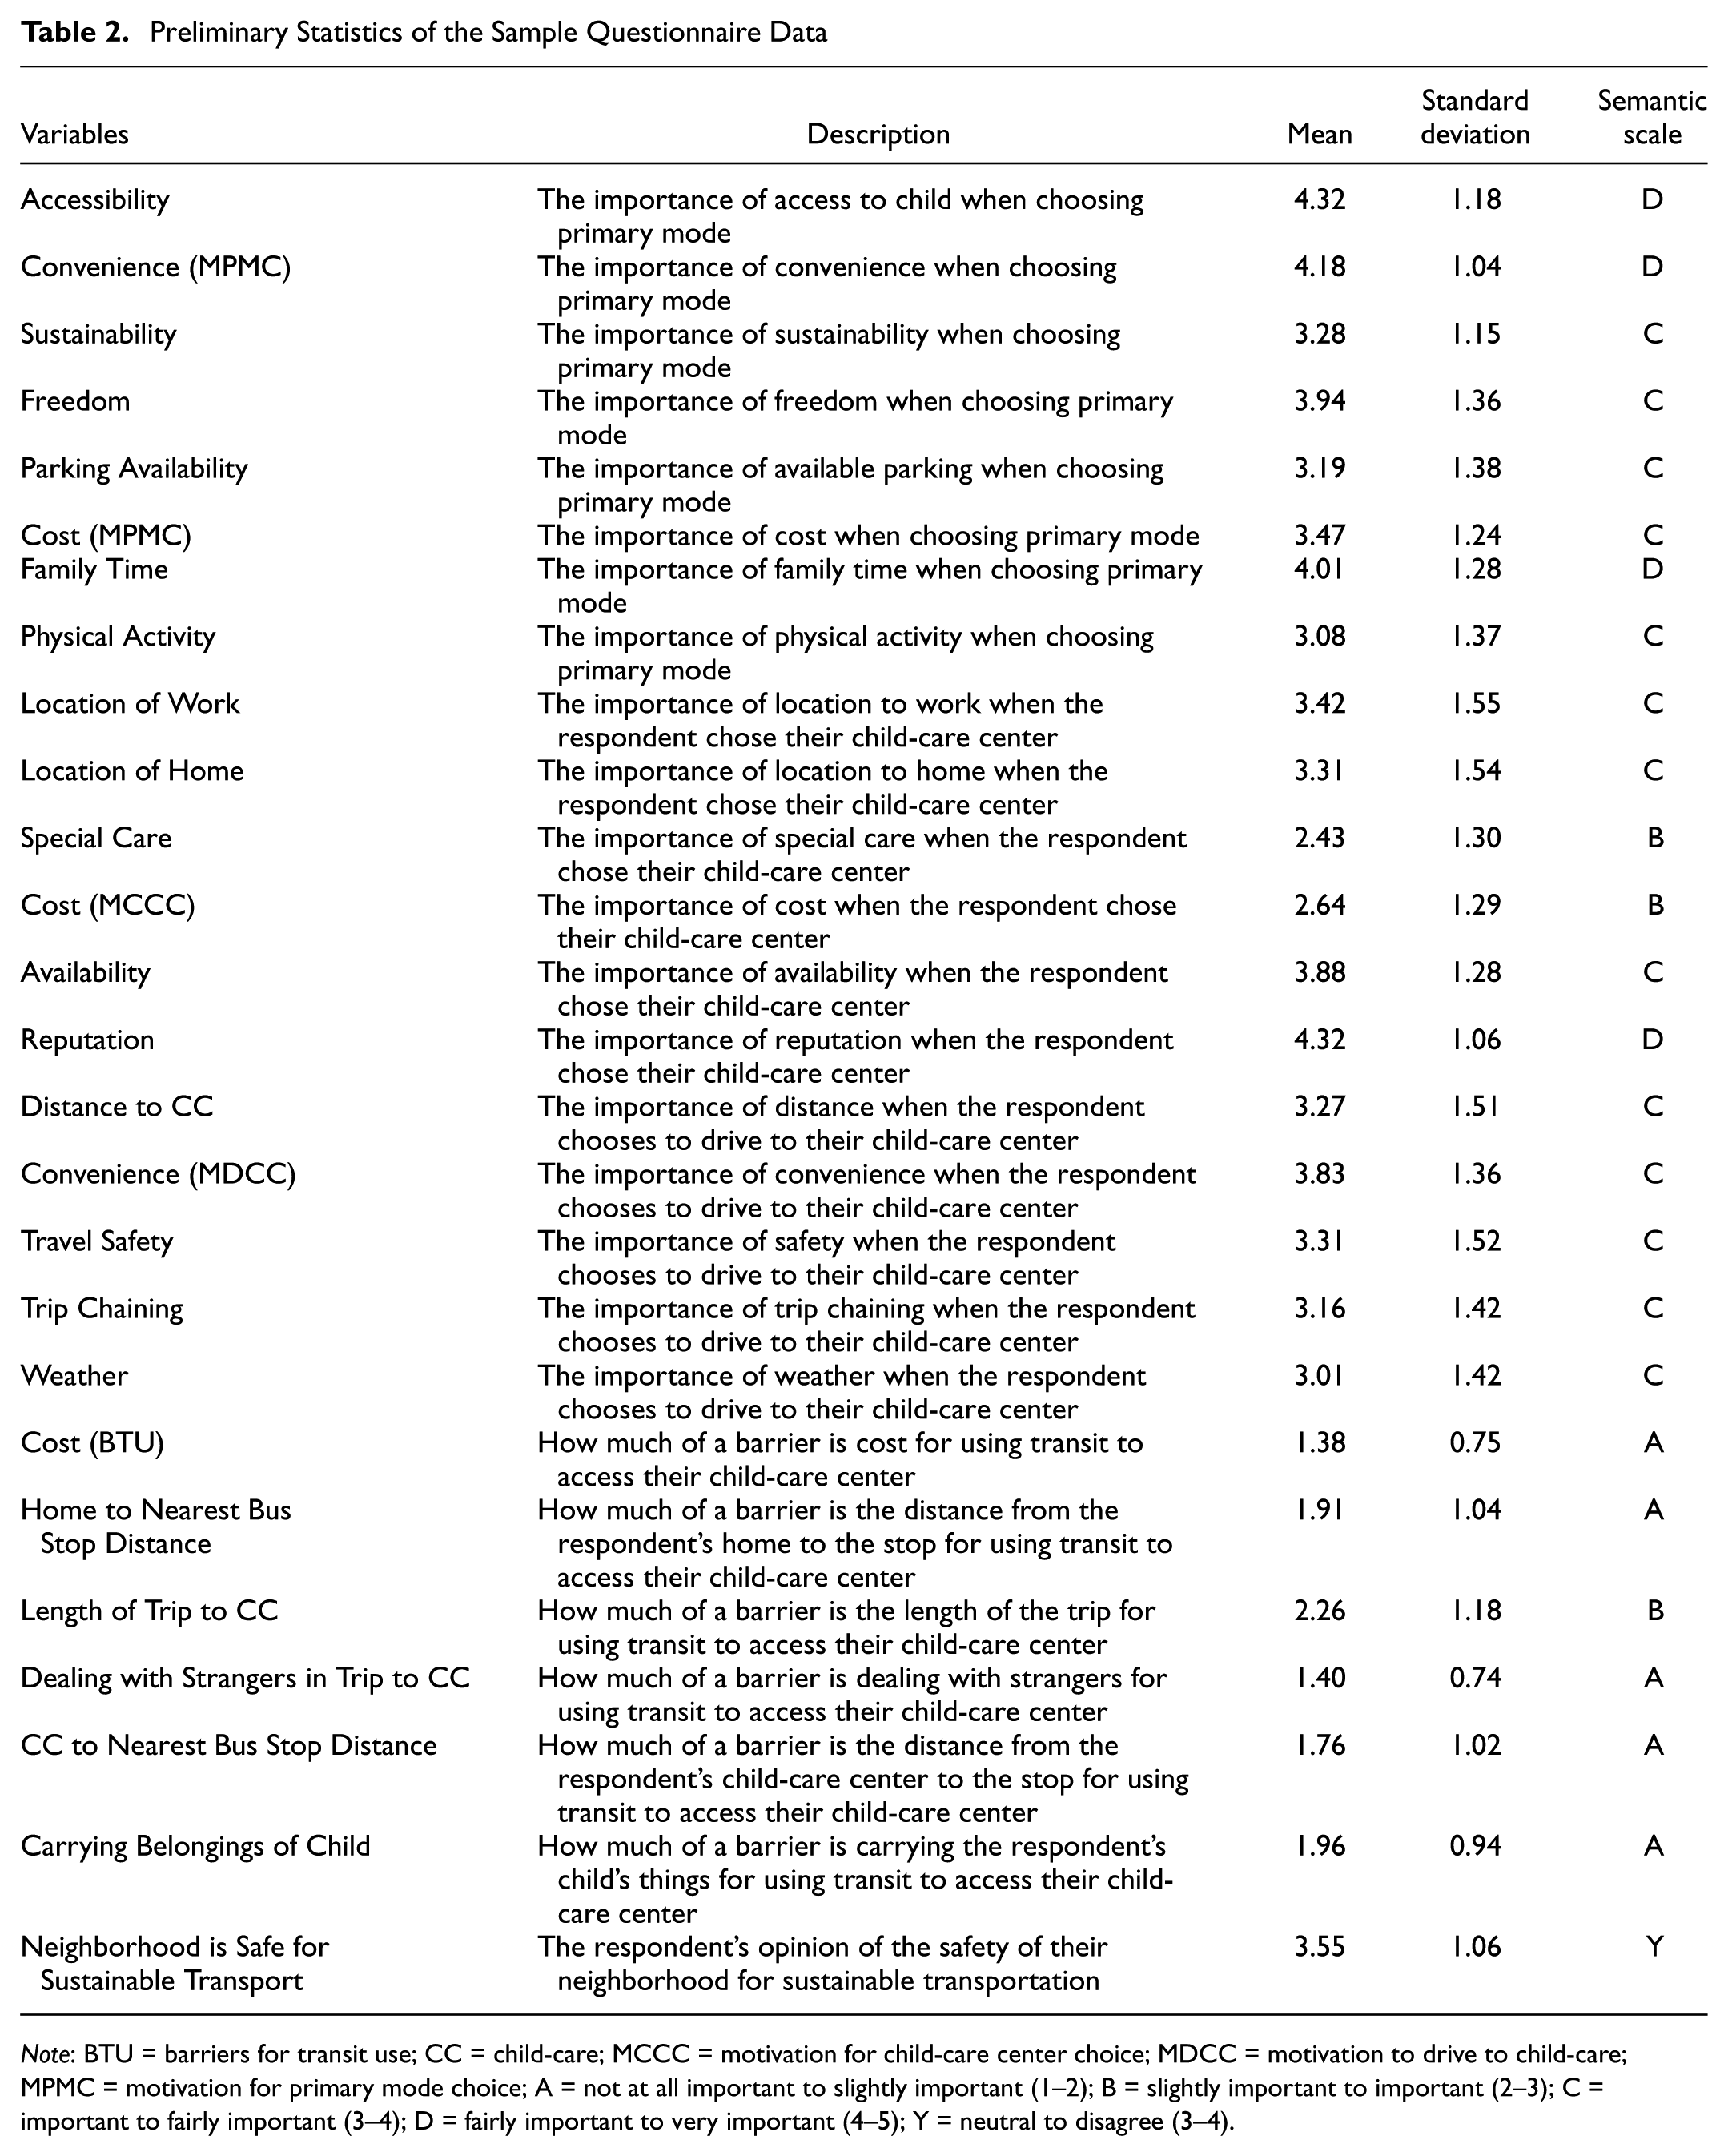
Note: BTU = barriers for transit use; CC = child-care; MCCC = motivation for child-care center choice; MDCC = motivation to drive to child-care; MPMC = motivation for primary mode choice; A = not at all important to slightly important (1–2); B = slightly important to important (2–3); C = important to fairly important (3–4); D = fairly important to very important (4–5); Y = neutral to disagree (3–4).
Table 2 shows that accessibility, convenience, and family time are the most important factors for a household’s primary mode choice. Households primarily select child-care centers based on the center’s reputation and availability. Location of work and home also play major roles behind this choice. The respondents highly prioritized convenience, distance, and safety as key factors affecting their motivation to drive when traveling to child-care centers. The households identified length of trip to child-care as a “slightly important to important” barrier to transit use. Interestingly, they did not consider cost of transit as a barrier to transit use, assigning it, on average, a value of 1.38 (not at all important to slightly important). The respondent households do not consider the neighborhoods of their child-care safe for using sustainable transport (neutral to disagree—responding to the question whether it is safe).
The socio-demographic characteristics of the sample indicate that the household adult who most often performs the child-care trip is aged between 25 and 44 years (94%); 82% of household adults are employed full-time, 8% part-time, and 10% are unemployed; 46% of the households have an average annual income above $100,000, while only 5% of households have an average annual income of less than $20,000; and 97% of the sample households own a vehicle, which indicates that families are heavily dependent on cars. Table 3 represents all the parameter estimates of the variables that are used to build the SEMs. From these values, the significant variables are determined based on a two-tailed t-test with a critical value of 1.64 for a 90% confidence limit. Then, the findings are correlated with causality to rationalize their inclusion in the model. The values of RMSEA, SRMR, CFI, TLI, AIC, and BIC of the developed models for this study are listed in Table 4 to identify the best-fitted SEM.
Estimated Parameters’ Values for all the Structural Equation Models
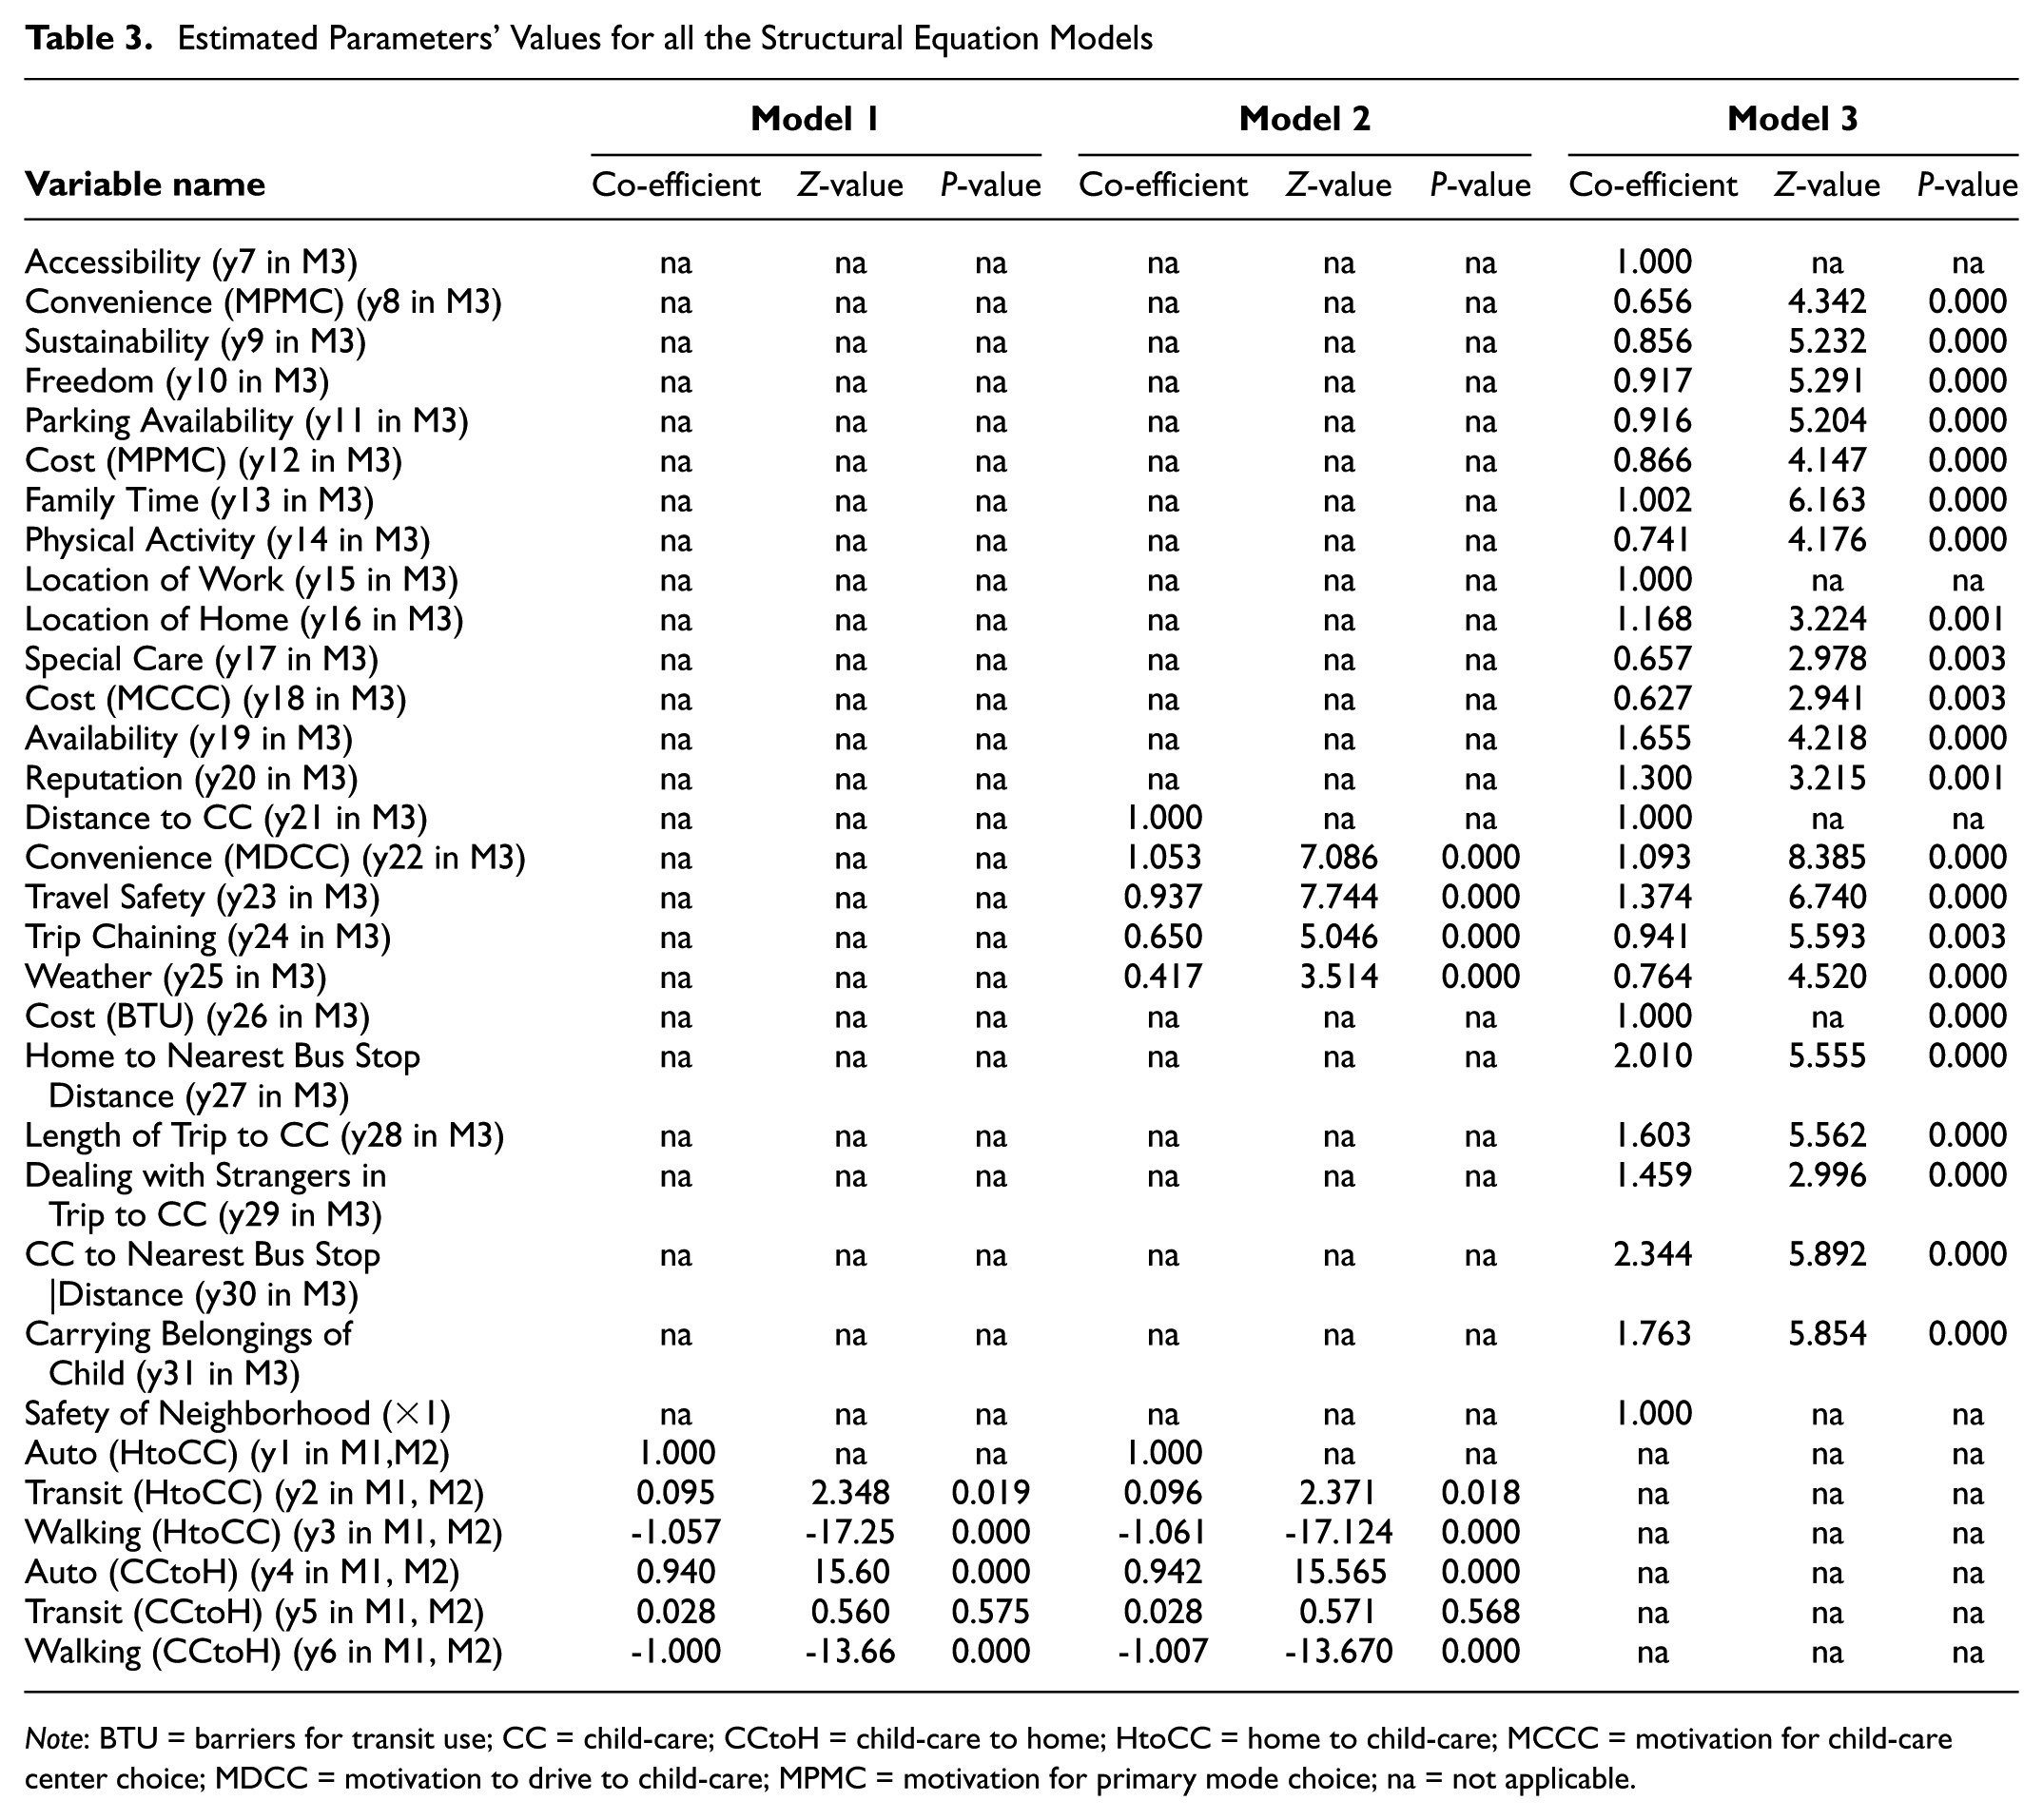
Note: BTU = barriers for transit use; CC = child-care; CCtoH = child-care to home; HtoCC = home to child-care; MCCC = motivation for child-care center choice; MDCC = motivation to drive to child-care; MPMC = motivation for primary mode choice; na = not applicable.
Goodness-of-Fit Measures of the Developed Structural Equation Models
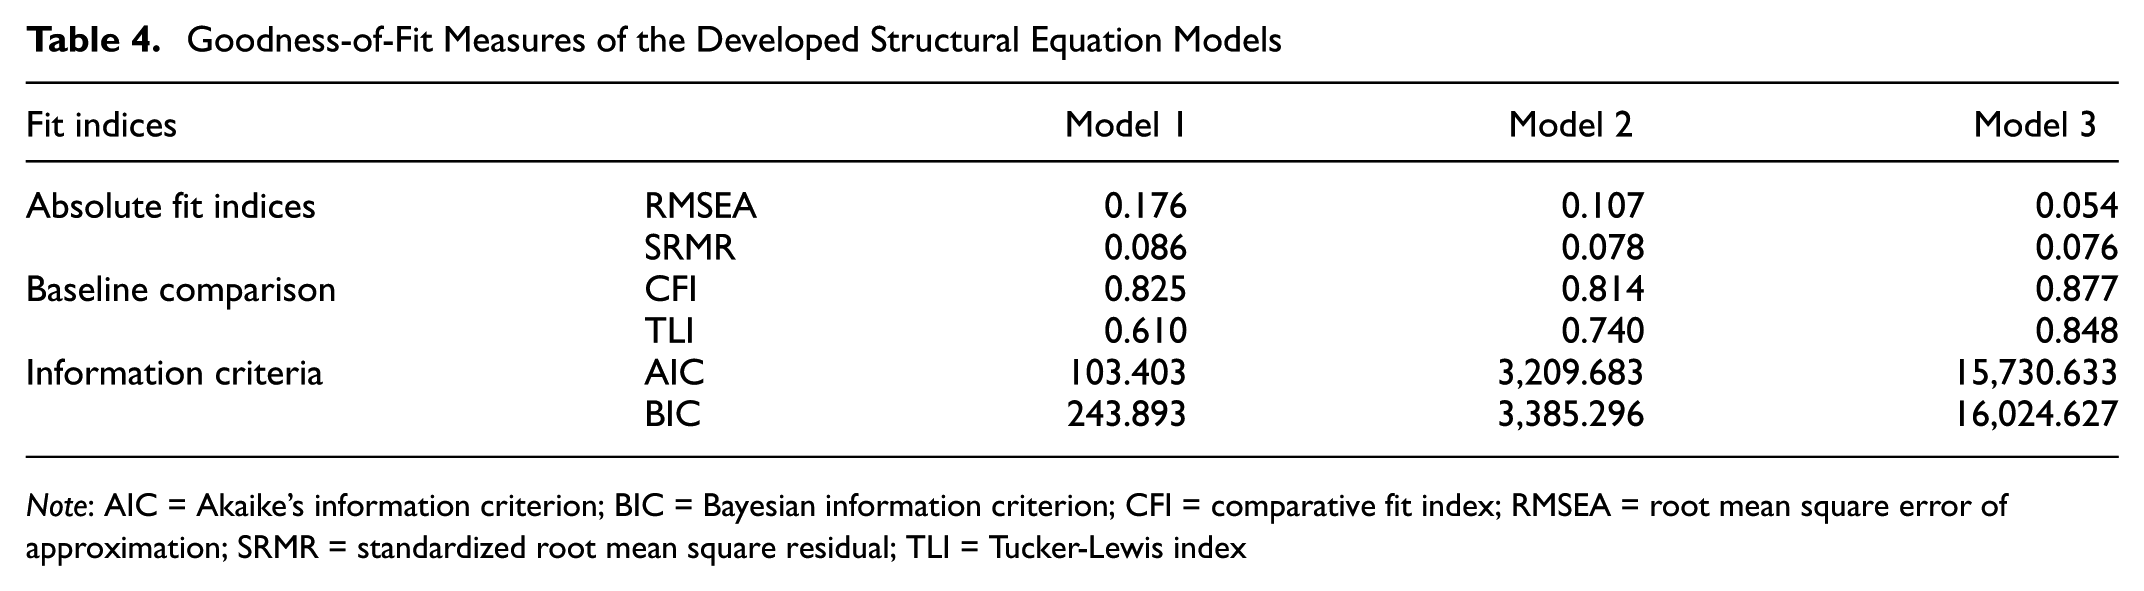
Note: AIC = Akaike’s information criterion; BIC = Bayesian information criterion; CFI = comparative fit index; RMSEA = root mean square error of approximation; SRMR = standardized root mean square residual; TLI = Tucker-Lewis index
Model 1
In Model 1 (M1), one endogenous latent variable—“Travel Freedom”—is calibrated by six endogenous manifest variables. These endogenous manifests are influenced by different exogenous variables. The best model structure is obtained after shuffling the variables. Results indicate that the use of “Auto” while making child-care trips has the highest positive impact on “Travel Freedom” (0.940, z value 15.603; Table 3). This finding is analogous to existing literature as private cars provide freedom to traveling passengers ( 22 ). Surprisingly, “Walking” has a negative effect on “Travel Freedom” of child-care going households, both while going to child-care from home (−1.057, z value −17.25; Table 3), and while going home from child-care (−1.000, z value −13.663; Table 3). All the six variables came out as significant except use of “Transit” when traveling from child-care to home (0.028, z value 0.571; Table 3). This means that “Travel Freedom” is not significantly affected when the respondents use transit when traveling to their residence from child-care. The model fit is found to be not satisfactory (Table 4) and does not provide enough information on travel behavior of the households. Therefore, Model 2 (M2) is formed.
Model 2
The connections between the latent variables with other variables are similar in M1 and M2, except that an exogenous latent variable—“Motivation to Drive to Child-Care”—is added, which is calibrated by five exogenous manifest variables. To justify the model structure, variables are shuffled, and the best structure is obtained. Similar results are found in M2 and M1 in relation to “Travel Freedom.” In M2, “Auto” use increases “Travel Freedom” (0.942, z value15.565; Table 3), whereas “Walking” to and from child-care centers (−1.007, z value −13.670; Table 3) decreases “Travel Freedom.” Use of “Transit” (0.028, z value 0.571; Table 3) while traveling home from child-care also shows insignificant impact on “Travel Freedom.” Results also show that people drive to child-care mostly because of “Convenience” (1.053, z value 7.086, Table 3) and “Travel Safety” (0.937, z value 7.744; Table 3). Intention to drive to child-care is also positively affected by “Trip Chaining” opportunity (0.650, z value 5.046; Table 3) and “Weather” condition (0.417, z value 3.514; Table 3). The M2 fit measures are better than M1 but still not indicating a good fit. Therefore, M3 is developed based on lessons learnt from the development process of M1 and M2, with additional latent and manifest variables.
Model 3
M3 meets the critical boundary values of fit indices defined by existing literature. Model fit can be improved by removing some variables from the models and subsequently reducing the number of observed variables explaining latent variables. However, considering the complexity of estimating households’ travel choice deciding factors, none of the measured indicators are dropped from the analysis. M3 achieved the best values for all the fit indices among the three SEMs. Therefore, M3 represents the best model to examine travel behavior of households with pre-school aged children.
In Model 3 (M3), four endogenous latent variables—“Motivation for Primary Mode Choice,”“Motivation for Child-Care Choice,”“Motivation to Drive to Child-Care,” and “Barriers to Transit Use”—are calibrated by different endogenous manifest variables. The one exogenous latent variable is “Child-Care Neighborhood Safety” which is calibrated by an exogenous manifest variable. “Family Time” (1.002, z value 6.163; Table 3) has the highest influence on primary mode choice of households followed by “Freedom” (0.917, z value 5.291; Table 3) and “Parking Availability” (0.916, z value 5.204; Table 3). The importance of “Family Time” and “Freedom” is understandable as households like to have privacy and flexibility while traveling with their children. Moving place to place with children can often be challenging and it is expected by households that their primary mode will offer them convenient service when doing so. These findings are in line with the existing literature ( 22 , 23 ). “Cost” (0.866, z value 4.147; Table 3) and “Sustainability” (0.856, z value 5.232; Table 3) also have high influence on primary mode selection. “Cost” is important as some families cannot afford to buy their own private automobiles ( 24 ). Interestingly, households consider “Sustainability” when choosing their primary mode of transport. This points to the poor understanding of the households of the role of private vehicle use as an unsustainable travel option (as they are heavily car dependent). In the case of households’ selection of a child-care center, “Availability” (1.655, z value 4.218; Table 3) of the child-care center has the highest influence, followed by “Reputation” (1.300, z value 3.215; Table 3) of child-care center and “Location of Home” (1.168, z value 3.224; Table 3). “Availability” here means whether the centers have spots available or are accepting more children. “Reputation” is the second most significant variable, referring to the service quality of the child-care center. “Location of Home” is important to households when choosing the center because it directly affects their daily commute time. Most respondent families travel from home to child-care and child-care to home at least 5 days a week, and if the home location is far from child-care or the parents’ workplaces, it would be inconvenient for them to access the child-care. If destination locations are nearby, it is easier to access them and households can spend less time on the road, thus, reducing traffic congestion ( 25 ). “Travel Safety” (1.374, z value 6.740; Table 3), “Convenience” (1.093, z value 8.385; Table 3), and “Trip Chaining” (0.941, z value 5.593; Table 3) are the three main reasons households drive to child-care centers. This finding is similar to the findings of M2. “Child-Care to Nearest Bus Stop Distance” (2.344, z value 5.892; Table 3) and “Home to Nearest Bus Stop Distance” (2.010, z value 5.555; Table 3) are considered the two most important factors contributing to the barriers of transit use. The reasoning behind this is that child-care going households usually have to carry children along with their accessories such as strollers, bags, and so forth, which can make walking to get to the bus stop difficult ( 4 ). “Carrying Belongings of Child,”“Length of Trip to Child-Care,” and “Dealing with Strangers in Trip to Child-Care” are also identified as barriers to transit use by the households.
Policy Implications
The results of this study have led to several critical policy considerations. The findings provide strong policy suggestions as it is necessary to provide a safe and convenient sustainable transport system to encourage households to use sustainable travel modes. Active participation from employers, child-care providers, municipal governments, transit providers, and households with young children is needed to promote sustainable travel behavior across communities with an aim to reduce traffic congestion, emissions, and accidents.
A study showed that travel by car and longer travel negatively affect children’s satisfaction with traveling ( 26 ). Their results indicated that travel by school bus or active mode were felt to be of higher quality. Waygood et al. summarized the considerable negative impacts on children’s health of transport use, including crash risk, asthma, high blood pressure, stress, and anxiety ( 27 ). These results advocate for the positive impacts on children’s health from using active travel options. In this study, most of the households (73%) are found to be reliant on private vehicles to make their child-care trips. Households prioritized “Family Time” and “Travel Freedom” as the most important factors when choosing their primary mode. They may choose not to use sustainable travel modes if they perceive it would prevent them from easily performing their daily activities ( 28 ). Sustainable transportation initiatives should be marketed with a focus on the opportunity to have quality time with family and the freedom to do unplanned activities. “Parking Availability” is very important to households that chose to walk (27%), which may be an indicator that households are choosing to walk when there is limited parking available at their destination. Flexible start times, telecommuting, and shorter working weeks are common programs employers can implement that support employees who are parents of young children ( 29 ). This study identifies that 57% of the households group their child-care trip with their trip to work. Therefore, there may be opportunities for employers to host a child-care center or locate near child-care centers to reduce the complexity of daily travel for their employees ( 6 ). This measure may also reduce parking demand at the work site.
In this study, distance of bus stops from home, as well as from child-care centers, is identified as a major barrier for using transit. Child-care providers that are located near transit can influence transit use of parents and staff through program design and communication with local government. Caltrans’ study identified problems in relation to traffic congestion and parking that occur when families are picking up and dropping off their children at peak times using a car ( 10 ). This congestion around the child-care center can lead to conflicts and create dangerous situations. Although related to older children (elementary school), Rothman et al. observed that parents of children show risky driving behaviors, such as reversing dangerously, when dropping off their child at school ( 30 ). To address this issue, there are opportunities for child-care providers to create a wider mode share and reduce the reliance on personal vehicles. Results also show that parents have to carry a lot of equipment and items when traveling with young children. This can become a struggle when parents are continuing on from the child-care center to work while using sustainable transportation. Parents that choose to bike may have to continue to cycle with their child carrier attached and those who take transit may be required to bring their child’s items with them on the bus. With this in mind, there may be opportunities for child-care centers to implement a policy allowing parents to leave strollers, child carriers, and so forth, at the child-care center to be picked up at the end of the day. In addition, because it is found that the child-care trip is grouped with travel to another destination, the child-care providers may choose to be located close to destinations commonly grouped with child-care to reduce the complexity of household tours ( 10 ).
Municipal governments may fund land use planning for mixed-use and walkable communities to locate child-care in areas that will encourage sustainable travel behavior. There is opportunity to plan for connected walking and biking infrastructure that accommodates families and children, such as separated active transportation paths ( 31 ). Studies support this type of infrastructure and have found that creating safe places to cycle is important to increase bicycle use by the elderly, parents, and children ( 32 ).
Preliminary research into transit-oriented design and the findings of this study suggest that there may be opportunity for transit planners to incorporate features that accommodate child development into transit infrastructure. For instance, features such as games, colors, playground equipment, and toys that will occupy children, and stroller storage, would provide a clear message to families that they are a priority in planning for the transit system. Another potential strategy would be for transit providers to design and reserve a space for a child-care facility when developing new transit terminals, therefore child-care is incorporated directly into the design of the terminal.
Conclusion
This study proposes a framework to analyze the relationships of factors such as convenience, cost, safety, and distance to bus stop, which affect travel choices including primary mode choice and whether to drive to child-care, and barriers to transit use while making child-care trips by households with pre-school aged children. The study examines the effects of households’ socio-economic characteristics, such as income, number of household vehicles, general information such as number of children going to child-care, number of people aged 16+ in household, frequency of attending child-care, and trip chaining information, when estimating factors. This study achieved its objectives, starting off with an in-depth literature review followed by collecting data through an electronic survey that is distributed to all licensed child-care centers in Halifax, Canada. Next, the data observations from 201 households are analyzed using SEM to get a thorough understanding of travel behavior of families with young children as they conduct their daily activities while including drop-off and pick-up from child-care.
Among the three SE models, the best model (M3) identified “Family Time,”“Freedom,” and “Parking Availability” as the primary determinants of primary mode choice. “Cost” and “Sustainability” are also considered by the respondents and affect their mode choice. When choosing a child-care center for their children, families mainly consider “Availability” and “Reputation” of the center, and their “Home Location.” Most of the households (73%) are found to use a private vehicle to make their child-care trips. The variables that motivate them to drive are “Travel Safety,”“Convenience,” and opportunity to do “Trip Chaining.” Households identified distance to the nearest bus stop from home, as well as from child-care centers, as a major barrier for transit use. They also highlighted the burden of carrying child supplies, length of trip to child-care, and dealing with strangers as obstacles for using transit.
One of the limitations of this study is its small sample size. The authors are planning to conduct another survey in the event that financial support is in place. Such an initiative will provide additional opportunity to compare the data and model results in 2-yearly time stamps. Nevertheless, the sample size can be deemed adequate considering the total number of variables included in this study. The authors have focused on creating a framework and baseline to identify possible travel trends and challenges among households with pre-school aged children. Possible future research can emphasize determining the impact of the built environment on mode choice to and from child-care destinations. There are also opportunities to validate the outcomes of this study with qualitative data through focus group sessions with child-care stakeholders. Future research may also develop or implement opportunities identified in this study to establish if those are successful means of addressing transportation barriers and challenges of households with young children, and also to promote sustainable travel behavior.
Footnotes
Author Contributions
The authors confirm contribution to the paper as follows: study conception and design: M. A. Habib, M. A. H. Anik, C. Robertson; data collection: C. Robertson; analysis and interpretation of results: M. A. Habib, M. A. H. Anik; draft manuscript preparation: M. A. Habib, M. A. H. Anik. All authors reviewed the results and approved the final version of the manuscript.
Declaration of Conflicting Interests
The author(s) declared no potential conflicts of interest with respect to the research, authorship, and/or publication of this article.
Funding
The author(s) received no financial support for the research, authorship, and/or publication of this article.