
Abstract
The Pavement ME transverse joint faulting model incorporates mechanistic theories that predict development of joint faulting in jointed plain concrete pavements (JPCP). The model is calibrated using the Long-Term Pavement Performance database. However, the Mechanistic-Empirical Pavement Design Guide (MEPDG) encourages transportation agencies, such as state departments of transportation, to perform local calibrations of the faulting model included in Pavement ME. Model calibration is a complicated and effort-intensive process that requires high-quality pavement design and performance data. Pavement management data—which is collected regularly and in large amounts—may present higher variability than is desired for faulting performance model calibration. The MEPDG performance prediction models predict pavement distresses with 50% reliability. JPCP are usually designed for high levels of faulting reliability to reduce likelihood of excessive faulting. For design, improving the faulting reliability model is as important as improving the faulting prediction model. This paper proposes a calibration of the Pavement ME reliability model using pavement management system (PMS) data. It illustrates the proposed approach using PMS data from Pennsylvania Department of Transportation. Results show an increase in accuracy for faulting predictions using the new reliability model with various design characteristics. Moreover, the new reliability model allows design of JPCP considering higher levels of traffic because of the less conservative predictions.
Transverse joint faulting negatively affects ride quality in jointed plain concrete pavements (JPCP), affecting pavement life cycle and vehicle costs. Faulting is defined as the differential vertical displacement of the slab edge across a transverse joint. Excessive corner deflections lead to erosion and migration of fines from beneath the slab at the joint causing it to fault. Joint faulting usually develops because of a combination of various factors, such as poor load transfer across a joint, heavy axle loads, free moisture beneath the pavement, and erosion of the supporting layers. Therefore, comprehensive models for joint faulting prediction that account for various parameters are essential for pavement design. Moreover, such models must present adequate predictions when compared with field joint faulting.
The AASHTOWare Pavement ME, developed from the Mechanistic-Empirical Pavement Design Guide (MEPDG) ( 1 ), incorporates a state of the art faulting prediction model (2, 3). The model was nationally calibrated several times using data from the Long-Term Pavement Program (LTPP) ( 4 ). Sensitivity analysis of the MEPDG faulting models shows that faulting may be significantly affected by the following design parameters: dowel diameter, slab thickness, base type, coefficient of thermal expansion (CTE), and traffic ( 5 ). Because of the large numbers of parameters affecting the model prediction, the model must be tested and evaluated with local field data, as encouraged by the MEPDG. Any discrepancies between faulting predictions and field performance should be addressed by a careful recalibration of the model.
Several state departments of transportation and research institutions have conducted regional and local calibrations of the MEPDG faulting model ( 6 – 10 ). Overall, local calibrations have improved accuracy of faulting modeling for JPCP, with most recalibrated models producing slightly more conservative predictions. However, a review of national and state calibrations showed that most states still use the original national calibration because of the complexity of a full recalibration and validation ( 11 ).
A new calibration requires large investments to assemble a high-quality performance database. If available data presents high variability or is misinterpreted, it can compromise the process and create an unreliable model. Even high-quality data sets, such as those available in the LTPP database, might present significant variability. Consequently, calibration and validation of the model are usually performed with the same limited database indicating potential validation bias.
The Pavement ME faulting model considers design parameters for the life of the pavement. Although this makes for an appropriate method, several uncontrolled agents such as variability in materials, construction, climate, and traffic still affect performance prediction. Pavements with the same design have been known to present vastly different faulting performances. To account for these uncertainties, pavement designers adopted the reliability concept since the 1970s.
In general, for pavement engineering, reliability is described as the probability that a given distress indicator will remain below or equal to the design threshold for the design life, that is, probability that the pavement will perform as designed. The MEPDG approach implemented in Pavement ME conducts reliability analysis for each distress type ( 12 ). The MEPDG performance models predict pavement distresses with 50% reliability. Yet, pavements are usually designed for higher levels of reliability (90%–95%). Therefore, improving faulting reliability analysis is equally important for design and rehabilitation decisions ( 13 ).
Pavement management system (PMS) data are usually collected yearly in large amounts to provide basic information for rehabilitation and maintenance. PMS data are significantly different than data used in national or local calibrations and usually present higher levels of variability. Despite the potentially high variability, the large volume of information makes these types of databases attractive for improvement of reliability analysis.
The present paper proposes a methodology to conduct local calibration of the Pavement ME reliability model for faulting predictions using PMS data. The research used data from the Pennsylvania Department of Transportation (PennDOT) PMS to develop a new standard deviation equation based on field and simulated faulting.
Pavement ME Faulting Model and Reliability
The Pavement ME faulting model uses a monthly incremental approach which considers factor changes throughout the entire design period including joint load transfer, material properties, seasonal climatic conditions, traffic loadings, subgrade support, and other parameters ( 1 ). Each increment represents a specific combination of preceding factors over a distinct period (month, season, etc.). In the model, joint deterioration reduces load transfer efficiency (LTE) and magnifies differential slab deflection. This amplifies the magnitude of differential energy for subgrade deformation (1, 3).
The incremental design requires thousands of deflection calculations to compute damage monthly (for various loads, joint stiffnesses, and equivalent temperatures) over a design period of many years. Faulting at each month is determined as the sum of faulting increments from all previous months in the pavement life using the following model:


where
Faultm = joint faulting at the end of month m, in.;
ΔFaulti = incremental change (monthly) in mean transverse joint faulting during month i, in.;
FAULTMAXi = maximum mean transverse joint faulting for month i, in.;
FAULTMAX0 = initial maximum mean transverse joint faulting, in.;
EROD = base/subbase erodibility factor;
DEi = differential density of energy of subgrade deformation accumulated during month i;
PS = overburden pressure on subgrade, lb;
P 200 = percent subgrade material passing #200 sieve;
WetDays = average annual number of wet days;
C1,2,3,4,5,6,7,12,34 = calibration constants ( 2 ).
Pavement ME Faulting Model Calibration
The NCHRP 1-40D effort (first recalibration) employed MEPDG version 0.9 software resulting in calibration coefficients similar to those in the original version. Remaining versions of the MEPDG software, including version 1.1, and early versions of Pavement ME use the coefficients estimated under the NCHRP 1-40D study. The NCHRP 20-07/task 288 study used the Pavement ME version 2.3.1 software with a different calibration database. Since the original national calibration using LTPP data did not use sections from Pennsylvania ( 1 ), a recent calibration was performed for Pennsylvania conditions resulting in calibration coefficients similar to those of the NCHRP 20-07 study ( 14 ). Several other states also attempted full calibrations of the model. Table 1 presents faulting coefficients for various MEPDG model calibrations including coefficients for Colorado and Arizona where calibration resulted in values different than the national coefficients.
National and State Calibrated Coefficients for Faulting Prediction Model

Note: NCHRP = National Cooperative Highway Research Program; MEPDG = Mechanistic-Empirical Design Guide.
Pavement ME Faulting Reliability
Reliability analysis is an important part of the MEPDG ( 12 ). Design reliability (R) is defined as the probability (P) that each distress indicator will be less than a selected threshold over the design life. For faulting, design reliability is expressed as:

where μF is the mean joint faulting, and CμF is the critical mean joint faulting.
The faulting model predicts faulting at a reliability level of 50%. Faulting at a specified reliability level is predicted using the following equation:

where
FaultRi = predicted faulting at the reliability level R for year i;
STDFi = faulting standard deviation at the predicted level of mean faulting for year i;
ZR = standard normal deviate for R;
Faulti = predicted faulting at 50% reliability for year i.
Pavement ME recommends the following form for the standard deviation of faulting:

where a, b, and c are calibration coefficients.
A compilation of Pavement ME faulting calibrations revealed that, of the seven states that performed JPCP calibrations, five (Iowa, Louisiana, Missouri, Ohio, and Washington) adopted the national calibration standard deviation coefficients ( 11 ). Only Arizona and Colorado proposed different coefficients. The faulting model calibration performed for Pennsylvania also slightly modified the reliability coefficients, as seen in Table 1.
Figure 1 exemplifies the effect of various reliability models on faulting prediction. Using the same design coefficients in a single faulting model (NCHRP 20-07), but changing the reliability model alters the faulting predictions. Pennsylvania and Colorado reliability model yield results similar to the NCHRP 20-07 model predictions. For these reliability models, as seen in Table 1, modifications to coefficients a, b, and c were minimal. Simulations using the Arizona reliability model presented rather different coefficients in comparison with NCHRP 20-07. This resulted in much less conservative faulting predictions extending the design life (considering a 0.15 in faulting threshold) over an additional 10 years in comparison with the other models.
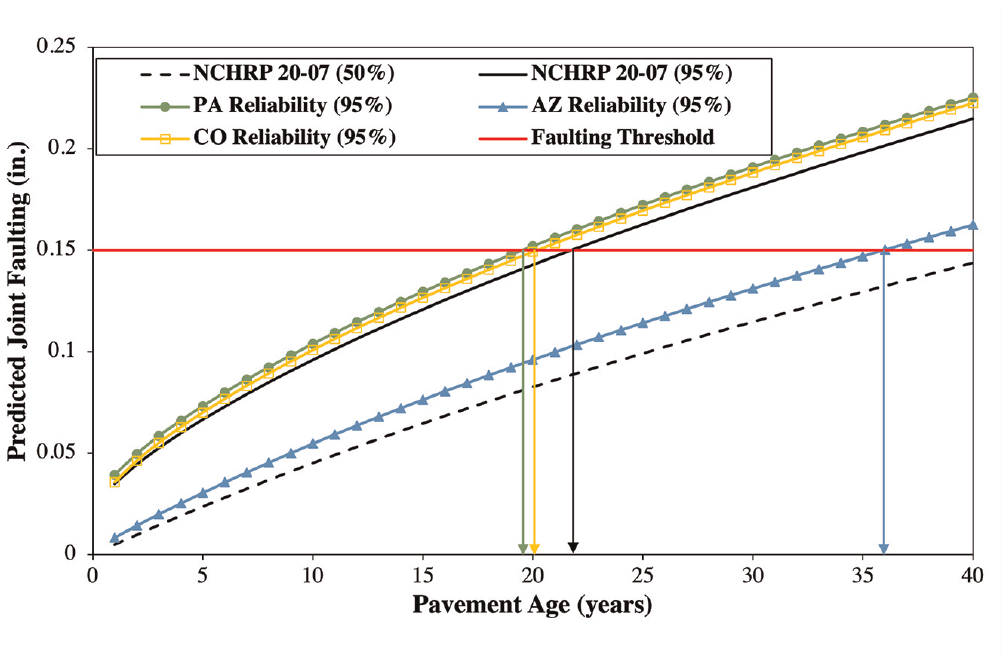
Faulting predictions using a single model with different reliability models.
Calibration of Faulting Model Reliability
Faulting prediction in MEPDG assumes that there is 50% chance that predicted average faulting will be greater or less than the mean faulting prediction. This means that, in a symmetrical distribution, the inputs for faulting calibration (measured and predicted) are set at a 50% reliability. However, there are many sources for discrepancies between the predicted and observed faulting, such as variation in field measurements as well as inaccuracy of design inputs (PCC parameters and properties, layer thickness, base erosion, traffic loads, climate over design life, among others). Deficiencies in the algorithms used in the faulting model, such as missing inputs or inadequate functional form, can contribute to inaccuracy in the faulting predictions. To account for these uncertainties, design reliability incorporates the concept of measured faulting standard deviation in relation to predicted faulting.
This paper adapts the MEPDG reliability procedure using the normal distribution assumption with Pennsylvania PMS data ( 12 ). First, the research team collected and analyzed PMS data by comparing results of the Pavement ME simulations for these sections with observed faulting. Then the PMS calibrated reliability model was established. Finally, the PMS calibrated reliability model was validated with specific cases of field data.
Local Pavement Management Data
The reliability calibration database was composed of over 3,600 PMS observations from the National Highway System collected in 2017 and 2018. These performance data are for dowelled JPCP with a variety of design features, spread over eight districts in Pennsylvania. Figure 2 presents the age and faulting distribution for the dataset. About half of the sections are 15 years old or younger. Most of the younger sections present 15 ft joint spacing while older sections usually have 20 ft joint spacing.
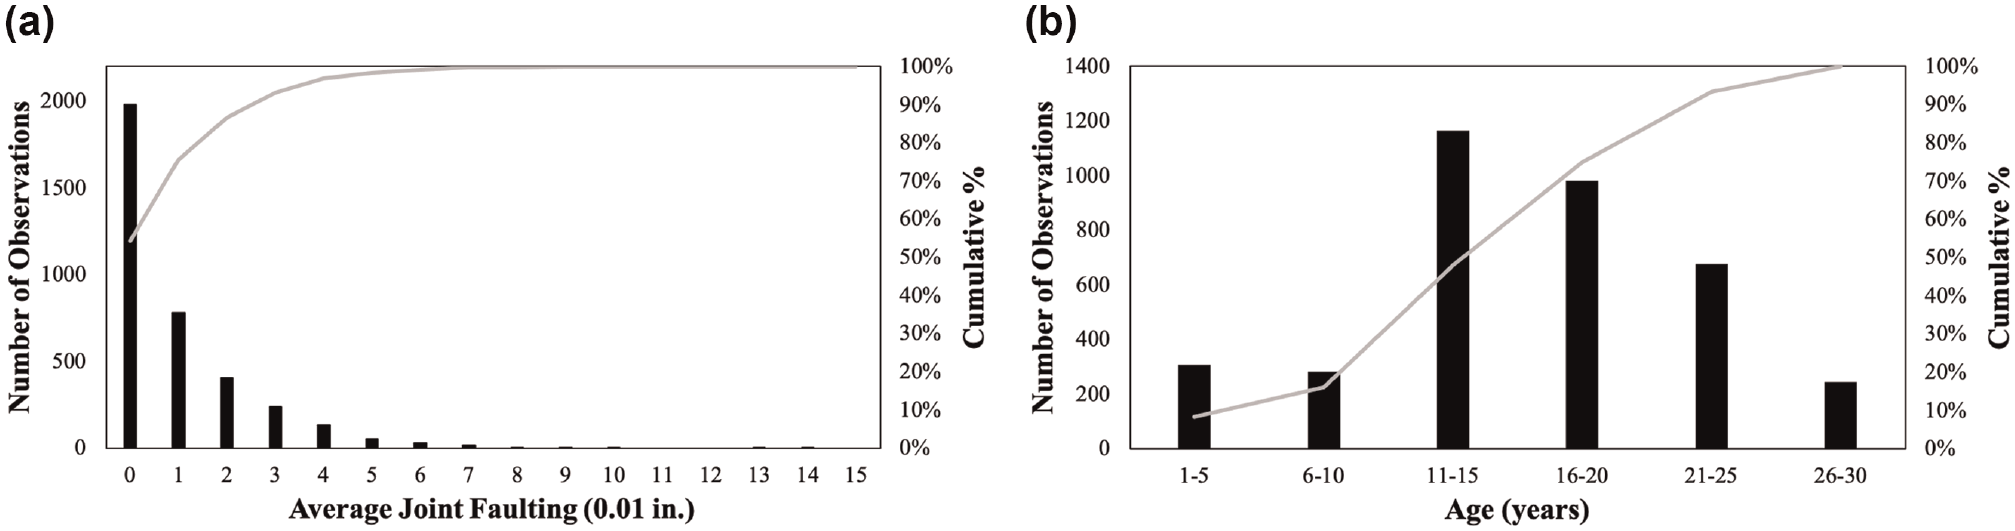
Distribution of pavement management system data with respect to (a) average joint faulting and (b) pavement age.
PennDOT uses an automated system that collects data on International Roughness Index (IRI) and transverse joint faulting. Each individual joint faulting value is rounded to 0.01 in., and the mean value for 0.1-mile segments is reported. This means the data might present a considerable amount of variability. For faulting reliability analysis, the high level of variability is acceptable because of the large dataset.
Pavement Management Faulting Data Statistical Analysis
To evaluate faulting performance of interstate pavements in Pennsylvania, a preliminary statistical analysis was performed. Most pavement segments exhibited an overall good performance. Approximatively 54% of the segments did not show faulting and a small percentage (around 3%) exhibited faulting greater than or equal to 0.05 in. The data were divided into three performance categories: poor, normal, and good, based on the criteria developed in an LTPP study ( 15 ). Figure 3a shows that most observations are placed in the “good” performance category, confirming a satisfactory faulting performance of Pennsylvania JPCP. Figure 3a also presents the linear regression of faulting versus pavement age. A low R-square coefficient indicates that just 16% of the faulting increase can be explained by an increase in pavement age.
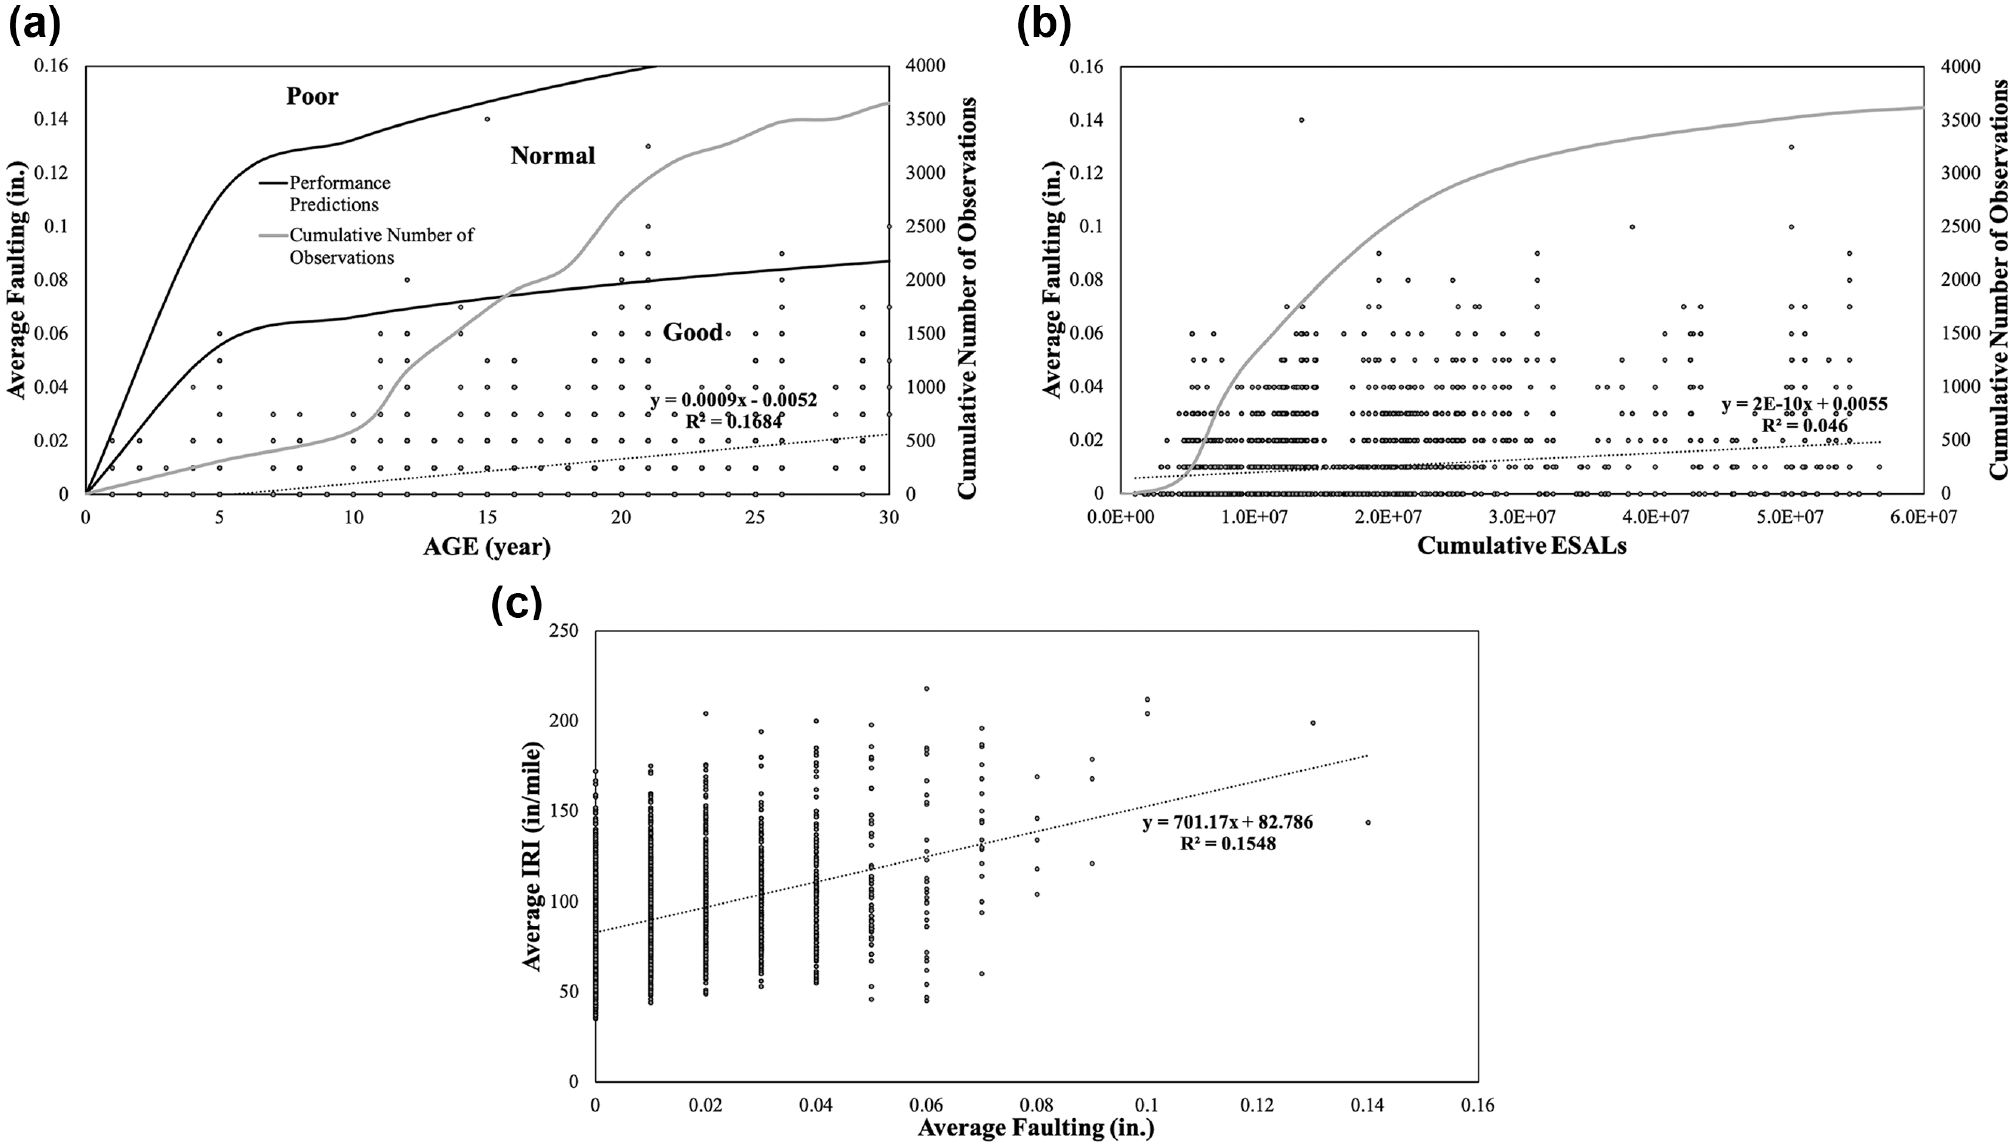
Pavement management system (PMS) average joint faulting versus: (a) pavement age, (b) cumulative equivalent single axle loads (ESALs), and (c) average IRI (International Roughness Index).
Analysis of average faulting versus cumulative equivalent single axle loads (CESALs) (Figure 3b) also resulted in a counterintuitively low correlation between these two parameters. A range of faulting values for every traffic level is observed. Unfortunately, PennDOT PMS data only disclose current traffic. CESALs were estimated by backcasting the current traffic to the section’s opening year and then forecasting to the current year using a 3% compound growth. This generates more uncertainties in the data.
A better correlation was found between faulting and IRI (Figure 3c). Still, this correlation is significantly worse than that computed for LTPP sections (R2 of 0.42) as reported in Khazanovich et al. ( 15 ).
Critical Faulting per Traffic Level
To mitigate the “zero faulting” and high variability data effect on the analysis of PMS faulting data, an analysis of critical faulting was conducted for the top 10% of faulting. Faulting data were divided based on traffic level (Figure 4a) and only segments presenting faulting higher than the 90th percentile were selected. The reduced general database contains 385 observations and shows a more coherent development of faulting with traffic (Figure 4b).
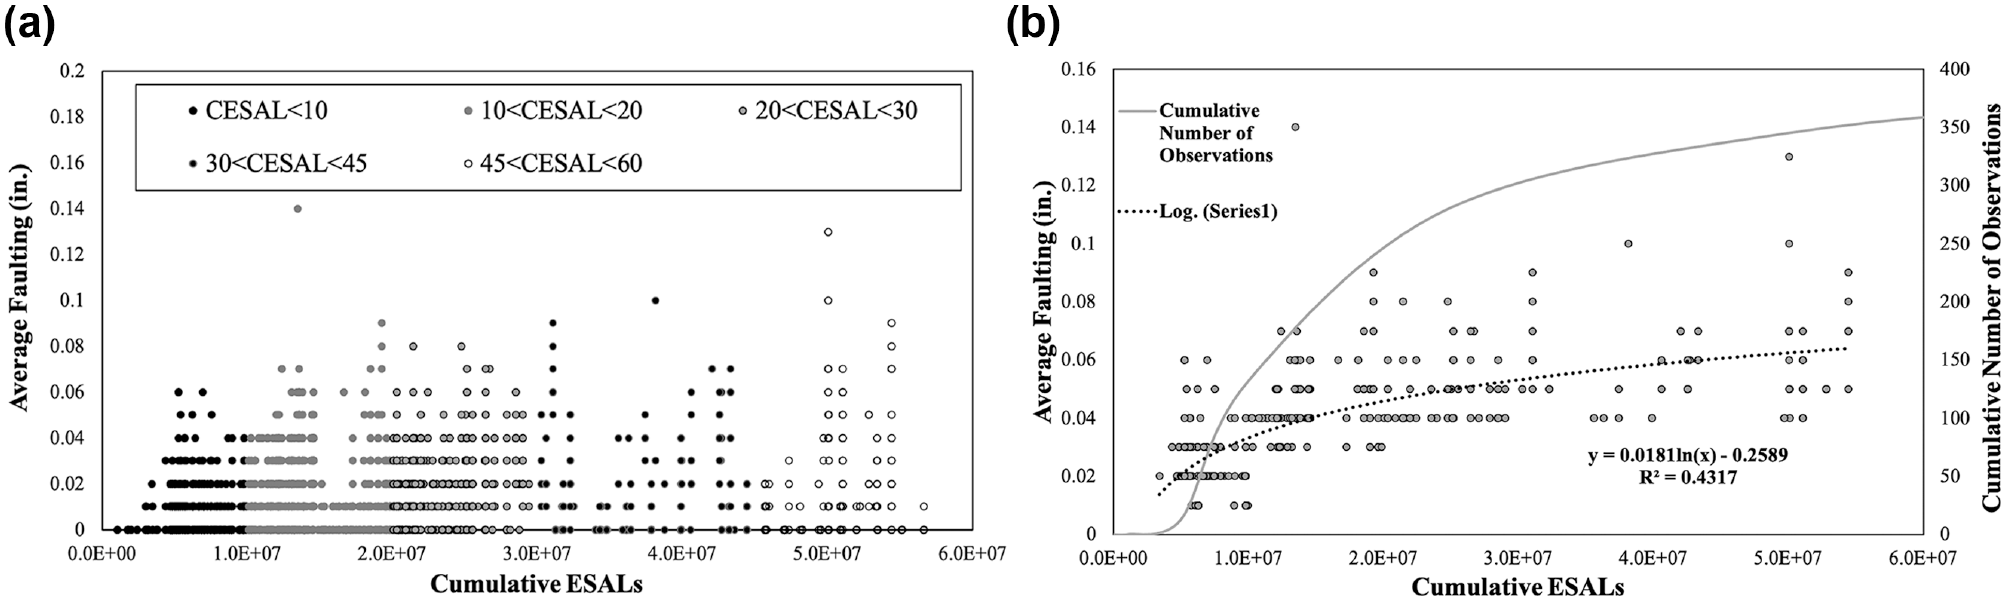
(a) Average joint faulting per traffic level (CESAL × 107) and (b) critical average faulting (90th percentile) versus cumulative traffic.
A comparative statistical analysis of various design parameters available in the PMS database was conducted using the top percentile analysis described above. A series of two-sample t-tests were used to check whether the two-sample means were significantly different based on a 95% confidence interval. Table 2 shows the results of the t-test using faulting greater than the 90th percentile.
Effect of Design Features on Critical (Top 10%) Joint Faulting

Note: SD = standard deviation; AGG = aggregate base; ATB = asphalt-treated base; CTB = cement-treated base; PCC = Portland cement concrete.
As expected, joint spacing showed a significant effect on joint faulting. On average, sections with a longer joint spacing (20 ft) presented almost double faulting compared with sections with 15 ft joint spacing. It should be noted that sections with a longer joint spacing are usually older than sections with shorter joint spacing and, mostly, have aggregate bases while the sections with a shorter joint spacing have stabilized bases.
Stabilized asphalt-treated bases (ATB) and cement-treated bases (CTB) had significantly less faulting than aggregate bases (AGG), as could be expected. Sections with ATB showed slightly, but statistically significant, better performance than CTB sections. Performing the same analysis, but with different levels of faulting percentiles (50th, 85th, and 95th) resulted in the same conclusion (significant difference) presented for the 90th percentile, save for base type; using the 95th percentile, differences between ATB and CTB were statistically insignificant.
The comparison of sections with widened lanes versus conventional width lane (12 ft) sections yielded counterintuitive results. Even though the average faulting for the former was lower than for the latter, the t-test did not confirm the significance of this difference. A possible explanation is the small number of observations with wider lanes (just six). The sections with tied PCC shoulders also exhibited lower mean faulting than sections with other shoulder types even though the p-value was close to the 0.05 threshold. Again, differences in the number of observations might explain this result.
Similar analysis of LTPP faulting data identified the same effects of joint spacing, shoulder type, and base type (treated versus aggregate). However, for lane width, an LTPP report found a significant effect of wider lanes reducing joint faulting ( 16 ).
Pavement ME Versus Field Data
Pavement ME faulting model predictions were compared with the faulting data from the PennDOT PMS data. The faulting model calibration coefficients recommended by ARA, Inc. for the Pennsylvania conditions were used in the analysis ( 14 ). Two cases were considered: 15 ft JPCP and 20 ft JPCP. Table 3 presents the field range values and Pavement ME design inputs for both cases. Slab thickness and average annual daily truck traffic (AADTT) were averaged from the field data (top 10% faulting per traffic level) for each case. Pavement ME modeling was performed with three different levels of CTE since this parameter is unavailable in the PennDOT PMS database.
Field Range and Input Parameters for Pavement ME Faulting Prediction

Note: JPCP = jointed plain concrete pavement; AADTT = average annual daily truck traffic; PCC = Portland cement concrete.
Figure 5a presents results of Pavement ME simulation for 15 ft JPCP (90% reliability) along with measured data for 123 pavement segments, representing the segments with faulting greater than 90th percentile. It can be observed that Pavement ME overpredicts faulting for all CTE values. Indeed, since field data represent the observations with faulting greater than 90th percentile, Pavement ME predictions should be lower than the observed data for any traffic level, but this is the case for only a few pavement segments.
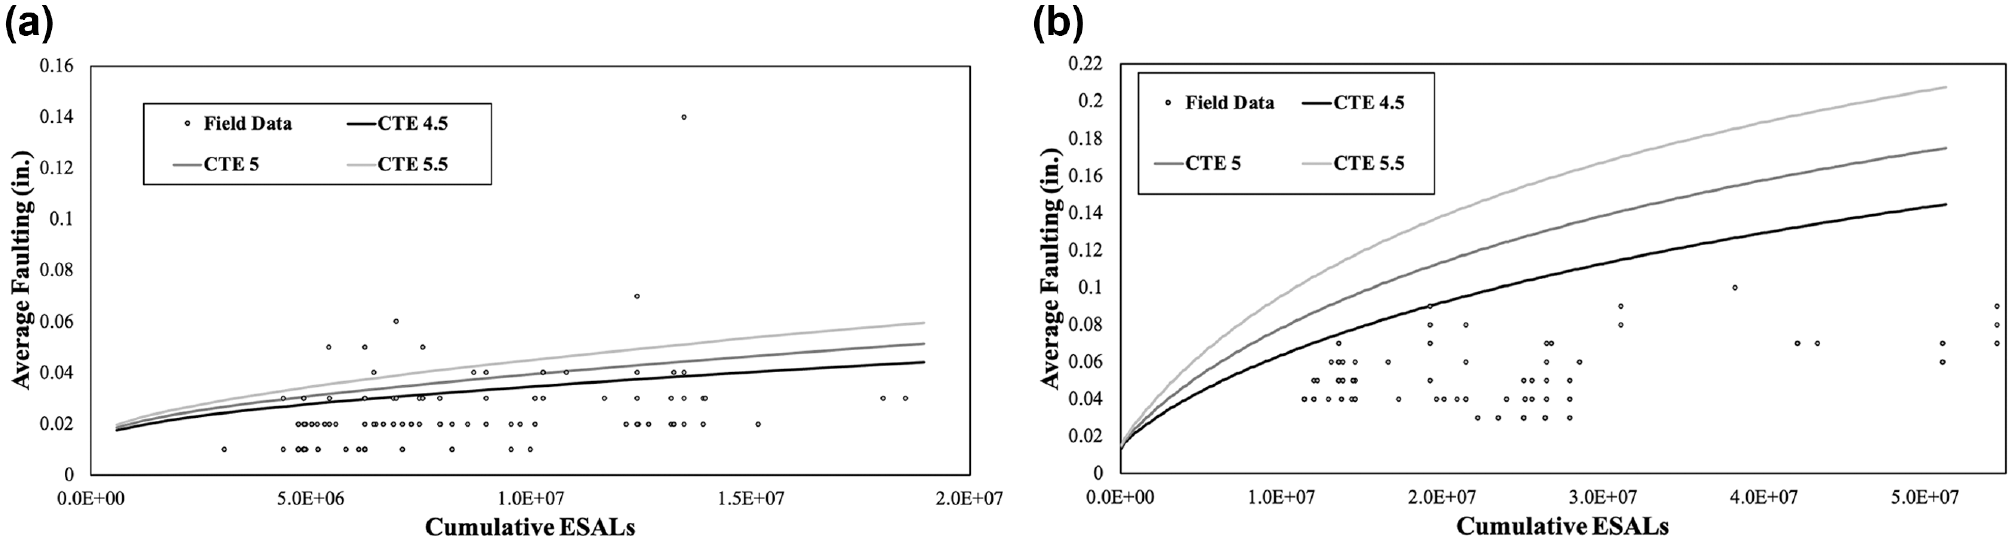
Pavement ME (Pennsylvania calibration coefficients) faulting prediction (90% reliability) versus field data (top 10%) for (a) 15 ft jointed plain concrete pavement (JPCP) and (b) 20 ft JPCP.
Figure 5b presents results of a similar analysis for 20 ft JPCP. Pavement ME 90% reliability faulting predictions are greater than all the measured data, including measurements for 96 segments with faulting greater than the 90th percentile. This confirms that Pavement ME overpredicts faulting for 90% reliability level and higher.
Modification of the Reliability Procedure
The MEPDG slab cracking and faulting reliability procedure was developed using the analysis of variability in performance prediction for the pavement sections used in the performance model calibration ( 12 ). This paper proposes the use of different databases for recalibration of performance prediction models and reliability models. The procedure is exemplified below using over 2,000 observations (PennDOT PMS database) from pavement segments regardless of measured faulting or traffic level. For each field observation, a corresponding Pavement ME (PA calibration) simulation was performed using field design parameters as inputs. A CTE of 5 × 10⁻⁶/°F was assumed based on CTE measurements (average of 4.97 × 10⁻⁶/°F) for some pavements within the PMS database. This way, the reliability calibration database was composed of matching field measured faulting (PMS database) and Pavement ME (PA calibration) predicted faulting for 50% reliability.
Step-by-Step Process of Procedure Development
The recalibration process of the reliability model generally follows the process used in the development of the MEPDG reliability procedure ( 10 ) with some modifications as described below. Following the MEPDG, the likely variation of faulting around the 50% reliability faulting prediction is defined by the 50% reliability faulting of the prediction (at any time over the design life) and its standard deviation. The standard deviations of faulting are a function of variability associated with discrepancy between predicted faulting and PennDOT PMS data for the high percentile levels.
Predicted Faulting Data Groups
The database composed of measured (field) and predicted (Pavement ME) faulting was divided into groups based on the predicted faulting (Table 4). Analysis of faulting prediction variability versus predicted faulting guided the selection of predicted faulting range (Figure 6). Results show that prediction variability (generally overprediction) tends to increase for higher levels of predicted faulting. Table 4 also presents mean faulting for measured and predicted faulting. Because of a great amount of measured faulting equal to zero throughout the field database, there are significant differences between predicted and measured faulting statistics in each group. Overall, as discussed before, Pavement ME tends to overpredict faulting, especially for higher levels of faulting.
Faulting Groups Based on Predicted Faulting

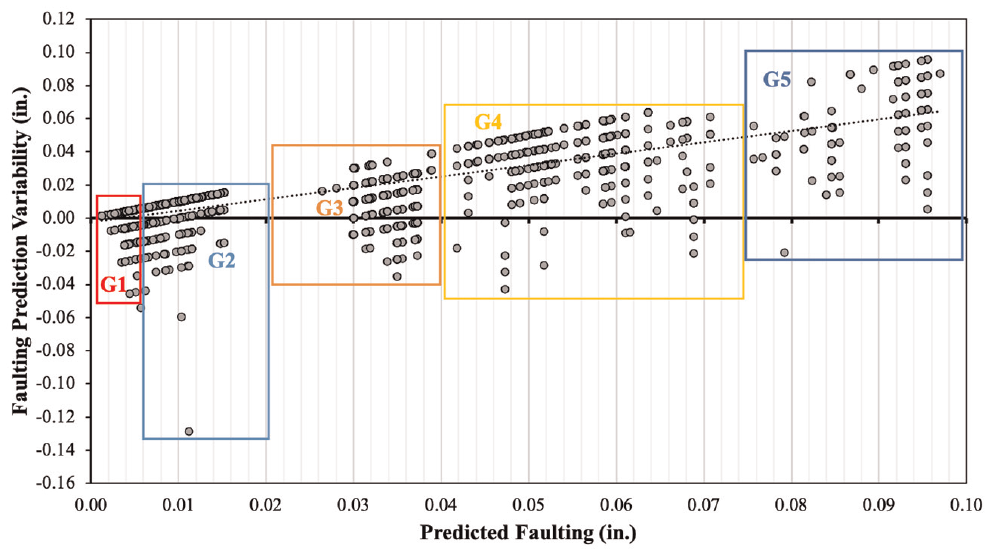
Predicted faulting ranges.
Normal Distribution Parameters
For each group, the top percentile faulting values corresponding to the 50th, 85th, 90th, and 95th percentiles were evaluated. As the prediction variability is assumed to be approximately normally distributed (Figure 7), the standard normal deviate (Z) can be applied (Table 5) for each reliability level ( 12 ). The standard deviation was computed using:

Standard Deviation and Predicted Faulting for each Faulting Group

Note: Bold numbers for StdDevM represent the highest measured standard deviation estimation for each group. na = not applicable.
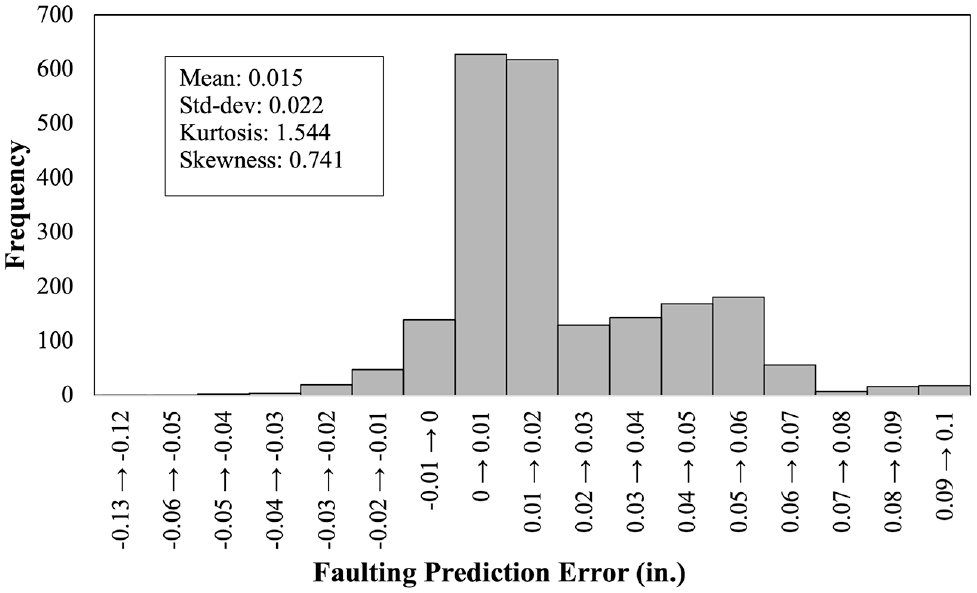
Faulting prediction variability distribution.
where for each reliability level, StdDev is the estimated standard deviation; MF is the measured faulting (top percentile); MF50% is the measured faulting corresponding to the 50th percentile or mean faulting; and ZR is the standard normal deviate at a reliability level (R).
Figure 8 presents MFR minus MF50% versus ZR computed for all groups. The linear equations predict faulting (Table 5) for each reliability in all groups using Equation 9. Predicted values accurately match measured values.

where PFR is the predicted faulting at the desired reliability level (R), C is the linear equation slope (Figure 8), and PF50% is the predicted faulting at a 50% reliability level.
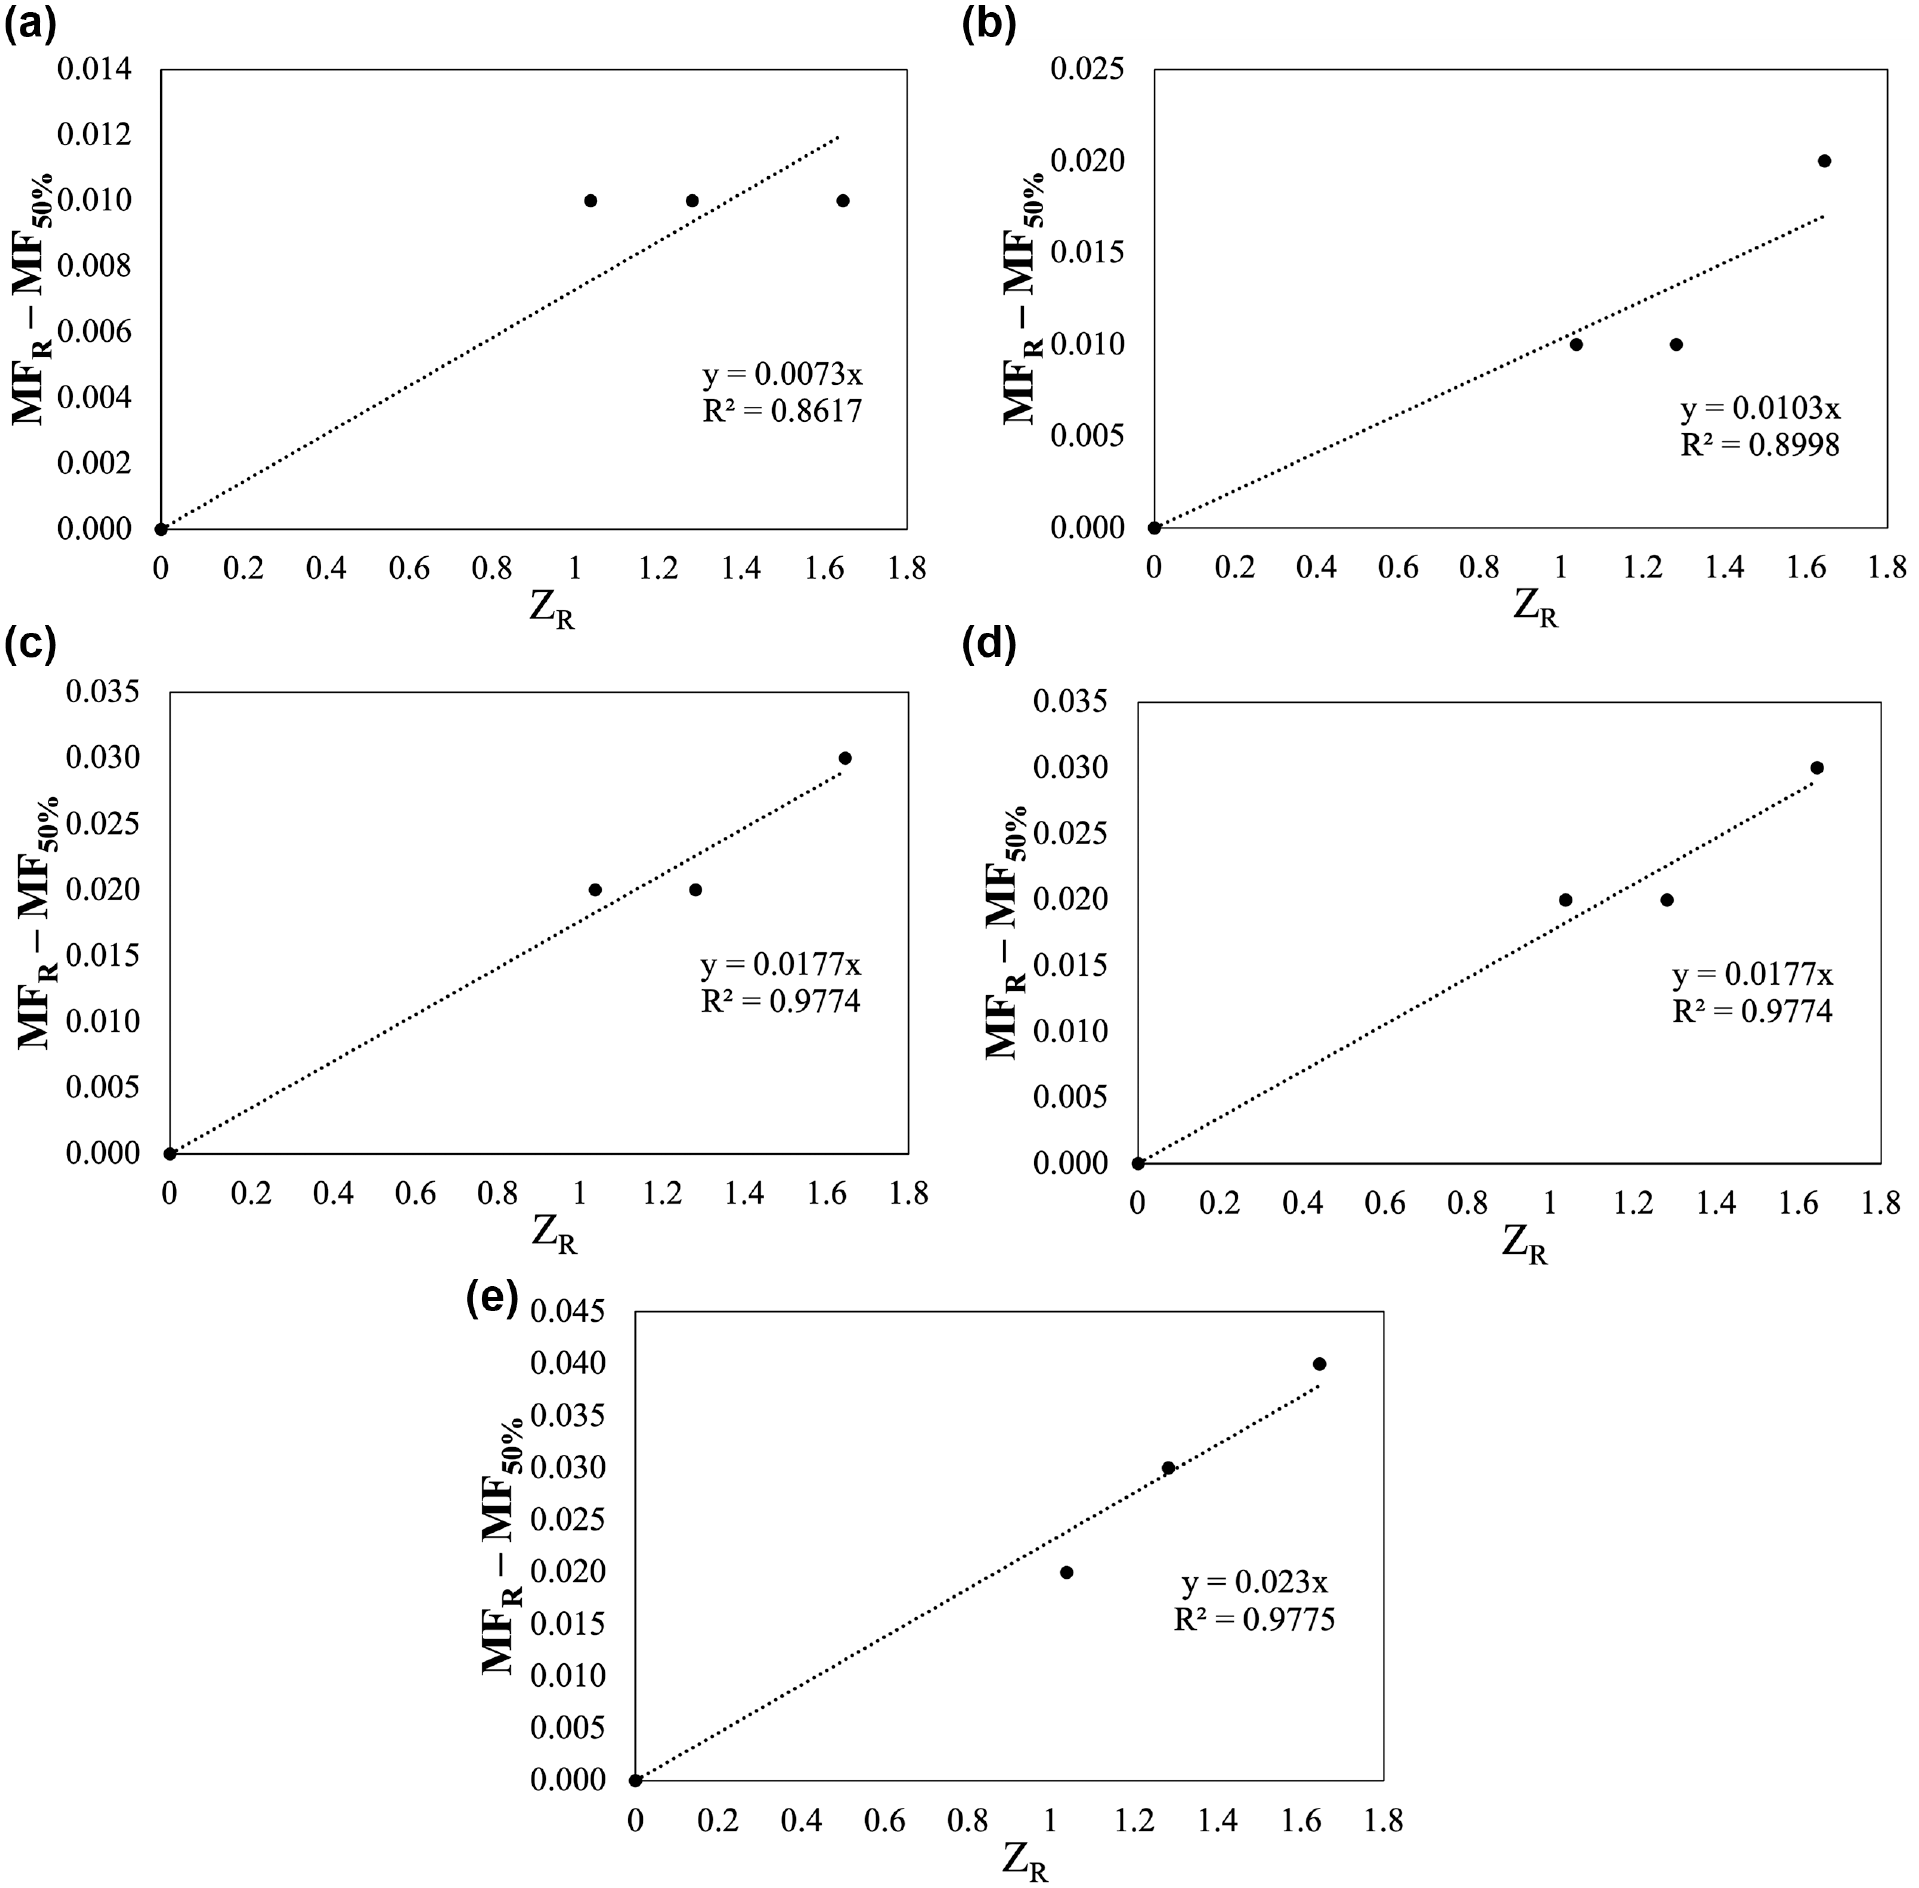
Measured faulting versus standard deviate Z for (a) group 1, (b) group 2, (c) group 3, (d) group 4, and (e) group 5.
Standard Deviation of Measured Faulting Versus Predicted Faulting
With data from Table 4 (mean predicted faulting) and Table 5 (maximum measured standard deviation per group), a new equation for the standard deviation was developed (Figure 9), as follows:

where StdDevM is the measured standard deviation; and PF50% is the predicted faulting.
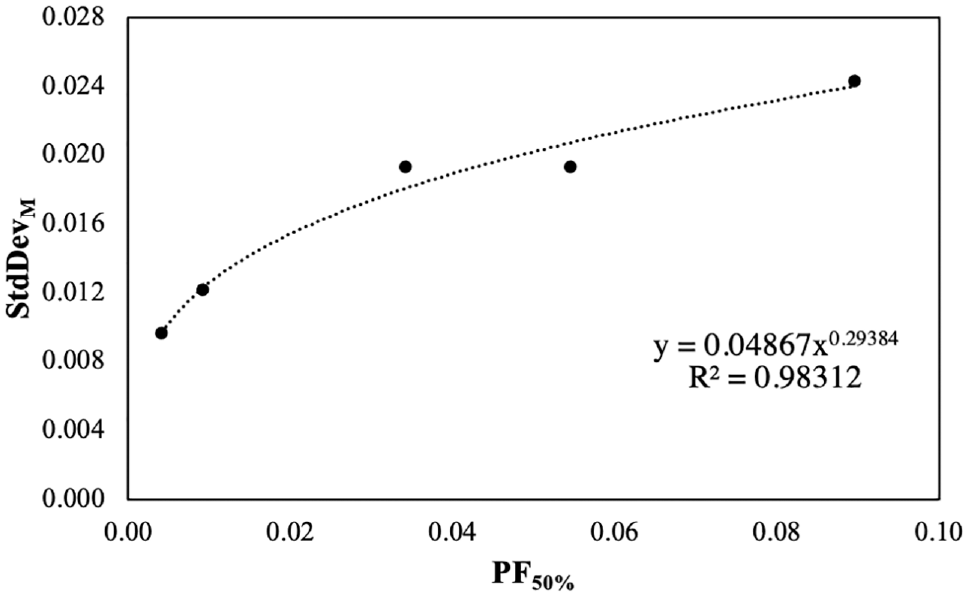
Measured faulting standard deviation versus mean predicted faulting (PF).
PMS calibrated standard deviation coefficients differ greatly from national and Pennsylvania calibrations as seen in Table 6. With these, it is possible to adjust predicted faulting to the desired level of reliability:

Comparison of the PMS Calibrated Reliability Model Coefficients with National and State Calibrations

Note: NCHRP = National Cooperative Highway Research Program; PMS = pavement management system.
where PFR is the predicted faulting corresponding to reliability level R.
PMS Calibrated Reliability Model Validation
To evaluate the PMS calibrated reliability procedure, several groups of PennDOT segments with similar design parameters and locations with 90 or more observations were identified. Performance of these sections was predicted using Pavement ME (PA calibration) with 90% and 95% reliability, and compared with the performance of segments with faulting in the 90th and 95th percentiles, respectively. Figures 10 and 11 present cases with 15 ft and 20 ft joint spacing, respectively. Again, Pavement ME prediction using the current reliability model greatly overpredicts faulting in comparison with field data regardless of traffic level, base type, or joint spacing. Using the PMS calibrated reliability model decreases faulting prediction for high levels of reliability better matching the field data.
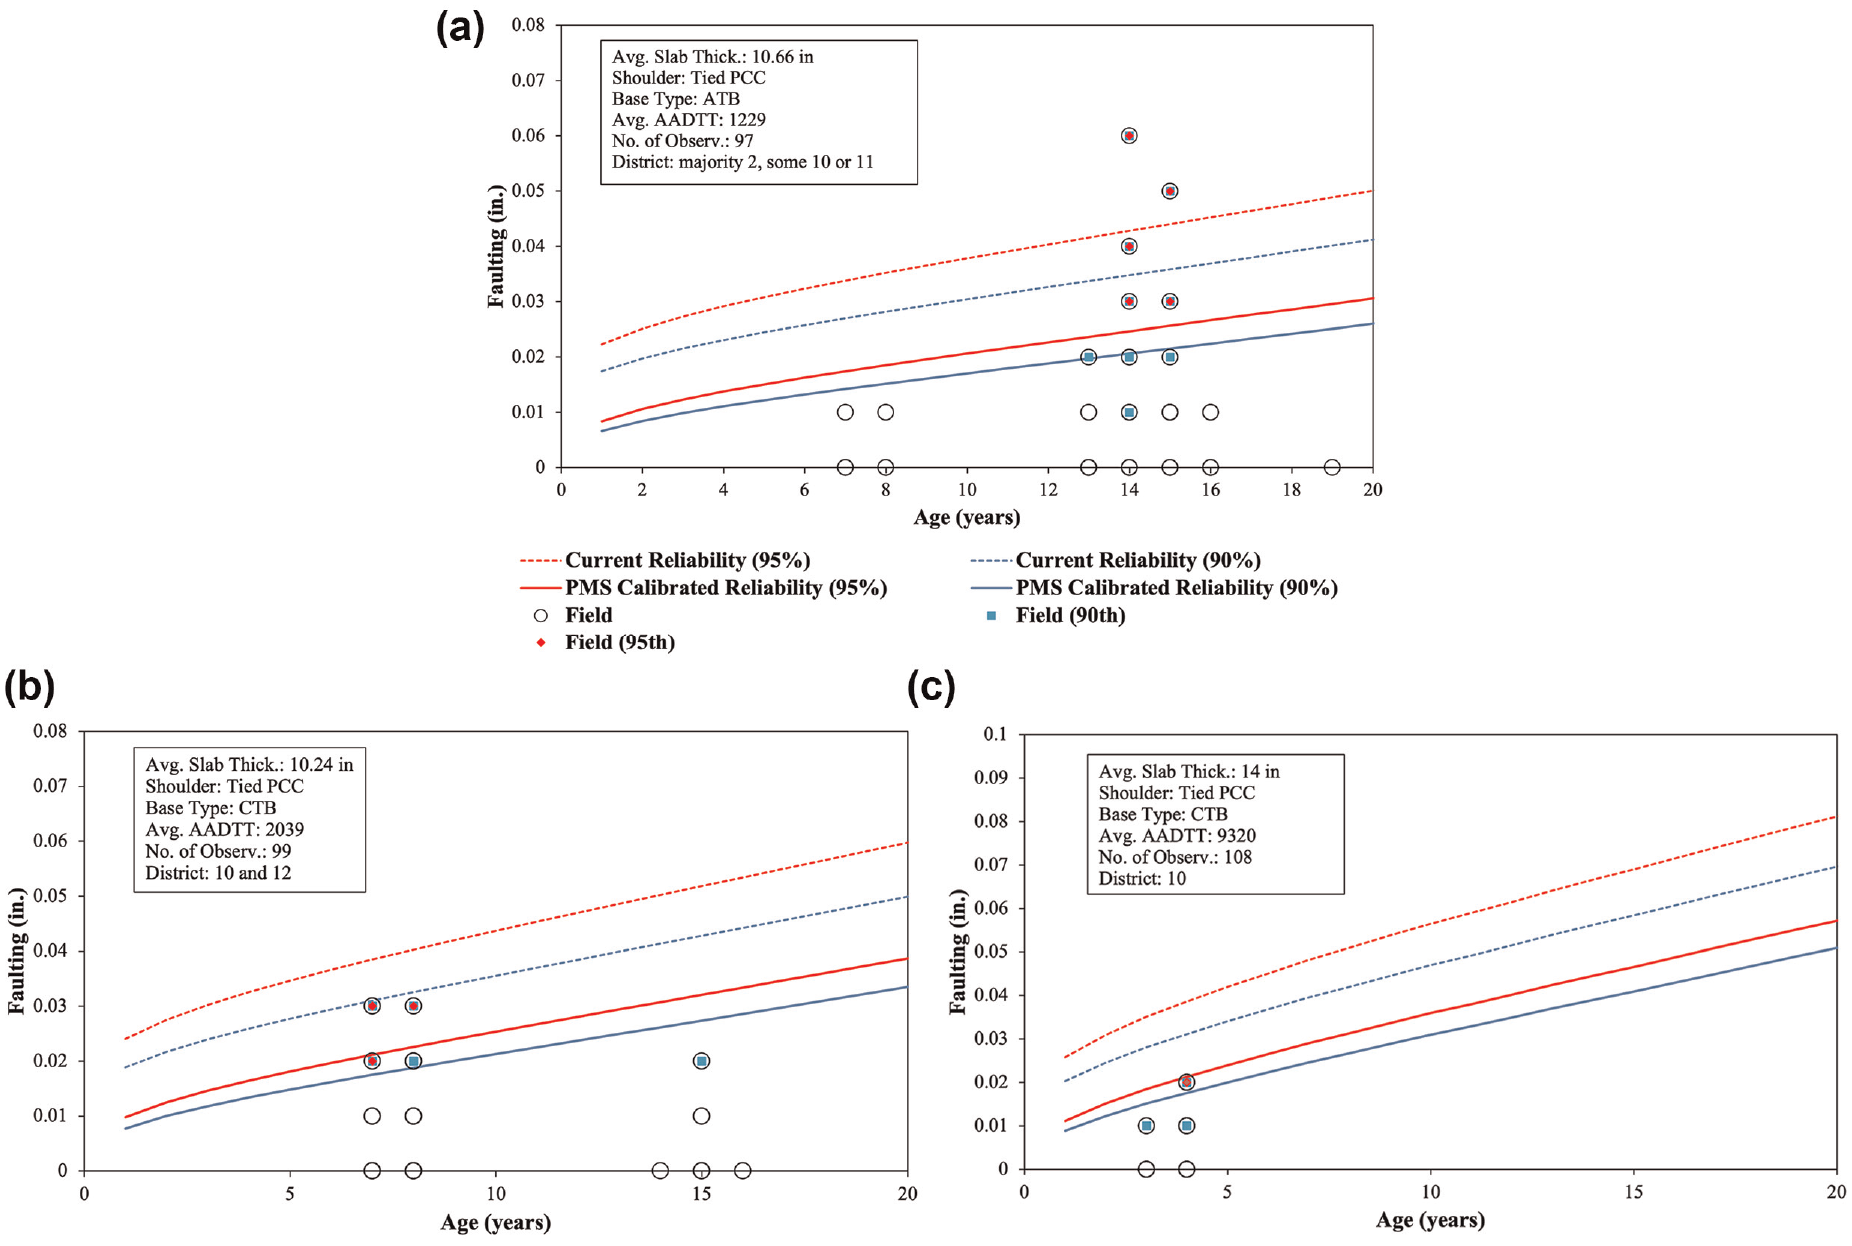
Current (Pavement ME - Pennsylvania calibration) and PMS calibrated reliability evaluation with field data (15 ft joint spacing) for (a) Case 1.1, (b) Case 1.2, and (c) Case 1.3.
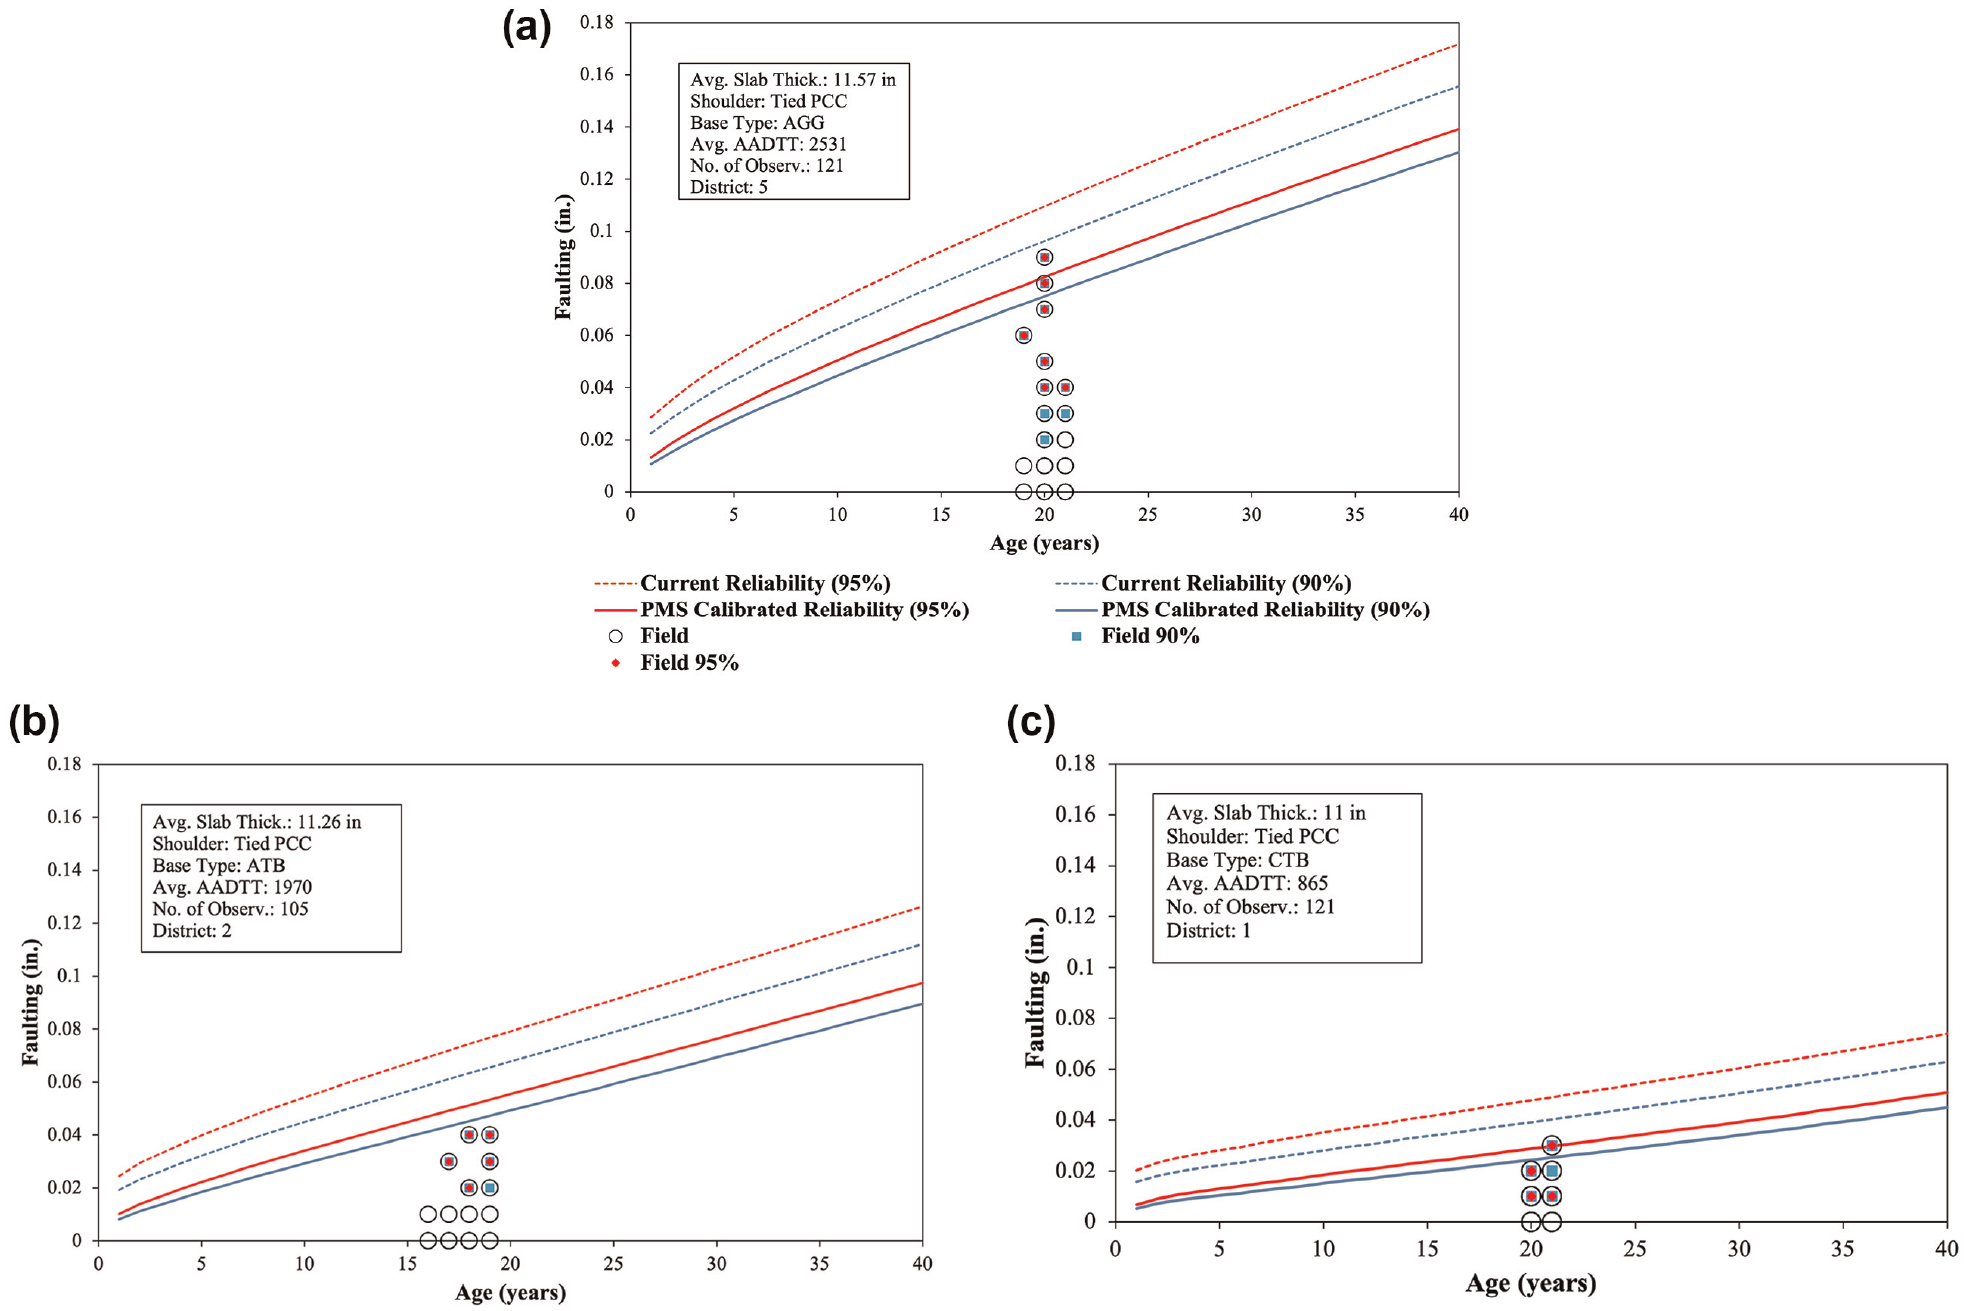
Current (Pavement ME - Pennsylvania calibration) and PMS calibrated reliability evaluation with field data (20 ft joint spacing) for (a) Case 2.1, (b) Case 2.2, and (c) Case 2.3.
Effect of PMS Calibrated Reliability Model on Pavement Design
To illustrate the effect of recalibrated standard deviation on design, a sensitivity analysis was performed for long-term (40 years) JPCP designed with 15 ft joint spacing, CTE of 5 × 10⁻⁶/°F, ATB, and tied PCC shoulders. The structure was subjected to traffic ranging from 100 to 12,000 AADTT with a 3% compound growth. The design assumed cracking and faulting thresholds of 15% of cracked slabs and mean joint faulting of 0.15 in, respectively, with a 95% reliability for both distresses. Pavement ME (PA calibration) simulations were performed for various dowel diameters. Required PCC slab thicknesses were determined to satisfy the cracking performance requirement and required dowel diameters were determined to satisfy the faulting performance requirement for various traffic levels. Results of this analysis are presented in Table 7.
Jointed Plain Concrete Pavement Design Using Current and PMS Calibrated Reliability Models on Pavement ME

Note: AADTT = average annual daily truck traffic; PMS = pavement management system.
Figure 12a presents predicted joint faulting at 95% reliability at the end of the design life for dowel diameters of 1, 1.25 and 1.5 in. and various AADTT levels. It can be observed that the current Pennsylvania reliability model leads to a much more conservative design than the PMS calibrated model. For example, a 1.25 in. dowel meets performance requirements for traffic with initial AADTT less than or equal to 2,000 heavy trucks per day, while the PMS calibrated reliability model predicts that the same dowel size would meet performance criteria for AADTT of up to 4,000 trucks per day. The current Pennsylvania reliability model predicts that conventional dowels can be used for traffic level with an initial AADTT up to 7,000 heavy trucks per day, which corresponds to about 150 million ESALs. However, if the PMS calibrated standard deviation is applied, the project can be designed for up to 11,000 AADTT, or 235 million ESALs.
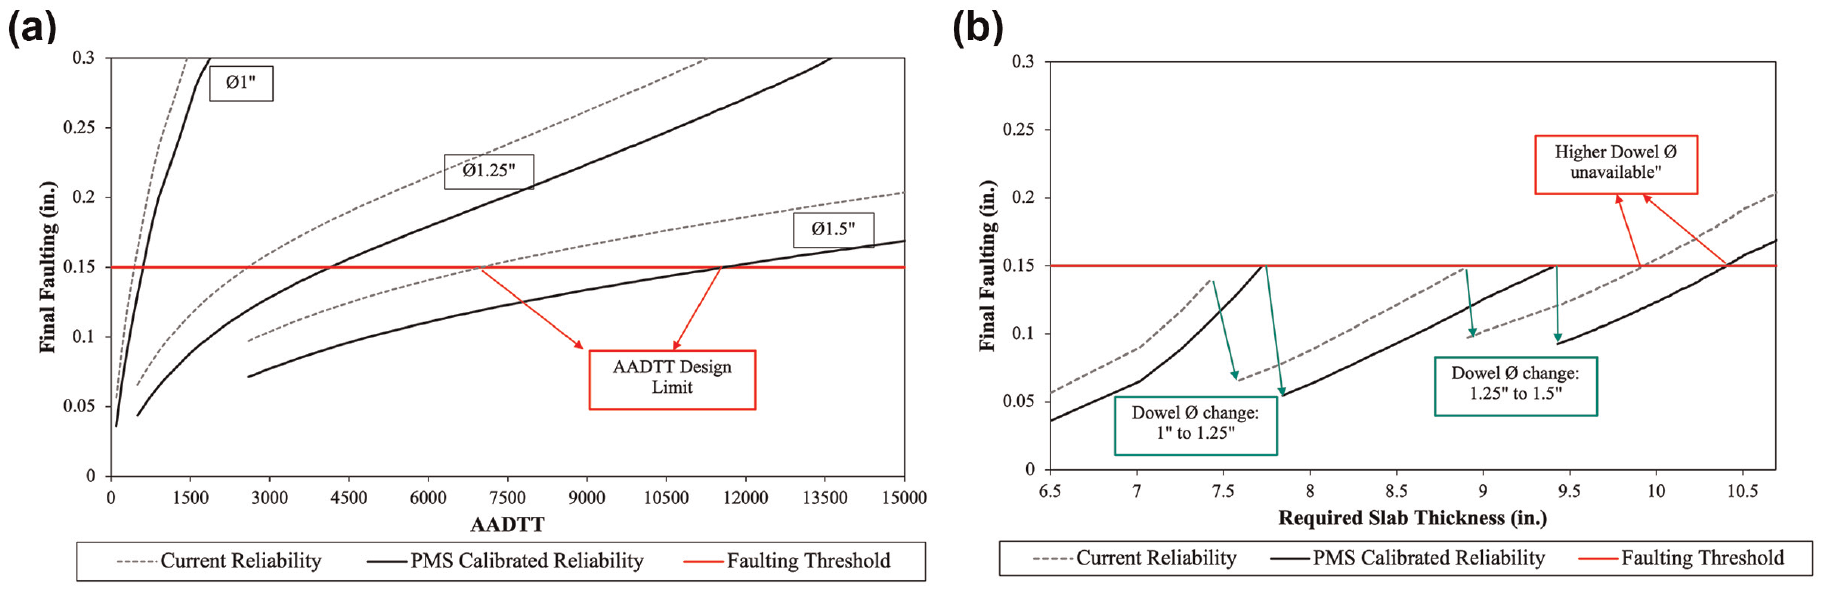
Effect of PMS calibrated reliability model on design reliability regarding (a) traffic and (b) required slab thickness.
Figure 12b presents the results of the same analysis considering predicted faulting against required PCC slab thickness determined for each traffic level (the same traffic levels as in Figure 12a). It can be observed that the current Pennsylvania reliability model requires the use of 1.25 in. dowels for PCC thicknesses between 8 and 9 in., while the modified model requires the use of 1.25 in. dowels for PCC thicknesses between 8 and 9.5 in. The latter recommendation seems more realistic.
Conclusions
This paper presents a modified approach to recalibration of the Pavement ME prediction reliability faulting model. This approach uses a different pavement performance database than the performance database used for the performance model development (full faulting model). The approach was demonstrated using the faulting data from the PennDOT PMS.
Results show that even if PMS data presents higher variability than what is required for a full model calibration, the large amount of data collected makes it an attractive source of information for the reliability model recalibration. Pavement ME faulting modeling along with the PMS calibrated reliability model permits a more accurate faulting prediction for high reliability levels. Improvement of faulting prediction accuracy had a significant impact on JPCP design decisions, especially for design of pavements subjected to high traffic over a long design period.
Footnotes
Acknowledgements
The authors would like to thank Lydia Peddicord, Joshua Freeman, and Shelley Scott from PennDOT for providing information on the collected data, as well as Haoran Li from the University of Pittsburgh for the initial Pavement ME simulations.
Author Contributions
The authors confirm contribution to the paper as follows: study conception and design: L. S. Salles, L. Khazanovich; data collection: L. S. Salles, L. Khazanovich; analysis and interpretation of results: L. S. Salles, L. Khazanovich; draft manuscript preparation: L. S. Salles, L. Khazanovich. All authors reviewed the results and approved the final version of the manuscript.
Declaration of Conflicting Interests
The author(s) declared no potential conflicts of interest with respect to the research, authorship, and/or publication of this article.
Funding
The author(s) disclosed receipt of the following financial support for the research, authorship, and/or publication of this article: This work was supported by PennDOT contract 4400018535, WO1 and by the University of Pittsburgh Anthony Gill Chair.
Data Availability Statement
All the raw PMS data used during the study were provided by PennDOT. Direct request for these materials may be made to the provider as indicated in the Acknowledgments. All models generated or used during the study appear in the submitted article.