



Abstract
With the rapid urbanization of geographical spaces worldwide, pedestrian safety is a major concern on urban roads. In developing economies like India, an unprecedented increase in accidents involving pedestrians has been observed at intersections. The present study focuses on pedestrian behavior, specifically, violation of red signals while crossing at signalized intersections. With the help of hazard-based duration models, the waiting duration of red-light violators has been analyzed. In addition, the response time of pedestrians during conflict has also been modeled with the help of a hazard-based duration approach. Four signalized intersections from Nagpur City in India were selected for the survival analysis. Kaplan–Meier survival curves have been plotted for both waiting time and response time. With the help of the semi-parametric Cox proportional hazard model, various factors have been identified to describe the survival function of the pedestrians’ crossing. However, the model results were found to be unsatisfactory since the explanatory variables failed in the proportional hazard assumption. Therefore, the parametric accelerated failure time model was utilized to determine the various covariates that affected the waiting time and the response time. The Weibull model was found to be the best fit for waiting duration analysis, while the log-logistic model was considered for the study of response time. The developed models can help understand the external factors and personal features of pedestrians in relation to the risk involved during violation crossings.
Pedestrians are considered to be the road users most prone to traffic fatalities because of the lack of physical safety to mitigate the effects of accidents. Globally, pedestrians and cyclists represent 26% of deaths because of accidents among all types of road users ( 1 ). According to an Indian ministry report ( 2 ), in India, motorists accounted for the largest proportion (33%) of casualties among all classes of road users in road mishaps, followed by pedestrians (13.8%) in the year 2017. Usually, collisions take place on roads with multi-directional flow of traffic and mixed proportions of road users. Therefore, intersections (whether controlled or uncontrolled) are considered the most critical elements in any transportation system. In India, the junction points are among the most hazardous accident-prone zones, with 37.8% of recorded accidents all over the country occurring at intersections ( 2 ). When fatalities at intersections are taken into consideration, the risk involved because of assorted pedestrian behavior with vehicle interaction is more complex to analyze, especially conflict situations that occur because of illegal behavior. All these issues have raised interest in the research work required to review pedestrians’ crossing behavior at urban crossing facilities and to investigate the changes in their behavior at intersections under mixed traffic conditions.
The illegal crossing behavior of pedestrians at signalized intersections remains a major concern for transportation professionals in India. To minimize the time they spend waiting at the curb, pedestrians tend to cross in violation of the signals. Focused research is required to examine the waiting duration of pedestrians when they arrive during the red phase. It has been observed that, as the waiting duration increases, larger numbers of pedestrians violate the traffic lights ( 3 ). The time pedestrians are willing to wait is affected by their individual characteristics as well as various external factors at the intersection. The pedestrians’ age, gender, group size, crossing speed, and so forth, affect their waiting time during the red phase. External variables like volumes of motor vehicles and pedestrians, duration of red phase, presence of countdown display, types of vehicles in mixed traffic, and so forth, can influence the propensity of illegal crossing by pedestrians. As the traffic volume of motor vehicles increases, the safe gap for pedestrian street-crossing decreases. In pedestrian–vehicle conflicts, the available gap for pedestrians can be defined as the time difference between two successive vehicles taken from the moment the first vehicle has cleared the conflict area until the second one reaches the conflict area. The safe gap is that period in which pedestrians can cross safely without any conflict with the oncoming vehicle. Some pedestrians would wait for the safe gap, while others may take risks and cross in the red-light period. Consequently, such behaviors may lead to serious conflicts with the vehicles and may cause fatalities in the worst case.
When a pedestrian ceases to wait and starts crossing during the red light phase, they are most likely to be exposed to conflict situations. This conflict is defined as “an event involving two or more road users, in which the action of one user causes the other user to make an evasive maneuver to avoid a collision” ( 4 ). A sudden action (such as stopping or running) taken to avoid the crash consequences is called “evasive action.” A pedestrian takes evasive action when they observe the oncoming conflicting vehicle moving toward them. The time that elapses from the moment the pedestrian looks at the approaching vehicle to the moment they take evasive action is termed the “response time” in this study. The response time can also be understood as the decision time to react to a conflicting situation. This response time will vary from person to person depending on their age and gender, the number of persons crossing together, their crossing speed, and so forth. During an illegal crossing, the response time plays a major role in determining the proximity and severity of the conflict situation. A higher value of the pedestrian’s response time signifies a late response to the conflict situation after observing the vehicle, which may result in severe conflicts with vehicles if the speed of vehicles or/and pedestrians is high.
The present study utilizes the hazard-based duration approach to model the “waiting time” and “response time” of crossing pedestrians. Hazard-based duration models are best suited for modeling the duration data. The main focus of duration models is to examine the occurrence of end-of-duration, given that the duration has lasted for some specified time period ( 5 , 6 ). To take into account the large variability and uncertainties associated with the waiting time and response time, survival analysis has been used in the study. To determine the probability of risk occurrence, the Kaplan–Meier estimation ( 7 ) is used. Further, the Cox proportional hazard and accelerated failure time (AFT) models have been utilized to estimate the effects of the various covariates on “waiting time” and “response time” during the crossing. Covariates, such as traffic-related features and personal characteristics of crossing pedestrians, have been identified for model development.
Literature Review
In the past few decades, various studies have been conducted to analyze the illegal crossing behavior of pedestrians. A significant amount of literature can be found that relates the waiting time of pedestrians with the associated risks during crossing. Various authors have studied the impact of external factors and individual characteristics on pedestrian crossing behavior. One of the earlier works, by Garder ( 8 ), stated that by changing the signal settings, the safety of crossing pedestrians could be affected at signalized crosswalks. The study further suggested that with the increase in vehicular traffic volume, a lower proportion of red-light running was observed. Similarly, the frequency of illegal crossing reduced when the pedestrian volume was high at the intersection ( 9 ). Keegan and O’Mahony ( 10 ) revealed that pedestrians’ crossing behavior was affected by waiting time and travel distance. Many works ( 11 – 15 ) are available that studied the effect of personal characteristics (such as age and gender), group size, personal attitude toward the rules and regulations, volume of pedestrians, vehicular characteristics (such as volume, composition, and speed), waiting duration, weather conditions, land use, and so forth, on the road crossing behavior of pedestrians. Studies have identified that young pedestrians commit more violations than other age groups ( 11 , 16 , 17 ). Fewer violations have been observed when pedestrians are traveling in a group ( 13 , 18 ). Further, it has been established that male pedestrians are more likely to violate traffic signals than female pedestrians ( 11 ). The impact of conformity among pedestrians was studied in relation to road crossing behavior in China ( 15 ).
Several studies have employed hazard-based duration modeling to analyze the waiting duration of pedestrians and the associated risk factors during crossings. Among such works, Hamed ( 19 ) used survival analysis to investigate the factors related to the waiting time of pedestrians. That study found that the waiting time of pedestrians is significantly related to the number of attempts during the crossing. Another work by Tiwari et al. ( 18 ) examined the waiting duration of pedestrians at signalized intersections in New Delhi, India using survival analysis. They estimated the probability of risk exposure while crossing after the end of the waiting duration in the red phase. However, their study did not reflect the effects of various internal and external factors on the risk involved. Guo et al. ( 3 ) modeled the waiting duration of pedestrians at signalized crosswalks in China. They utilized a non-parametric baseline duration model to determine the effects of personal characteristics, traffic conditions, and trip features on the violation behavior of pedestrians. The results suggested that pedestrians are more likely to violate traffic signals if they wait for a longer duration.
The survival models have also found applications in the analysis of the reaction time of vehicle drivers. In a recent study by Pawar and Velaga ( 20 ), the driver’s reaction time (based on the response to an event) was examined with the help of a parametric survival model. The results suggested that the reaction of young drivers was 21% faster than that of mature drivers during the pedestrian crossing event. Several works ( 21 – 23 ) can be found that have examined the reaction time of drivers during sudden and unexpected events under different conditions. Choudhary and Velaga ( 21 ) and Haque and Washington ( 22 ) studied the reaction time of drivers during pedestrian crossing events to investigate the effects of distraction on their driving efficiency Yadav and Velaga ( 23 ) studied the driver’s response time to unexpected events during alcohol-impaired driving. As with the driver’s reaction time, pedestrians also require some specific time to observe an event/object and react to the situation by taking appropriate action while crossing ( 24 ). A “start-up time” of 3 s is recommended for crossing pedestrians at signalized crosswalks ( 25 ). Other studies of signalized intersections showed that male pedestrians needed 2.77 s as perception-reaction time before crossing ( 26 ). Concerning the acceptance of gaps at unsignalized locations, an estimated time of 2.0 s is required for pedestrians to identify and respond to gaps in traffic movement before crossing ( 27 ). Although these studies determined the reaction time of pedestrians while crossing at signalized crosswalks, the effects of internal and external factors on the reaction times of pedestrians were not explored. The present research fills this gap by utilizing the hazard-based duration model to study the the response times of pedestrians during red-light crossing at signalized intersections.
Methodology
General
The waiting durations and response times of crossing pedestrians were modeled with the help of the hazard-based duration approach. Primarily, a non-parametric hazard model was applied to acquire the estimated survival probability of duration data using the Kaplan–Meier survival curve. Further, to establish the relationship of various covariates with the duration data, the semi-parametric model, known as the Cox proportional hazard model, was developed. To verify the proportionality assumptions of this model, the log-log survival curves of all the individual parameters were drawn. Following the failure of the proportionality assumptions, the parametric AFT method (exponential, Weibull, log-normal, and log-logistic) was formed to statistically select the best suited model that demonstrates the designated risk related to each parameter. An overview of the study methodology is shown in Figure 1.
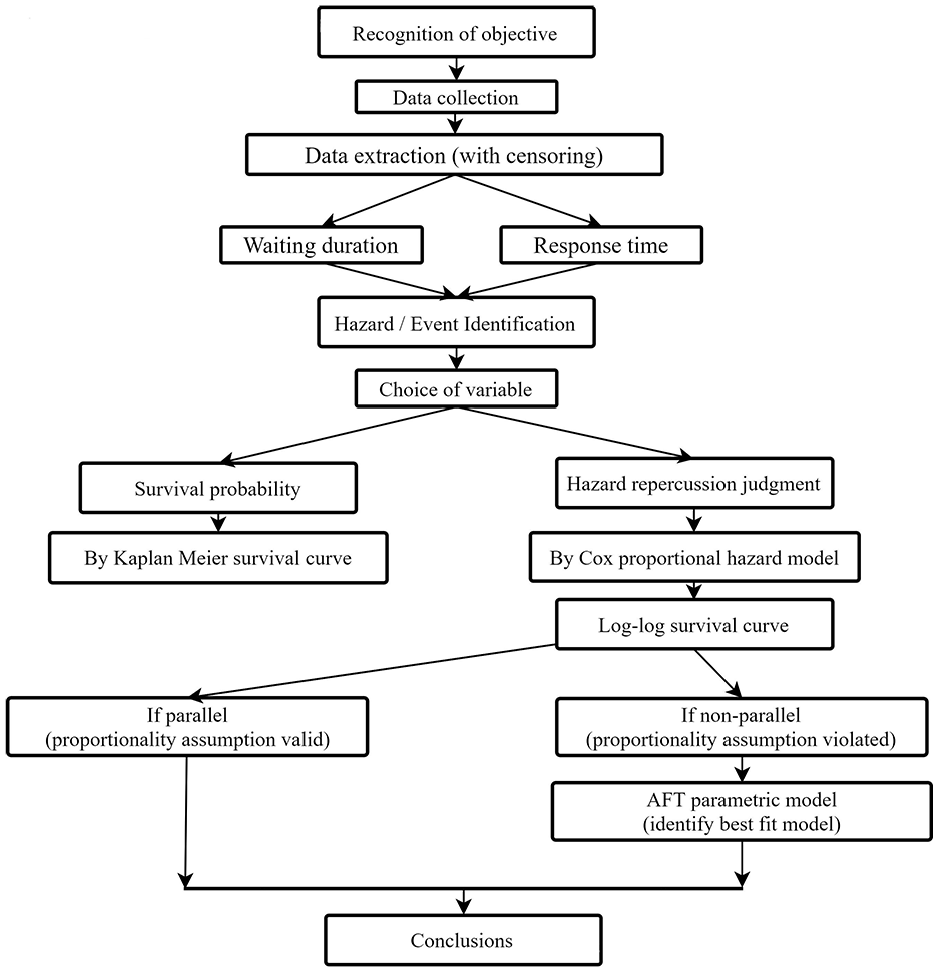
Flow chart of study methodology.
Survival Analysis
Let T be a non-negative continuous random variable that represents the survival time of an event (such as waiting duration or response time) with cumulative distribution function F(t) and probability density function f(t). F(t) is the probability that an event is completed before time t. The survival function, S(t), can be defined as the probability that the event duration is greater than or equal to a specified time t. The hazard function, h(t), is defined as the instantaneous probability per unit time that the event occurs at time t, given that the event is yet to occur ( 28 ).




The survival data is recorded in binary form, as shown below:

Non-Parametric Hazard Model
Survival estimation is precisely computed by the Kaplan–Meier method (
7
). This is a non-parametric model that involves the product limit of conditional probability for estimating the approximated survival function (
3
). The general formula for a Kaplan–Meier survival probability curve where

The Kaplan–Meier curves are typically plotted as a step function with the starting point of the curve being one, because there is 100% survival at the beginning of the study, and it steps down with decreasing survival probability to zero at the end.
Cox Proportional Hazard Model
The limitation of the non-parametric model is fulfilled by a semi-parametric and fully-parametric model to obtain the impact rate of certain events occurring at specific variations of time. The Cox proportional hazard model ( 29 ) is expressed in relation to the hazard model formula given below:

X = explanatory/predictor variables
β = a measure of the effects of covariates (coefficient).
The Cox proportional hazard model formula is represented in the multiplication of two terms, where the first term

The hazard ratio (HR) is interpreted as:
HR = 1: No effect
HR < 1: Reduction in the hazard
HR > 1: Increase in hazard
Proportionality Hazards Assumption
The proportionality hazard assumption of the hazard ratio being constant, that is, the ratio of hazard function of one variable to other variables being constant over time, is validated by comparing the log-log survival curves of the covariates. It is also a step function similar to the usual survival curve.

Solving algebraically for first and second log in the Cox proportional hazard model, the expression can be written in the form of the addition of two terms, that is, a linear summation of


When these functions are used to plot log-log curves for each covariate on the same graph, the curves should be parallel to each other, which provides the information of constant vertical distance. The parallel plots show that the hazard is constant over time for the given set of variables, and thus the proportionality theorem is valid, or else it is violated ( 30 ).
Parametric AFT Model
A parametric hazard model assumes that the survival event follows a known distribution. As the proportional hazard assumptions are violated, the AFT model can be used for further analysis. The AFT model assumes that the influence of the parameters is multiplicative, say
Survival and Hazard Functions of Different Distributions

Weibull AFT Model
The probability density function of the Weibull AFT model is expressed by three parameters: shape parameter (

If the values of µ = 0, it is called a two-parameter Weibull distribution, reduced as:

While parameterizing, the shape parameter remains the same but scale parameter α



This model holds a unique property that, if the model satisfies AFT assumptions, then it will also satisfy proportional hazard assumptions, but only when the
Log-Logistic AFT Model
When a logarithm of any random variable T is logistically distributed then, T is stated as log-logistically distributed (
33
). In survival analysis, log-logistic distribution follows AFT assumptions but not proportional hazard assumptions; in fact, it is a proportional odds model that assumes that the survival odds ratio will remain constant. Survival odds is defined as the odds of surviving even after time

while parameterizing, scale parameter α =1/λ




Model Estimation of Goodness of Fit
This present study uses the three most commonly used evaluating criteria in parametric survival analysis: likelihood ratio test, Akaike information criterion ( 31 ), and Bayesian information criterion ( 34 ). The calculated values are compared to reach a suitable parametric distribution.
Likelihood Ratio Test
The likelihood ratio is estimated by calculating the ratio of likelihoods of the statistical model. This is represented by the following equation:

where
Akaike Information Criterion (AIC)
AIC gives an estimated value by comparing overestimation and underestimation, which is represented in the equation below:

where P is the number of parameters, and K is the number of coefficients (excluding constant) in the model. While developing a model, it loses some of the information in the statistical process. Thus, it can be said that, as less information is lost, the more suitable the model is. In other words, the lower value of AIC represents the best fit model.
Bayesian Information Criterion (BIC)
BIC is a criterion functioning in a similar way to AIC, that is, best model selection for the large number of data set, and is expressed as follows:

where P is the number of parameters in the distribution, K is the number of coefficients, and n is the number of observations. Similar to AIC, goodness of fit is represented by the lower BIC value.
Site Selection and Data Collection
Four signalized intersections were selected from Nagpur City in India. All these study sites were located in one of the busiest urban belts of the city. The sites were selected for the study because they experience high levels of pedestrian signal violations and busy traffic movements during peak hours. Moreover, the crash data collected from the nearest police station suggested a significant number of pedestrian crashes at these locations. The selected sites were located in a mixed land use area, consisting of residential buildings along with commercial complexes. All the intersections were four-legged, with each leg having two-lane, two-way traffic movements. One of the four legs was selected for the study of pedestrian signal violation crossings. In each case, the crosswalk was designated with proper markings with good visibility. The camera view of the Panchsheel intersection is shown in Figure 2.

A view of Panchsheel intersection, Nagpur.
The selected intersections all featured a signal traffic control system with free-left turns. It should be noted that Indian roads have a left-hand driving system, in contrast to that of the driving patterns in other countries like the U.S.A. Therefore, the movements of left-turning vehicles are generally kept free of signals at signalized intersections in India. The movements of vehicular traffic and pedestrians at the intersections were recorded with the help of two high definition video cameras installed near one of the crosswalks selected for the study. One camera was mounted on a high rise building to capture the crossing patterns of pedestrians and their interaction with the vehicles. Another camera was installed adjacent to the crosswalk, allowing it to capture the personal features of the pedestrians like age, gender, crossing with belongings, and so forth. Both cameras were synchronized with common time frames so that there was no mismatch of time durations in the recorded videos. The video recording was done for 4 h in a day: 2 h in the morning (9:00–11:00 a.m.) and 2 h in the evening (4:00–6:00 p.m.). The data were collected on a weekday with good weather conditions in October 2019. The features of the selected intersections are shown in Table 2.
Features of the Study Sites

For the extraction of traffic data from the recorded video, three teams of observers were employed in the laboratory. Each team consisted of two members—one for the observation of various features of pedestrians and vehicles and another for data entry. To estimate the waiting duration of pedestrians at the curb, their arrival time was noted along with the time they left the curb for crossing. For the estimation of the response time of pedestrians during conflict situations, careful observation was made to detect the actions of pedestrians while crossing. A pedestrian’s first action was observed at the time they looked at the conflicting vehicle. For this, the neck/head movement of the pedestrian was detected before they took evasive action. The next action of the pedestrian was identified at the time of sudden action taken. This action is considered as the response of the pedestrian toward the conflict situation. The pedestrian may suddenly stop, slow down, or accelerate depending on the conflict situation. Therefore, the response time was estimated as the difference between the moment the pedestrian observed the vehicle and the moment they took evasive action. All three teams made careful observations for the identification/detection of these actions taken by the road user. Each team independently observed the recorded videos, extracted the required data, and checked the discrepancies in the datasheet. In case of any kind of confusion in relation to the actions of pedestrians, such as head movement or evasive action taken, each team verified the recorded video by replaying it and finally confirmed the various time stamps. The time stamps were obtained with the help of Kinovea Software, which had an accuracy level of 0.001 s.
Descriptive Statistics
A total of 2,563 pedestrians arrived at the intersections during the study period. Among them, 1,772 arrived in the red phase. Out of those who arrived during the red light, 1,177 pedestrians (66.42%) did not wait for the green light and crossed on red. The mean waiting time of pedestrians was 6.04 s, with 10.64 s as the standard deviation. The maximum waiting time observed was 80.25 s, and the minimum waiting duration was 0.89 s. Among the violating pedestrians, 789 (69.76%) faced conflict situations, and their response time was recorded. The mean and standard deviation of the response time data were found to be 0.951 s and 0.403 s, respectively. The maximum response time was 1.685 s, while 0.312 s was observed as the minimum value. The descriptive statistics of other variables observed for survival models are shown in Table 3.
Description of the Variables Observed

Analysis and Results
Kaplan–Meier Analysis for Waiting Time
When the pedestrian ceases the waiting time during the red phase and starts crossing, it is considered as a risk-taking action. Pedestrians who ceased their waiting during the red light were considered in the Kaplan–Meier analysis for the study, whereas those ending their waiting duration during the green light are censored. The Kaplan–Meier curve produced in the statistical software R is shown in Figure 3. The censoring variable is a binary indicator of the event, coded as “0” for pedestrians whose actual waiting time is unknown, that is, censored, and “1” for the pedestrians that are likely to be in danger. The time coordinate of the survival plot is the time interval of waiting time, and Kaplan–Meier probability or survival probability is the probability of complying with the traffic rules while waiting at the crosswalk.

Kaplan–Meier curve for the waiting time of pedestrians.
The estimated survival probability of elapsed waiting time follows a trend similar to that in Tiwari et al. ( 18 ) and Guo et al. ( 3 ), that is, a decreasing pattern of survival curve with the increase in waiting time. In the beginning, the curve declines steeply for a small increase in waiting duration of 3 s, which indicates that a considerable number of risk-taking pedestrians would cross immediately by decreasing the survival probability from 1 to 0.65. Then, the gradual reduction in the probability corresponding to the increase in waiting duration from 3 s to 32 s can be observed in the survival curve. This indicates that the remaining pedestrians have an endurance limit of less than 32 s. The gradual reduction in survival reflects that the number of pedestrian violations is increasing continuously. In the end, the decreasing probability for waiting time demonstrates that very few pedestrians are observed to be waiting after 32 s for safe crossing. The general downward movement of the cumulative survival curve provides evidence of the time-dependent crossing behavior of pedestrians.
Kaplan–Meier Analysis for Response Time
The event of interest is analyzed using the Kaplan–Meier survival curve (Figure 4), where the pedestrians who responded to the conflict situation by taking an evasive action are categorized as uncensored data (event = 1). The pedestrians who changed their direction or reverted to the curb after observing the conflicting vehicle are censored (event = 0). The curve shows a negligible change in the endurance probability up to 0.51 s of response time. A gradual declination is observed in the curve after 0.51 s and up to 1.2 s. This shows distracted behavior toward traffic movements, and therefore the survival of pedestrians decreases from 97% to 40% in such a small duration of response time.

Kaplan–Meier curve for the response time of pedestrians.
Cox Proportional Hazard Model
In the Cox proportional hazard model, the influences of covariates are provided in the multiplicative radical on the hazard function. A covariate with a negative coefficient implies that the hazard will show reduction because of the increase in the corresponding covariate, and thus waiting time/response time will eventually increase. The results of the Cox proportional hazard model are shown in Table 4.
Cox Proportional Hazard Analysis for Waiting Time and Response Time

The significance level corresponding to each covariate is given in Table 4 with corresponding hazard ratios. The acceptable level of significance considered for the model is p < 0.05. For a better interpretation of results, the validation of proportionality assumptions is necessary to ensure constant hazard over time. The model results for the waiting duration suggest that the age of pedestrian, group size, pedestrian with belongings, and the volume of pedestrians are significant. The model results for response time suggest that age of pedestrian, speed of pedestrian, duration of red phase, pedestrians per cycle, and vehicles per cycle are significant.
Graphical Check for Proportional Hazard Assumption
The most commonly used method for checking proportional hazard assumptions is a graphical technique in which log-log survivor curves of the categories of each variable are plotted, as shown in Figures 5 and 6. A log-log survival curve is a transformation of an estimated survival curve, that derives from taking the natural log of the survival probability twice. As depicted in the figures, these plots yield the intersecting curve for all classes of variables accounted for in examining the proportionality. Therefore the proportionality assumption is violated; thus, the hazard for the listed data is not constant over time. Because of the non-parallel curves, further investigation is required to analyze the data through particular distributions.

Log-log survival curves for different categorical variables for waiting time: (a) age, (b) gender, (c) belongings, (d) group.
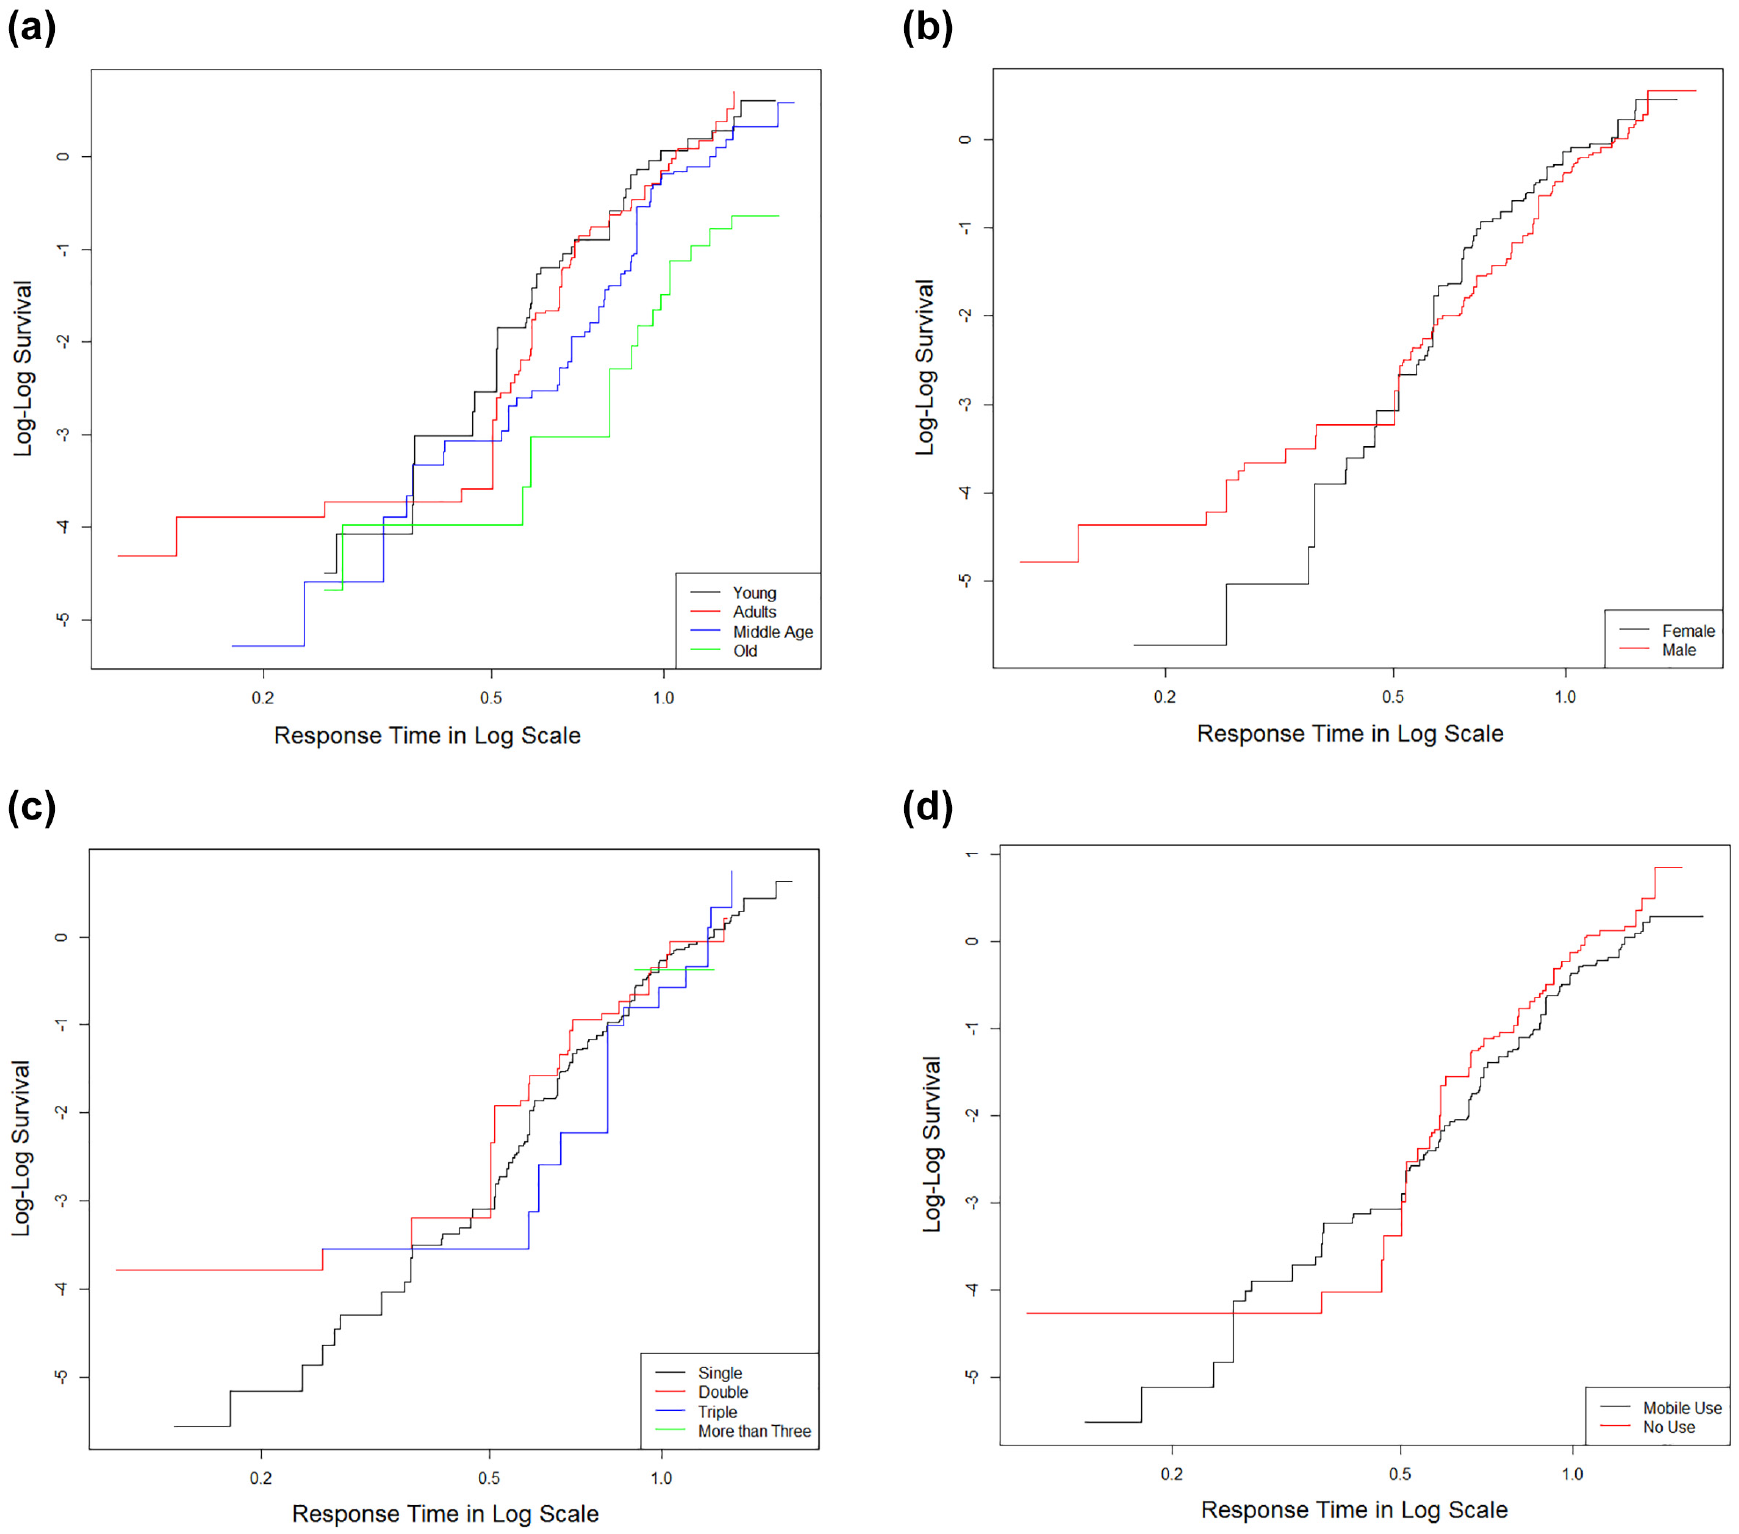
Log-log survival curves for different categorical variables for response time: (a) age, (b) gender, (c) group, (d) mobile phone use.
Parametric AFT Model
When proportional hazard assumptions are violated, the results of the proportional hazard models are not found to be satisfactory. Therefore, parametric AFT models are utilized in this study for a better interpretation of results. AFT models produce results in the form of an acceleration factor, which directly interprets the changes in survival rates because of changes in parameters. The fitness of data is evaluated through AFT models with the help of exponential AFT, Weibull AFT, log-normal AFT, and log-logistic AFT distributions. The relevance of exploratory variables is enumerated in the form of the acceleration factor, and the coefficient provides the change in duration because of change in parameters. The percentage change in survival because of the unit change in covariates is formularized as:

The coefficient with a positive sign confirms the increase in survival time with a unit increase in parameters of waiting duration and response time. The comparison of the parametric AFT distribution models is made based on three criteria, that is, likelihood ratio test and AIC and BIC values, which are shown in Table 5. The best fit model is selected based on minimum AIC and BIC values and the maximum log-likelihood ratio. The results suggested that the Weibull model is the best fit for waiting time analysis, and the log-logistic model is found to be appropriate for response time analysis. The model results are described in the following paragraphs. Table 6 shows the estimated results of both the models, that is, Weibull and log-logistic for waiting time and response time, respectively.
Goodness of Fit of Different Models

Note: DOF = degree of freedom; AFT = accelerated failure time; AIC = Akaike information criterion; BIC = Bayesian information criterion.
Estimated Results of the Duration Models for (a) Waiting Time and (b) Response Time

Model Results for Waiting Time
The results indicate that older pedestrians are less likely to take risks in crossing. As the crossing speed of elderly pedestrians is comparatively slow, they cannot take advantage of gap opportunities; therefore the survival probability increases by 29.8% per unit increase in age group. In contrast, the younger pedestrians are observed to be high risk-taking pedestrians, similar to the results attained by Yang et al. ( 35 ).
Although the gender of pedestrians has come out as insignificant in the model, it can still be stated that survival for females is equal to 0.887 times the survival for males.
The presence of other pedestrians at the intersection has a positive influence on waiting behavior and increases the waiting probability by 34%.
Persons with no belongings were found to be more impatient and committed 17.3% more violations than the people with mobiles and other accessories.
The pedestrian volume was also found to be significant in the model. The results indicated that the survival rate of red-light violators decreased by 5% when the number of pedestrians waiting on arrival increased by one unit.
Although the duration of the red phase and vehicle volumes represents an important parameter, their influence was comparatively low at the study sites as the acceleration factor is very close to unity.
Model Results for Response Time
Similar to the findings on waiting duration, younger pedestrians are more likely to take risks while crossing. The survival rate increases by 15.3% as the age group varies by one unit increase.
Gender has not been found to be significant in the response time model.
An increase in the pedestrian speed by one unit causes a 15% decrease in the survival rate. This signifies that the response time of pedestrians increases as the speed of pedestrians increases, and therefore more risk is observed during the conflict.
Increase in the number of pedestrians per cycle decreases the response time and increases the survival probability by 3.4%.
Although the vehicle volume was found to be significant in the model, the acceleration factor did not produce any appreciable effect for determining the significant changes because of vehicle volume.
Parameters like group size, mobile usage, duration of red phase, crosswalk, and waiting time were not found to be associated with the survival probability.
Conclusions
The study used a hazard-based duration approach to model two durations, namely, the waiting time of pedestrians on arrival and the response time of pedestrians when caught in conflict. Both of these durations have a significant role in determining the risk involved during signal violation crossing. When the pedestrian ends their waiting duration in the red phase, their risk of being involved in a conflict situation increases. Once they start crossing in red, the amount of time that elapses in detecting the conflicting vehicle and finally showing some response to the situation determines the severity of the resulting conflicts. In the study, the waiting duration of the pedestrians who crossed legally was considered as censored data, while the waiting duration of red-light violators was recorded as uncensored data. Similarly, if the pedestrian took evasive action during the conflict, the response time was considered as uncensored data. Whereas the response time of those pedestrians who reverted back or changed their crossing direction was called censored data.
Behavioral features of crossing pedestrians are correlated with their survival probability using the Kaplan–Meier curve, which provides crucial information about the duration being studied. From the survival curve for waiting duration, it was observed that the initial waiting duration of 0–32 s represents the most critical period that causes the maximum violation, in which about 60% of pedestrians are the immediate violators. This information can be used when designing the signal timings at an intersection so as to ensure the minimum possible waiting duration of pedestrians. The survival curve for response time showed that, during the initial 0.51 s, there was a minimal decrease in the survival probability. This suggests that lower risk is related to the quick responding pedestrians as endurance probability is negligibly decreased with the varying response time. The gradual decline in the curve from 0.51 s to 1.2 s shows that if the pedestrian takes a longer time to react to a hazardous situation, their chances of conflict with the vehicles increase. This finding will open the gates for further study on pedestrians’ response times during crossing and may aid in a more detailed analysis of traffic conflicts.
Since the assumptions of the Cox proportional hazard model could not be validated, the AFT model was used to identify the effects of internal and external covariates on the risk related to waiting time and response time of pedestrians. The Weibull and log-logistic models were utilized for determining the effects of the covariates on the risk associated with waiting time and response time, respectively. The outcomes of the Weibull AFT model suggested that age, group size, possession of belongings, and pedestrian volume have a significant impact on the waiting duration of pedestrians. Further, the results of the log-logistic model revealed that pedestrian’s age, crossing speed, pedestrian volume, and vehicular volume affected the response time of pedestrians during the conflict. Since intersections in India experience a huge number of crossing violations by pedestrians, these findings can help to investigate the risk involved during crossing. The factors affecting the response time of pedestrians during the conflict situation can help to understand the causes of the violation induced accidents at the intersections.
All the above findings suggest the need to study the critical durations (such as waiting time and response time of pedestrians) when formulating manageable ways to resolve the issues of illegal pedestrian behavior. In addition, popular awareness in relation to the importance of signal compliance can resolve the safety issues at the intersections. The majority of the population in India remains uninformed of special provisions for pedestrians, such as exclusive pedestrian signals and pedestrian crosswalks. Media campaigns, advertisements through posters and hoardings, and instructions by traffic police, can help to educate the population in relation to the traffic facilities and their uses. Although “crosswalk use” was not found to be significant in the duration model, this factor remains essential in the Indian context as many pedestrians do not use the crosswalk while crossing. There is a need for strict enforcement of rules by traffic police to check the illegal crossings.
The current study was conducted only at four sites of an Indian city, and therefore the results are limited to specific sites. The study can be further extended to larger numbers of intersections in other cities so that the findings have greater applicability. Also, other parameters (such as pedestrian green time, conflicting vehicle type and speed, etc.) affecting pedestrian behavior that were beyond the scope of the current study can be addressed in future analysis. A comparative study of waiting duration at compact and wide intersections could help to understand the behavioral characteristics of pedestrians better. In this study, the response time of pedestrians was estimated by manual observations from recorded video. However, some other automatic methods using image processing techniques could provide accurate data of such complicated behaviors of pedestrians.
Footnotes
Author Contributions
The authors confirm contribution to the paper as follows: study conception and design: Apurwa Dhoke, Abhinav Kumar, Indrajit Ghosh; data collection: Apurwa Dhoke; analysis and interpretation of results: Apurwa Dhoke, Abhinav Kumar, Indrajit Ghosh; draft manuscript preparation: Apurwa Dhoke, Abhinav Kumar, Indrajit Ghosh. All authors reviewed the results and approved the final version of the manuscript.
Declaration of Conflicting Interests
The author(s) declared no potential conflicts of interest with respect to the research, authorship, and/or publication of this article.
Funding
The author(s) received no financial support for the research, authorship, and/or publication of this article.