



Abstract
Rural four-lane roadways provide important transportation accessibility and mobility to populations in rural areas. It is a challenge for practitioners to determine cross-section types when both benefits and costs need to be considered. Crash Modification Factors (CMFs) are developed to evaluate the safety effectiveness of alternative designs. However, safety effectiveness could vary significantly across contexts. Thus, this study aims to estimate CMFs for alternative cross sections of rural four-lane roadways under different contexts characterized by traffic volume, truck percentage, and access point density. Using Georgia state-wide crash data, this study developed Safety Performance Functions (SPFs) to predict crash frequencies for different contexts. Considering linearity and independence assumptions of traditional negative binomial SPFs, this study adopts Bayesian generalized negative binomial modeling approaches to relax those assumptions and only follows the Bayes rule to form SPFs for CMF estimation. This study focuses on four typical cross-sections including: (1) non-traversable medians; (2) two-way-left-turn lanes; (3) 4-ft flush medians; and (4) undivided roadways with double-yellow lines (the base cross-section design). The results show that CMFs vary significantly across different contexts. Compared with the base cross-section design, safety benefits of the other three designs can be either positive or negative under different traffic or road conditions. For example, 4-ft flush medians are found to have positive safety benefits (CMF < 1) under lower average daily traffic volumes (e.g., ≤ 6,000) and negative benefits (CMF > 1) under greater average daily traffic volumes (e.g., ≥ 15,000). The findings suggest that, to enhance roadway safety, practitioners should vary cross-section designs for different rural contexts.
Medians are important roadway cross-section design elements and they have significant impacts on safety performance, roadway functions, and the efficiency of a highway ( 1 ). They provide separation of opposing traffic and, more importantly, certain median types provide added safety buffers and recovery areas for turning movements. Compared with rural two-lane highways, rural four-lane highways provide greater travel speeds and safety benefits. Council and Stewart ( 2 ) found that crash reduction rates of rural divided four-lane segments could be as large as 60% compared with two-lane roadways.
In evaluating the safety effectiveness of a countermeasure on roads, we often face challenges in developing CMFs that are used by many ( 3 – 7 ). First, Crash Modification Factors (CMFs) are likely to vary across different roadway contexts (e.g., traffic volumes, access points), indicating that safety effectiveness of a roadway median treatment is likely to vary under different situations. Thus, roadway contexts need to be specified for CMF estimations. Second, the limited data environment (rural four-lane) does not provide sufficient observations for a complete picture of the contexts. Thus, the CMFs are indirectly estimated based on observed safety performance using the predicted crash frequency based on developed Safety Performance Functions (SPFs). The Highway Safety Manual (HSM) provides base SPFs for evaluating safety performance of rural multilane segments. However, these SPFs are not able to capture variations across different jurisdictions because of limited usefulness and local inventory data. Mehta and Lou ( 4 ) found HSM base SPFs underestimated crash frequency for rural four-lane divided highways in Alabama, and the underestimation was as high as 48% and 64% for total crashes on divided and undivided segments, respectively. Similarly, overestimation could be as high as 50% and 65% for fatal and injury crashes, respectively ( 5 ). Therefore, as indicated by HSM ( 8 ), base SPFs need to be calibrated and modified if they are to be applied for different jurisdictions. Three methods can be adopted including: (1) using base HSM SPFs together with calibration factors that apply HSM suggested parameters for local roadway geometrics and traffic volumes; (2) modifying and replacing selected default parameters if data to support all replacements are not possible; (3) developing jurisdiction-specific SPFs with available data. This paper adopts the third method to develop local SPFs by using the available data. However, the third challenge for CMF estimation using jurisdiction-specific SPFs is that traditional Poisson or negative binomial (NB) regression models always require several assumptions (e.g., linearity, independence of individual observations, multiplicative effects of independent variables) and the model results are heavily dependent on whether the assumptions required by the model are met. On the contrary, the Bayesian-based NB approach relaxes those assumptions rooted in traditional NB regression models ( 9 ). Considering these issues embedded in the traditional NB SPF development method, the Bayesian approach is preferred to avoid such issues while developing the SPFs for CMF estimation.
Given the foregoing challenges, a complete safety effectiveness evaluation of rural four-lane highways with different median types based on CMF estimations is desired for decision-making on cross-section types when state agencies and practitioners need to consider both benefits and costs. Benefits and costs were seldom considered in earlier studies. Median design specifications are detailed in various highway design manuals for rural four-lane segments ( 1 , 10 , 11 ). Undivided segments are rarely designed for rural highway segments in most of the states ( 12 ). Flush medians (within 3–5 ft) are recommended in situations where the location and spacing of driveways allow left-turn bays at every driveway to promote uniform traffic flow. Two-way-left-turn lanes (TWLTLs) are recommended when median openings at every driveway are not possible ( 13 ). TWLTLs provide flexibility allowing left turns to adjacent roadway properties. If there is an operational or safety need to prevent left turns crossing medians, physical barriers (e.g., non-traversable raised or depressed median islands, rigid barriers) are recommended. These help reduce median-related crashes ( 13 ). Safety performance among those median types shows that crash rates on undivided segments were much higher (almost three times) than those of divided segments ( 12 , 14 ). However, we need to carefully examine the safety benefits of these median types because benefits may vary significantly across contexts (e.g., average annual daily traffic [AADT], truck percentage, and access point density).
Therefore, the objective of this study is to estimate context-based CMFs for medians on rural four-lane roadways using a Bayesian-based approach. Specifically, the contexts are specified by traffic volumes, truck percentage, and access point density given the data availability. By demonstrating the proposed method to qualify the CMFs for various conditions, we expect the study outcomes to help infrastructure decision makers determine better median treatments for rural four-lane roadway when investing their assets. Furthermore, the findings would potentially offer safety practitioners insights that, when developing or implementing countermeasures, they need to consider when safety effectiveness is not constant across various roadway contexts.
Literature Review
Studies that focused on rural four-lane roadway segments have explored a range of factors associated with crash frequency. These factors include but are not limited to: AADT, segment length, median type/width, undrivable-narrow medians, driveway density, lane/shoulder width, longitudinal slopes, presence of junctions, pavement surface, urban/rural, and truck percentage ( 15 – 24 ). Qu et al. ( 19 ) recently found that TWLTLs had significantly higher crash frequencies than raised median segments along Texas urban arterials. Flush medians with rumble strips or chatter bars were found to be the safest medians in reducing crashes, followed by raised medians and undivided segments ( 25 ). Fitzpatrick and Balke ( 13 ) investigated three median types: raised or depressed, TWLTL, and 4-ft flush medians. They recommended TWLTLs and raised or depressed medians on rural four-lane highways. No statistically significant differences were found between TWLTLs and 4-ft flush medians because the meaning of 4-ft flush median markings was often ignored by Texas drivers ( 13 ). In the same year, Hadi et al. ( 17 ) stated that raised medians were safer than TWLTLs on four-lane highways. In 2008, Fitzpatrick further evaluated the positive effects of rigid median barriers on crash frequency ( 3 ). Besides median types, higher AADT, longer segment length, and greater density of driveways, sharp horizontal curves were found associated with increased crash frequencies ( 2 , 4 – 7 , 14 , 15 , 19 – 22 , 24 – 28 ). However, if truck percentages were investigated, the results did not provide a conclusion about the relationships with crash frequency. For example, negative correlations were found in Liu et al., while Qu et al. found the relationships to be positive on Texas urban arterials ( 19 , 21 ). Similarly, varying correlations (both positive and negative) were found for different speed limits ( 5 , 6 , 20 , 21 , 25 , 27 ). Other roadway geometric and traffic characteristics associated with increased crash frequency include cross-section slope, traffic conflicts, horizontal and vertical alignments, curve density, motorcycle percent, and reduced travel time gap ( 15 , 18 , 26 ). Factors found to have benefits in decreasing crash frequency include left-turn lanes, greater lane/median width, larger left and right shoulder width, lighting, greater longitudinal slope, side friction, longer stopping sight distance, guardrail, and access control ( 2 , 7 , 15 , 17 , 20 , 22 , 23 , 29 ).
In measuring the safety effectiveness of countermeasures/treatment, CMFs are often suggested by HSM and other researchers ( 4 – 6 , 10 ). In most before-after studies on roadway treatments, CMFs were used to directly capture the safety implications. In cross-sectional observational studies (such as this study), CMFs are estimated to only represent correlations instead of causal relationships. HSM suggests using a before-after study approach to estimate CMFs with available roadway geometric data (e.g., shoulder width, vertical grade) ( 8 ); however, under a data-limited environment, when before-after studies are not feasible, CMFs are often estimated with a cross-sectional study approach based on jurisdiction-specific SPFs ( 30 – 32 ). SPF predicted crash frequencies can be used to estimate the CMFs by comparing multiple median types ( 19 ). However, under the different road contexts of AADT, segment length, truck percentage, and access point density, the safety effectiveness of the four median treatments are likely to vary significantly under different situations. Thus, roadway contexts need to be specified to qualify the CMFs for various conditions. NB models were often used to analyze the crash frequency of roadway segments ( 3 – 5 , 14 , 17 , 19 , 20 , 22 – 24 , 27 , 28 ). Poisson models were applied in some studies if the conditional variance was almost the same as the conditional mean ( 2 , 7 , 14 , 22 ). The Conway–Maxwell–Poisson model was found to have almost the same performance as NB models ( 15 ). Multinomial NB models were used on unordered and categorical response outcomes ( 22 ) to capture relationships across multiple years ( 16 ). If many segments are found with zero crashes, regression models can be zero-inflated ( 29 ). Besides traditional models, advanced modeling techniques were applied to explore varying relationships between crash frequency and its covariates. For example, Liu et al. ( 21 ) modified NB models to be geographically weighted to account for spatial heterogeneity (crashes that occurred closer to each other share similar attributes and have higher weights). Non-linearities were observed in previous studies for truck percentage and access point density ( 19 , 21 ), indicating that stationary relationships might not be sufficient to explain significant varying effects of covariates. Dart and Mann ( 18 ) applied interaction items to solve this issue by exploring additional effects from interaction items. Thus, the magnitude of correlations with crash frequency can be substantially diversified across different jurisdictions or segments with different median types ( 16 , 21 , 28 ). This could lead to very different research outcomes across various studies, that is, different findings that challenge beliefs established during past decades on rural roads ( 21 , 28 ). For example, Potts et al. ( 28 ) found that, except in limited cases, narrower lanes did not increase crash frequencies. Thus, AASHTO ( 33 ), in this regard, provides substantial flexibility for narrow lane-width applications with 3.6 m (12 ft) or narrower on urban and suburban arterials. To account for random effects of covariates and unobserved heterogeneity in data, advanced modeling methods are used in crash frequency modeling. For example, Wali et al. ( 34 ) applied the random parameter Poisson model to develop Tennessee-specific SPFs for rural two-way-two-lane highways; Ahmed et al. ( 6 ) used the Bayesian bivariate Poisson-lognormal before-after approach to evaluate the safety effectiveness of the conversion of two-lane roadways to four-lane divided roadways; Aguero-Valverde and Jovanis ( 35 ) applied the full Bayesian approach integrated with spatial models to estimate rural roadway crash frequency; and Guo et al. ( 36 ) used the Bayesian Hierarchical Models to capture the temporal trends of crashes at intersections. The Bayesian approach provided a new alternative venue to model crash frequency. Compared with the frequentist approach (e.g., NB models), which strongly depends on asymptotic normality assumptions for inference, the Bayesian analytical approach is more robust in that is uses not only the data at hand but prior knowledge to provide a straightforward, more intuitive, comprehensive, and flexible interpretation of results with probabilities.
There are advantages and disadvantages to the Bayesian approach, but the universality of this approach is probably the main methodological advantage compared with traditional frequentist approaches ( 37 ). The Bayesian approach is based on the single Bayes rule for inference for all parametric models. Prior knowledge, belief, or experimental evidence can be incorporated in a theoretically sound and principled way which helps mitigate the effect of small sample size, meaning the estimation precision in Bayesian analysis is not limited by the Markov chain Monte Carlo (MCMC) sample size. For example, credible intervals are used instead of confidence intervals to interpret which parameters belong with a certain probability, which is dramatically different from the less straightforward repeated-sampling interpretation. Finally, the Bayesian approach totally satisfies the likelihood principle where the likelihood function can fully represent the information in a sample (even with limited size). Thus, sampling issues can be neglected, while sample size needs to specified in previous studies ( 12 ); and HSM clearly states the desirable minimum sample size to be 30 to 50 sites for calibration ( 8 ). Despite conceptual and methodological advantages, subjectivity in prior distribution and computation costs are argued as two disadvantages of the Bayesian approach. Owing to the increased computational power of processors and STATA software, the Bayesian approach can be performed with multiple runs to assess and obtain the optimal distribution among various prior distributions. Therefore, this study aims at developing context-based CMFs by using the jurisdiction-specific SPFs and investigating the unbiased varying relationship between crash frequency and its covariates of four different medians for rural four-lane roadway segments.
Study Approach
Data Collection and Integration
The data were obtained from multiple data sources including crash data, roadway inventory data, and traffic volume data. The crash data were obtained from the Georgia Department of Transportation (DOT). A total of six years’ data were collected from 2013 to 2018. The data contain geocodes (e.g., longitude and latitudes) that were used to link crashes to the selected rural four-lane segments. These segments were filtered using the Highway Performance Monitoring System (HPMS) https://www.fhwa.dot.gov/policyinformation/hpms/shapefiles_2017.cfm based on the number of through lanes (e.g., 4). The urban area shapefile for the state of Georgia was obtained to remove four-lane segments within urbanized cities or towns. The shapefile may be found online at https://arc-garc.opendata.arcgis.com/datasets/a4d528d8e61d401fb168e3d17becf26a_57. To further clean the data and limit them to rural four-lane segments with posted speed limits of 50 mph or higher, we visually inspected each segment by merging short segments and splitting long segments. This was performed based on the criteria that no major intersections were contained within each continuous segment. During the visual inspection process, access points and curves along each segment were coded. Four typical cross-section designs for rural four-lane highways are analyzed in this study. They are:
non-traversable median—raised curbs, slightly depressed medians (e.g., flush grass), and median barriers;
two-way-left-turn lane—traversable cross-section bordered on either side by two yellow lines where the inner line is broken or dashed, and the outer line is solid;
4-ft flush median—traversable cross-section with a width between 3 and 5 ft; and
undivided roadway—traversable cross section with almost zero-width double-yellow lines.
Estimated CMFs for the first three cross-section types are compared with the fourth cross-section type (the base median type). Figure 1 shows examples for each median type. Crashes that occurred on these sampled segments were integrated, and the total number of crashes in six years and annual average crash frequency were calculated. The yearly AADT and truck percentage were obtained from Georgia DOT and then merged with segments based on the geocodes. Missing information about AADT and truck percentage was identified, and information from nearby segments was then interpolated to solve this issue.

Four median types: (a) non-traversable median; (b) two-way-left-turn lanes (TWLTL); (c) 4-ft flush median; and (d) undivided of the selected rural four-lane segments within Georgia.
Bayesian Generalized Negative Binomial Approach
The count nature of the response variable (crash frequency) urged this study to apply either Poisson or NB models as indicated by many researchers ( 4 , 6 , 21 , 34 ). The traditional NB model is preferred because of its capability to incorporate overdispersion embedded in the data ( 9 ). Dispersion parameter estimation (e.g., varying dispersion parameter) is important especially for data with a long tail distribution or data of small sample size and low mean ( 38 – 40 ). As mentioned above, under the frequentist analysis framework, certain assumptions are made (e.g., linearity, independence). Thus, the data-driven frequentist approach (e.g., NB) strongly depends on whether the assumptions required by the model are met. On the other hand, the Bayesian approach relaxes those assumptions and, together with the prior information for inference, only follows the Bayes rule to form posterior distributions of model parameters ( 37 ). The Bayesian approach assumes the observed data is fixed and the model parameters are random. While the frequentist approach assumes the observed data are a repeatable random sample, and the model parameters are unknown but fixed and constant across repeated samples. The exact sampling distribution is rarely known but approximated by large samples in the frequentist approach. However, the MCMC sampling mechanism can help estimate the exact posterior distributions even with small samples. Finally, the Bayesian approach uses the credible interval—instead of the confidence interval—to calculate the likelihood of the null hypothesis given the data, rather and the likelihood of the data, given that the null hypothesis is true in the frequentist framework ( 37 ). Accordingly, the traditional NB model (shown in Equations 1 and 2) was modified as a Bayesian generalized negative binomial (BGNB) model as,


where
The posterior distribution based on Bayes rule is formulated as:

where
In a more convenient log-form, Equation 5 can be rewritten as:

where
By incorporating the Bayesian framework into the NB model, a Bayesian generalized NB approach can be formulated as:

One added consideration before model estimation and future predictions is the prior distribution selection. Noninformative priors are avoided because they do not specify a legitimate probability distribution. Convenient conjugate priors are desirable alternatives from technical and computational standpoints, but they may not realistically represent model parameters. Thus, various algorithms were developed and the Metropolis–Hastings (MH) algorithm was recognized as one of the efficient ways to allow any distribution to be used as a proposal distribution (
37
). In model estimations, the integral of interest
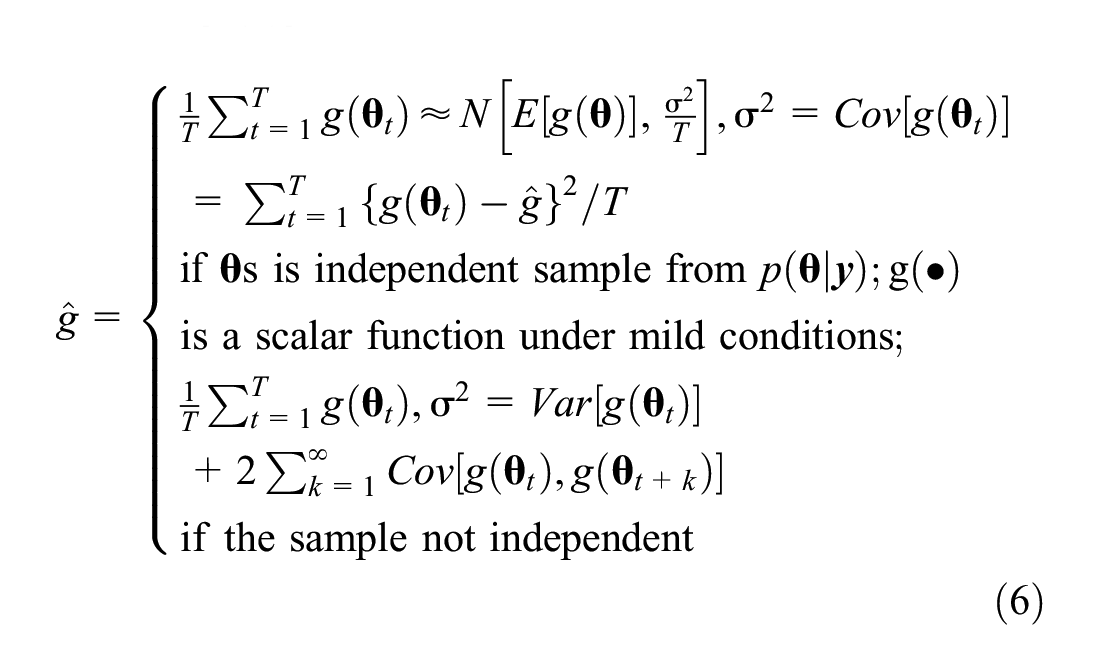
where
The integration is performed via simulations in most cases, and the MCMC method was often adopted as an effective tool for approximations from the posterior distributions ( 41 ). The acceptance rate of the Markov chain is one of the important criteria measuring the efficiency of MCMC. It is estimated to range from 0 to 1, where 0 means most of the proposed sample are rejected and the chain failed to explore regions of appreciable posterior probability; the other extreme when acceptance probability is close to 1 means the chain fails to explore the whole posterior domain and only searches within a small region. On the diagnostics of MCMC convergence, trace plot and autocorrelation are used. The former plots the simulated values for a parameter versus the iteration number. The latter captures the correlations between consecutive simulated samples using the MCMC method. Smaller values of correlation are preferred indicating a more efficient sampling process.
SPF Functional Form
HSM recommends using

where
TP is the truck percentage,
APD is the access point density along a segment, and
HC is horizontal curve (binary).
CMF Estimation
To better understand safety effectiveness among the four median type facilities on rural four-lane segments, this study develops CMFs based on predicted per-mile crash frequency using developed SPFs for each median type. The other factors (e.g., AADT, truck percentage, and APD) will change simultaneously across all median types in CMF estimations. To ease comparisons, undivided segments were treated as the base. CMFs are estimated using Equation 8:

where
Results and Discussions
Descriptive Statistics
Table 1 details the distribution of selected variables. In general, the six-year averaged AADT of TWLTL segments was larger than that of other segments. The average length of non-traversable segments was longer than other median type segments. Similarly, the average truck percentage along non-traversable segments was at least 5% larger than those of other segments. APD had the lowest density on non-traversable segments, while TWLTL segments had the highest. More horizontal curves were found on non-traversable segments, probably because they were spread out in longer spans.
Descriptive Statistics for Selected Explanatory Variables

Note: N = sample size; TWLTL = two-way-left-turn lane; AADT = average annual daily traffic; APD = access point density; Min. = minimum; Max. = maximum.
Results of SPF Development
Table 2 presents BGNB model estimation results. The burn-in size and MCMC sample size are set to be 2,500 and 10,000, respectively. On the usefulness of randomly generated samples, Roberts et al. ( 42 ) indicated that an acceptance rate of 0.234 is asymptotically optimal for a multivariate posterior and proposal distributions. Our acceptance rates range from 0.202 to 0.272 for four different models, indicating a reasonable model efficiency. Log marginal likelihood and the deviation information criterion (DIC) are provided, where larger log marginal likelihood and smaller DIC were preferred for model performance comparison. Since we developed individual models for each median type, these performance indicators were not used to compare across models; however, we did use them to investigate the variations of model performance by changing prior distributions during the modeling process. Additionally, we calculated the RMSE (root mean square error), MAE (mean absolute error), and R-squared to validate the model performance. The RMSE and MAE values for rural four-lane undivided, 4-ft flush median, TWLTL, and non-traversable roadway segments are 0.902 and 0.606, 1.625 and 0.922, 1.595 and 0.859, and 1.932 and 1.057, respectively. The results also show that, for four median types (i.e., undivided, 4-ft flush median, TWLTL, non-traversable), the R-squared values are 0.632, 0.716, 0.519, and 0.446, respectively. These numbers further indicate that the model performance is improved if they are compared with values obtained from previous studies ( 14 , 18 , 22 , 23 , 28 , 31 , 43 ).
Bayesian Generalized Negative Binomial Regression Model Estimates of the Selected Variables for Four Median Type Segments

Note: Alpha denotes the overdispersion parameter. AADT = average annual daily traffic; MCSE = Markov chain Monte Carlo standard errors; DIC = deviance information criterion; MCMC = Markov chain Monte Carlo; TWLTL = two-way-left-turn lanes; APD = access point density.
In general, model estimates are within expectation. AADT and segment length are found to associate with increased crash frequency, which is indicated in HSM ( 8 ). Non-linear relationships are identified for truck percent, and the BGNB model further confirms that truck percent holds both negative and positive correlations with crash frequency (e.g., 95% credible interval is [−0.08, 0.984] for non-traversable crash frequency). Such a non-linear relationship was also identified in earlier studies ( 16 , 19 ), which further indicates that truck percent has significant impacts on safety performance for different median types and should be considered for appropriate roadway median selection. As for APD, higher density is found to correlate with increased crash frequency. However, this relationship varies significantly for both segments with 4-ft flush medians and undivided segments; positive correlations are found for many of the segments but negative ones for others. Those kinds of diversified relationships were recognized in other studies ( 5 , 6 , 19–21, 25 , 27 ), which confirms the necessity to apply models like BGNB. Similar varying correlations are found for the interaction item and horizontal curve. Horizontal curves are found to associate with increased crash frequency for most median type segments, except for undivided segments. This is probably because undivided segments are close to urban areas, and curves may help reduce the travel speeds that lead to decreased crash frequency. The safety benefit of the horizontal curve was also found in an earlier study ( 16 ). However, this is not always the case, as the 95% credible interval contains positive values for horizontal curves, meaning the presence of a horizontal curve can have a different negative impact on safety performance for different jurisdictions ( 5 ). In overdispersion, non-traversable and TWLTL segments were observed to have overdispersion (alpha = 6 and 0.33, respectively). Four-ft flush median and undivided segments were not observed to have overdispersion (alpha = 0.00 and 0.04, respectively). As for dispersion of the interaction item, there is always a level of overdispersion with high magnitudes for non-traversable and TWLTL segments and lower magnitudes for 4-ft flush median and undivided segments.
Figure 2 further depicts the diagnostics of variations and convergence of the BGNB model with the MCMC method. Trace plots were used to visually inspect the convergence. A good example of convergence is that parameters traverse the posterior domain rapidly and have near-constant mean and variance ( 37 ). No observed parameters have constant monotonically increasing or decreasing patterns, meaning they all have well-mixing chains. For autocorrelation, most parameters have a low correlation after 30 simulation draws. However, some parameters did not decrease that fast, indicating a less efficient sampling process of those parameters (e.g., Ln(AADT) for undivided roadways).

Trace plots and autocorrelation for estimated parameters of four rural four-lane median type segments within Georgia: (a) non-traversable median; (b) two-way-left-turn-lane (TWLTL); (c) 4-ft flush median; and (d) undivided.
To further investigate the significance of crash reductions from the base undivided median type, this paper builds a separate two-level random intercept/parameter NB model in Table 3 which represents: (1) individual segments within each median group; and (2) the median group. This model captures both the fixed and random effects by allowing the intercepts and estimated parameters to vary from one observation to another. The incidence-rate ratio exp (β) is used instead of the coefficients β to show the estimated percentage of reduction compared with the base category of median type. The results show that, compared with undivided segments, TWLTL and non-traversable segments are significantly associated with a reduced crash frequency (by 19.2% and 21.9%, respectively). For the 4-ft flush median roadway segments, the crash reduction is about 5.8% without statistical significance (p-value = 0.664). These findings are consistent with those found in other studies ( 14 , 17 , 25 , 31 , 43 ), and overall non-traversable segments have the best safety performance. Factors of truck percentage, APD, and horizontal curve are also found to have an increased crash frequency.
Two-level Random Intercept/Parameter Negative Binomial Regression Model to Estimate Crash Frequency among Four Median Type Segments

Note: IRR = incidence-rate ratios; AADT = average annual daily traffic; APD = access point density; TWLTL = two-way-left-turn lane; NB = negative binomial; AIC = Akaike information criterion; na = not applicable.
Results of CMF Estimation
The estimated SPFs based on the BGNB model for each median type are used to predict crash frequency under different scenarios and to compare safety effectiveness using Equation 8. Figures 3 and 4 present predicted crash frequencies for segments without and with horizontal curves under low (5), medium (20), and high (50) access points/mile situations. In general, under low traffic volumes (e.g., ≤ 5,000 vehicles per day [vpd]), 4-ft flush median and TWLTL straight segments were observed to have improved safety performance. Under higher traffic volumes (e.g., ≥ 20,000 vpd), non-traversable and TWLTL straight segments were observed to have improved safety performance. While in mid-range AADTs, TWLTL straight segments seem to have improved safety performance, a clear pattern is not observed.

Visualization of the estimated safety performance functions (SPF): (a) for non-traversable, two-way-left-turn lanes (TWLTL); (b) four-ft flush median; and (c) undivided straight segments (with low/5 access point density [APD], medium/20 APD, and high/50 APD; without horizontal curves).

Visualization of the estimated safety performance functions (SPF) for: (a) non-traversable, two-way-left-turn lanes (TWLTL); (b) four-ft flush median; and (c) undivided curvy segments (with low/5 access point density [APD], medium/20 APD, and high/50 APD; with horizontal curves).
The estimated CMFs are calculated (Tables 4 and 5 [see Supplemental Material]) to capture better patterns. The results are visualized to reveal relationships between CMFs and selected variables. Results show that CMFs vary across different values of AADT, truck percentage, and APD. Specifically, the results show that, as for straight segments, TWLTL indeed had slightly improved safety performance than others (or nearly the same as non-traversable) with truck percentage ranges within 10% to 25% and low traffic volume (e.g., 15,000 vpd or fewer). On curvy segments, except for the mid-ranged AADTs, the same conclusions hold. Figure 4 shows that a non-traversable median might be a better choice for mid-ranged AADTs in safety performance. CMFs in Table 5 (Supplemental Material) further confirm that non-traversable curve segments were performing slightly better than TWLTL curve segments. To sum up, for rural four-lane roadway segments with a speed limit higher than 50 mph, non-traversable medians generally have improved safety performance under high traffic volume conditions (e.g., over 20,000 vpd); TWLTL straight segments are more preferred with medium traffic volume conditions (e.g., 5,000–20,000 vpd) with a fairly mid-ranged truck percentage (e.g., 10% to 25%); 4-ft flush median segments are more favored under low traffic volume conditions (e.g., 5,000 or fewer vpd); and undivided segments are least preferable if other median types cannot be deployed under a particular condition. Our findings are consistent with those found in previous studies. For example, non-traversable medians (raised medians) were found to reduce total crash rate by 37% compared with TWLTL on Atlanta’s Memorial Drive ( 44 ), and the installation of non-traversable medians (compared with TWLTL) were also found to reduce crashes by nearly 60% on the Texas Avenue corridor in College Station, Texas ( 43 ). As for the conversion from four-lane undivided roadway to a five-lane roadway with a TWLTL, the crash reduction rate was found to range from 16% to 65% ( 45 ).
Limitations
This study’s outcomes rely heavily on the data that were provided by Georgia DOT or collected from open sources. As we processed the data, erroneous data were found and removed (<0.5% of raw crash records). Crashes that were inaccurately geocoded were excluded from the analysis. This study collected a sample of roadway segments and does not cover all segments in the state of Georgia. In addition, modeling results are limited to the model specifications in this study. There are some factors (e.g., shoulder type or width) which are likely to interact with the safety performance, but which are not available in the data. Therefore, the validity of the modeling results may still suffer from the threat of unobserved factors to some extent. The cross-sectional safety evaluation method in this study may not well account for the temporal transferability over time. Additionally, prior information or distributions were used in the BGNB model. Different specifications of distributions might lead to different model estimations. Furthermore, other roadway inventory data were not available to be assessed in the model, which might affect the final study outcomes.
Conclusions
State agencies and practitioners are often challenged to determine cross-section types when both benefits and costs need to be considered. Four typical median types are non-traversable medians, TWLTLs, 4-ft flush medians, and undivided roadways. In evaluating the safety effectiveness of alternative median treatments on rural four-lane roadway segments, CMFs are often used. However, CMF estimations are likely to vary significantly under different road contexts (e.g., traffic volumes and access points). Few studies were designed specifically for safety effectiveness evaluation on rural four-lane segments with high travel speeds (e.g., ≥ 50 mph). The goal of this study is to estimate CMFs based on the developed jurisdiction-specific SPFs for alternative cross-section designs of rural four-lane roadways under different road contexts. The contexts are specified by AADT, truck percentage, and APD. We collected and integrated the data from multiple data sources, including Georgia DOT crash and traffic databases, HPMS, and other sources. The key covariates of interest while developing jurisdiction-specific SPFs are AADT, truck percentage, APD, and horizontal curve. In recognizing the significant varying correlations of the crash frequency with the covariates, this study investigates such dynamic relationships using an advanced BGNB model to relax the assumptions of traditional NB models. The BGNB approach incorporates the prior information into the model to estimate posterior distributions of estimated parameters. During the modeling process, multiple prior distributions were assessed for an efficient sampling process with convergence. Finally, context-based CMFs are estimated to evaluate the safety effectiveness of each median type based on the predicted number of crashes using the developed SPFs. The key findings are:
AADT and segment length correlate with increased crash frequency, which corresponds with HSM SPF specifications for rural multilane highway segments; non-linear relationships with crash frequency do exist, especially for TP and APD; the interaction item of ln(AADT) × TP can be used to capture the interaction effects.
Prior distributions need to be carefully selected for better SPF model posterior estimations; trace plots and autocorrelations are two effective tools that can be used to inspect the convergence and model efficiency.
The context-based CMFs vary significantly across different roadway conditions, and safety effectiveness can be substantially different under different traffic or road conditions. CMFs for 4-ft flush medians are greater than 1 (i.e., improved safety performance) for roads with high traffic volumes (≥15,000 vpd) and low truck percentage (≤10%) but are lower than 1 (i.e., decreased safety performance) for segments with low traffic volumes (≤6,000 vpd) and high truck percentage (≥20%). TWLTL and non-traversable segments tend to have significantly improved safety performance compared with undivided segments. For curve segments, the non-traversable medians appear to outperform TWLTLs under the same traffic conditions. For straight segments, TWLTLs seem to have slightly improved safety performance especially when truck percentage ranges between 10% to 25% and traffic volume is 15,000 vpd or fewer.
The study results are expected to help traffic safety engineers refine their jurisdiction-specific SPFs for rural four-lane segments with high travel speeds. For example, truck percent and APD need to be included in jurisdiction-specific SPF development, and the non-linear relationship needs to be captured using the interaction items. The continuing research will extend the modeling framework to analyze crashes at different injury levels (e.g., fatal/injury) by incorporating the unobserved heterogeneity related to geographical space, and to explore the effects of varying dispersion parameters in SPF development for rural four-lane highways.
Supplemental Material
sj-docx-1-trr-10.1177_03611981211007141 – Supplemental material for Bayesian Approach to Developing Context-Based Crash Modification Factors for Medians on Rural Four-Lane Roadways
Supplemental material, sj-docx-1-trr-10.1177_03611981211007141 for Bayesian Approach to Developing Context-Based Crash Modification Factors for Medians on Rural Four-Lane Roadways by Xiaobing Li, Jun Liu, Chenxuan Yang and Timothy Barnett in Transportation Research Record
Footnotes
Acknowledgements
The authors appreciate GDOT for sharing the data with us.
Author Contributions
The authors confirm contribution to the paper as follows: study conception and design: Xiaobing Li, Jun Liu, Timothy, Barnett; data collection: Chenxuan Yang, Xiaobing Li, Jun Liu; analysis and interpretation of results: Xiaobing Li, Jun Liu, Timothy, Barnett; draft manuscript preparation: Xiaobing Li, Jun Liu, Timothy, Barnett, Chenxuan Yang. All authors reviewed the results and approved the manuscript.
Declaration of Conflicting Interests
The author(s) declared no potential conflicts of interest with respect to the research, authorship, and/or publication of this article.
Funding
The author(s) disclosed receipt of the following financial support for the research, authorship, and/or publication of this article: This study was supported by a project funded by GDOT (grant no. RP 19-15).
The authors are responsible for the views, facts, and validity of the information presented in this study.
Supplemental Material
Supplemental material for this article is available online.
References
Supplementary Material
Please find the following supplemental material available below.
For Open Access articles published under a Creative Commons License, all supplemental material carries the same license as the article it is associated with.
For non-Open Access articles published, all supplemental material carries a non-exclusive license, and permission requests for re-use of supplemental material or any part of supplemental material shall be sent directly to the copyright owner as specified in the copyright notice associated with the article.
