



Abstract
Several methods have been developed for nondestructive pile depth estimation over the past few decades, with impact-based methods remaining popular because of their ease of application. Sonic-echo techniques rely on generating nondispersive longitudinal waves by impacting the pile top and subsequently picking peaks that correspond to initial and reflected wave arrivals. Unfortunately, pile tops are often inaccessible for in-service foundations and alternate impacting techniques result in signals for which time domain peak picking can be difficult. Pile sides are often easily accessible, but side impact generates highly dispersive flexural waves resulting in complicated waveforms for which analysis is not straightforward. Existing methods to process dispersive flexural waves rely on signal processing based methods and do not explicitly incorporate the physical dispersion properties of the system, resulting in large errors. To address the current limitations, a new method called effective dispersion analysis of reflections (EDAR) was recently developed for pile length estimation. EDAR provides a simple and robust technique to analyze dispersive flexural waves generated from side impact for which time domain processing is not applicable. In this paper, length estimation through EDAR is explained for longitudinal and flexural waves using synthetic bar and Timoshenko beam models. Field validation for two types of pile, concrete filled steel tubes and prestressed concrete, with varying cross sections and embedment are presented. EDAR resulted in pile length estimates within 10% error.
Nondestructive techniques (NDT) are a critical tool in characterizing bridge pile foundations and assessing their integrity ( 1 ). Pile length estimation is of particular interest because of missing records and scour susceptibility. Detailed studies by the Florida Department of Transportation (DOT) ( 2 ), and Olson et al. ( 3 ), contain a comprehensive list, with a basic description, of most of the methods used for estimation of unknown foundation depth. Borehole methods such as parallel seismic, cross-hole sonic require installation of a borehole near the foundation and are widely applicable often providing reliable results. Unfortunately, because of the need for borehole installation, they are expensive and time consuming. Surface-based techniques rely on recording stress wave propagation in the piles often generated from hammer impacts. Although, testing is easier compared with borehole methods, analysis of the recorded response can be complicated based on the impact characteristics.
The sonic-echo technique is one of the most widely used techniques to evaluate pile length and integrity (see e.g., [3–5]). Traditionally, longitudinal waves generated from a hammer impact on the pile top are recorded using an accelerometer or geophone attached to the top surface of the pile. Longitudinal waves are nondispersive in nature resulting in constant wave transmission speed. The initial and reflected wave arrival peaks identified from the response, along with the assumed wave velocity, results in a pile length estimate. Although the method is straightforward in theory, other impact scenarios, because of a lack of access to the pile top, often lead to complicated signals for which data analysis is difficult ( 6 ). In addition, the existence of pile cap and superstructure can have a significant influence on the recorded signals further complicating the peak picking process ( 7 ). This was addressed by the ultraseismic method which uses several sensors along the side of the pile to identify the initial arrival and reflections with higher confidence ( 3 ). This procedure requires multiple sensors and sufficient spacing between sensors, which might not be available for piles with limited exposed lengths. Additionally, inducing a combination of both longitudinal and flexural waves increases the complexity in the patterns observed and subsequent analysis.
For in-service piles, sides are often more easily accessible but a side impact leads to bending/transverse waves that are dispersive in nature, that is, the initial waveform distorts as the wave travels along the pile. Holt and Douglas ( 8 ) introduced the Short-Kernel Method (SKM) to process the response from dispersive flexural waves to obtain the travel time information, which is used to estimate the embedded length of the pile. Choosing the kernel frequency and picking the peaks that correspond to the initial wave arrival and reflected wave arrival can be complicated even for an experienced user ( 9 ). Subhani et al. ( 10 ) used a combination of SKM and continuous wavelet transform (CWT), which is a time-frequency analysis technique, to estimate the embedded lengths of electricity poles and observed significant error margins in both cases, up to 43% in some cases. These are signal processing based methods and do not explicitly incorporate the dispersion relation and effect of the surrounding soil.
Given both the advantages of using side impacts and the limitations associated with the existing processing techniques for flexural waves, we have developed a new signal processing technique named effective dispersion analysis of reflections (EDAR) ( 11 ). EDAR is capable of analyzing both longitudinal and transverse waves. The recorded signals are processed in the frequency domain to obtain a specialized plot with patterns that correspond to the initial and reflected wave arrivals; the length estimate is obtained by explicit incorporation of the dispersion relation corresponding to the generated waves. In addition, EDAR is capable of incorporating the effect of the surrounding soil, which leads to differential attenuation of transverse and longitudinal waves ( 12 ). In this paper, the EDAR procedure is explained through synthetic examples followed by field test results. Results are presented for two types of pile, concrete filled steel tubes (CFST) and prestressed concrete, with varying diameters and embedded depths.
EDAR Preliminaries and Verification with Synthetic Data
EDAR is a frequency-domain analysis technique recently developed to estimate the depth of pile foundations. The response of a pile to a hammer impact is recorded at a minimum of two sensor locations installed on the pile sides. The frequency dependent phase difference of the accelerations obtained at two sensor locations contain patterns named cycle and wiggle (further details and underlying theory can be found in [ 11 ]). The key to the methodology is to incorporate the dispersion relation of the waves generated and plot the phase difference as a function of a scaled wavenumber, which is defined based on the dispersion relation of the generated waves. The EDAR analysis procedure, its link to time domain processing for nondispersive (longitudinal) waves, and its effectiveness in processing dispersive (flexural) waves are elaborated through freestanding synthetic bar and Timoshenko beam models shown in Figure 1. Table 1 shows the properties of the model concrete pile used. Left and right half-space with variable modulus are attached to the beam to isolate and demonstrate the effect of reflections from different boundaries as detailed below.
Model Pile Properties


Model piles and impact scenarios for synthetic modeling.
Impact Scenario 1: Longitudinal Waves in a Bar
Impact scenario 1 resembles sonic-echo/ultraseismic type testing and results in longitudinal waves that are nondispersive in nature. The total pile length is 17 m with

Longitudinal wave analysis: (a) time domain analysis; and (b) effective dispersion analysis of reflections plot.
Figure 2b is called the EDAR plot which shows the same signals processed with the EDAR methodology. The phase difference between the signals at two sensor locations in the frequency domain is the abscissa of the EDAR plot. Since the wavenumber and frequency have a linear relationship for longitudinal wave propagation, the ordinate of the EDAR plot is chosen as the frequency. This choice of frequency, instead of the wavenumber, facilitates the calculation of the pile length without the need for wave velocity. EDAR plot, contains periodicities called the cycle and wiggle period. The cycle is a consequence of the initial wave arrival at the two sensor locations and the wiggles are a consequence of the wave reflection from the pile boundaries. Detailed explanation and derivation of the cycle and wiggle periods can be found in (
11
). The EDAR method requires the calculation of the cycle period (

The total length of the pile is calculated by adding the distance from the midpoint of the sensors to the pile top to the estimate obtained from Equation 1 resulting in an estimate of 17 m. Although EDAR can be linked to time domain processing, frequency-domain analysis not only simplifies the length estimation process but also eliminates the peak picking in the time domain, which can be complicated in real data. The real power of EDAR is its ability to handle with ease, more complex situations such as side impacts as detailed in the following examples.
Impact Scenario 2: Flexural Waves in a Beam
Lateral impacts lead to dispersive bending waves with each frequency traveling at a different velocity in turn leading to the distortion of the initial waveform. Timoshenko beam theory is used to model the beam shown in Figure 1 for the lateral impact scenario. Total pile length is 17 m with lengths
Case 1: Effect of Bottom Reflections and Length Estimation through EDAR
Wave dispersion is evident from the time domain plots shown in Figure 2. As a result of this distortion, peak picking to identify the initial and reflected waves is impossible. Nevertheless, the wave reflections from the bottom still manifest as wiggles in the EDAR plot shown in Figure 3. The key to length estimation is to modify the ordinate of the EDAR plot using the Timoshenko wavenumber, which makes the cycle and wiggle periods uniform. This simple modification makes Equation 1 applicable for these dispersive waves to estimate the pile length. The total length estimate from the EDAR procedure is 17.16 m, which is within 1% of the actual length.

Effective dispersion analysis of reflections length estimation from bottom wiggles and cycle period: (a) time; and (b) phase difference.
Case 2: Interference from Top Reflections and Wiggle Extraction
Reflection from the top boundary further complicates the time domain plots (Figure 4a) and manifests as sudden jumps in the EDAR plot at regular intervals superimposed on the wiggles (Figure 4b). While a simpler approach is to calculate the wiggle periods from the unaffected wiggles in-between the jumps, a more robust methodology to extract the wiggle period is to analyze the frequency spectrum of a selected region of the EDAR plot (Figure 4, c and d ). This approach is useful while analyzing field data with significant interference from the top boundary, other unknown effects and noise making it difficult to directly evaluate the wiggle period. A selected region of interest from the EDAR plot where wiggles are abundant is chosen and Fouries Transform (FFT) is used to extract the dominant period of oscillation, which gives an estimate of the average wiggle period (Figure 4d). This wiggle period along with the cycle period is used to calculate the pile length as 16.93 m, which is again within 1% of the actual length in spite of the interference from the top effects.

Extraction of bottom wiggles superimposed with top effects: (a) time domain; (b) effective dispersion analysis of reflections (EDAR) plot; (c) region of interest from EDAR plot extracted and slope corrected; and (d) frequency spectrum of region of interest.
Effect of Surrounding Soil
The above examples involved idealized bar and beam without any embedment. But, in reality, the soil surrounding the pile can have a significant effect on the wave propagation. While it is known that the side impact can produce secondary longitudinal waves in addition to transverse waves, their amplitude is low compared with the transverse waves for a freestanding pile. The soil surrounding the pile leads to faster decay of the transverse waves compared with longitudinal waves. We discovered that the reflected waves in field settings are dominated by the secondary longitudinal waves ( 12 ) because of this differential attenuation of waves. Failing to incorporate this phenomenon during field data analysis will lead to length estimates with large errors ( 12 ).
Summary of EDAR Methodology
The steps of the EDAR methodology are summarized as follows.
Test set-up: Two accelerometers are installed to the pile side with a recommended minimum spacing of 10 in. to capture both the cycle and wiggle period. More accelerometers can be used to build redundancy and acquire pile response at multiple sensor spacings for a single impact. The accelerometer choice should depend on the frequency content of the waves generated which depends on the pile material and impact characteristics. It is advantageous to select an accelerometer with a wide frequency range (up to 10 kHz) and a measurement range of ±50g. The accelerometers are stud mounted using superglue to ensure proper coupling. They are connected to a data acquisition system which in turn is connected to a laptop computer or a tablet to collect and store the accelerometer data.
Impact and hammer characteristics: The pile is impacted in line with the sensors at a recommended distance of one foot above the top sensor to avoid accelerometer overload. Hammers with different weights and with interchangeable rubber tips of differing hardness are used to excite different frequency content. Different hammers performed best for different piles and the observations are presented in the field testing section.
Material property estimation through cycle period analysis: The cycle period is dominated by the transverse waves since the waves are still traveling in the exposed part of the pile. The cycle period calculated from the EDAR plot is used to optimize for the Young’s modulus of concrete by matching it with that of an infinitely long Timoshenko beam (see [ 12 ] for further details). Other pile properties such as density and Poisson’s ratio of concrete are less variable compared with the modulus and typical values are assumed based on the pile material. Similarly, typical values for all the material properties of steel are assumed for CFSTs to optimize for the modulus of the concrete. The calculated modulus and the assumed density of the pile are used to compute the longitudinal wave velocity (given by the square root of the ratio of modulus to density).
Length estimation through wiggle period analysis: The wiggle period is calculated by carefully examining the multiple EDAR plots either by picking wiggle peaks whenever possible (Figure 3b) or by analyzing the frequency spectrum of phase difference (Figure 4, c and d ). The calculated wiggle period and longitudinal wave velocity are used to calculate the length from the sensor midpoint to the pile tip using

It is important to note that there is no need for soil properties in the length estimation process. The procedure is based on the observation of dominance of secondary longitudinal waves in reflection which is incorporated in the wiggle period calculation.
Field Test Results
Four different piles with properties shown in th Tables 2 and 3 were tested using the EDAR methodology. Piles 1 and 4 were CFST and piles 2 and 3 were solid prestressed concrete piles. Two sensors are required for EDAR methodology but to build some redundancy, a four-channel USB-based data acquisition (DAQ) system and four accelerometers (PCB352C33) were used for testing the piles. Thus, a single impact produces six different EDAR plots from six sensor pair combinations. The accelerometers are stud mounted using super glue to the pile and aligned such that they measure the lateral acceleration of the foundation. The DAQ system (NI 9234) chosen is powered from the small handheld laptop which is also used for controlling acquisition and storing the data. The testing system is portable as all the power needs for the system are provided by the handheld tablet computer. A large sledgehammer (PCB 086D50) with hard and soft tips and a small sledgehammer (0.45 kg) with hard, medium hard, medium, and tough tips were used to impact the piles in between the cap and top sensor. Thus, for each pile test hundreds of EDAR plots are generated from which the most suitable (i.e., those that show consistent and repeatable wiggles) are chosen for the length estimation process. Further information about equipment can be found in ( 13 ). The stepwise EDAR procedure is detailed below for Pile 1 followed by the results for the other piles.
Details of the Piles Tested

Note: CFST = concrete filled steel tube.
Material Properties of the Pile Materials

Pile 1: Analysis Results
CFST pile at Portage, AK was tested using the EDAR methodology. This is a relatively smaller cross section pile with shorter embedment compared with the other piles tested. Pictures of the site and the instrumented pile are shown in Figure 5. As mentioned earlier, several hammer tips were used for the testing but the best data are observed for the large hammer and representative data are shown in Figure 6. As expected, the time domain plot (Figure 6a) does not immediately reveal anything while the EDAR plots from different sensor combinations (Figure 6b) clearly show the cycle and wiggles. The cycle period from the sensor combination with the largest spacing is used to optimize for the concrete modulus by using properties from Table 3 and the pile dimensions measured in the field. The concrete modulus is estimated as 38.75 GPa which results in a longitudinal wave velocity of 4,260 m/s.

(a) Portage creek bridge site; and (b) instrumented pile.

Portage pile: (a) time domain; (b) representative effective dispersion analysis of reflections plots from a single impact.
The next step is to obtain the wiggle period. As detailed in the synthetic example, specific regions of the EDAR that contain consistent and repeatable wiggles are selected and the dominant period is obtained through FFT. Unlike the synthetic examples, the EDAR plots are influenced by factors such as noise and reflection from other pile boundaries and features, of which the top effects are often the most significant. Consequently, the FFT peak with maximum amplitude does not always correspond to the wiggle period (shown in Figure 4d) but it is observed that the true wiggle period is generally within the first five peaks in the FFT of the phase difference. Thus, several peaks from each impact are considered resulting in a distribution of wiggle periods. The final step in the length estimation process is to extract the wiggle periods that are a consequence of the bottom reflection. Based on the assumption that only the top and bottom reflections dominate the EDAR plot, the wiggle period distribution is fitted into a bimodal Gaussian distribution to separate the two oscillation periods. The wiggles from bottom reflection are expected to be consistent and uniform compared with other effects in the EDAR plot and thus the dominant mode of the bimodal Gaussian distribution corresponds to the average wiggle period. The resulting distribution shown in Figure 7b has two well-defined modes owing to the clear and consistent EDAR plots observed from the data. An average wiggle period of 245.9 Hz calculated from the distribution resulted in a length estimate of 9.63 m using Equation 2 with less than 6% error.

(a) Specific range of effective dispersion analysis of reflections plot selected; (b) wiggle period distribution.
Pile 2: Analysis Results
The tested prestressed concrete pile with a square cross section is shown in Figure 8. Because of the longer embedment depth, wave attenuation is expected to be higher and, consequently, wiggles were not as evident as they were for Pile 1. Nevertheless, careful examination of the EDAR plots from multiple impacts revealed some good data containing fainter but recognizable and repeatable wiggles (Figure 9, a and b) in the frequency range between 800 Hz and 3,000 Hz. The wave velocity calculated based on the cycle period is 4,284 m/s with an average wiggle period of 153 Hz. EDAR analysis resulted in a length estimate of 15.42 m, which is close to the actual length of 15.55m.

(a) Outer Banks bridge site; and (b) instrumented pile.

Pile 2: (a) typical good effective dispersion analysis of reflections plot; (b) zoomed to show wiggles; and (c) wiggle period distribution.
Pile 3: Analysis Results
A square concrete pile similar to pile 2 but with a larger cross-sectional dimension tested is shown in Figure 10. Although this pile is similar in total length to Pile 3, the exposed length is longer leading to significant effect from the top reflections in the EDAR plot especially in the lower frequency (Figure 11a). Wiggles observed in the medium to high frequency ranges are superimposed with the top effects and careful examination of the EDAR plots from multiple impacts in the frequency range of 4,000–7,000 Hz resulted in a wiggle period of 196.2 Hz (Figure 11b). A wave velocity of 4,365 m/s is calculated based on the cycle period, resulting in a total length estimate of 15.17 m, which is close to the actual length of 14.94 m.
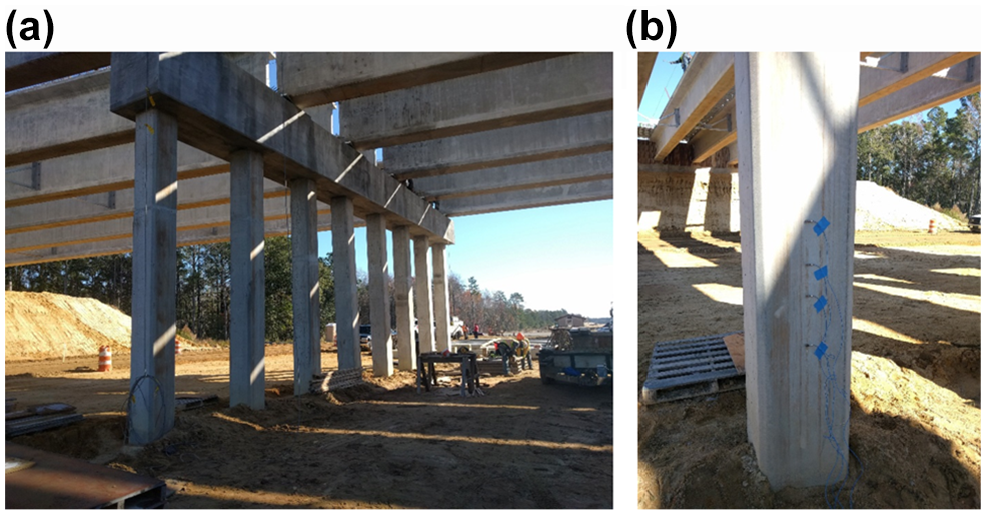
(a) Wilmington bridge site; and (b) instrumented pile.
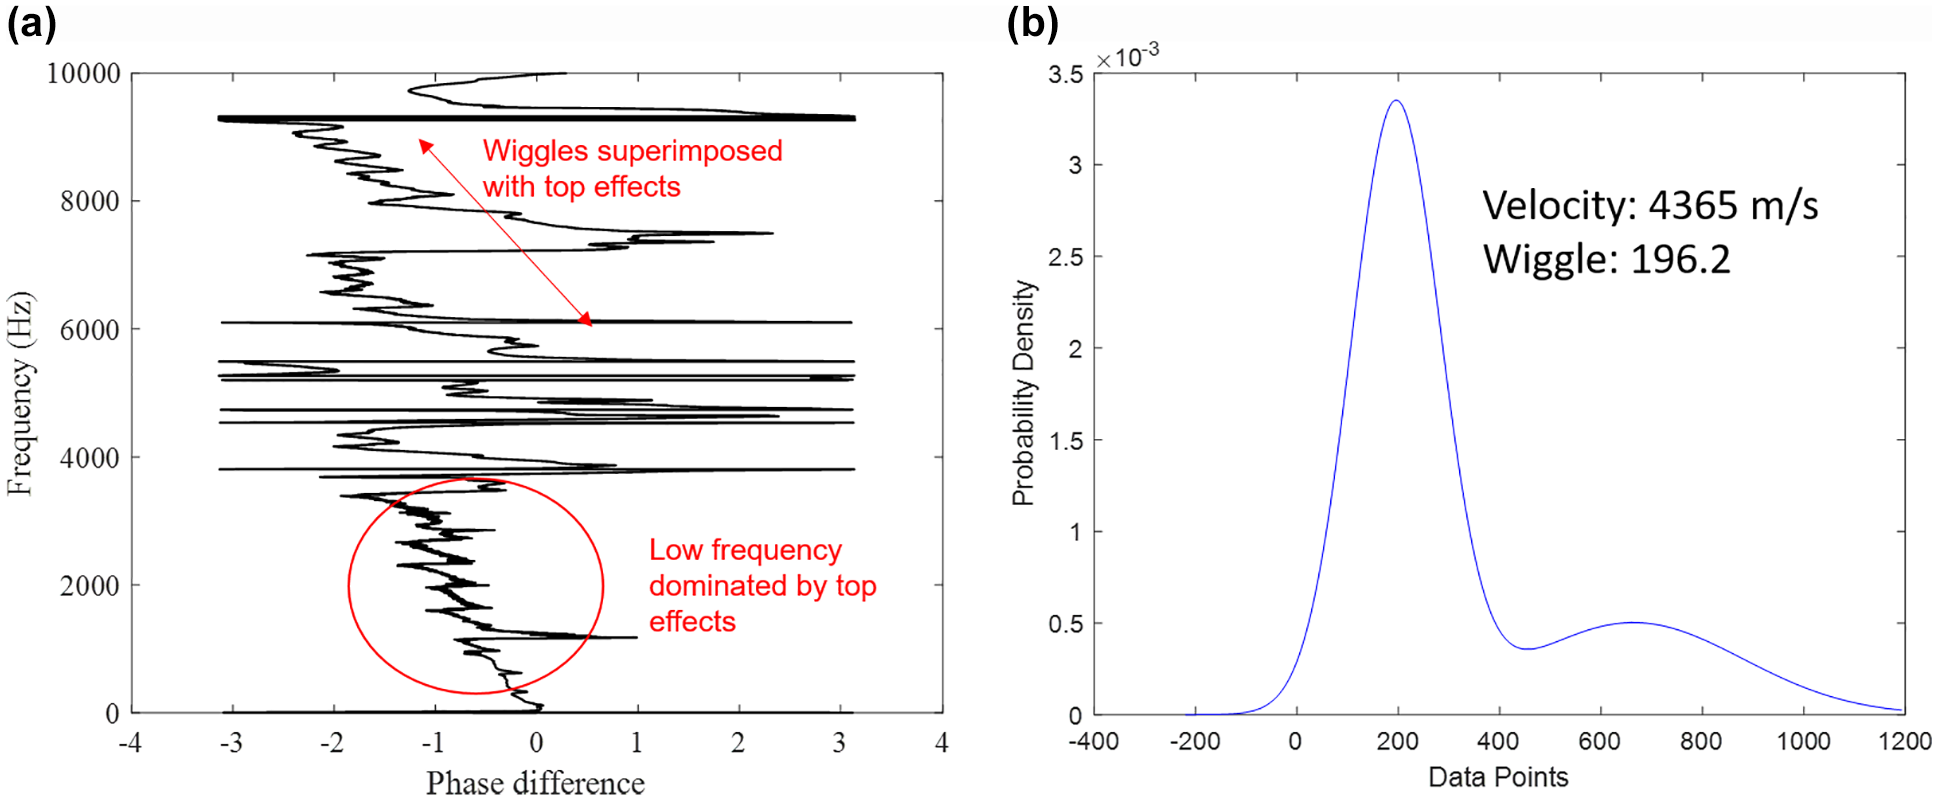
Pile 3: (a) typical effective dispersion analysis of reflections plot; and (b) wiggle period distribution.
Pile 4: Analysis Results
A CFST pile of 0.4572 m outer diameter and 0.009525 m steel thickness tested is shown in Figure 12. This was the longest among the four piles in both total length and embedment. In addition, this pile also had a longer exposed length leading to significant top effects in the EDAR plot as shown in Figure 13a. The wiggles were sparse and direct identification of wiggles was difficult. EDAR plots from multiple impacts were processed in the frequency range of 4,000–7,000 Hz resulting in a wiggle period estimate of 129.6 Hz as shown in Figure 13, b and c. The wave velocity calculated based on the cycle period is 4,249 m/s resulting in a total length estimate of 19.16 m, while the actual length was 21 m.
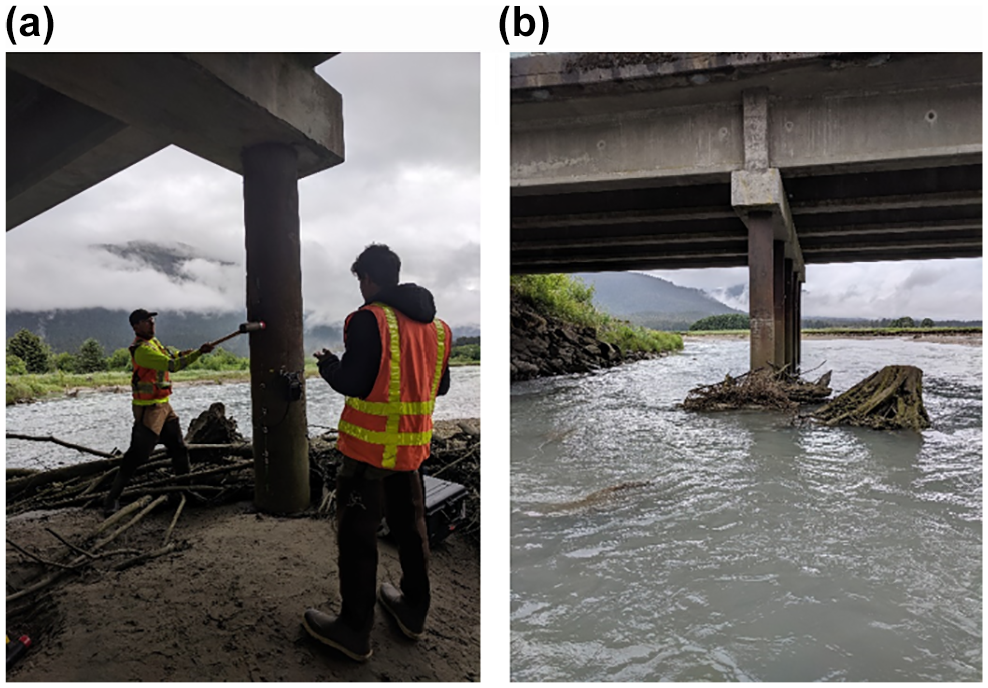
(a) Lemon Creek bridge site; and (b) instrumented pile.
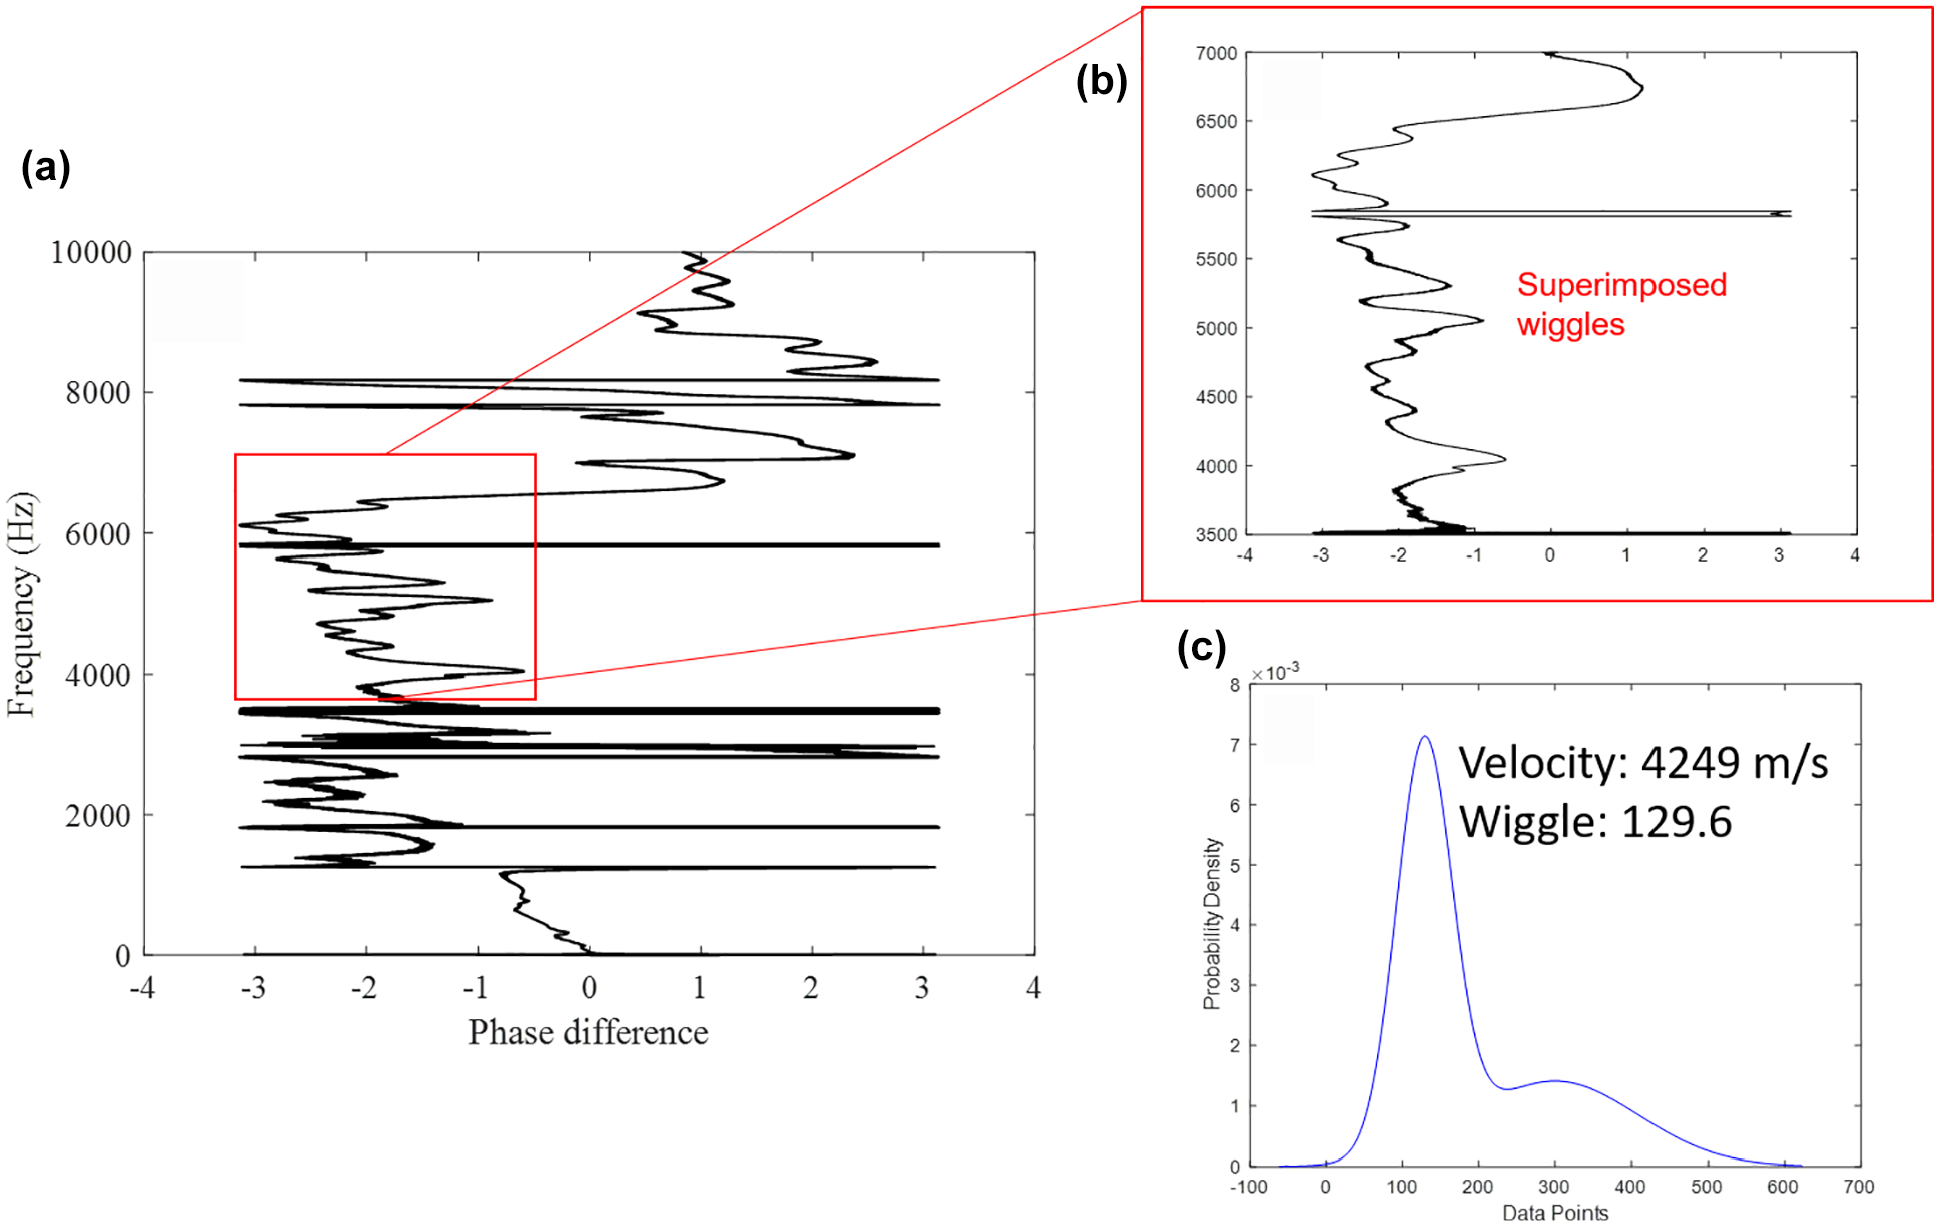
(a) Typical effective dispersion analysis of reflections plot; (b) zoomed area shows superimposed wiggles; and (c) wiggle period distribution.
The length estimates for all four piles are compiled in Table 4 and are generally within 10% error limits whenever EDAR plots with consistent wiggles are observed. In addition to the field test results presented above, two other pile tests, one battered concrete pile (0.4064 m side and approximately 9 m long) and one CFST pile (0.3048 diameter and unknown length) at different bridge sites, resulted in EDAR plots with no significant or repeatable wiggles and thus reliable length estimates could not be obtained. The reason for the lack of the wiggles for these piles is not fully understood yet but could be potentially influenced as a result of the surrounding soil leading to significant attenuation resulting in no discernable reflections. While EDAR has been successful in estimating the length on several occasions, further research and testing is required to fully understand the extent of applicability and the limitations of the EDAR methodology.
Summary of Pile Length Estimates

Note: EDAR = effective dispersion analysis of reflections.
EDAR, similar to existing surface wave-based methods, still requires a discernable reflection at the sensors to obtain consistent and repeatable wiggles, which depends on the surrounding soil stiffness. Nevertheless, owing to its specialized frequency-domain approach, EDAR provides the ability to analyze faint reflections that can be very challenging to identify using the time domain analysis procedures. It is important to note that, at this time, the wiggle period estimation requires user experience and interpretation for successful estimation of the pile length. While currently the wiggle period distribution is assumed to be affected only by two different oscillations coming from top and bottom boundaries, there could be additional effects as a result of abnormalities and discontinuities in the pile. A preliminary study in a controlled laboratory setting showed some promise in detecting the location of discontinuity using EDAR ( 13 ). Depending on the type and extent of discontinuity, this could further complicate the process of identifying the wiggles corresponding to bottom reflection. Such future extensions will be of interest in the context of pile integrity and EDAR can be an additional tool to the currently used low-strain pile integrity tests.
Conclusions
EDAR methodology is based on processing the frequency dependent phase difference between responses at two accelerometers by explicitly incorporating the dispersion relation resulting in a simple expression to estimate the pile length. The length estimation process is detailed through synthetic bar and Timoshenko beam models for longitudinal and bending waves, respectively. Concrete modulus is estimated as an intermediate step from the cycle period to calculate the longitudinal wave velocity. All the insights gained from synthetic modeling are applied for the field data to carefully extract the wiggle period from the EDAR plots by examining specific regions with consistent and repeatable wiggles. Whenever discernable wiggles are observed, length estimates within 10% error margins are obtained. EDAR has been applied only to concrete and CFST driven piles so far. Further testing for timber, steel, and drilled piles is required to extend the applicability of EDAR for a wider variety of piles. Future work will also involve investigation of effects from major discontinuities and anomalies in the EDAR plot to extend the applicability of EDAR for pile integrity related testing.
Footnotes
Acknowledgements
We thank the North Carolina Department of Transportation (Mohammed Mulla, Chris Chen, Chris Krieder and Tom Santee) and Alaska Department of Transportation and Public Facilities (Mike Knapp and Hiram Henry) for financial support as well as significant assistance in field testing.
Author Contributions
The authors confirm contribution to the paper as follows: study conception and design: Murthy Guddati, Vivek Samu; data collection: Vivek Samu; analysis and interpretation of results: Vivek Samu, Murthy Guddati; draft manuscript preparation: Vivek Samu, Murthy Guddati. All authors reviewed the results and approved the final version of the manuscript.
Declaration of Conflicting Interests
The author(s) declared no potential conflicts of interest with respect to the research, authorship, and/or publication of this article.
Funding
The author(s) disclosed receipt of the following financial support for the research, authorship, and/or publication of this article: The research was funded by North Carolina Department of Transportation (project# 2018-29) and Alaska Department of Transportation and Public Facilities (project # HFHWY00009).