



Abstract
The effectiveness of adaptive signal control strategies depends on the level of traffic observability, which is defined as the ability of a signal controller to estimate traffic state from connected vehicle (CV), loop detector data, or both. This paper aims to quantify the effects of traffic observability on network-level performance, traffic progression, and travel time reliability, and to quantify those effects for vehicle classes and major and minor directions in an arterial corridor. Specifically, we incorporated loop detector and CV data into an adaptive signal controller and measured several mobility- and event-based performance metrics under different degrees of traffic observability (i.e., detector-only, CV-only, and CV and loop detector data) with various CV market penetration rates. A real-world arterial street of 10 intersections in Seattle, Washington was simulated in Vissim under peak hour traffic demand level with transit vehicles. The results showed that a 40% CV market share was required for the adaptive signal controller using only CV data to outperform signal control with only loop detector data. At the same market penetration rate, signal control with CV-only data resulted in the same traffic performance, progression quality, and travel time reliability as the signal control with CV and loop detector data. Therefore, the inclusion of loop detector data did not further improve traffic operations when the CV market share reached 40%. Integrating 10% of CV data with loop detector data in the adaptive signal control improved traffic performance and travel time reliability.
Several studies have incorporated connected vehicle (CV) data to develop traffic signal control systems in recent years ( 1 – 6 ); however, relying solely on CV data may not provide the desired level of accuracy in estimating traffic state (i.e., congestion level around the intersection) to make proper signal timing plans when CV market penetration rate is low ( 7 , 8 ). As such, recent studies have used secondary sources of data (i.e., inductive loop detector data) to improve traffic state estimation. It is critical to understand the effects of state estimation accuracy on traffic operations while transitioning from conventional detector-data- to CV-data-based adaptive signal control. Various event- or mobility-based performance measures may be used for this purpose. Event-based measures utilize different sources of data such as signal activation or detector data to evaluate progression quality and capacity of signal control systems ( 9 – 12 ). Mobility-based measures utilize vehicle data to evaluate network-level performances such as travel time or delay ( 13 ). These data sources can be complemented with the CV trajectory data to study the effects of traffic state estimation on the performance traffic signal control systems.
In this paper, we study the effects of different levels of network observability on the performance of adaptive signal control from three perspectives: traffic operations, signal coordination, and travel time reliability. We define traffic observability as the ability of the traffic signal controller to accurately estimate traffic state from CV, loop detector data, or both. We use an existing adaptive traffic control algorithm capable of working with various CV market penetration rates in addition to loop detector data ( 14 – 16 ) for this study. We utilize delay, travel time, and number of completed trips as mobility performance measures, the percentage of vehicle arrivals during green and capacity utilization to evaluate signal coordination, and cumulative density functions (CDF) for travel time reliability analyses. We focus on an arterial street with 10 intersections in Seattle, Washington under p.m. peak hour demand. We study three distinct scenarios in which the adaptive signal controller uses (1) only loop detector data, (2) only CV data, and (3) integrated loop detector and CV data for better observability. We also perform a sensitivity analysis on the effects of demand level on traffic operations.
The remainder of the paper is organized as follows. The next section presents a review of recent studies on the performance evaluations of signal control systems. The description of performance measures used in this paper is followed by detailing the experimental setup. The case study network and numerical results are presented next. Finally, concluding remarks are made and trends for further research discussed.
Literature Review
Priemer and Friedrich ( 17 ) showed a 15%–35% reduction in network delay with more than 33% CVs in the network. Similarly, Smith et al. ( 18 ) showed a 6%–28% reduction in average delay with 25% CV market penetration compared with the actuated signal control system. In addition, He et al. ( 19 ) utilized CV data to estimate the size of incoming platoons to find the optimal phase sequences and showed a requirement of 40% CV penetration rate to outperform actuated signals in average delay and trip completion. Similarly, Islam et al. ( 16 ) showed that the distributed coordinated signal control system proposed in Islam and Hajbabaie ( 14 ), and Mehrabipour and Hajbabaie ( 15 ) reduced total delay by 8% with 40% CVs in the network. Feng et al. ( 20 ) suggested a minimum of 25% CVs in the traffic stream to reduce delay compared with actuated signal systems. As such, it is noticeable that the current signal control strategies that solely relied on CV data required 20% to 50% CV penetration rates to outperform the state-of-the-art signal systems ( 8 , 17 , 20 , 21 ). This high requirement of CV penetration rate is not achievable in the near future; thus, several studies integrated a secondary data source such as detector data ( 21 – 23 ) or historical traffic data ( 24 ) with the available CV data to compensate for the limited data in low CV penetration rate. Lee et al. ( 21 ) utilized loop detector and CV data to count total vehicles and cumulative travel time respectively within an approach. They showed a 2% reduction in travel time at 30% CV penetration rates compared with actuated signal control systems. Mohebifard et al. ( 23 ) showed a gradual improvement in delay and travel time with more than 20% penetration rate by integrating detector data. Furthermore, fusing loop detector data in a CV-based signal control strategy allowed Islam et al. ( 16 ) to reduce the required CV penetration rate from 40% to 10%. The proposed model in Feng et al. ( 24 ) also outperformed well-tuned actuated control at 10% CV penetration rates by utilizing historical data and CV trajectories.
Multiple studies have focused on using practical network performance evaluations for signal coordination ( 9 ), transit signal priority ( 25 ), and manual signal control during nonrecurrent traffic congestion ( 26 ). To be consistent with the performance measures used in practice, Day et al. ( 27 ) compared several operational strategies in relation to progression quality along an arterial street. Similarly, Day et al. ( 9 ) assessed the effects of signal timing modifications on the travel time reliability and progression quality. Zheng et al. ( 28 ) proposed an event-based performance diagnosis tool for identifying possible improvement potentials by tuning signal timings. Correspondingly, Smaglik et al. ( 11 ) developed several tools to quantify capacity utilization at signalized intersections in a corridor. Remias et al. ( 10 ) assessed the reliability of adaptive signals by analyzing travel times of probe vehicles in a corridor. In contrast with previous studies that only used loop detector or probe data, Beak et al. ( 29 ) compared the progression quality of a CV-based signal system under different strategies, namely free and coordinated operations. Li et al. ( 30 ) demonstrated the use of progression quality for optimizing platoon priority-based offset optimization in a CV environment. Day et al. ( 31 ) also examined the feasibility of offset optimization using CV data at different penetration rates based on travel time reliability.
Despite tremendous efforts in incorporating CV data in signal control, the previous studies did not provide a comprehensive analysis of CV penetration rate and traffic observability impacts on adaptive traffic signal control systems. This paper aims to bridge this gap and quantify the effects of traffic observability on mobility, traffic progression, and travel time reliability. Furthermore, the paper quantifies those effects at vehicle-class and arterial direction (i.e., major and minor) levels. This detailed analysis is required to determine whether the same potential network-level effects will be observed in different directions or different vehicle classes.
Experiment Design
Signal Control Strategy
We utilize an adaptive traffic control system developed in our previous work ( 14 – 16 ) in this study. The signal control approach has the capability of controlling signals with (a) loop detector data, (b) CV data, or (c) CV and loop detector data. CV data refers to the information that CVs share about their speeds, accelerations, and positions every 0.1 s through the basic safety message (BSM) using vehicle-to-infrastructure communication. Figure 1 shows the flow of information in the signal control approach. Note that the figure shows the flow of information based on the availability of both loop detector and CV data for completeness, but any of the data sources can be unavailable. The signal controller only processes available data sources and aims at maximizing the number of completed trips throughout the arterial street following recommendations made in Hajbabaie et al. ( 32 – 34 ).
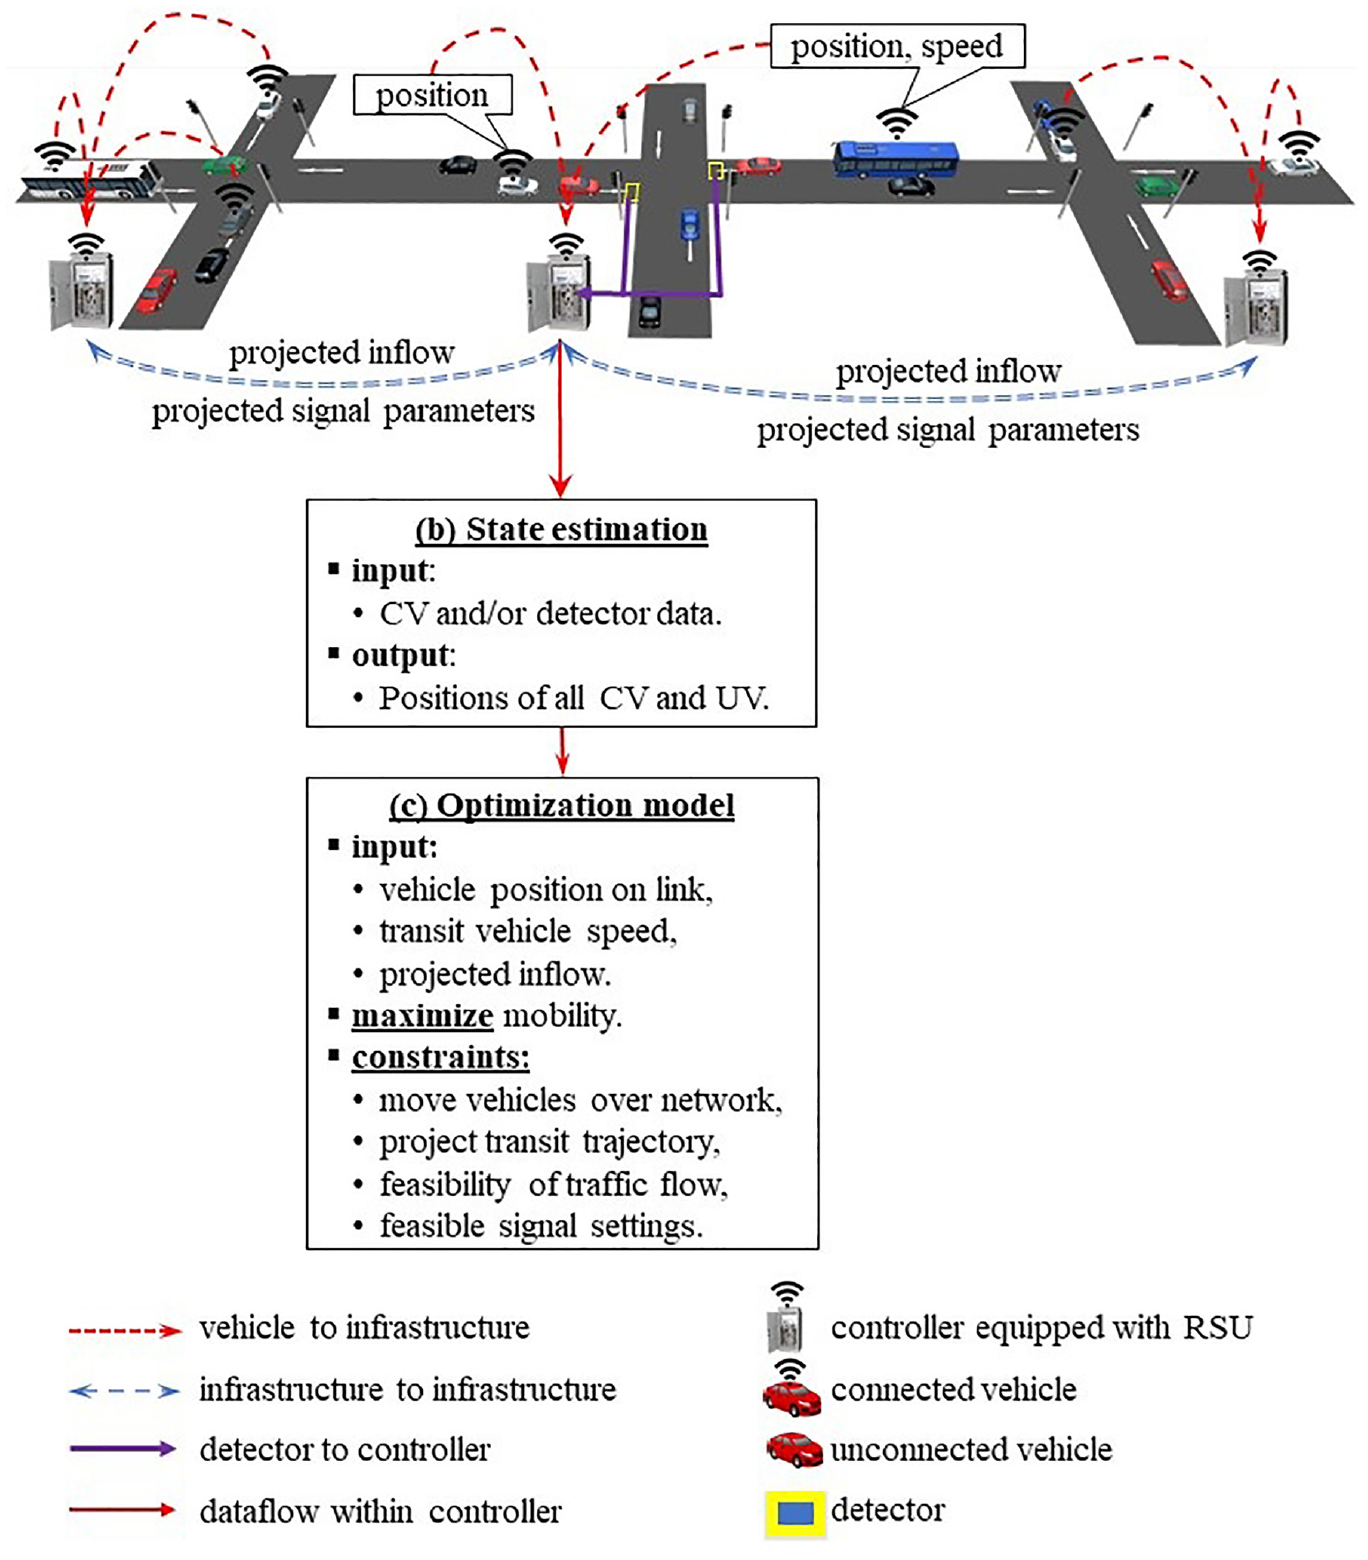
Control system for an adaptive signal control approach.
The adaptive signal controller follows a receding horizon control framework. At each time-step, the controller observes traffic conditions in the network, optimizes signals over a prediction horizon, and makes a decision on extending or switching the signals in the next time-step. This process continues time-step by time-step. The signal controller maps the position of incoming CVs and transit vehicles (on receiving BSMs from them) to different links on each approach of the intersection. The positions of unconnected vehicles (UVs) are estimated by detection on advanced loop detectors placed upstream of an intersection and converting the temporal distribution of vehicle detections to a spatial distribution of vehicles over links, based on which, vehicle occupancy on the corresponding links is estimated. More information on the conversion of temporal to spatial distribution is available in Islam et al. ( 16 ). Similarly, communication among adjacent intersection controllers enables them to project the number of incoming vehicles from different approaches to an intersection. Once the initial inputs (i.e., vehicle occupancy over the approaching links, projected inflows and the position of the transit vehicles) are estimated, each intersection controller minimizes the travel time of all passengers in the intersection over a prediction horizon. Note that the optimization programs follow the same structure at different intersections; however, their inputs are different. Within the prediction horizon, the optimization program updates the occupancy of vehicles over the links and projects the position of transit vehicles considering the speed and vehicle occupancy differences among different classes of vehicles. The algorithm finally finds the non-conflicting movements that should get green for the next few seconds to optimize the objective of the program. Note that the adaptive controller optimizes the sequence and duration of each phase within the specified minimum and maximum values for green times.
At 100% CV market penetration rate, the algorithm can correctly map the position of vehicles for the optimization program. On the other hand, a decreasing CV penetration rate makes the methodology more dependent on the loop detector data.
Data Sources
We use two sources of data in this paper: CV and loop detector data. We have assumed that detectors are placed at stop-bars in this paper. Other detector layouts can be used as well. More details follow.
Loop detector data: The signal controllers receive vehicle actuation from stop-bar detectors placed at their upstream intersections. The detection is transmitted between intersections using infrastructure-to-infrastructure communications. Then, the signal controllers estimate the position of vehicles over a link based on their actuation times on upstream detectors and optimize signal timing parameters. The position estimations are based on the assumption that vehicles are distributed on a link following the actuation distribution.
CV data: The signal controllers receive the speed and position of incoming CVs and transit vehicles through vehicle-to-infrastructure communications. Then, the signal controllers estimate the number of vehicles arriving at the intersection, based on which, signal timing parameters are optimized. The intersection controllers estimate the number of vehicles that are expected to arrive on the coordinated approaches in the near future based on the projected outflows from adjacent intersections using infrastructure-to-infrastructure communications. We divide all the intersections in the network into intersection groups based on the distance among adjacent intersections ( 35 ) for coordination purposes. When the distance between two adjacent intersections is more than 2500 ft, a new group is generated and the intersections within a group share the data of the projected vehicle flow.
CV and loop detector data: The signal controllers collect the detection times from detectors upstream of a link along with speed and position of CVs and transit vehicles that are within the communication range. The signal controllers integrate loop detector and CV data to achieve a higher degree of observability. The signal controllers estimate the position of UVs over the approaching links based on the distribution of vehicle detections on detectors and the position of CVs.
Performance Measures
We have implemented the adaptive signal control approach in Vissim ( 36 ) to determine the mobility, progression quality, and travel time reliability measures. We have used travel time, delay, and number of completed trips for different modes as three aggregated mobility performance measures.
Event-based measures allow assessing progression quality and capacity utilization of a signalized intersection ( 27 ). We use the Purdue coordination diagram (PCD) ( 37 ) to visualize and evaluate the progression quality. PCD illustrates vehicle arrivals relative to the green signal duration in a cycle against the study period. As the adaptive signal control of this study does not follow a fixed sequence of phasing, we define cycle as the duration between two consecutive occurrences of green signals on the major phase in an intersection. The beginning-of-green (BOG) and end-of-green (EOG) times corresponding to each cycle show the signal status during vehicle arrivals. We further quantified the progression quality by two metrics: the green-to-cycle duration ratio (g/C), and volume-to-capacity ratio (v/c). The g/C illustrates the percentage of green times allocated to a phase, and the v/c ratio shows the effectiveness of using the green times ( 27 ).
We assess the travel time reliability based on CDF of travel times along the arterial street as suggested by several researchers ( 38 – 41 ). We also report the level of travel time reliability (LOTTR) index, which is the ratio of the 80th to the 50th percentile of travel times. LOTTR values less than 1.5, which is recommended by the National Performance Management Measures ( 42 ), show a reliable travel time performance.
Case Study
Study Corridor and Traffic Conditions
The case study arterial street is a portion of the SR-522 corridor in Seattle, Washington, as shown in Figure 2a. The study area consists of bidirectional movements with two- to three-lane segments and 10 signalized intersections. The arterial street is a heavily used commuter route that connects Seattle to Kenmore and Bothell. We use p.m. peak volumes that are provided by the Washington State Department of Transportation; see Figure 2a. The network is loaded with 8292 passenger cars and 59 transit buses for 1 hour according to the p.m. peak volume data. The arterial has 18 origins and 18 destinations as shown in Figure 2b.

Case study network: (a) study network with peak hour volume in SR-522, Seattle, Washington, (b) bus routes, intersection groups, origins, and destinations in SR-522, Seattle, Washington, and (c) all movements corresponding to each intersection.
Transit Bus Operations
Figure 2b shows seven bus routes over the corridor and their corresponding bus headways. Furthermore, we assume that all the transit buses are connected and their passenger occupancy can be communicated with signal controllers. Further details are presented in Table 1.
Case Study Information

Simulation Setup
We implemented the proposed approach in Vissim ( 36 ) using the component object model (COM) interface. The COM interface allows collecting data from the simulated network and implementing the signal indications based on the outputs of the adaptive signal control system. We created a new vehicle type for CVs in Vissim and allowed these vehicles to share their speeds and positions every 0.1 s (resolution of vehicle-to-infrastructure communication) through the COM interface. Furthermore, loop detectors were placed on links, which allowed traffic signals to collect vehicle detections. Therefore, CV and loop detector data are used to estimate traffic state over links via the COM interface. Furthermore, we created an information sharing environment following an infrastructure-to-infrastructure communication scheme whereby optimization programs of adjacent intersections share information to estimate the number of vehicle arrivals on the coordinated approaches in the near future. Finally, the optimization program corresponding to each intersection is solved, and optimal signal timings are sent back to Vissim to be implemented in traffic lights. We considered 11 CV market penetration rates (from 0% to 100% at 10% increments), and each simulation scenario was replicated three times with different random seeds. Note that we used Vissim default values in the simulation runs as we are interested in relative differences rather than absolute values. We made some comparisons with a calibrated Vissim model based on the study of Park and Schneeberger ( 43 ) and observed that delay and number of completed trips were less than 4% different.
Results
Mobility Performance
Table 2 shows the total delay (for major and minor directions separately) and the number of completed trips (for the entire arterial) obtained using the adaptive signal controller with (a) loop detector data, (b) CV data, and (c) CV and loop detector data. The results show that the adaptive control with integrated CV and loop detector data reduced the total delay between 1% and 31% compared with the adaptive signal control using solely loop detector data in the major direction. The total delay reduction in the minor direction was more significant. While the savings on the major direction may seem negligible up to 20% CV penetration rate, even a 10% CV market share reduced total travel time by 23% in the minor directions. This saving is significant and often ignored when a system-level analysis is done without analyzing different directions.
Network Observability Effects on Traffic Performance

Note: CV = connected vehicle; diff. = difference; na = not applicable.
Performance corresponding to adaptive signal control with loop detector data.
The results also show that the adaptive control with CV-only data had higher delay than loop detector data at low penetration rates ranging from 0% up to 30% in the major direction. A similar trend was observed in the minor direction up to 20% CV market share. The delay reductions were similar for CV market shares of more than 50%, with or without using loop detector data, indicating that incorporating loop detector data into CV data had negligible contributions to reducing delays at high CV penetration rates. Moreover, the adaptive signal control with a combination of CV and loop detector data consistently increased the total number of completed trips between 2% to 3% compared with the adaptive control with only loop detector data. On the other hand, the adaptive signal control using solely CV data required a 30% penetration rate to outperform the control with only loop detector data.
Average delays and travel times in the adaptive signal control for each vehicle class (i.e., passenger cars and transit buses), analysis scope (i.e., the entire network, major direction, and minor direction), data source (i.e., loop detector, CV-only, and CV and loop detector), and CV penetration rate (0% to 100%) are shown in Figure 3. The main findings follow.
Passenger cars: Integrating CV and loop detector data resulted in lower average travel times and delays compared with using only CV data in both major and minor directions up to 40%–50% CV market shares. Beyond this market share range, the average travel times and delays were similar. This observation was expected because integrating CV and loop detector data resulted in higher observability when there were not enough CVs in the traffic stream. The additional information provided by the loop detectors at CV penetration rates above 50% was marginal and did not yield significant changes in the average delays or travel times.
Transit buses: Integrating CV and detector data yielded lower average bus travel times and delays for CV market shares of up to 20%–30% compared with using CV-only data. This trend is observed by looking at network-level and major-direction-level findings. The changes in travel times and delays in the minor directions did not show a consistent trend by changing the CV market share. The inconsistency may be a result of a smaller hourly transit volume in the minor directions (24 transit buses per hour) compared with the major directions (40 transit buses per hour). Therefore, the signal controller prioritized the major direction where higher delays or travel times could be reduced. The discussion can be supported by the delay and travel time trends in the major direction where a more consistent decreasing trend was observed.
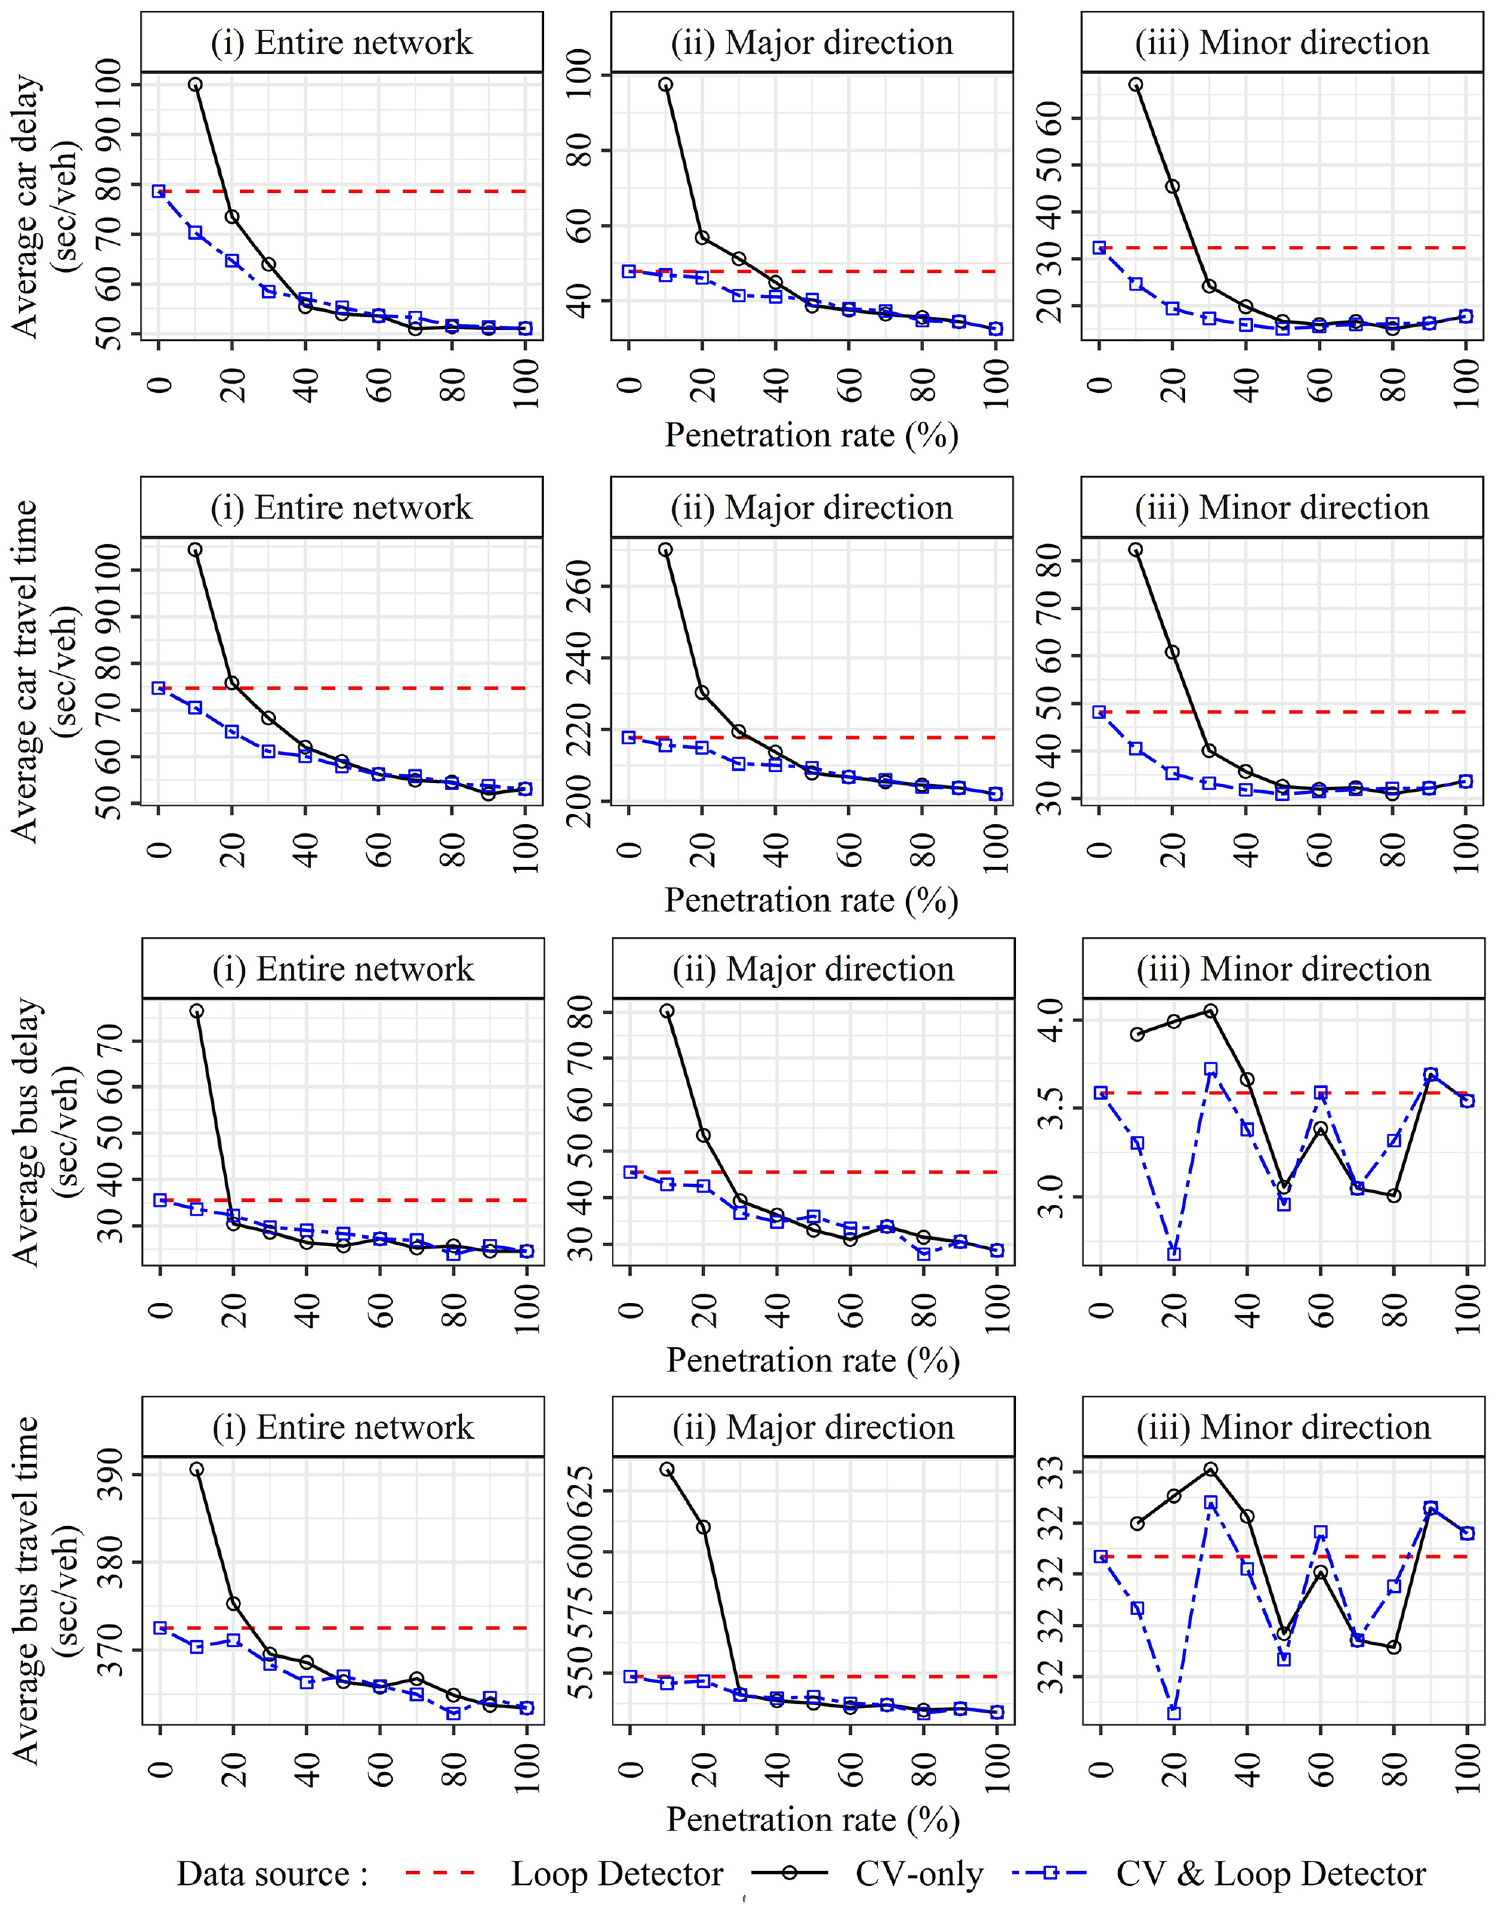
Average delays and travel times in the adaptive control strategy.
Sensitivity to Traffic Demand
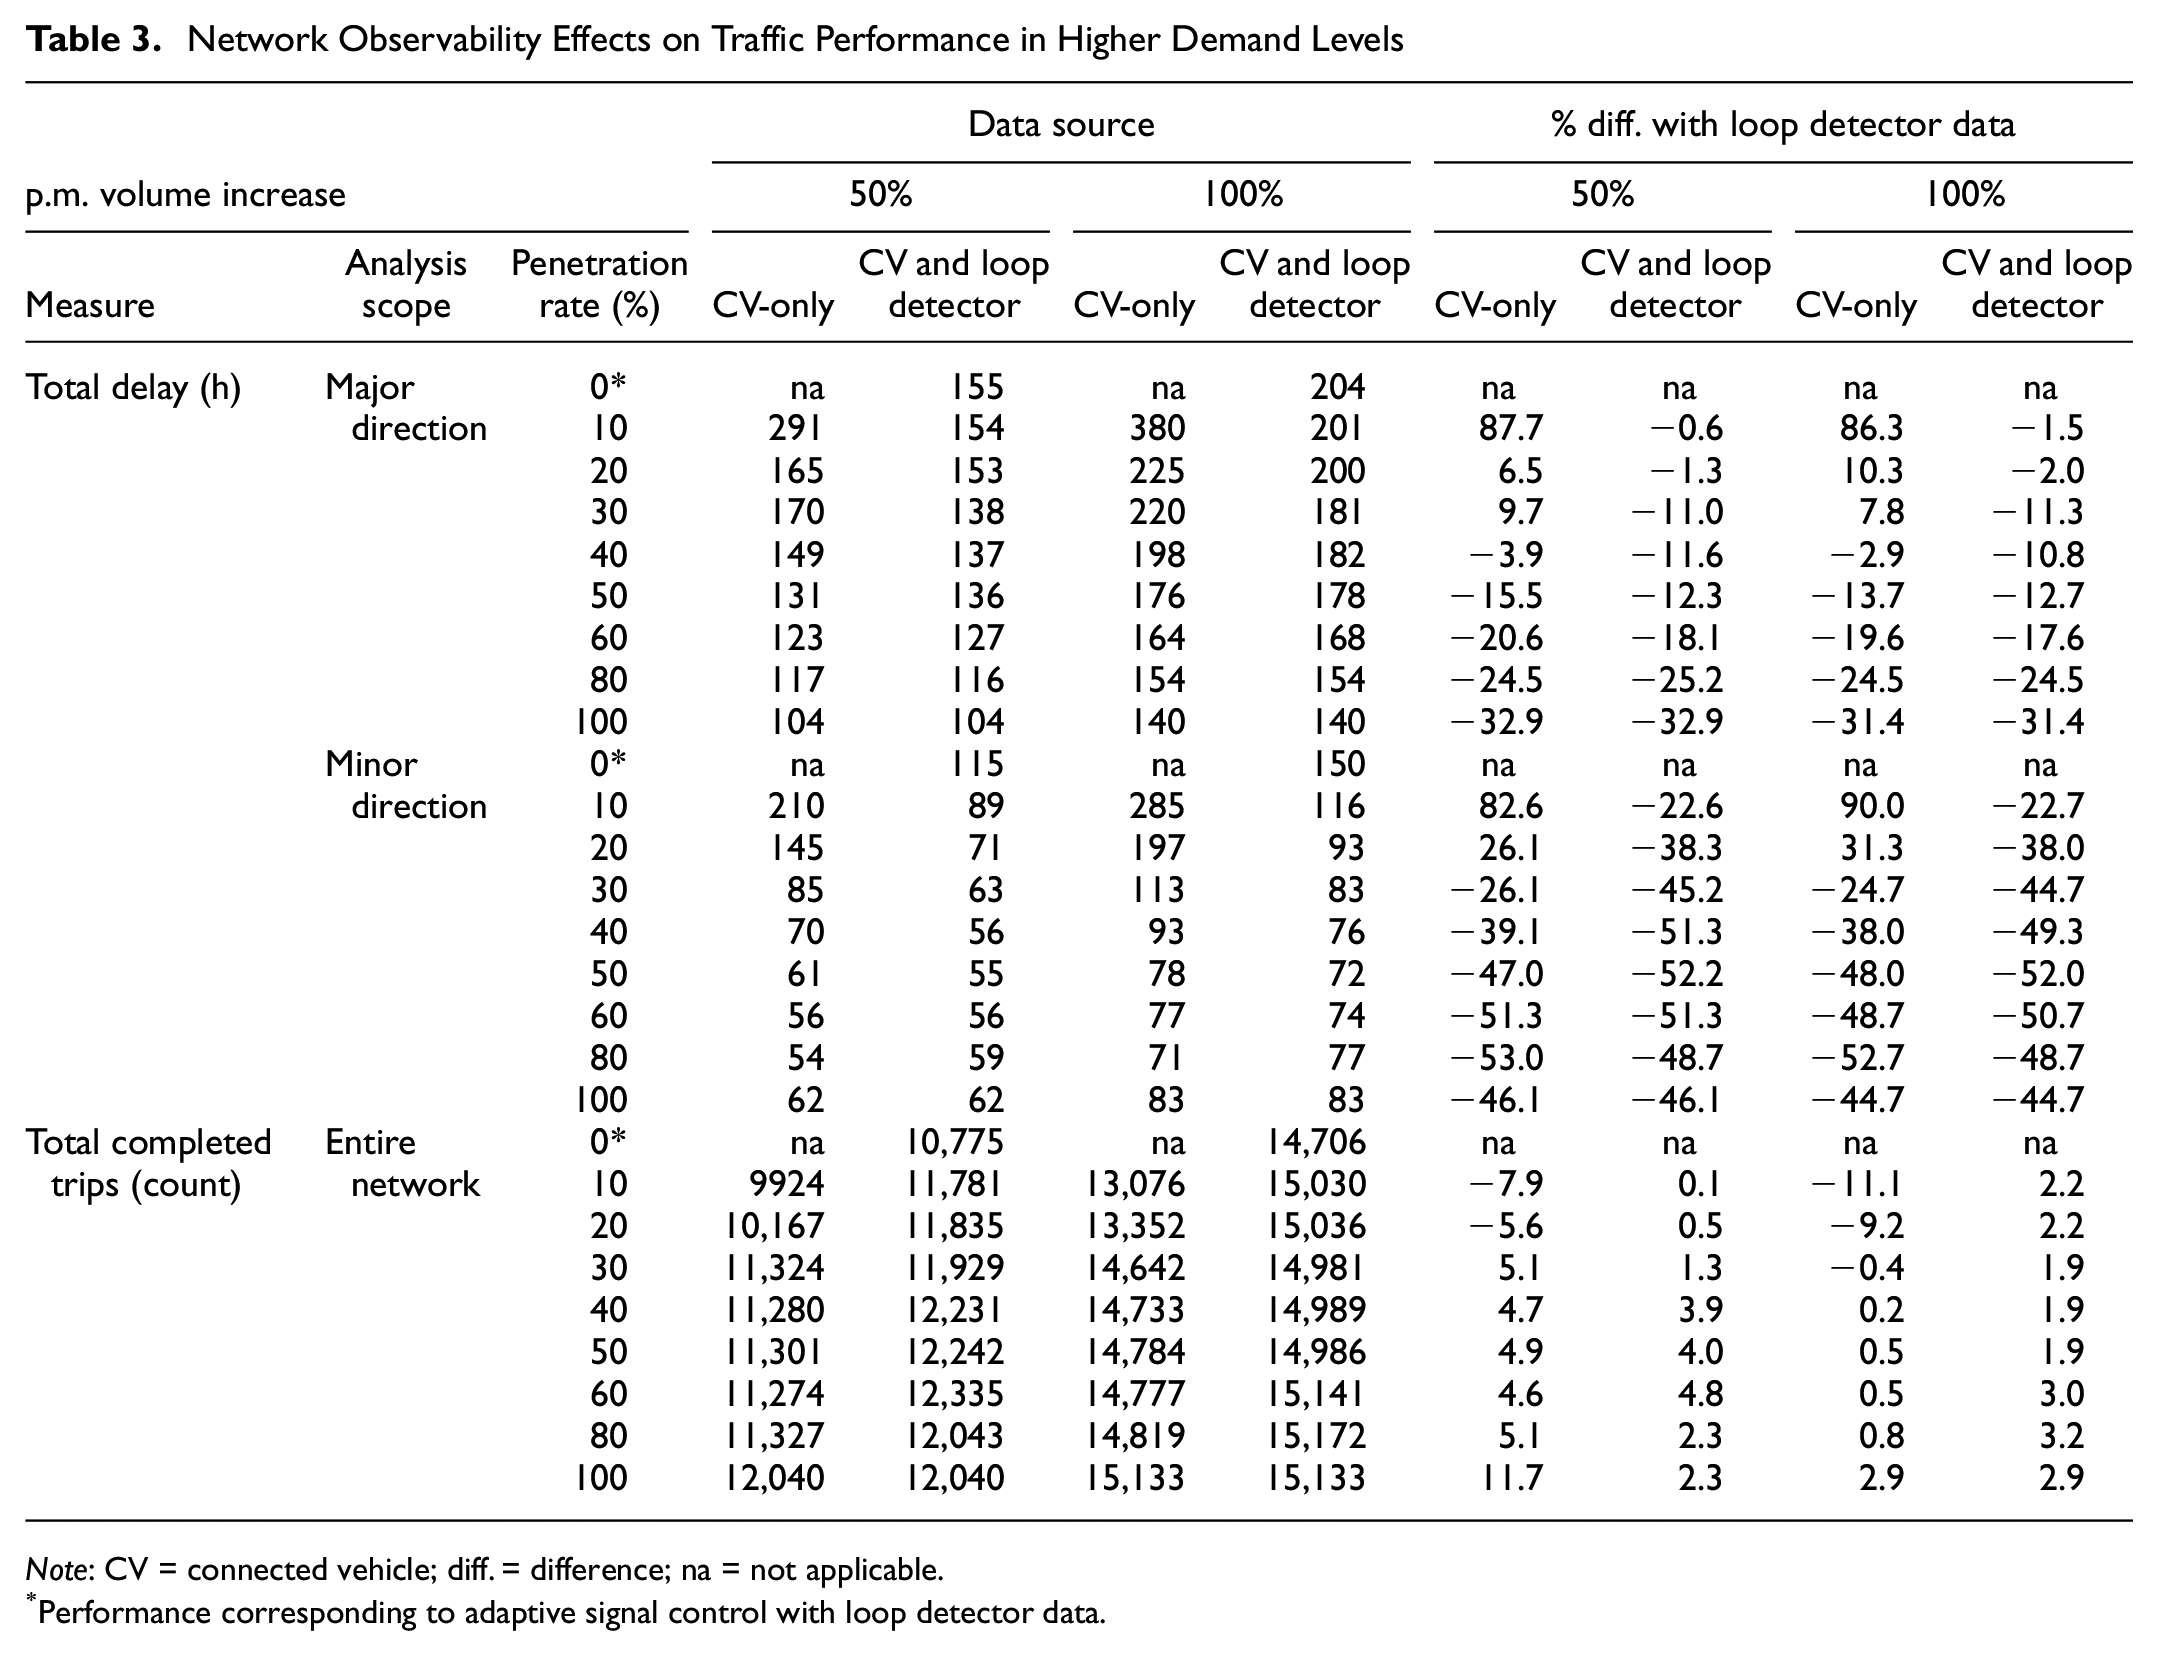
Table 3 shows total delay and completed trips obtained by 50% and 100% increase in the p.m. peak demand. The results indicate that the adaptive signal controller with only CV data required 40% CV market share to outperform the adaptive signal controller with loop detector data for both demand levels. Similar to the p.m. peak demand level, with the integration of CV data with loop detector data, the signal controller consistently outperformed the signal controller with loop detector data. For instance, the signal controller with CV and loop detector data reduced total delay by 33% and 31% on the major direction for 50% and 100% increase of the p.m. peak demand levels, respectively. Other mobility performance measures showed similar trends.
Network Observability Effects on Traffic Performance in Higher Demand Levels
Note: CV = connected vehicle; diff. = difference; na = not applicable.
Performance corresponding to adaptive signal control with loop detector data.
Progression Quality
PCDs for four sample intersections are shown in Figure 4. The PCDs are drawn for both through movements on the major direction for the signal control with CV-only data and a market share of 30%. This case represents the minimum penetration rate that provides a comparable mobility performance to signal control based on only loop detector data; see Figure 3. Intersections 1 and 10 are located at the entry points of the arterial street. Therefore, large gaps are observed between vehicles entering the arterial street (see intersection 1 westbound and intersection 10 eastbound). We observe a high progression quality for coordinated movements. For instance, 70% of vehicles arrive during the green times at intersection 2. Similarly, 80% of vehicles arrive on the green on eastbound through movement of intersection 1 and 82% on westbound through movement of intersection 10. Note that intersection 6 was more than 2500 ft away from upstream and downstream intersections and was not coordinated. The signal progression is achieved by sharing data through infrastructure-to-infrastructure communications between adjacent intersections.
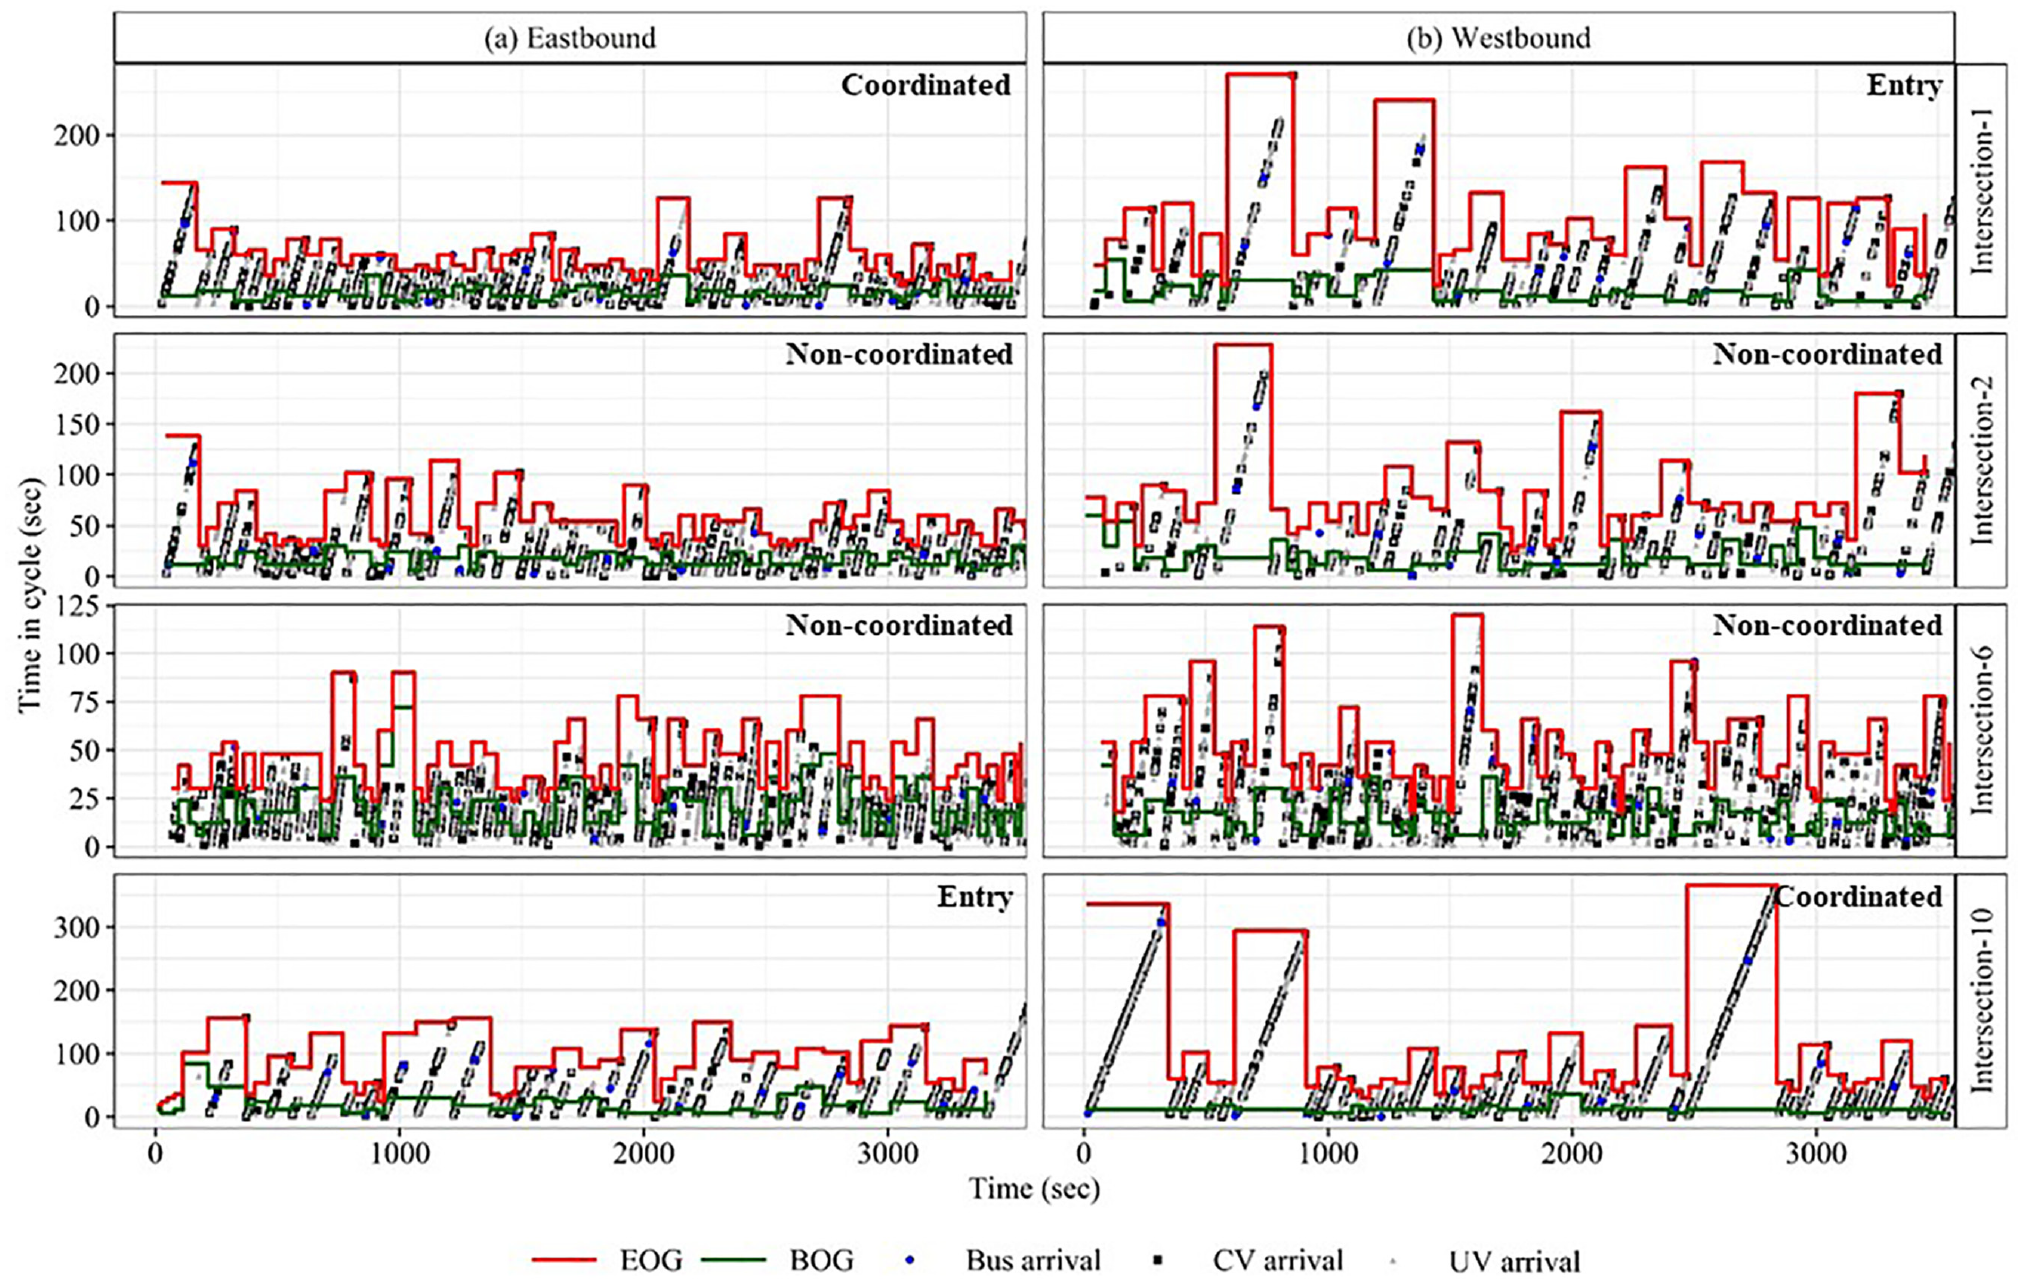
Purdue coordination diagrams (PCDs) for the signal control with CV-only data and 30% penetration rate.
Figure 5 shows green-to-cycle length (g/C) and volume-to-capacity (v/c) ratios for the adaptive signal control strategy with all three data sources. The metrics are for signal phases in the major directions of intersections 1 to 6. The adaptive signal control with CV and detector data resulted in higher g/C ratios compared with using loop detector data; see Figure 5a. This observation indicates that the adaptive control strategy effectively utilized the green times to prioritize processing vehicles in the major directions. Moreover, intersections 4 and 5 had lower g/C ratios because of high volumes on the minor directions and greater turning ratios compared with other intersections. Furthermore, Figure 5b shows that the average v/c ratios corresponding to all the movements are less than 0.80, indicating that signal controllers managed to operate under capacity and vehicle queues were not considerable ( 44 ) on the major directions. On the other hand, the ratios were above 1 at the westbound direction of intersection 6 for 132 cycles, indicating residual queues at the end of the cycles. This observation is expected because of the high left-turning volume from the eastbound direction.

Green-to-cycle length (g/C) and volume-to-capacity (v/c) ratios for adaptive and actuated control strategies: (a) g/C ratio and (b) v/c ratio.
Travel Time Reliability
Figure 6 shows CDFs of travel time of each vehicle class in the arterial street. Overall, CDFs show an improvement in travel time reliability as the CV market share increases. However, different CV market shares led to more significant changes in CDFs when only CV data was used for traffic control as opposed to integrated CV and loop detector data. In fact, a significant improvement in travel time reliability (i.e., a reduction in standard deviations in travel times) was observed when CV market share increased from 10% to 40% for the CV-only case.
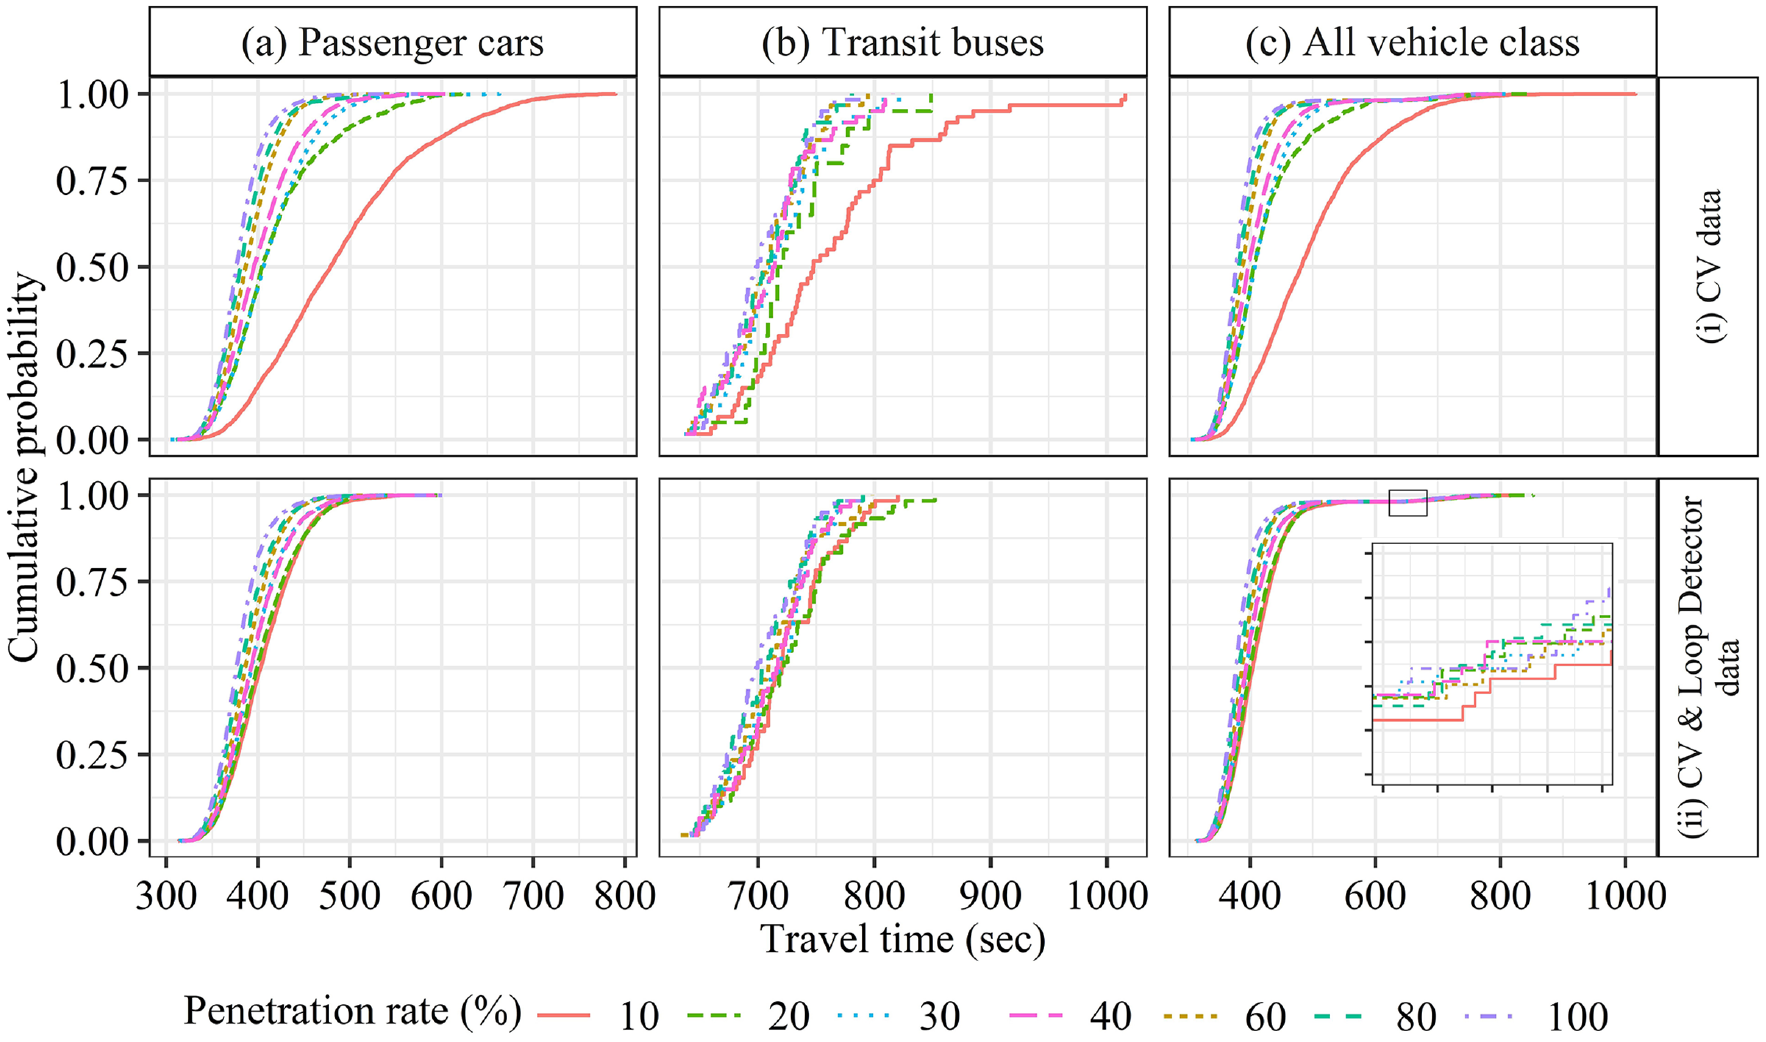
Travel time cumulative distribution functions for adaptive signal timing strategy.
A slight inflection is observed around 650 s for both cases of signal control systems. The shapes slightly depart from the classic S-curve because of their bi-modal travel times corresponding to passenger cars and transit buses. Note that buses have a lower speed than passenger cars. As such, the resulting CDFs corresponding to all vehicles in the network captured the bi-modal properties in the travel times.
The aggregated CDFs in part (c) did not represent a normal distribution since the upper part of the CDFs associated with high travel times were longer than the lower part of the distributions. This observation was expected because the free-flow speed of transit buses was lower than passenger cars and therefore the number of vehicles with high travel times was more than could be expected from a normal distribution.
Table 4 provides further numerical analyses for travel times. The LOTTR index in all of the evaluated scenarios was less than 1.5, which is the threshold suggested by the National Performance Management Measures ( 42 ). Therefore, the travel time reliability of the control strategy was within an acceptable range. For passenger cars, LOTTR shows a decreasing trend with the CV market share. This trend supports the proposition that increasing CV market share improved travel time reliability.
Level of Travel Time Reliability (LOTTR) Index for Different Connected Vehicle (CV) Penetration Rates and Vehicle Classes

Note: na = not applicable.
The range of LOTTR variation for passenger cars was between 1.056 and 1.181, while this range was between 1.030 and 1.086 for transit buses. Therefore, transit buses had more reliable travel times compared with passenger cars across different CV penetration rates and data sources. The reason for this observation was that transit buses were all connected, so signal timings could effectively accommodate them. The adaptive signal control based on solely CV data requires 40% CV penetration rates to yield an LOTTR index lower than using only detector data for passenger cars.
Conclusions
This study investigated the effects of traffic observability on mobility, traffic progression, and travel time reliability, and quantified those effects at vehicle-class and arterial direction levels. This research considered three sources of data: (1) loop detector data, (2) CV data, and (3) CV and loop detector data. The performance of the adaptive signal control system was evaluated in a 10-intersection arterial street in Seattle, Washington using the p.m. peak volume and transit bus frequencies under various market penetration rates of CVs.
The mobility performance measures improved with an increase in the CV penetration rate. The inclusion of loop detector data made a significant difference in the performance in CV market penetration rates ranging up to 40%–50%. Beyond that point, the inclusion of loop detector data did not change the performance. High g/C ratios and low v/c ratios on coordinated phases with CV data suggested a high signal progression quality compared with using only loop detector data. A 40% CV market share was required for the adaptive signal control system to yield more reliable travel times than using detector data alone. We observed a lower LOTTR value for transit buses compared with passenger cars, indicating that the travel times of transit buses were more reliable than passenger cars across different CV penetration rates and data sources.
This research focused on traffic observability in an arterial street with passenger cars and transit buses. Furthermore, research is needed with more general settings with pedestrians, emergency vehicles, and freight trucks. The impacts of disruptions and delays in communications among vehicles and infrastructure should be further studied in the future. The effects of connectivity on intersection control with automated vehicles ( 45 , 46 ) should be studied in future research as well.
Footnotes
Acknowledgements
The authors are grateful for the financial support of the Washington State Department of Transportation (WSDOT) that sponsored this research. This work represents a portion of a larger project on “Preparing for Traffic Signal Operations in a Multi-Modal Connected and Autonomous Vehicle Environment.”
Author Contributions
The authors confirm contribution to the paper as follows: study conception and design: S. Islam, A. Hajbabaie; data collection: S. Islam, A. Hajbabaie; analysis and interpretation of results: S. Islam, M. Tajalli, R. Mohebifard, A. Hajbabaie; draft manuscript preparation: S. Islam, M. Tajalli, R. Mohebifard, A. Hajbabaie. All authors reviewed the results and approved the final version of the manuscript.
Declaration of Conflicting Interests
The author(s) declared no potential conflicts of interest with respect to the research, authorship, and/or publication of this article.
Funding
The author(s) disclosed receipt of the following financial support for the research, authorship, and/or publication of this article: This project was funded by Washington State Department of Transportation with project number GCB3265.
The opinions and conclusions stated in this paper strictly reflect those of the authors and not of WSDOT or its constituent members.