



Abstract
Traffic queues, especially queues caused by non-recurrent events such as incidents, are unexpected to high-speed drivers approaching the end of queue (EOQ) and become safety concerns. Though the topic has been extensively studied, the identification of EOQ has been limited by the spatial-temporal resolution of traditional data sources. This study explores the potential of location-based crowdsourced data, specifically Waze user reports. It presents a dynamic clustering algorithm that can group the location-based reports in real time and identify the spatial-temporal extent of congestion as well as the EOQ. The algorithm is a spatial-temporal extension of the density-based spatial clustering of applications with noise (DBSCAN) algorithm for real-time streaming data with an adaptive threshold selection procedure. The proposed method was tested with 34 traffic congestion cases in the Knoxville,Tennessee area of the United States. It is demonstrated that the algorithm can effectively detect spatial-temporal extent of congestion based on Waze report clusters and identify EOQ in real-time. The Waze report-based detection are compared to the detection based on roadside sensor data. The results are promising: The EOQ identification time of Waze is similar to the EOQ detection time of traffic sensor data, with only 1.1 min difference on average. In addition, Waze generates 1.9 EOQ detection points every mile, compared to 1.8 detection points generated by traffic sensor data, suggesting the two data sources are comparable in respect of reporting frequency. The results indicate that Waze is a valuable complementary source for EOQ detection where no traffic sensors are installed.
Traffic congestion, especially non-recurring congestion such as congestion that caused incidents, is a major source of uncertainty in freeway operations. It leads to much longer delays as well as increasing the likelihood of rear-end crashes. To protect the drivers approaching the congestion, an end of queue (EOQ) warning system is generally deployed. The system alerts drivers of slowdown traffic ahead using devices such as variable message signs. Proper deployment of an EOQ warning system can reduce crashes by up to 45% ( 1 , 2 ). The warning system requires accurate information about the spatial-temporal movement of the slowdown traffic on a real-time basis.
Prior research has been conducted to identify or predict queue movement in real time with a focus on signalized intersections and freeway work zones (3–5). Limited studies have been dedicated to the more general analysis of freeway traffic queues ( 6 , 7 ). Most of the developed methodologies rely on fixed traffic sensor data to estimate the temporal and spatial extent of congestion and identify queue locations (7–9). The detection accuracy of those methodologies is restricted by the spatial and temporal resolutions of traffic sensors.
Recently, several studies have explored the potential of new crowdsourced data sources in estimating queue movement and detecting traffic events and congestion ( 4 , 10–16). One of the studies used crowdsourced probe data to identify shock waves. It proposed a “delta speeds” method to differentiate between congested and uncongested traffic ( 16 ). It has been shown that incorporating traffic information from crowdsourced data, especially probe vehicle data, has great potential for improving the estimation accuracy of traffic situations, especially where no traffic detectors are installed. A concern of probe-based EOQ detection is, again, the spatial accuracy. Usually, probe data have predefined road segmentation, which limits the spatial resolution.
Waze, a GPS-based application, is one of the most popular navigation applications used by drivers in the United States (U.S.). It collects users’ speed and GPS location information to detect the current traffic status and provide route guidance to users. A distinctive feature of Waze is it allows users to report traffic information by adding geometry points on a Waze map to indicate hazards, accidents, traffic jams, or police appearances. Each individual report provides the exact location and time, and thus can be viewed as a piece of location-based probe vehicle information. Waze has established partnerships with local government agencies through the Connected Citizen Program and provides real-time feeds for those reports to government agencies.
Compared with the traditional data sources, an advantage of Waze reports is that they provide real-time location-based data and have high road network coverage. Waze reports provide data covering interstate and urban roads where no traffic surveillance system is installed, and thus can be a valuable data source for traffic operation. Although Waze data have been used for different purposes, it mainly serves as complementary to existing incident databases ( 17 , 18 ). However, before incorporating the Waze reports into any application system, it is important to evaluate the data quality. Previous research has been conducted to evaluate the quality and accuracy of Waze data (18–20). It was found that 0.3% of the reports were false reports ( 18 ). The low false alarm rates, as well as high spatial-temporal accuracy, prove that Waze reports are reliable sources for real-time operation systems ( 18 ).
This study proposes a clustering algorithm to identify congestion and EOQ using Waze reports. Space-time interaction arises when nearby reports occur at about the same time. Two reports that are spatially and temporally close to each other may indicate that two drivers are within the same queue caused by a particular incident and thus can be associated with one another. By recursively associating and clustering the Waze reports in both spatial and temporal dimensions, it is possible to identify the spatial-temporal extent of congestion and track the movement of traffic queues.
The rest of the paper is organized as follows. The next section presents a review of relevant literature. This is followed by a comparison of Waze jam reports with traffic sensor data. Then, a real-time spatial-temporal density-based spatial clustering of applications with noise (DBSCAN) algorithm is proposed to cluster Waze reports. The next section presents a case study that applies the proposed methodology to cluster Waze reports and identify the EOQ in real time. Next, the detection results are compared against detections from traditional traffic sensor data. Finally, the last section concludes this article and provides directions for future work.
Literature Review
Spatial-temporal clustering has been a major research field of spatial-temporal data mining and knowledge discovery. Spatial-temporal studies aim to find spatial-temporal patterns and identify spatial-temporal clusters. Compared with a conventional one-dimension cluster, clusters with an additional time dimension can be used to track the evolution of clusters over time and reveal both spatial and temporal trend patterns of data. Traffic on roads exhibits obvious spatial-temporal patterns; traffic queue formation and dissipation is a typical spatial-temporal motion that contains interesting patterns to be mined ( 21 ).
Spatial-temporal data are generally classified into five different types: spatial-temporal event, geo-referenced variables, geo-referenced time series, moving objects, and trajectories ( 22 , 23 ). The Waze report belongs to the basic type: spatial-temporal event. Each event is static and associated with the location where it was recorded and a corresponding timestamp. Finding a cluster among spatial-temporal events is to discover groups of elements that lie close both in time and in space, and possibly share other non-spatial properties ( 22 ).
Existing spatial-temporal event spatial-temporal clustering methods can be classified into three different types: spatial scan methods, distance-based methods, and density-based methods ( 2 , 24–26). Spatial scan statistics search spatial-temporal cylinders (radius determined by spatial distance and height determined by time interval) where the density of events of the same type is higher than the density of events outside the cylinders ( 27 ). The results of this type of method are highly affected by the choice of scanning windows. Distance-based methods usually define a single distance measure that combines both spatial and temporal distances between spatial-temporal objects and uses traditional clustering methods to detect spatial-temporal clusters. However, the single distance measure on many occasions is hard to define ( 28 ). Another type of distance-based method defines a spatial-temporal proximity relationship from spatial and temporal aspects, respectively, by predefined parameters. It begins with assuming the times of occurrence of the spatial-temporal events are distributed randomly across the case location, and assumes the time-space event follows a certain distribution ( 29 ). This is not applicable in the Waze case, since Waze reports are not randomly distributed; they are highly correlated with the traffic status. The third type, density-based method, intends to find densely clustered objects. It is usually derived from a classical DBSCAN algorithm. For instance, spatial-temporal DBSCAN (ST-DBSCAN), an extension of DBSCAN to handle spatial-temporal events, was proposed in multiple different studies for analysis of spatial-temporal events ( 2 , 30 ).
This paper presents a real-time application of ST-DBSCAN. Among different clustering algorithms, ST-DBSCAN is selected because it can discover clusters with arbitrary shapes, which is suitable for identifying congestion since the time-space region of congestion may exhibit various shapes. In this study, the conventional ST-DBSCAN clustering algorithms were improved in three aspects. First, the current clustering algorithm is static and does not meet real-time clustering requirements: a real-time implementation of ST-DBSCAN algorithms is proposed to cluster streaming data. Second, the algorithm parameters are generally determined based on domain knowledge: in this study, an approach is developed to discover Waze user report spatial-temporal patterns and select threshold parameters. Third, instead of using Euclidean distance that is adopted by most DBSCAN-based clustering algorithms, the road network connection is considered, and the realistic road network distance is adopted to measure the distance among reports.
Methodology
Data Description
Waze establishes partnerships with government agencies and provides partners with real-time, anonymous, Waze-generated incident and slowdown traffic information feeds through the Connected Citizen Program (https://www.waze.com/ccp). The information contained in each incident or jam report includes the GPS location, report time to the nearest second, and multiple other variables that are not used in this study. In this study, two types of Waze reports are used: Waze accident reports and Waze jam reports. The accident reports are used because they often indicate the start of a queue. In the following sections, when “jam report” is used, it represents both jam reports and accident reports unless specified.
Clustering Algorithm
This section proposes a dynamic clustering algorithm that can cluster Waze jam reports to determine the spatial-temporal extent of congestion.
Spatial-Temporal Density-Based Spatial Clustering of Applications with Noise (ST-DBSCAN) Algorithm
To support two-dimensional spatial data clustering, Birant and Kut proposed a ST-DBSCAN algorithm that extends the conventional DBSCAN algorithm by adding a temporal dimension to take into account the temporal correlations among objects ( 2 , 30 ). Detailed descriptions of the algorithm can be found in Birant and Kut ( 2 ).
Two parameters are used in the traditional DBSCAN clustering algorithm: ε and minPts. ε specifies the distance threshold. A point
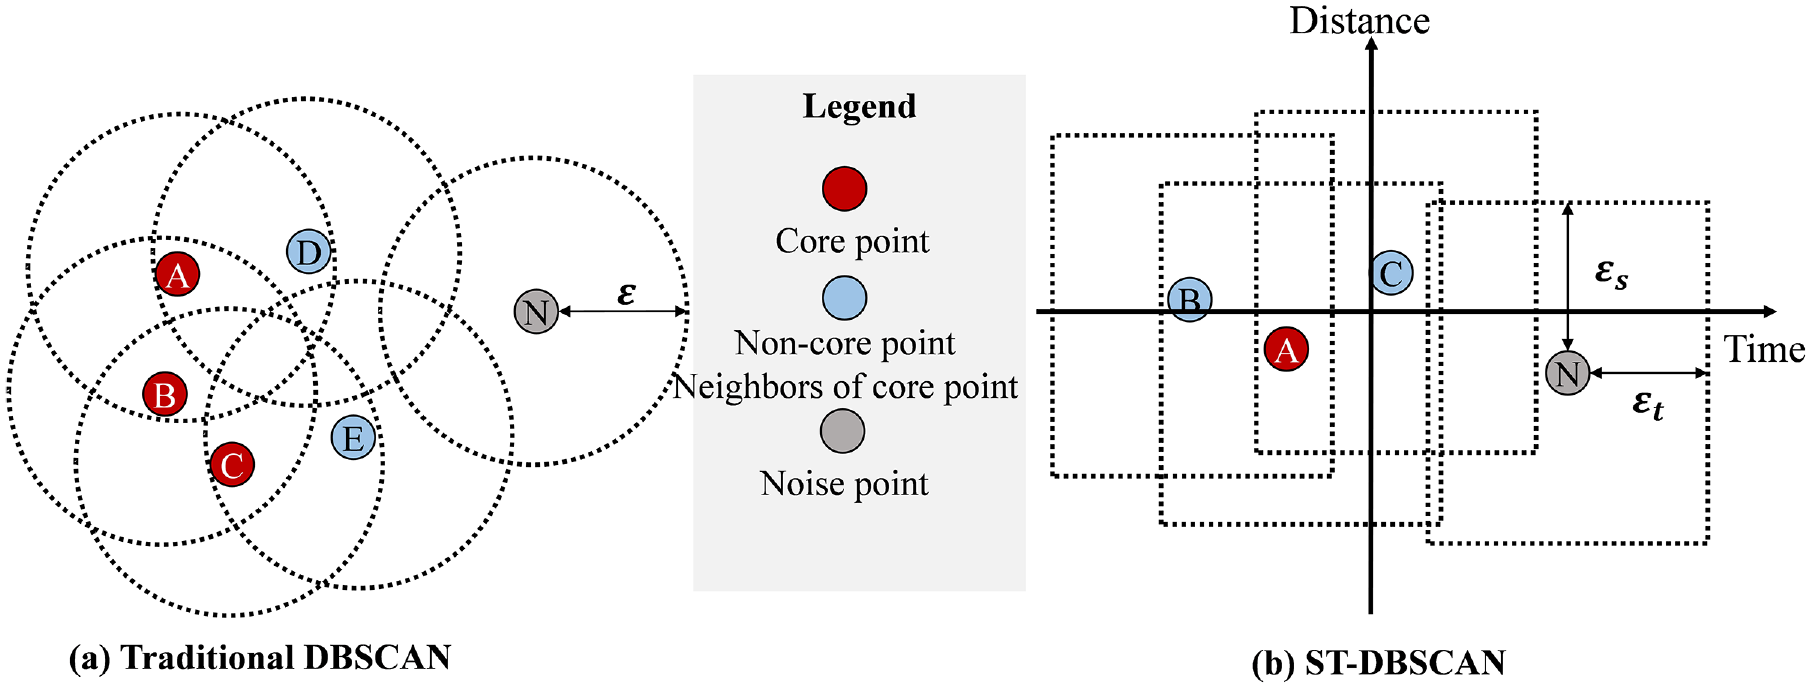
Traditional density-based spatial clustering of applications with noise (DBSCAN) versus spatial-temporal (ST)-DBSCAN.
The main difference between ST-DBSCAN and traditional DBSCAN is that the neighborhood radius ε in DBSCAN is separated into two radii in ST-DBSCAN: the spatial neighborhood radius
Application of ST-DBSCAN to Waze Data
In this study, the proximity of two reports is defined at both the spatial and temporal levels. The construction of distance function and real-time implementation of ST-DBSCAN using Waze data is demonstrated as follows.
Temporal Distances (
)
The temporal distance is computed as the report time differences between every two Waze reports

If
Spatial Distances (
)
The spatial distance is measured by actual road network distance instead of conventional spatial distance, such as Manhattan distance, Euclidean distance, or Minkowski distance, to avoid clusters without road connection ( 31 ). The conventional Dijkstra shortest-path algorithm is implemented to obtain the shortest path between two reports, and the distance of the shortest path represents the spatial distances ( 32 , 33 ).

Dynamic ST-DBSCAN Algorithm
While ST-DBSCAN extends DBSCAN by adding a temporal dimension, it is still a static clustering procedure. This problem demands an algorithm that can be implemented in real time. In addition, the ST-DBSCAN algorithm has difficulties in distinguishing two different clusters that start at different times and locations but propagate and merge into each other over time. To differentiate clusters from one another in this situation, a real-time implementation of ST-DBSCAN is proposed. The algorithm forms clusters dynamically and can differentiate clusters that start at different locations and times.
The pseudocode of the algorithm is described in detail below.
• If all neighbors of point
• If all of the labeled neighbors belong to the same cluster
• If the neighbors of point
Real Time ST-DBSCAN (D,
,
, minPts)
Cluster_id = 0
for each point
mark
if sizeof (
waiting for the next point
else
For each point
if s has label, add s to N_label
else add s to N_unlabel
nCluster = the number of unique clusters in N_label
If nCluster ≡ 0:
Cluster_id = Cluster_id + 1
Label each point in N with Cluster_id
Else if nCluster ≡ 1:
Each point
Else if nCluster > 1:
For each point
Construct a list L
For each point
add (
Sort L ascendingly based on
Threshold Selection
One of the critical problems in the clustering algorithm is selecting reasonable thresholds to form meaningful clusters. In ST-DBSCAN, two thresholds—temporal distance
Figure 2 demonstrates the concept of close and nearest report. The temporal and spatial absolute distance for each report to report

Close and nearest report.
Based on the nearest report concept, the proposed threshold selection procedure is demonstrated below:
ST-Threshold Selection
Initialize a large threshold
Call Real-Time ST-DBSCAN
Return clustering results
Create a ST-Distance-List list
For each cluster
For each report
Identify Nearest Report set NR.
For each report
Compute
Then the threshold
In the ST-threshold selection procedure, the Waze user report patterns are explored. The dynamic clustering is performed with a large temporal-spatial threshold initially. Then, based on the clustering results, for each report
ST-Distance-List shows the report frequency and location of Waze users. For all
End of Queue (EOQ) Identification
The Highway Capacity Manual (HCM) defines that a queue forms if the approaching traffic flow rate exceeds the discharge rate ( 34 ). Slow-moving vehicles joining the rear of the queue are usually considered part of the queue as well. Because the real-time traffic flow rate and discharge rate is hard to determine, in the literature, a queue is generally detected by traffic speed—a queue exists if average traffic speed is lower than a certain threshold. A commonly adopted speed threshold for highways is between 30 mph and 40 mph ( 12 , 35 , 36 ).
In this section, each Waze jam report is treated to have a status of in-queue, meaning that it is assumed that a user is experiencing a traffic queue if they report a jam. Identifying the EOQ is, therefore, identifying the jam reports that comprise the boundary of each cluster. The following procedure is proposed to identify the EOQ dynamically.
The queues that propagate upstream are focused on, and a backward-forming shock wave front is defined. As shown in Figure 3, all points in Figure 3 belong to the same cluster. The red point in Figure 3 is the first report in this cluster. The light green dots comprise the backward-forming shock wave of the cluster; in other words, this is the back of queue. Intuitively, the report that is located at the EOQ is the farthest point from the start point of the queue in the cluster at any time. The mathematical definition is as below.
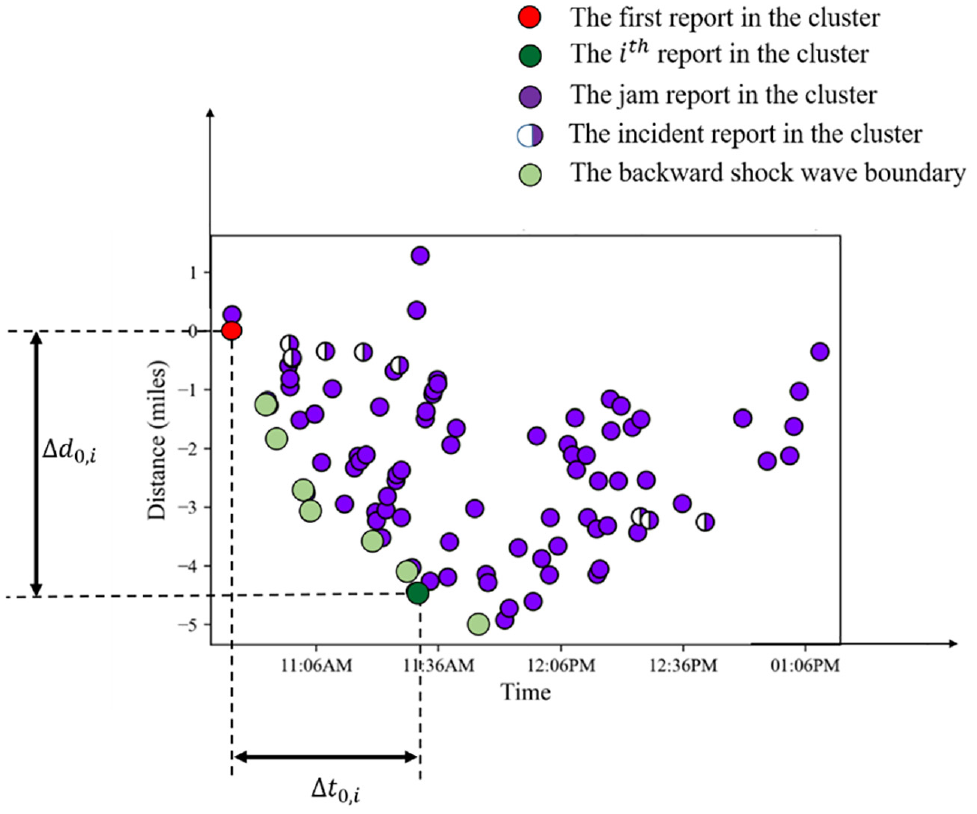
Backward-forming shock wave.
The dark green point in Figure 3 represents the ith report.
Application: Case Study of Knoxville
The city of Knoxville is conveniently located just off the I-40 and I-75, minutes from the I-81, and is within a day’s drive of half the continental U.S. Since the roads in Knoxville are always under excessive pressure at peak hours and the likelihood of incidents and congestion is high, the accurate detection of traffic congestion is important to transportation agencies, engineers, researchers, and planners.
The Waze jam reports used in this study were collected from August 2017 to December 2017 in the Knoxville region. Figure 4 is an overview of the selected region as well as the spatial distribution of jam reports on the road network. In Figure 4, the color scale of the road segment represents the density of Waze reports. The Waze density is calculated as the total number of Waze reports made at a specific location from August 2017 to December 2017. Red represent the highest density level, yellow represents a medium density level, and green represents a low density level. In this section, an implementation of the algorithm using streaming Waze data is demonstrated and the clustering results are presented, as summarized:
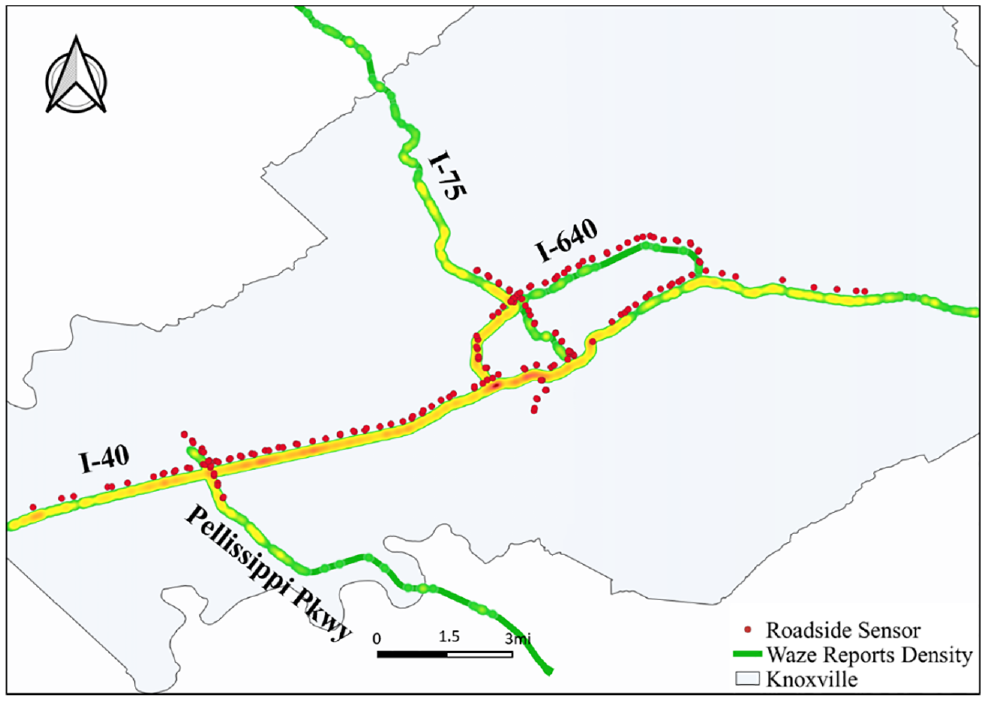
The spatial distribution of Waze jam reports, Knoxville, U.S.
(1) Parameters selection.
The dynamic ST-DBSCAN algorithm is implemented as well as the parameter selection approach.
(2) Comparison of static ST-DBSCAN and dynamic ST-DBSCAN.
The detection results from dynamic ST-DBSCAN are compared with those of the static ST-DBSCAN algorithm.
(3) End of queue (EOQ) identification.
The EOQ in each cluster is located in real time, based on the proposed EOQ identification method.
(4) Benchmarking.
This section compares the EOQ identification results with detection results from roadside sensor data.
Results
This section first presents the parameter selection of the proposed algorithm. Then, the proposed dynamic algorithm is compared with the static algorithm. Finally, EOQ identification procedure is implemented, and the detection results are compared with a well-established method.
Parameter Selection
There are three parameters to be determined separately: minPts, a temporal threshold
Using the threshold selection procedure developed in the methodology section, temporal radius
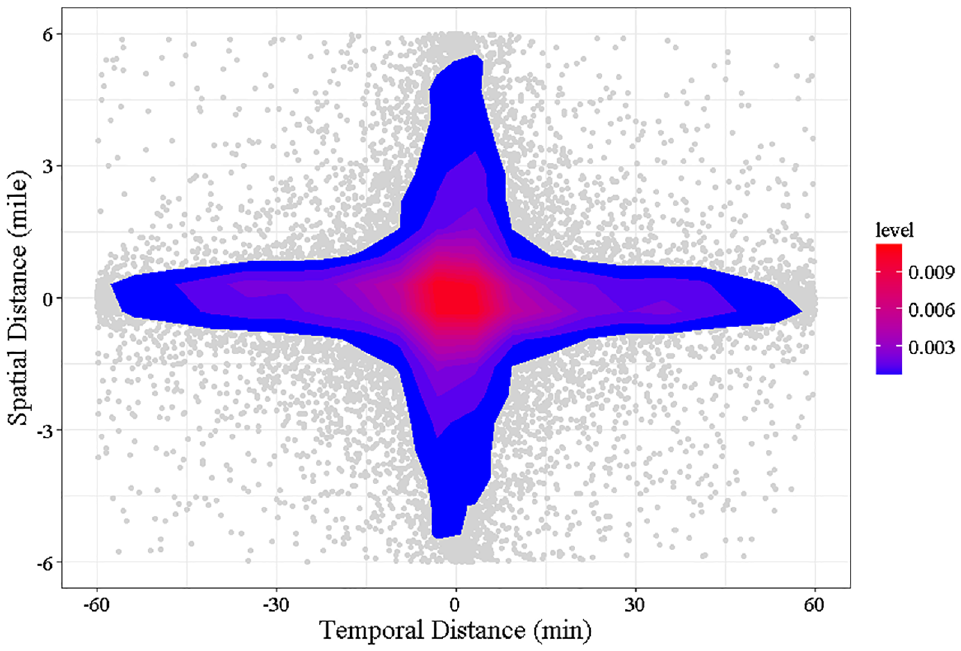
The temporal and spatial distance of two nearest reports.
Figure 6, a and b, show the change of the temporal and spatial threshold over time. The temporal threshold is computed using the 99th percentile value and the spatial threshold is computed using the 95th percentile value. The
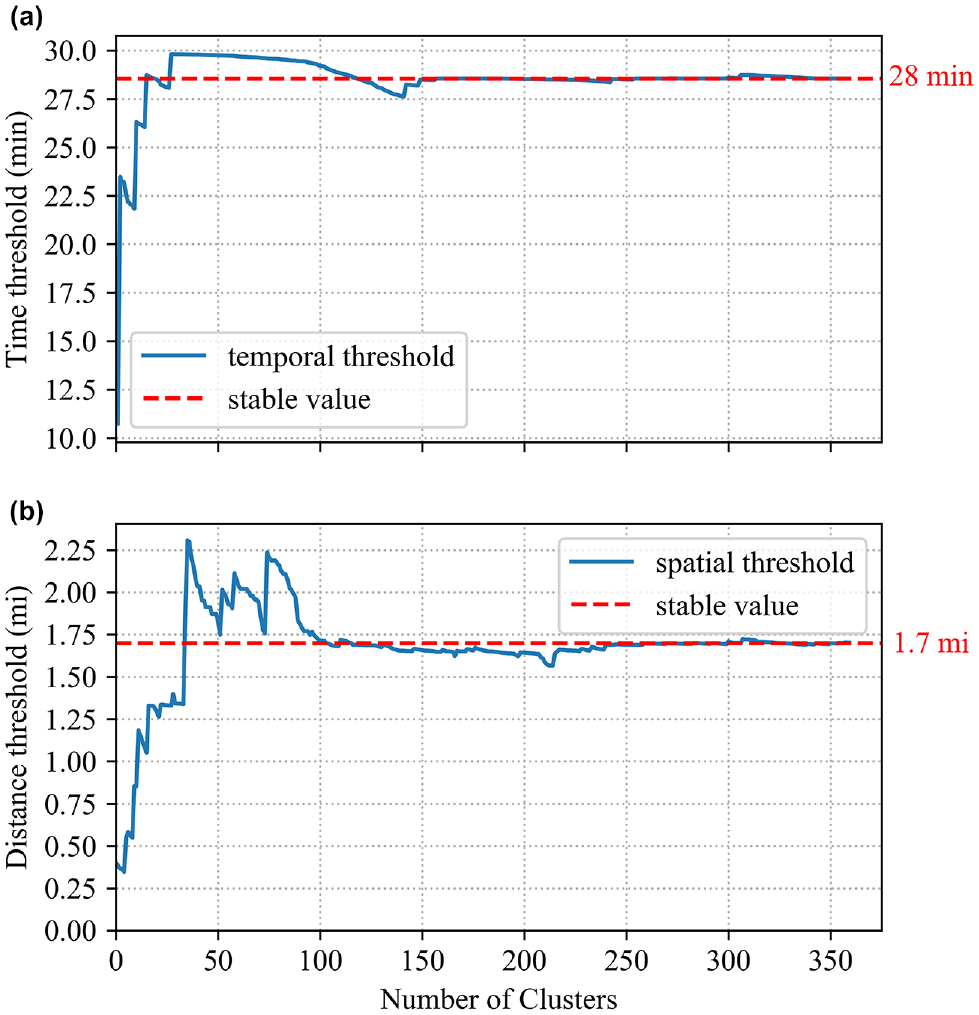
Threshold selection: (a) temporal threshold changes over time and (b) spatial threshold change over time.
The 28 min time threshold is reasonable since Waze keeps a report from a user for at least 30 min unless it is confirmed as a false alarm. Therefore, the majority of Waze reports remain in the system for at least 30 min. If there is a report already in place, people are less likely to make another report during the same period; instead, they are more likely to confirm the report with thumbs up or communicate under the existing report which further prolonged the existence duration of the report. The 1.7 mi distance threshold is reasonable as well, because sometimes the queue propagates quickly, especially a queue caused by crashes. It only takes a few minutes for a queue to move 1.7 mi. Therefore, the distance between two nearest reports belongs to the same cluster can be as long as 1.7 mi.
Comparison of Static ST-DBSCAN Algorithm and Dynamic ST-DBSCAN Algorithm
Next, a comparison is made between the static clustering method and the dynamic clustering method. The static and dynamic algorithms, respectively, are run on the same dataset; the results are shown in Figure 7.
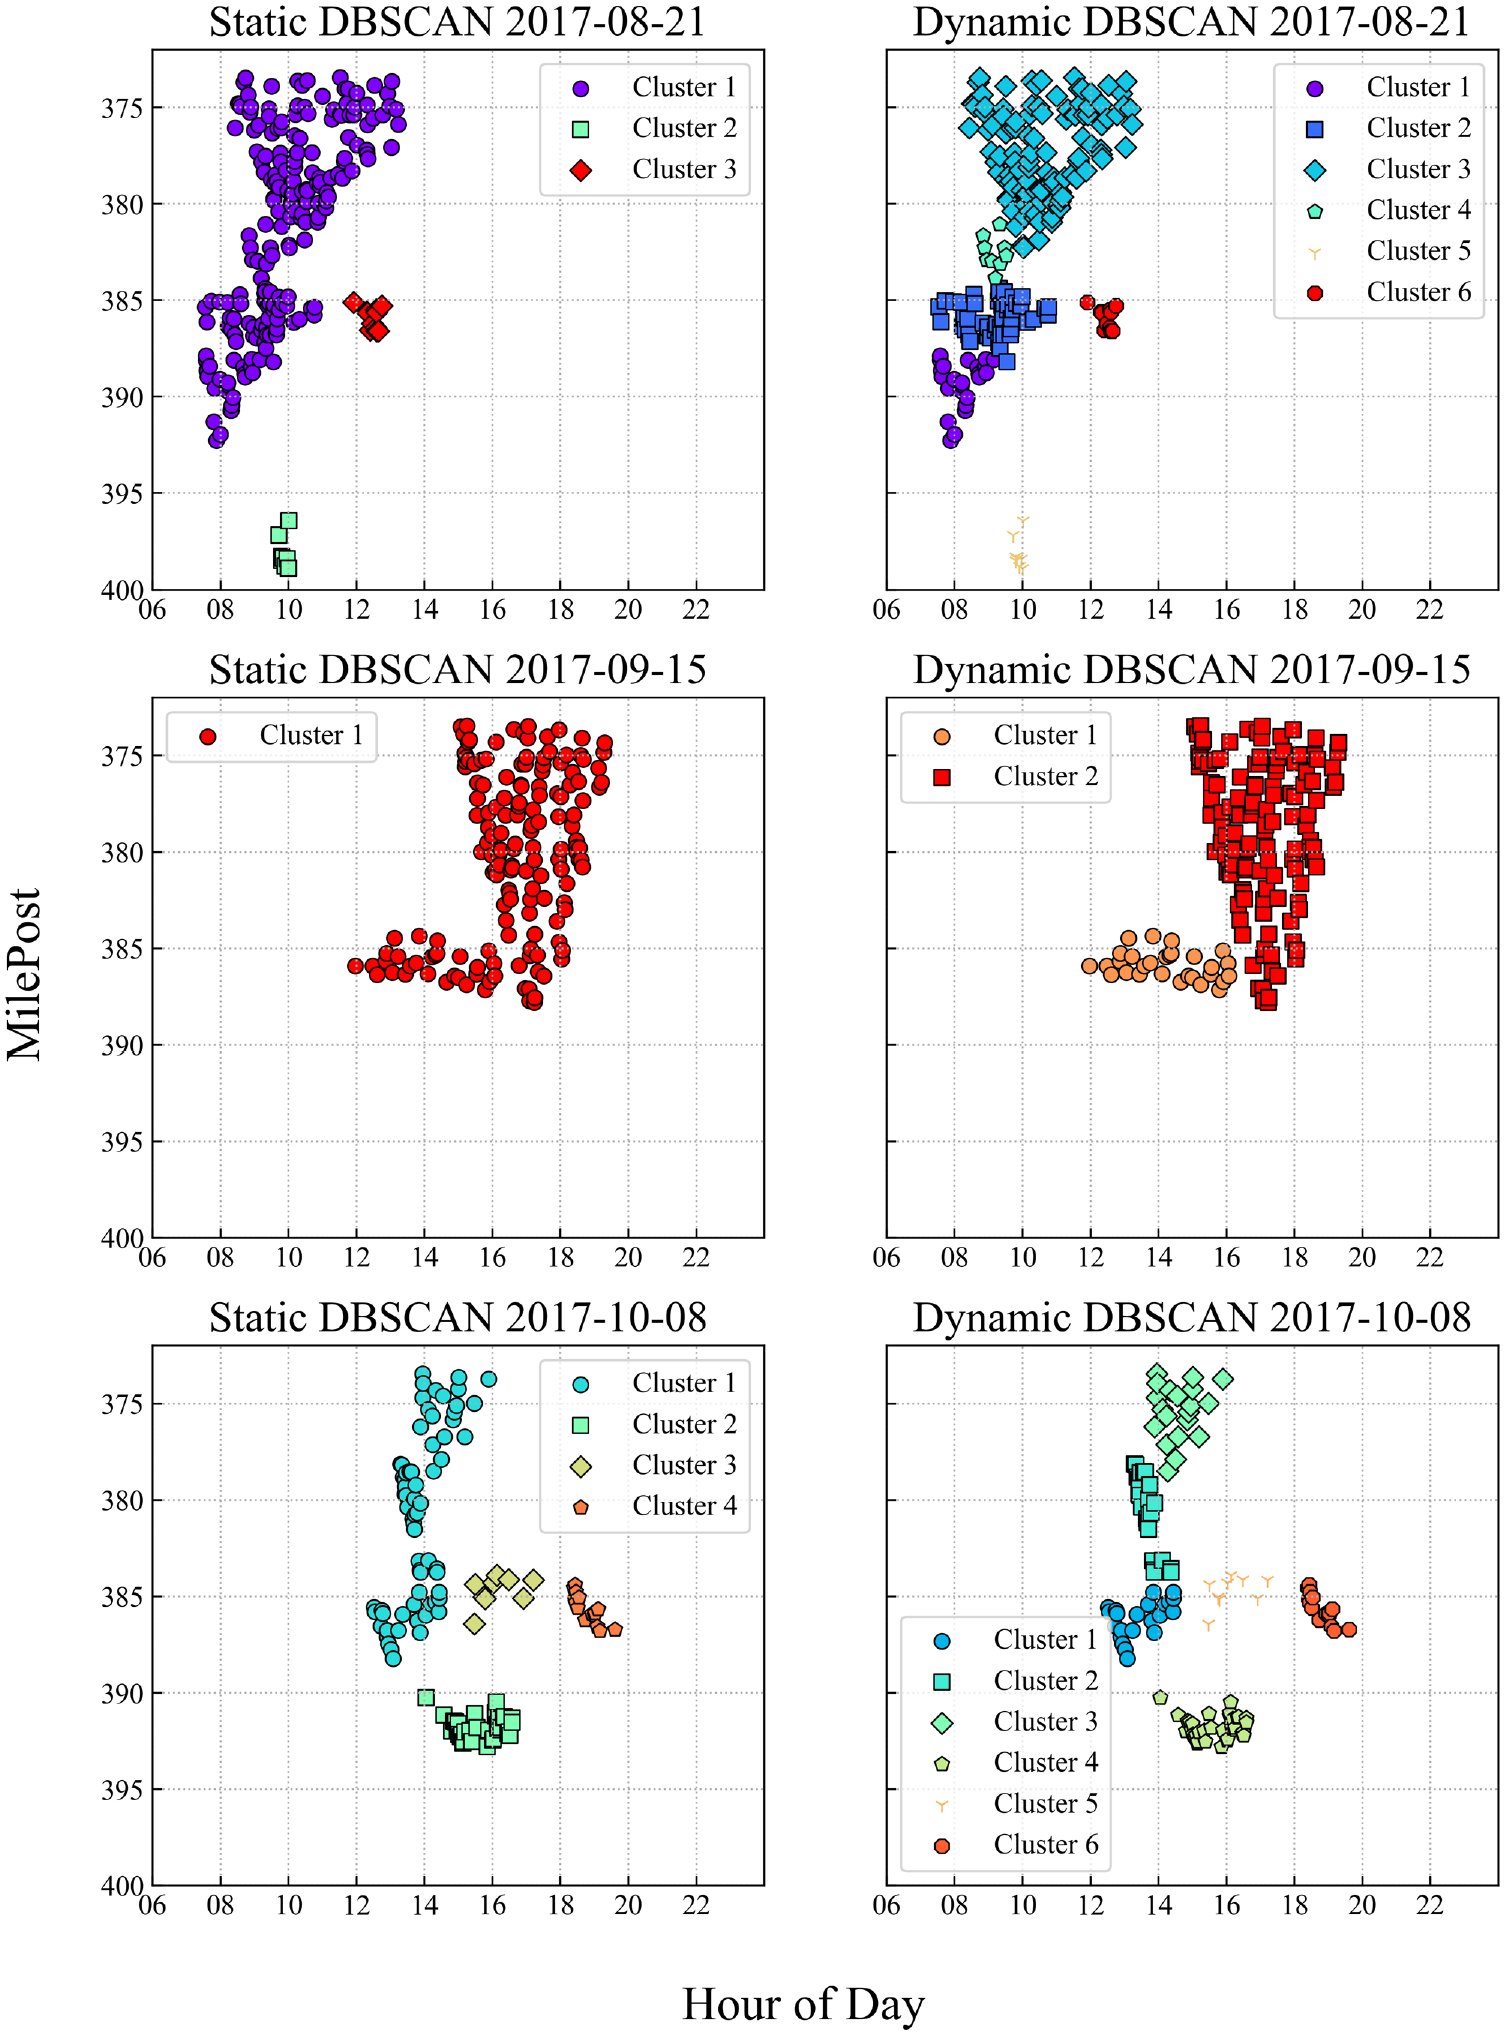
Clusters discovered using the static and dynamic algorithms.
Figure 7 is composed of three examples: August 21, 2017, September 15, 2017, and October 8, 2017, on I-40 westbound. In Figure 7, different colors/shapes represent different clusters as shown in the legend. The left column plots are clustering results of static DBSCAN and the right column plots show the clusters identified using dynamic DBSCAN. By comparison, the dynamic DBSCAN algorithm is more effective in identifying clusters starting at different locations and different times. For example, on September 15, the static algorithm identifies one big cluster colored red, while the dynamic algorithm identifies two clusters, separately colored red and orange. The cluster colored orange represents congestion starting around noon at milepost 385, while the cluster colored red represents congestion starting around 3 p.m. at milepost 373. Over time, the two clusters merge together at around 4 p.m. at milepost 385. If the two clusters merge together, the EOQ will be identified separately for the two clusters and compared against each other. At the same time, the EOQ that is farther upstream will be taken as the EOQ for the merged congestion.
End of Queue (EOQ) Identification and Benchmarking
The EOQ identification method is applied. Figure 8 demonstrates the identification results for a specific case. All the circle points in this figure belong to the same cluster. The congestion started at around 3:10 p.m. and at milepost 374.5. The queue propagated upstream over time. Points colored green represent the identified EOQ for this cluster. Each point represents the EOQ location when the report was generated.
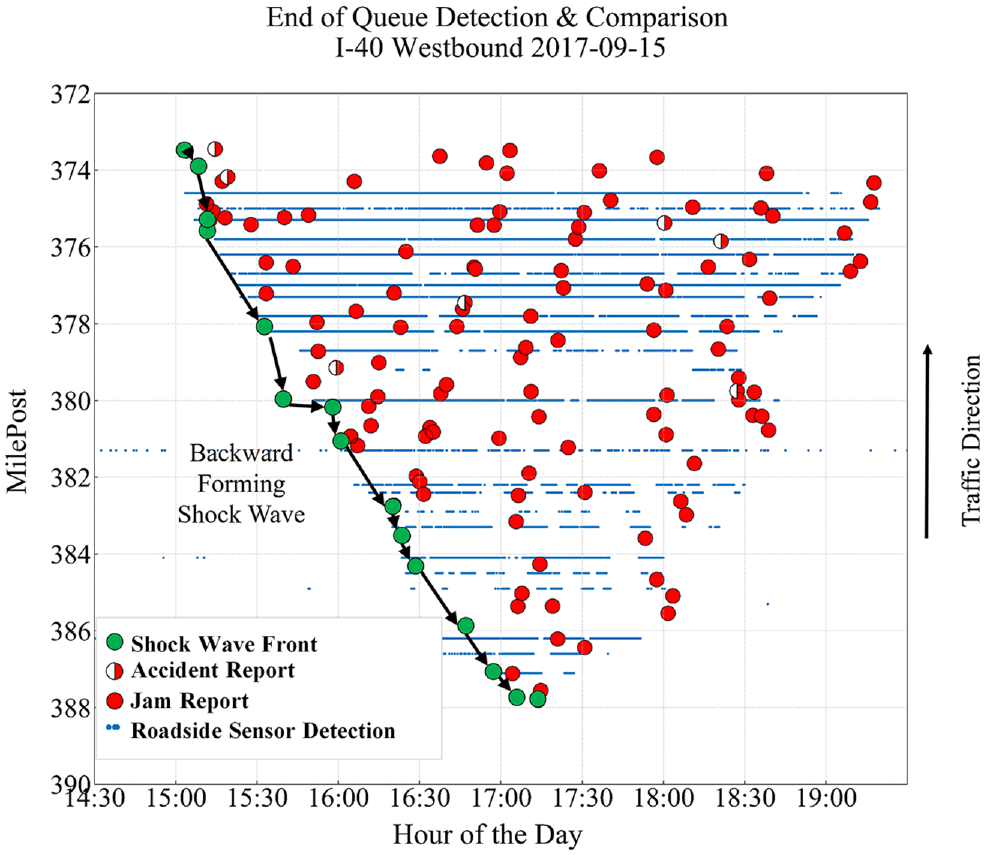
Example of backward-forming shock wave detection.
For further assessment, the proposed algorithm is compared with the speed threshold algorithm developed in a previous study ( 35 ). The speed threshold method is often employed as a benchmarking method in traffic queue detection algorithms ( 7 ). The thresholds of this algorithm have been identified as a range between 30 mph and 40 mph for the freeways in Portland and San Diego, U.S., respectively ( 35 , 36 ). In this study, 30 mph is selected as the threshold to detect congestion based on roadside sensor data, and the detection results based on two data sources are compared. The small blue dots in Figure 8 represent the detection results based on roadside sensor data using the speed threshold method with a 30 mph threshold. Figure 8 thus provides a comparison of Waze detection results and roadside sensor data detection results. Next, a method is developed to compare the detection results based on the two data sources qualitatively.
Figure 9 is a demonstration of the qualitive comparison of the EOQ detection results using Waze and remote traffic microwave sensor (RTMS) data. Two remote traffic microwave detectors are separately located at
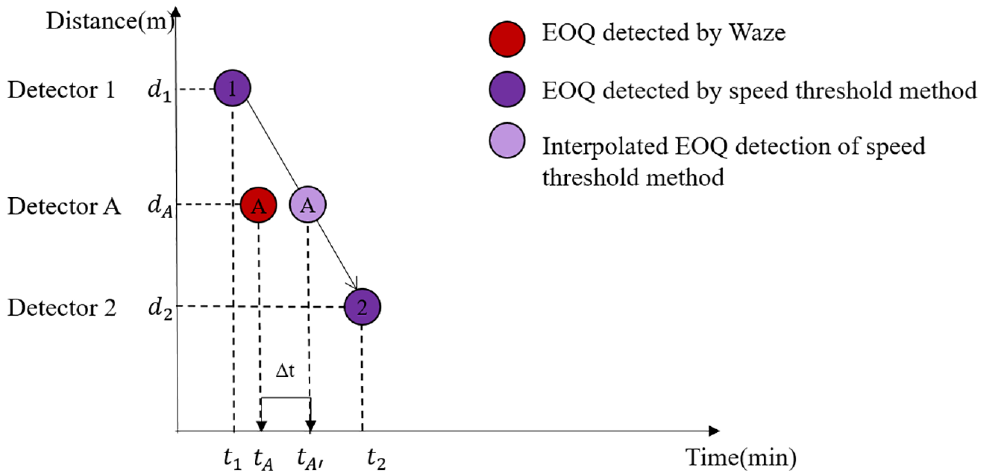
Comparison of end of queue (EOQ) detection results based on Waze data and roadside detector data.

Instances of severe congestion which have remarkable impacts on traffic from August 1 to December 27, 2017 in Knoxville are identified with more than a certain number of Waze reports, resulting in 43 cases. Nine cases were then removed, either because of no obvious backward queuing pattern, or because of questionable roadside sensor data. The detection results of the speed threshold method and the proposed method for the 34 cases are compared.
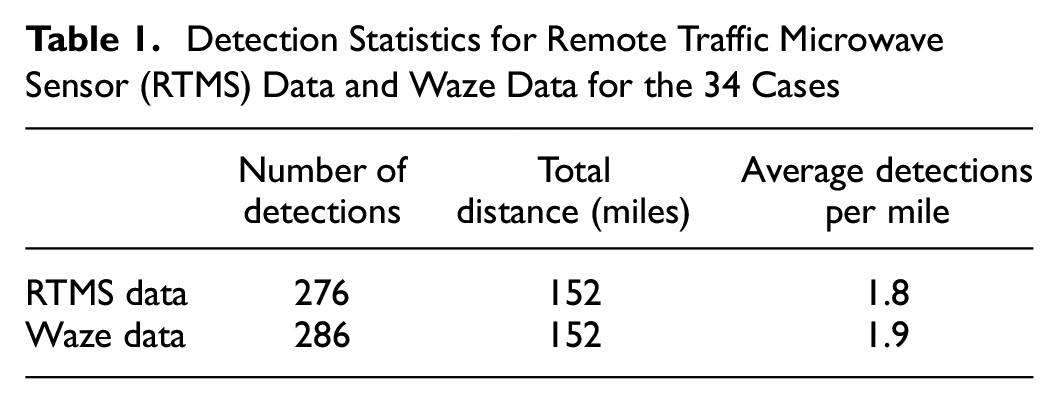
Table 1 shows the EOQ detection frequency for both datasets. The total distance is calculated as the summation of queue lengths for all 34 incident cases. For RTMS data, on average, 1.8 points are reported every mile of congestion. For Waze data, on average, 1.9 points are reported every mile. The results suggest that Waze has comparable EOQ reporting frequency with roadside sensor data. Then, for each of the 385 Waze EOQ reporting points, the detection time difference between the proposed method and the speed threshold method is computed based on Equation 3. The average detection time differences for the 385 Waze EOQ reporting points between the speed threshold method and the proposed method is 1.1 min, with a standard deviation of 7.2. That is, the speed threshold method based on traffic detector data reports the EOQ 1.1 min earlier than the proposed method based on Waze data. The small detection time difference between the two data sources suggests they are comparable in respect of timeliness.
Detection Statistics for Remote Traffic Microwave Sensor (RTMS) Data and Waze Data for the 34 Cases
While the average detection time suggests that the detection results based on the two data sources are consistent overall, the standard deviation shows that Waze detection results contain noise. A future research direction is to develop methods to filter out Waze detection noise and estimate queue end location based on the EOQ detection results. In addition to real-time implementation, the results show that the dynamic clustering algorithm can be used to identify the spatial-temporal movement of congestion and thus has many applications, including identifying congestion duration and queue length over time. The dynamic clustering algorithm results can also be used to identify secondary crashes. Waze provides both accident reports and jam reports. By identifying the spatial-temporal impact area of congestion, the secondary crash can be linked to the primary crash.
Conclusion and Future Work
Knowledge of the location of traffic queues after non-recurring events such as incidents serves as the foundation of managing and protecting the queue in real time to reduce delays as well as decrease the occurrence of rear-end collisions. The objective of this study is to take the advantage of location-based crowdsourced data from Waze reports to develop an automatic clustering algorithm and track the movement of the queue.
In this study, an algorithm that clusters the live Waze reports—specifically, incident reports and jam reports—is proposed. The algorithm is a real-time extension of the traditional ST-DBSCAN algorithm. It dynamically forms clusters with incoming Waze reports and tracks the movement of congestion as well as EOQ over time. A threshold selection approach is developed by characterizing the Waze user reports’ spatial-temporal distributions under congestion.
The proposed algorithm was tested in the Knoxville area with 34 severe traffic congestion cases. Both the static and dynamic ST-DBSCAN algorithms were executed. Results demonstrate the proposed dynamic algorithm outperforms the static algorithm, as it can distinguish clusters that start at different times and locations.
A comparison of the proposed algorithm with the speed threshold method based on roadside sensor data was performed. On average, the detection results of the proposed method and the speed threshold method are quite close. The detection time difference is only 1.1 min. In addition, the reporting frequency of Waze and traffic sensor data is close as well. Waze reports 1.9 EOQ detection points every mile, while the traffic detector generates 1.8 detection points every mile. The comparison demonstrates that Waze data is similar for congestion and EOQ detection. This is particularly valuable for the many stretches of roadway without traffic sensors.
This research mainly assessed the performance of EOQ detection during severe congestion, under which the queue is propagating quickly and which is most dangerous to drivers. In future research, the performance will be evaluated for different traffic jam conditions. Moreover, in spite of the information directly provided in each record, all Waze reports have reliability scores and existence-interval (the time duration the Waze reports present on the application). In this study, only the timestamp that the report is made is considered, not the time duration that the report presents. In future research, the duration information, as well as reliability, will be considered, to improve the detection results.
Footnotes
Acknowledgements
Special thanks to Tennessee Department of Transportation for providing Waze and roadside sensor data.
Author Contributions
The authors confirm contribution to the paper as follows: study conception and design: Y. Liu, Z. Zhang, L. Han; data collection: Y. Liu; analysis and interpretation of results: Y. Liu, Z. Zhang, L. Han, B. Candace; draft manuscript preparation: Y. Liu, B. Candace. All authors reviewed the results and approved the final version of the manuscript.
Declaration of Conflicting Interests
The author(s) declared no potential conflicts of interest with respect to the research, authorship, and/or publication of this article.
Funding
The author(s) disclosed receipt of the following financial support for the research, authorship, and/or publication of this article: This research received support from Tennessee Department of Transportation RES2019-11 project.
Data Accessibility Statement
The Waze data and roadside sensor data that support the findings of this study are available from Tennessee Department of Transportation (TDOT). Restrictions apply to the availability of these data, which were used under license for this study. Data are available from the authors with the permission of TDOT.