



Abstract
Sudden passenger demand at a bus stop can lead to numerous passengers gathering at the stop, which can affect bus system operation. Bus system operators often deal with this problem by adopting peer-to-peer service, where empty buses are added to the fleet and dispatched directly to the stop where passengers are gathered (PG-stop). However, with this strategy, passengers at the PG-stop have a long waiting time to board a bus. Thus, this paper proposes a novel mathematical programming model to reduce the passenger waiting time at a bus stop. A more complete stop-skipping model that including four cases for passengers’ waiting time at bus stops is proposed in this study. The stop-skipping decision and fleet size are modeled as a dynamic program to obtain the optimal strategy that minimizes the passenger waiting time, and the optimization model is solved with an improved ant colony algorithm. The proposed strategy was implemented on a bus line in Harbin, China. The results show that, during the evacuation, using the stop-skipping strategy not only reduced the total waiting time for passengers but also decreased the proportion of passengers with a long waiting time (>6 min) at the stops. Compared with the habitual and peer-to-peer service strategies, the total waiting time for passengers is reduced by 31% and 23%, respectively. Additionally, the proportion of passengers with longer waiting time dropped to 43.19% by adopting the stop-skipping strategy, compared with 72.68% with the habitual strategy and 47.5% with the peer-to-peer service strategy.
Social events such as sports games, concerts, and other public events are frequently organized in many large cities around the world. These special events gather a large group of people within an urban area, which leads to a sudden increase in demand for urban transportation systems. A sustainable approach to meeting such sudden demand is required to avoid traffic congestion and pollution ( 1 , 2 ). Public transportation is key to resolving this issue because of its lower average road space and energy consumption than other transportation modes ( 1 , 3 , 4 ).
Evacuation planning is a recently blossoming field of research, and much attention has been paid to developing methods for computing plans to evacuate people ( 5 – 8 ). Many studies have focused on how to utilize public transportation efficiently for evacuation planning ( 5 , 9 – 11 ). Zhao et al. ( 5 ) proposed a round-trip evacuation model to reduce the total time cost for evacuees, including the in-bus trip time and waiting time at bus stops. Goerigk et al. ( 9 ) proposed an integrated model to minimize evacuation time. Their model can also provide shelter locations for people gathering during the evacuation. Rodrigues et al. ( 12 ) combined a public transportation smartcard with special event information and proposed a Bayesian additive model to predict the total number of trips to the special event areas. Pereira et al. ( 13 ) used the Internet as a source for special event information and developed a model to predict the arrival time of public transportation vehicles in special events. Lakshay and Bolia ( 6 ) proposed a bus-based evacuation plan for large-scale regional evacuation to make optimal use of limited resources within given constraints. They developed a mathematical model to provide emergency managers with the number of buses and bus sequence.
The main task of bus evacuation planning is to formulate a bus schedule with the goal of minimizing travel time. This goal is also a major objective in public transportation planning ( 14 , 15 ). This objective is subject to many constraints; different constraints lead to different control strategies. The stop-skipping strategy is an effective approach to reducing the passenger waiting time and has been studied for decades. Various strategies such as limited-stop bus service ( 16 , 17 ), “zonal” route design ( 18 – 20 ), and deadheading ( 20 – 23 ) have some similarities to stop-skipping ( 24 , 25 ). These strategies all allow service of some stops on the bus line, while other stops are skipped depending on the assumptions and constraints.
Jordan and Turnquist ( 19 ) formulated a dynamic programming model to select optimal zone structures and suggested that zone scheduling can improve both the reliability and average trip time. Eberlein et al. ( 26 ) minimized the passenger time cost in a bus system by formulating a simplified version of the optimal solution for when to dispatch vehicles and how many stops to skip. They then extended the solution to more general problems. Furth ( 22 ) developed a formula for determining the fleet size to meet a stop-skipping schedule and designed procedures to minimize the number of vehicles and passenger waiting time. Furth ( 18 ) extended the design of a zonal express service to a zonal local service in which inbound vehicles allow passengers to alight but not to board, while outbound vehicles allow passengers to board but not to alight. Application of this control strategy showed that it could considerably reduce the costs of the transportation agency. Ceder and Stern ( 21 ) developed a scheduling procedure to determine when and where vehicles can skip certain stops under garage and driver limitations. They based their scheduling procedure on the deficit function because of its visual nature. They designed an algorithm to offer passengers the effects on the schedule displayed on a computer monitor.
Many control strategies for bus schedules are available, but most are designed for habitual demand and evacuation during very large events (e.g., Olympic Games, World Cup competitions) and emergencies (e.g., hurricanes, floods, earthquakes). Systematic and effective public transportation planning for small- and medium-scale events has not been investigated in detail, even though such events can suddenly increase the passenger demand of public transportation systems. Bus schedules for habitual demand or large-scale and emergency evacuation are not suitable for medium- and small-scale events. Figure 1a shows the habitual demand strategy; extra empty buses are not dispatched, so this strategy cannot meet sudden increases in passenger demand. Figure 1b shows the peer-to-peer service strategy, which is often employed for very large events and emergencies. Several empty vehicles are dispatched from the depot to the stop where many passengers are gathered (PG-stop). Passengers need to wait at the PG-stop until the empty buses arrive, which is time-consuming.

Illustration of three evacuation strategies at the “passengers-gathered” stop (PG-stop): (a) habitual, (b) peer-to-peer service, and (c) stop-skipping.
To bridge this gap, this study focused on developing a dynamic control strategy for a bus fleet to evacuate people gathered at stops after leaving medium- and small-scale social events. An optimization model was developed to minimize the waiting time for passengers at all bus line stops. Rather than dispatching empty vehicles directly to the PG-stop, a stop-skipping strategy was considered to dynamically control the buses already operating on the line (Figure 1c). To determine whether or not stops should be skipped, a novel formulation of stop-skipping patterns was developed while empty buses are added to the fleet to meet sudden increases in passenger demand. Stop-skipping means that for both buses added to the fleet and buses already operating on the line stops could be skipped, considering that during the high demand at the PG-stop a skipped stop could leave more seats for the passengers at the PG-stop and reduce their waiting time. However, a skipped stop will cause inconvenience to passengers at stops that are not PG-stops (NPG-stops) who therefore need be picked up by the empty buses added to the fleet. When deciding whether to skip stops, the waiting time for passengers at the PG-stop and the NPG-stops are both considered. Compared with existing studies, the control strategy developed in this study allows more flexible bus operation and evacuation. First, stop-skipping is allowed. Second, both currently opertating buses and the empty buses added temporarily were allowed to evacuate the passengers gathered at a PG-stop. In comparison, existing research on stop-skipping does not consider the sudden increase of passenger demand.
The optimization model is an NP-hard problem (i.e. The complexity class of decision problems in our model that are harder than those that can be solved by a nondeterministic Turing machine in polynomial time), and it is difficult to find an exact solution. Thus, the ant colony (AC) algorithm was adopted to solve the model, and the proposed stop-skipping strategy was applied to a bus line in a Chinese city as a case study to compare its performance with those of traditional strategies when the passenger demand suddenly increases.
The remainder of this study is organized as follows. The next section introduces the mathematical formulation of the stop-skipping problem. The third section describes the algorithm for solving the optimized mathematical model. The fourth section presents the case study to validate the proposed mathematical model. The final section provides concluding remarks and future research directions.
Bus Operating Methodology
The bus operating methodology for meeting sudden passenger demand during medium- and small-scale events is presented here. First, the waiting times for passengers at the PG-stop and NPG-stops were formulated. The waiting time for passengers at the PG-stop depends on the number of buses that are added to the fleet and the capacity of a bus. This can be used to determine the number of buses that need to be added to the fleet. Depending on the stop-skipping decisions between two successive NPG-stops, the waiting time for passengers at NPG-stops has four cases. These four cases can be integrated into an equation with decision variables. The stop-skipping strategy is based on modeling the bus operation process as an optimization problem, where the objective is to minimize the waiting time for all passengers. This requires considering several constraints.
Notation
Consider a bus line J containing a set
s: index for bus stops on line J:
v : index of buses operating on line J
The proposed model uses the following assumptions:
Passengers arrive at each stop to alight at another stop randomly over time.
Passengers waiting at a stop have equal opportunity to board the bus.
Except for the PG-stop, the bus does not reach its maximum capacity when it departs from a stop.
The bus running time between two adjacent stops is unchanged during the scheduling time.
Waiting Time for Passengers at NPG-Stops
For passengers who arrive at stop
If

If

If

If

To compute the waiting time for passengers at NPG-stops, the above four cases can be integrated into the following equation using decision variables:

The expressions for W1–W4 can be substituted into the above equation to obtain the waiting time of passengers who arrive at stop

Because

The capacity of bus v that first reaches the stop after



The number of passengers boarding bus v at stop
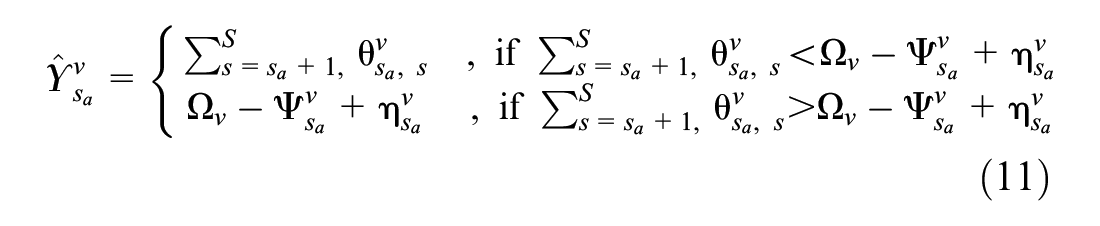
According to the assumptions of the proposed methodology, passengers waiting at the stop have equal opportunity to board the bus. Then, the actual number of passengers boarding bus v at stop

The number of passengers alighting bus v at stop

The number of passengers in bus v when it arrives at stop

The number of passengers who did not board the first bus v to arrive at stop

The headway between bus

The bus dwell time is given by


The time for bus v to arrive at and depart stop


For passengers who arrive at stop s after the departure time

Waiting Time for Passengers at the PG-Stop
The arrival rate from PG-stop
Several buses should be added to the fleet to meet the passenger demand at PG-stop

where
The added buses are denoted by
Optimization Model
The objective of the optimization model is to minimize the total waiting time for all passengers during the entire optimization horizon. There are two types of waiting times: for passengers at the PG-stop and for passengers at NPG-stops. The total waiting time for all passengers can be expressed by summing Equations 10–15. The waiting time for passengers at NPG-stops can then be expressed by the following summation, where stop

The waiting time for passengers at the PG-stop is given by

where

Thus, the objective function for the proposed model is given by

Therefore, the stop-skipping strategy to meet sudden passenger demand can be formulated as follows:
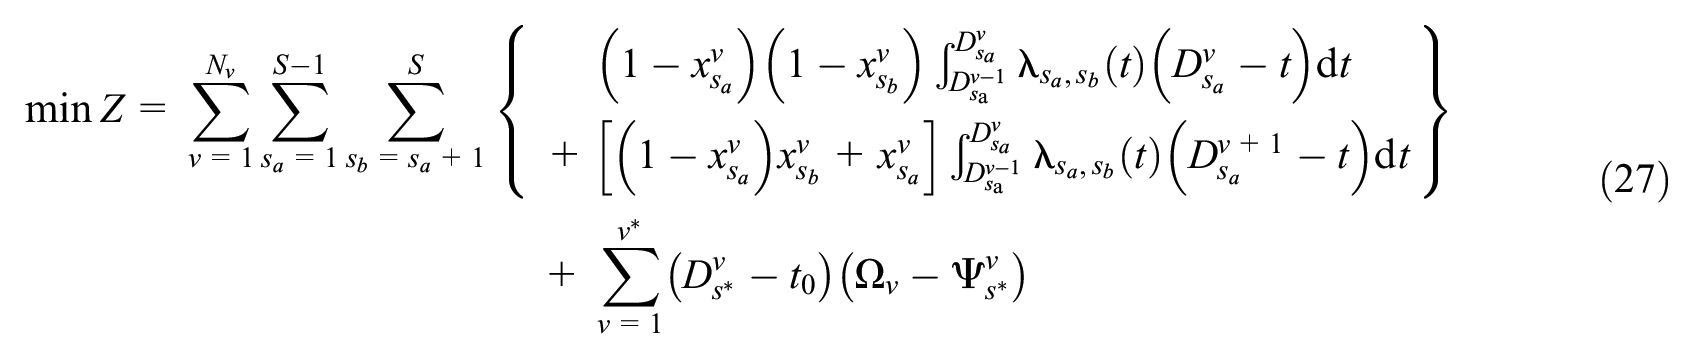
subject to Equations 1–14, 25, and the following constraints:




Equation 29 establishes that buses cannot overtake each other. Equation 30 shows that, if bus v skips stop s, then the dwell time of bus v at stop s is zero. Equation 31 ensures that the PG-stop should not be skipped by any bus.
Solution Method
Ibarra-Rojas and Rios-Solis ( 27 ) proved that the bus timetabling problem they formulated is NP-hard and also the NP-hardness of the similar problems present in other literature, such as the related problems of Ceder and Tal ( 28 ) and Eranki ( 29 ). The bus scheduling problem in this study is similar to these problems and the proposed mathematical model is a mixed 0–1 integer programming model. The objective function is neither convex nor concave. Therefore, the problem in this study is an NP-hard problem. Finding an exact solution is difficult. The AC algorithm is used to solve this problem. However, the traditional version of this algorithm is typically computationally expensive. To enhance the search ability and convergence speed of the AC algorithm, a competition function was customized to combine with the algorithm.
Competition Function
Let

where
Overall Solution Procedure
The above competition function is combined with the optimization model presented in the previous section for the solution algorithm. The steps are given below:
Initialize the algorithm parameters
Set nc = 0, and randomly assign a set of 0–1 values to ants as the initial starting point. For each ant, search for the new status according to the state transition probability, which is given by:

where
Growth and evolution take place according to the competition rules. Compute
If

The best solution is
Update the trajectory strength according to the pheromone concentration:

where

where Q is the quantity of the pheromone left by the previous ant.
Set
If
Output the current solution.
Case Study
Data Preparation
For validation, the proposed mathematical model and algorithm were applied to a real-world bus route in Harbin City, China as a case study. The route contains 34 stops and is approximately 17 km long; the headway is 3 min at peak hour. A segment of the route overlaps with the subway. Figure 2 shows the route and stop locations.

Bus line in Harbin, China used for the case study.
When an event occurs near a bus stop, many passengers must gather around the stop and need to evacuate via the buses. An event considered occurred at stop 23 during peak hour. Many passengers gathered at this stop and needed to be evacuated by buses. Table 1 presents information on the bus stops. The running times between successive stops were computed according to the distance and operating bus speed, and they are given in the table as well. At the beginning of the optimization, the buses on the line departed for the next stop in sequence. The following parameters were set: number of buses
Distance and Running Time between Adjacent Stops

Passenger Demand
The average arrival rate under common passenger demand at each stop is shown in Table 2. The Harbin Railway Bureau stop (stop 23) is shared by the bus line and subway line. In the case study, an emergency event occurred on the subway line around stop 23 and passengers on the subway needed to transfer to the bus line, which would cause a sudden increase in passenger demand. There are 150 passengers intending to transfer to the bus line at this point. The beginning of the optimization is denoted by
Average Arrival Rate at Each Stop (people per minute)

Note: NA = not available.
Dynamic Control Strategies
Two strategies were considered to evacuate the passengers gathered at stop 23. The first was peer-to-peer service, in which empty buses are dispatched directly to the PG-stop. Two extra buses were required to evacuate the gathered passengers, and they were dispatched from the route terminus. The two buses were empty before they arrived at stop 23. When they departed, they were fully loaded unless no more passengers were waiting at the PG-stop. This study assumed that passengers could board the buses stochastically. The second was the proposed stop-skipping strategy described above. Empty buses were again needed, but instead of them being dispatched directly to the PG-stop, buses already operating on the line skipped certain stops to arrive at the PG-stop.
Computation Results
The stop-skipping problem on this numerical case is solved using the modified AC algorithm proposed above. The parameters of the algorithm were set to
To demonstrate the benefits of the proposed stop-skipping strategy, the time costs of three strategies were computed: (a) habitual (i.e., no control strategy), (b) peer-to-peer service, and (c) stop-skipping. Table 3 illustrates the passenger average waiting time for all stops with the three strategies. The stop-skipping strategy resulted in an average waiting time for all passengers of 111 s, while the habitual and peer-to-peer service strategies resulted in 162 s and 144 s, respectively. Thus, the stop-skipping strategy reduced the average waiting time for passengers.
Average Waiting Time for Each Strategy

To obtain an overview of the variations in the passenger waiting time with the three strategies, the waiting time at all stops on the bus line was tracked, as shown in Figure 3. The maximum waiting time for passengers at the PG-stop was approximately 230,000 s with the peer-to-peer service strategy. The minimum waiting time for passengers at the PG-stop was approximately 50,000 s with the proposed stop-skipping strategy. The proposed stop-skipping strategy drastically reduced the waiting time for passengers at the PG-stop compared with the other strategies. Unsurprisingly, the waiting time for passengers at other stops increased slightly. This is because when a bus skips a stop, the passengers at this stop have to wait for the next bus. The waiting time for passengers at the stops near the PG-stop changed greatly with the three strategies. The waiting times for passengers between stops 1 and 10 were very similar with the habitual and peer-to-peer service strategies. However, the waiting time for passengers at these stops decreased greatly with the stop-skipping strategy.

Total waiting time for passengers at different stops with different strategies: (a) habitual, (b) peer-to-peer service, and (c) stop-skipping.
Figure 4 shows the average waiting time for all bus stops on the bus line under three different strategies. For the habitual strategy, passengers at waiting at stops before the PG-stop (stop 23) spend almost equal time waiting for a bus. Since most buses leave the PG-stop at maximum load, passengers waiting behind PG-stop have to wait longer time for a bus. The maximum wait time for passengers at PG-stop is 945 s. For the peer-to-peer strategy, the maximum passenger waiting time at PG-stop is up to 1,700 s, which is also the maximum waiting time for all passengers in the three strategies. Recall that bus headway in our case study was 3 min(180s), and the waiting time of passengers at the stop was half of the headway( 28 ). Therefore, the waiting time of passengers at all other stops in this strategy was 90 s. Therefore, under this strategy, the waiting time of passengers at other stops except PG-stop is 90 s. When the demand of the PG-stop suddenly increases, it will not affect passengers at other stops, and the passengers at the PG-stop must wait longer until the empty train arrives. For the stop-skipping strategy, the passengers who wait at stops before stop 7 spend less than 90 s waiting because of the empty buses added to the fleet, while those who are at the stops after it all endure waiting for a longer time. For the stop-skipping strategy, the waiting time of passengers stopping at the stop before the seventh stop is less than 90 s because of the empty buses added to the fleet, and the time for the stops after it will increase with the impact of the stop-skipping.

Average waiting time for passengers at different stops with different strategies: (a) habitual, (b) peer-to-peer service, and (c) stop-skipping.
The waiting time distributions at all bus stops with the three different strategies were also explored. Table 4 presents the percentages of passengers waiting for six different time intervals. The stop-skipping strategy reduced the percentage of passengers that had to wait more than 10 min to board a bus. This is because this strategy adjusted the buses already operating on the line to skip certain stops to reach the PG-stop quickly and evacuate the passengers in a timely manner. However, it increased the percentages of passengers waiting for other time intervals compared with the habitual and peer-to-peer service strategies. With the stop-skipping strategy, the waiting time interval with the highest percentage of passengers was 4–6 min at all stops. Approximately half of the passengers waited 4–8 min. This is because some stops were skipped by the bus, and passengers who wanted to board or alight at these stops had to wait for the next bus. With the peer-to-peer service strategy, the vast majority of passengers waited less than 6 min or more than 10 min. In other words, almost no passengers had to wait 6–10 min. This indicates that this strategy divides passengers into two groups: those at the PG-stop and those at other stops. The passengers at the PG-stop had to wait more than 10 min, while passengers at other stops waited between 0 and 6 min. With the habitual strategy, more than 70% of passengers had to wait for more than 6 min. This is because some passengers could not board the bus because of limited capacity, so they had to wait for the next bus. The limited bus capacity is another reason why the waiting time was more than the headway. In summary, the stop-skipping strategy evacuated gathered passengers in a timely manner and reduced the waiting time at the PG-stop better than the other two strategies.
Percentage of Passengers for Each Waiting Interval with the Three Strategies

Conclusions
In this paper, a dynamic bus control strategy based on stop-skipping was developed to evacuate gathered passengers when the passenger demand suddenly increases at a certain stop. The proposed strategy allows the agency to dispatch empty buses from the terminus to meet the sudden demand. However, instead of the empty buses being dispatched directly to the PG-stop, they start to pick up passengers from the first stop on the bus line. Meanwhile, buses already operating on the line skip certain stops to reach the PG-stop more quickly. Therefore, the proposed strategy requires the agency to decide the number of empty buses to dispatch and which stops on the bus line to skip.
The objective of the agency would be to evacuate passengers at the PG-stop as quickly as possible and minimize the waiting time for all passengers on the bus line. This problem was formulated into an optimization program and modified the AC algorithm to determine the optimal solution for stop-skipping. As a case study, the proposed strategy and solution algorithm were applied to a bus line with a PG-stop caused by an emergency event. Compared with the habitual and peer-to-peer service strategies, the proposed stop-skipping strategy reduced the total waiting time for all passengers at the different stops. Also, the benefit of the stop-skipping strategy in decreasing the percentage of passengers who had to wait more than 10 min was quantified. The proposed strategy not only reduced the total waiting time for all passengers but also decreased the proportion of passengers who had to wait more than 10 min. The proposed strategy also significantly reduced the waiting time for passengers at the PG-stop.
Footnotes
Author Contributions
The authors confirm contribution to the paper as follows: study conception and design: H. Zhao, S. Feng; data collection: H. Zhao; analysis and interpretation of results: H. Zhao, S. Feng, Y. Ci; draft manuscript preparation: H. Zhao, Y. Ci. All authors reviewed the results and approved the final version of the manuscript.
Declaration of Conflicting Interests
The author(s) declared no potential conflicts of interest with respect to the research, authorship, and/or publication of this article.
Funding
The author(s) disclosed receipt of the following financial support for the research, authorship, and/or publication of this article: This work is supported by the National Nature Science Foundation of China (No. 71771062).
