



Abstract
Risk-based transportation asset management program (TAMP) gives transportation agencies the ability to have a mechanism for documenting and measuring risks to their operations, as this will help drive the potential mitigation activities. The monitoring and updating of the risk management process is essential to TAMP as it will ensure that the financial plan and investment strategy components of the TAMP are suitable to ensure that agencies continue to fulfill their primary responsibilities. However, a review of the initial TAMP documents submitted by U.S. transportation agencies showed that although risks are acknowledged, there does not exist a clear line of sight between risk management and agencies’ programming. This is the result of a lack of cross-asset risk integration. As a result, the paper proposes a data integration framework for developing a cross-asset comprehensive database for risk management that integrates many of the common risks that state highway agencies have identified in the initial TAMP documents. In addition, the paper proposes modifications to the risk identification methodology that leverage the collaborative aspects of risk management to quantify risk in monetary terms.
Transportation asset management program (TAMP) is defined by United States Code (23 U.S. Code § 101) as “a strategic and systematic process of operating, maintaining, and improving physical assets, with a focus on both engineering and economic analysis based on quality information, to identify a structured sequence of maintenance, preservation, repair, rehabilitation, and replacement actions that will achieve and sustain a desired state of good repair over the lifecycle of the assets at minimum practicable cost.” By this definition, a viable TAMP can only be accomplished if risk considerations are a part of the overall process. Risk management analysis is one of the requirements under MAP-21 and subsequently FAST ACT that elevates TAMP to the same class of management practices expected in the private sector. At the core of this is the ability of transportation agencies to have a mechanism for measuring the identified risks, as this will help drive the potential mitigation activities. The monitoring and updating of the risk management process is essential to TAMP as it will ensure that new risks are identified while existing risks are tracked and updated ( 1 ). In addition, this would enable the agency to quantify the likelihoods of these risks. This ability to track and quantify risk would benefit the risk classification process ( 2 ) and its integration into an asset management plan. Furthermore, it will help ensure that the financial plan and investment strategy components of the TAMP are suitable to ensure that the agency continue to fulfill its primary responsibilities.
A 2011 national scan of how state Department of Transportation (DOT) agencies are using risk management revealed that less than 13 agencies had a comprehensive risk management framework at the enterprise, program, and project levels ( 1 ). The enterprise level risks affect mission, vision, and overall results of the asset management program. The program (business line) risks affect DOTs’ ability to deliver projects and meet targets within a program. These may include organizational and systemic issues as well as revenue and economic uncertainties that in general cause project delays. These issues can be multivariate. Examples include project delivery risks, revenue uncertainties, cost-estimating processes, revenue and inflation projection inaccuracies, construction cost variations, materials price volatility, data quality, personnel, and so forth.
Project/asset level risks affect the scope, cost, schedule, and quality of projects. In contrast to programmatic risks, project risks are related to specific projects. In other words, there are inherent issues in a given project that may result in a project delay. Examples include hazardous materials, geology, environmental issues, right-of-way issues, utilities, project development timeline/delays, scope growth, cost overruns, project delays, and so forth.
In 2017, a national scan was undertaken on the state of the practice of risk management implementation among state highway agencies (SHA), which found that the number of agencies that have risk registers at the enterprise, program and project levels had almost doubled ( 3 ). A review of the TAMP documents that have been uploaded to the AASHTO TAM portal by various state DOTs show that most agencies have similar methodologies for risk management. It involves setting up a risk task force that typically consists of data owners, data managers, program managers (bridge, pavement, safety, etc.), and an asset management committee whose task is to develop and implement the department’s TAMP to ensure it satisfies Federal requirements, coordinate asset management activities across all department bureaus and divisions, and facilitate progress toward improving asset conditions, inventories and data sharing capabilities ( 3 ). The task force therefore represents all the relevant stakeholders involved in risk management decision making. The task force then convenes a risk workshop. From this risk workshop, risk registers are compiled to represent all the risk events that the agency considers important along with mitigation plans. This consultative process did not allude to any development of datasets on various risk events, processes, and measures to be able to quantify or track risk. In addition, the 2017 study on the state of the practice for integrating risk management in SHAs found that the majority of agencies did not identify data needs along with the risk identification process and as a result were unable to agree on frequency and process for tracking identified risks ( 3 ).
The objective of this study is therefore to propose a framework for developing a cross-asset comprehensive database for risk management that integrates all the risks that an agency has identified through its risk identification process. The database will facilitate data-driven risk identification as well as a data-driven approach to update and track risk registers. In addition, with a comprehensive database, it becomes feasible to synthesize a composite measure of performance that encompasses DOTs’ various departments and assets.
Background
Risk management is not a new concept, but among SHA it is still emergent in implementation as well as practice. The process of risk management can be generally divided into three phases: identification, analysis, and response ( 4 ). It would not be far-fetched to posit that an effective response to risk can only be accomplished if the process and data used to estimate the response are contextually accurate ( 5 ). The availability of accurate data is vital for any risk-based asset management program. Data are needed for defining agency objectives, risk identification and measurement, supporting the decision-making process, and monitoring progress toward objectives ( 2 ). Furthermore, asset level data such as age, condition, failure rates, and maintenance activities, as well as consequences of failure to the user (user cost), the agency (agency cost), and the environment (external cost) are very critical to a risk-based decision-making framework ( 2 ). However, these data are not always collected together nor managed in one database or by one department. As a result, the data are not always in a usable format but exist under various asset management systems requiring integration. It is very important for TAM processes to see the assortment of datasets as a whole and not just as a sum of the parts since the most accurate picture is one that takes from all sources and produces an output that is unique to all its sources. This is very significant because the overall objective is to synthesize useful trends and patterns that can be used for decision making ( 6 ).
Data integration is defined as the process of combining data residing at different sources or in different formats and providing the user with a unified view of these data ( 7 ). For the benefit of TAMP, the Federal Highway Administration defines data integration as “the method by which multiple data sets from a variety of sources can be combined or linked to provide a more unified picture of what the data mean and how they can be applied to solve problems and make informed decisions that relate to the stewardship of transportation infrastructure assets” ( 8 ). Data integration is therefore essential to transform data into useful information that can support the different organizational levels of decision making. The challenges facing a successful data integration implementation have been highlighted as the biggest obstacle to risk-based asset management practice ( 9 , 10 ). This is a fundamental requirement for effective TAM ( 9 ).
In industries such as banking and finance, insurance, and the nuclear power sector, there is usually a clearly defined database that feeds risk management ( 5 , 11 ). However, among SHAs, managing an assortment of assets with varying degree of granularity across multiple divisions answering to the same central office with an overall goal and objectives can create a nightmare for a database integration effort that is appropriate for risk management. This creates data siloes that result in autonomous data management systems across the agency. These data siloes also create duplication of data collection efforts resulting in overlaps that make data integration tedious. In addition, the culture and leadership styles in SHAs directly influence each division’s approach to sharing and receiving feedback on data required to track risks across divisions and various assets. Lack of cohesion in approach undermines the ability to synthesize a fully integrated database required for risk management. This study focuses mainly on the data integration challenges affecting SHA risk management efforts and aims to provide a solution to these challenges by developing a comprehensive database needed for integrated risk management. Specifically, it proposes a framework that simplifies the integration of existing databases and infrastructure management systems, as well as identifying additional data items that need to be collected or better integrated for successful risk management.
Core Concepts
Successful integration of risk management requires an underlying data structure that can accommodate, align, and link the plethora of heterogeneous data that will be generated by SHAs in the management of their large and diverse transportation assets. Without such a structure, data inundation can undermine or create additional barriers to successful implementation of a risk management database. Data management is the process that structures these data resources so that they are accessible, reliable, and timely ( 12 ). This structure must be able to handle the four Vs of data—volume, velocity, variety, and veracity ( 12 , 13 )—to be able to extend the outcomes of the data to synthesize a competitive strategy that brings improvements in operational efficiency while allowing SHAs to leverage data across their enterprise for other initiatives ( 12 ). These four dimensions of data management provide a metric to measure the value of information for decision making that can be extracted from data for risk management, which includes ( 12 ):
Volume-based measure: the more comprehensive the integrated view of transportation infrastructure and the more historical data that exists, the more insight can be extracted from it, which in turn makes for better decisions when it comes to acquiring, maintaining, growing, and managing the network.
Velocity-based measure: the more rapidly information is processed from the data and analytics platform, the more flexible answers to questions via queries, reports, dashboards, and so forth. become. A rapid data integration and analysis provides a timely and correct decision to asset management objectives.
Variety-based measure: the more varied the asset data encompassing highways, railroads, navigable waterways, traffic management centers, terminals, transfer and storage sites, rest areas, bridges, tunnels, climate data, and so forth, the more multifaceted view is developed about the network. This creates a comprehensive view of the network that is germane for driving risk mitigation efforts.
Veracity-based measure: amassing a large amount of data comes with its own set of challenges to having clean and accurate data. Data on assets must be integrated, without noise, consistent, and current to make the right decisions.
While these four dimensions of data management are useful for understanding the potential value in data, the most daunting task in this data enterprise is extracting the value and insights from that data. Data governance, one of the pillars of data management, is responsible for the ontological framework needed to solve this data-centric problem. This framework encompasses the following components ( 14 ):
Data principles: defines the business uses of the data, the protocols for communicating and updating the business uses of the data on a regular basis. In addition, it identifies the opportunities for sharing and reuse of data. This is especially useful in guiding the integration of data within the SHA.
Data quality: specifies the requirements of the intended use of data. It answers the questions of accuracy, timeliness, completeness, and creditability. This is useful in determining the value and limitation of the insights from the data.
Metadata: defines how the data is interpreted by other users. It includes the process for describing the content of the data to ensure consistency and provide guidance on the modeling of the data so that it can be understood by users.
Data access: defines the business value of data, who can access it and how. It also defines the process for backup and recovery.
Data lifecycle: defines the process for data definition, production, and retention, and finally retirement of the data. It defines how the data is inventoried.
Data governance provides a way for SHA to balance being proactive and empirical with data and technology with maintaining control over the lifecycle of the data ( 15 ). Data governance is the key to unlocking the value in SHA data resources to drive risk management decisions. In addition, this framework needs to be put in place before data integration can proceed as it will mitigate the challenges associated with data integration.
Data Integration Challenges
Effective risk analysis relies heavily on objective and quantifiable data. The data required to run complex risk analysis resides in multiple systems across the SHA and in different schemas. The difficulty associated with organization and normalization often presents the biggest challenge in receiving relevant and timely risk information. Tactical database and spreadsheet tools are inflexible, difficult to maintain and generally unreliable. The lack of integration between systems poses big challenges to transportation agencies’ efforts to integrate risk management in their TAM. These challenges can be grouped into the three different classes: systems, logical, and social and administrative challenges ( 16 ). In the following sub-sections, each one is discussed separately.
Systems Challenges
The systems challenges to data integration are the most observable. Transportation agencies, by their nature, require large quantities of data to support repetitive operations as well as to respond to planning, design, construction, and other programmatic needs ( 8 ). These needs warrant the different divisions within a transportation agency to individually collect the necessary data needed which then ends up on different systems in each division. Essentially, the challenge is to allow these dissimilar systems to talk seamlessly to one another. In addition, executing queries over multiple systems efficiently is especially difficult ( 17 ).
Logical Challenges
The second set of challenges result from the way data are logically arranged in the data sources. Most transportation agencies that maintain databases of roads break them into logical segments to create unique transportation features according to some business rules, such as pavement type, traffic volume, jurisdiction, or at intersections ( 18 , 19 ). These differences in the original need for transportation databases create a difficult arena for data integrators as they result in data being organized into different schemas depending on which segmentation or agency unit is driving the collection. In these data models, the schema is identified by tags, classes, and properties ( 18 ). When data come from multiple sources, therefore, they are usually disparate, creating a logical challenge for data integration.
Social and Administrative Challenges
The benefits of data integration when fully implemented are well known ( 17 ). However, there are non-technical institutional barriers that are more commonly responsible for data integration falling short of full implementation ( 18 ). The first challenge may be to find a particular set of data in the first place. For example, in situations where a DOT performs in-house maintenance activities which are not properly recorded electronically as to their location and extent ( 19 ), a special effort is required to locate and scan them all. Even when the data exists, sometimes owners of the data may not be allowed to cooperate with an integration effort. For instance, traffic safety data involving medical records or law enforcement may have legitimate legal reasons for not sharing that data.
Synthesis of the Data Integration Framework
This section strives to lay out a conceptual framework for data integration for risk management while providing recommendations for tackling the data integration challenges. As already established, the goal of data integration is to combine data in various formats and from various sources to provide the user with a unified view of the data. To this end, a data integration system should comprise a global schema, data sources, and the set of rules relating the global schema to the sources. In short form, a data integration system I = fŋ(G,S,M) where G is the global schema, which represents all the important variables for risk management in this study; S is the source schemas, which contain information about the variables in G; and M is the mapping functions or transforms that relates G to S ( 7 ). This can be represented graphically, as shown in Figure 1 ( 17 ). Data sources can be relational, flat files, XML or any other format that contains structured data.

The basic architecture of a data integration system ( 17 ).
In a SHA, the data sources can be the various management systems, such as pavement and bridge management information systems. The mapping functions request and transform data from the sources providing a data dictionary service that shows how data from one information system maps to data from another information system. The mapping function provides a way for the data sources to be independently managed by the various divisions of the DOT. The global schema or central data warehouse abstracts all source data. Between the sources and the global schema, a set of transformations are used to convert the data from the source schemas into the global schema ( 17 ). This set of transformations acts like an application programming interface (API), which is a set of tightly-controlled rules or subroutine definitions and communication protocols between two programs ( 20 ). In this case, the API provides a method of communication that the global warehouse and data sources can handle. Collectively, changes could be made to both the warehouse and data sources, presuming they are reflected in the API, and there will be no break in the exchange of information.
The implication of having the API for the SHA is that each division can continue to manage its database as usual. The API will be designed such that it is able to extract the required information from the various databases and transform it into what is needed to populate the risk management database. Figure 2 is a practical application of Figure 1 where data from multiple divisions of the SHA and other supplementary data needed to quantify risk are integrated via spatial and non-spatial analysis to produce risk measures that feed the consolidated global database to produce a network level risk snapshot. Risk calculation happens in the transformation module that generates the estimates of risk measures. The spatial analysis allows for the right highway corridor to be associated with all the relevant assets and variables for estimating risk measures based on each agency’s approach. The following section will introduce and discuss the details of the data integration framework needed to implement Figure 2.
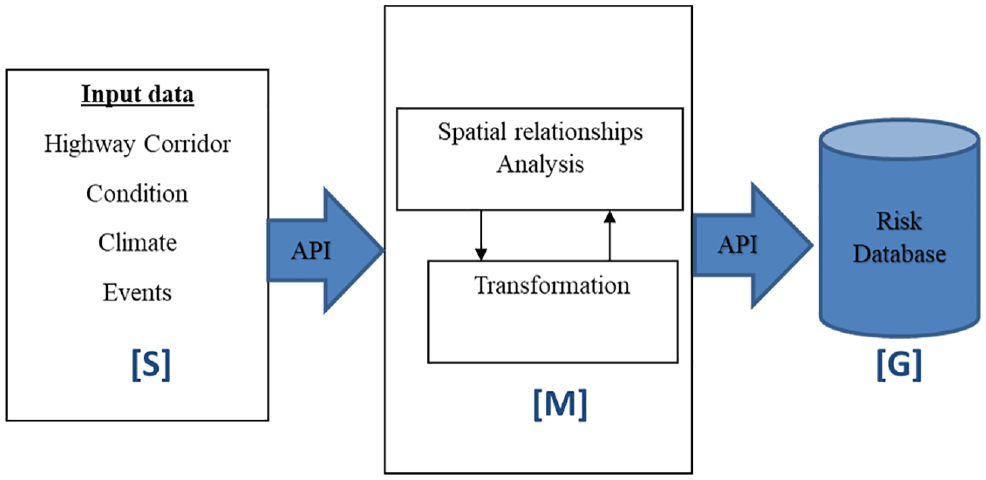
Practical application of the basic data integration system.
Data Integration Framework
Based on the challenges to data integration, recommended mitigation options, and layout of the basic data integration architecture presented earlier, Figure 3 proposes a framework for developing a risk management database. It utilizes a step-up process that provides a way to transform agencies’ raw data into the metrics and dimensions needed to create easy-to-understand reports and dashboards for decision making. This process begins as a qualitative process and transforms into a quantitative process for visualization and modeling. This article primarily focuses on the data elicitation and data aggregation steps. Risk calculation and decision-making steps are discussed as well; however, proposing detailed quantitative approaches for these steps is outside the scope of this paper and they have been covered in Nlenanya and Smadi ( 21 ).

The data integration process.
Data Elicitation
Fields such as business intelligence and decision support systems have made great strides with advancements in technology. Big data analytics have propelled these fields into the next frontier for innovation ( 22 ) and at the forefront of the data science study in both academic and business communities in the last two decades ( 23 ). SHAs have embarked on a data collection spree since the passage of the MAP-21 legislation. The sheer magnitude of this data collection endeavor can be accurately classified as big data.
Big data, by its nature, does not have form or structure, prompting the rise of business intelligence and analytics. Data elicitation is thus the process of trying to structure these data to make them accessible and usable ( 24 , 25 ). In this regard, data elicitation is the process of identifying the data elements that are relevant to the task at hand and how to synthesize that data to produce the required information or business intelligence.
This section discusses the various ways of leveraging the risk management workshop for identifying the required data elements that could be accessible and useful for a risk management database. Understandably, this process will drive the success of the data aggregation, risk calculation, and decision-making processes.
Risk Management Workshop as a Vehicle for Data Elicitation
The 2017 survey of how SHA are integrating risk in their TAMPs ( 3 ), as well as a review of the 26 SHA TAMP documents, as of August 2018, uploaded to the AASHTO TAM portal, show that most agencies synthesized their risk register during a risk management workshop. The workshop is usually attended by the relevant stakeholders in a SHA from the various divisions, units, or departments as well as a liaison from each of the assets. This workshop provides a framework for SHAs to do cross-asset risk identification. This multi-level and multi-disciplinary approach ensures that risks are linked to strategic goals and facilitates risk mitigation at its highest level ( 3 ). The risk events identified from these workshops represent a synthesis of network level and program level, as well as project level risks. In short, this workshop identifies all the risk events relevant to the agency and can be a useful tool for data elicitation for risk management.
Risk Register as a Tool for Data and Risk Event Elicitation
Risk register is the most popular, if not the only, risk identification tool used by SHAs ( 3 , 26 ). A risk register summarizes an agency’s risks and how they are analyzed, and records how they will be managed and by whom ( 27 ). Risk registers can be customized for any agency. Table 1 is a typical risk register from one of the SHA TAMP documents. It shows that that, while identifying risk events is an important outcome of the workshop, it fails to address the identification of data associated with these events. Addressing data identification provides opportunities for SHAs to evaluate their data collection and integration methodologies in a way that addresses data limitations to properly track and update risk registers. In addition, the risk workshop can go a long way to addressing the system challenges of data integration discussed in the preceding section. Having all division heads and asset liaisons in the same room provides a great opportunity to define or refine data collection rules that ensure various divisions manage their data in systems that can communicate seamlessly with each other. It provides a solution to mitigating the social and administrative challenges facing data integration as it allows all the data owners to be on the same page. This qualitative process can be very useful for identifying relevant datasets to integrate as well as missing data to collect.
Typical Risk Register Example

Risk registers from 26 TAMP documents on the AASHTO TAM portal were reviewed to gauge common risks that agencies have identified. Risks were generally organized by level (agency, program, and project) or by categories as defined in NCHRP Project 08-93 report, Managing Risk across the Enterprise: A Guidebook for State Departments of Transportation ( 28 ). There were still some agencies, such as Iowa DOT, that did not employ any template in summarizing their risk registers. Common risk events were categorized as one of the following:
Finances: risks related to the long-term stability of asset management programs such as: Unmet needs in long-term budgets Funding stability Exposure to financial losses
Information and decision: risks related to the implementation of asset management program such as: Lack of critical asset information Quality of data, modeling, or forecasting tools for decision making
External risks: these are risks involving both human-induced and naturally occurring threats such as: Climatic or seismic events: extreme weather, flooding, earthquakes, slope failures, rock falls, lightning strikes Winter weather operations Climate change Terrorism or accidents Paradigm shifting technologies (e.g., automated vehicles)
Asset condition: risks associated with asset failure such as: Structural Capacity or utilization Reliability of performance Aging Soil and subsurface utilities Maintenance or operation
These common risk events can provide a way for the SHAs to organize their overall data collection and management processes to support risk management. The focus is not just on identifying new data to collect but also identifying existing data that quantifies risk events. This ensures data is managed in a way that can support the risk management process, especially as it feeds the decision support framework. Table 2 summarizes risk events mentioned in the registers and their frequency.
Summary of Risk Events Identified

Risk Register as a Framework for Identifying Assets for Inclusion into TAMP
Most asset management programs focus on pavements and bridges. However, there are other ancillary assets that are needed to ensure the safe and efficient operation of a transportation network. Including these in a risk management program should be logical, however, there is need for a business case to understand the relative benefits of adding these ancillary assets. Limited resources and budget constraints often force agencies to make difficult decisions with regard to resource allocations. Therefore, agencies looking to expand their asset management programs to include ancillary assets need a means of determining the benefits and costs associated with system development, data collection, and data management. Some studies have looked at the criticality of assets for inclusion in TAMP ( 29 – 31 ). This consideration is important in designing the framework of a database needed for risk management. A database must account for all critical assets, as long as there are data to justify their inclusion and impact on the overall agency goals and objectives.
Risk registers are designed to capture the risks agencies consider important in fulfilling their strategic objectives and goals. For this reason, the risk identification process is a good way to understand what assets agencies deem important for inclusion into their formal risk management. Based on the risk registers reviewed in the previous section and summarized in Table 2, agencies explicitly identified assets that they considered important in their risk management efforts. The other assets identified, besides pavements and bridges, were intelligent transportation systems (ITS) devices and elements, culverts and other subsurface drainage facilities.
The purpose of this study is to propose a framework for designing a database for risk management process. It does not define what assets are important, instead it is designed with the view that agencies could prioritize assets according to individual agency needs as they deem fit.
Risk Register as a Framework for Identifying Risk Measures
In agencies’ risk registers, risk was evaluated with regard to likelihood of service interruption and the impact based on a scale from high to low severity ( 3 ). The scale shows the risks identified by the task force along with their determination of the likelihood of the event occurring, and then assessed for its consequences, from catastrophic to negligible. This qualitative process does not provide context for the agencies to visualize how the combination of various risk events and strategies would affect strategic goals and performance targets. It also does not address how the agencies will use the risk registers for decision making. Having all stakeholders in attendance for the risk workshop allows them to understand context and other items the qualitative process does not provide. It provides a collaborative platform for synthesizing risk measures that support cross-asset decision making and optimization from collectible data or expert elicitation.
Historical data can be an effective tool to understand system performance. This data can be very important for analyzing the causes of asset failures, including spatial and temporal dynamics, to prioritize identified risks and develop a quantitative risk metric. These metrics help to answer pertinent questions such as: What was the impact of the risk event on the infrastructure? Was that impact expected? If the impact varied from expected, why ( 3 )? These questions will require the development of datasets on various risk events, processes, and measures to be able to generalize across risk events as well as agencies. Even though risk measurement is not the same as risk management ( 32 , 33 ), the process of risk measurement can provide insights into how organizations could manage similar events.
It is difficult to understand what cannot be measured, so risk mitigation can be affected by lack of a well-defined risk measure. For example, if there were two possible mitigations for a risk occurrence, the lack of a risk measure makes it difficult to employ an optimization process to make the best decision between understanding the calculated risks and the cost of mitigation ( 34 ).
Proposed Risk Workshop Outline
It has been established that the risk workshop is the risk management tool of choice by SHAs. The overall goal of the risk workshop is to generate risk registers that will drive the risk management process, informing decision making as well as providing a guarantee that threats to agency goals have been identified and adequate mitigation protocols put in place to ensure seamless operations. As a result, the workshop is the most important aspect of the data elicitation as it determines the sustainability of the risk management process by not only identifying risk events and measures but also linking them to data needed to revise and update the risk registers. For the workshop to be successful, the SHA should already have data governance documentation in place; if not, a task item should be added to the workshop to synthesize data governance practices since it is a very essential part of addressing data integration challenges.
A successful risk workshop should have the right composition of internal and external stakeholders. The external stakeholders can be from other SHAs, academia, and the private sector so that the SHA can have a balanced approach to risk identification that not only documents existing threats but pre-empts future threats. The risk workshop should be highly participatory to ensure extensive interactions across the agency’s asset managers, departmental heads, and senior executives, as well as those in specialist disciplines such as governance, compliance, risk management, and audit. The end goal is the formulation of effective risk registers and identification of data needed to track and update the process. In addition, the outcome should provide valuable input into the design of the API for translating data from various divisions and data management systems into a central risk database.
The following is an outline of the workshop:
An opening session on the function and goals of risk management referencing the agency existing policies
A review of the basic risk management process encompassing ○ Risk event identification ○ Priority assets ○ Review of data governance documentation ○ Evaluation of risks/risk measures identification ○ Application of risk tolerance ○ Mitigation strategies ○ Tracking effectiveness of mitigation strategies ○ How to track new risks/revise existing risk events
Breakout session by asset types ○ Introduction of a generic risk register containing the key fields to be completed ○ Risk event identification by asset type ○ Data needs and risk measures identification for each risk event identified ○ Risk mitigation strategies and monitoring of effectiveness
Full session ○ Harmonize risk event identification, resolving overlaps and duplicates ○ Describe risks in clear and plain manner ○ Identify most appropriate risk owners ○ Identify relevant existing data and data needs for evaluating risks in relation to probability and impact in monetary terms ○ Identify risk mitigation strategies ○ Identify relevant risk metrics for tracking and measuring risk events and mitigation, residual risks and additional mitigation approach ○ Identify risk levels and triggers and clear line of sight between risk management and day-to-day management ○ Identification of level of aggregation- highway (linear) corridors or regional (area) corridors
Closing session for compilation of risk registers, data needs, priority assets, risk measures, and identifying cross-asset collaborations. Time should also be set aside to update applicable data governance documentation.
Table 3, which is a modification of Table 1, shows an expected deliverable from the proposed workshop with the shaded columns to be filled out during the workshop.
Modified Risk Register Example

Data Aggregation
A successful risk workshop generates as outputs all the data SHAs need to define, measure, and track risk. Data aggregation is where data is pulled from all the identified sources of data for risk management and occurs during the spatial relationships analysis segment in Figure 2. This is accomplished with the help of an API. In its simplest form, an API is a data integration and transformation tool for automating data processing workflows. SHAs can either implement their own API using popular programming tools such as Python and R or use a commercially available API such as Feature Manipulation Engine (FME). API makes cross-platform development simpler with availability of programming languages, while allowing developers to create seamless user experiences for end-users. In addition, API enables declarative data fetching where a SHA can specify exactly what data it needs from an API. As a result, the API allows for fine-grained insights about the data that is requested on the backend. As each SHA specifies exactly what information it is interested in, it is possible to gain a deep understanding of how the available data is being used. This can help in evolving an API and deprecating specific fields that are no longer used.
Figure 4 shows a generic example of how APIs work. In the example, different APIs are written depending on the source, format, and data required. The API reads data from the various sources and formats; from each source, it extracts only the information needed and integrates it into a risk database for the purpose of calculating a risk metric for the asset. The API can be updated to extract additional information from each source as needed.

Application programming interfaces (APIs) at work.
The use of APIs can also help to deal with the four dimensions of data. By extracting only relevant information, the APIs provide a way of storing only what is needed thereby managing the volume dimension of data. Having different APIs for different formats and sources provides a seamless way to manage the variety dimension. In addition, based on input from the risk management task forces, APIs can be implemented to focus on the veracity dimension which is responsible for keeping the data cleaned and current. The use of APIs provides an automated way of dealing with the speed at which data is collected. APIs can be programmed to run in the background every time new data come in, keeping the dashboards, queries, or reports current.
Logical Segmentation for Risk Management
Transportation agencies’ operations will always require data collection and management specific to their individual assets. To mitigate the logical challenges of data integration and preserve the flexibility for risk mitigation at the level of its biggest impact on overall agencies’ goals, this study adopts a corridor approach to risk management data integration and management. GIS becomes the tool for integration since most DOT data are spatially-enabled.
In discussing the logical segmentation of risk management, it is important to look at its impact on the levels of risk: enterprise (agency), program level, and project level. A bottom-up approach can be very helpful. For example, a project can be made up of several assets; a program can be made up of several projects; and the agency view encompasses several programs.
Corridor Segmentation
Corridor segmentation allows SHAs to prioritize their networks in ways that best reflect their funding decisions and political realities, as well as usage of the networks. In addition, it provides a common logical segmentation for data integration that drives decision making. Corridor segmentation allows for the integration of asset and risk event data at a granular level that makes the most sense from an investment and programming perspective. For example, if a storm were to take out a bridge, the impact of that risk event is not just at the bridge, but all the assets connected to that bridge. Decision making based solely on the bridge will only capture the replacement cost of the bridge and will miss out on the full cost of the risk event. To simplify the process, each agency can use its already existing corridor segmentation that fulfills its investment decision making and programming analysis.
The corridor segmentation can be defined by a point, line or area (polygon) based on what the agency determines to be the common denominator for tracking costs of the risk event. For instance, risk assessment that is focused solely on road users can be sufficiently defined by linear extents such as highway corridors. On the other hand, risk assessments based on land use, watersheds, and population will benefit from an area or regional corridor such as counties, districts, or urban areas. In any case, the framework is designed to work regardless of the level of segmentation as long as there is a process to integrate the input to the corridor.
Risk Calculation
Risk calculation provides a way to synthesize risk measure. This measure then drives the quantification of risks for the purpose of risk prioritization and mitigation. In some circumstances, quantitative data for a risk is not always available, in which case a qualitative risk analysis alone will have to suffice. Risk calculation provides a way to translate data into metrics, which provides a way to quantify the understanding of risk events and their impacts on the network. This in turn creates the opportunity for ensuring that resources are matched to needs to protect the network from avoidable failure. Risk calculation requires a comprehensive cross-asset database of all important data items that agencies need to successfully execute their risk-based asset management plan. This database is the output from the data aggregation stage shown in the data integration framework in Figure 3 and facilitated by the proposed risk workshop. During the workshop, risk events are elicited based on consensus. For each risk event, a risk measure is proposed. For each risk measure, the risk workshop identifies the existing data and determines missing data that need to be collected to calculate overall risk. All of these data from different SHA divisions and formats are integrated in the data aggregation stage into logical segmentations for tracking the risk. Defining risk calculation formula for each risk event is not within the scope of this paper, however, the generic formula for risk calculation is risk as a function of likelihood of an event occurring and the consequences of the event as shown below:
Risk = likelihood × consequences ( 35 ).
Estimate Likelihood
The objective here would be to estimate the likelihood (probability) of occurrence for each risk event at the corridor level and generate a risk map for the entire network based on spatial attributes as well as historical data. Individual probabilities will be estimated for each risk event for the corridor and then a total risk probability will be calculated for each corridor. In the absence of a historical data, expert knowledge or engineering judgment will suffice.
Estimate Consequences
For each risk event, its consequences in monetary terms would be estimated based on the severity and frequency, and as a function of time for condition-based risk events. The consequence will be estimated using data from previous events for that corridor as well as using data from similar events across the country or around the world. The consequences will be human, economic, and societal costs associated with the risk event in addition to the replacement costs of the infrastructure in the affected area. Costs will be estimated for each risk event for the corridor and then a total risk cost will be calculated for each corridor. In the absence of historic data, a quantifiable measure of consequence will suffice that captures the value of the target to the network.
Levels of Data Aggregation for Calculating Risks
Three levels of data aggregation are employed in this data integration framework for tracking the common risk events, namely: asset level, corridor level, and hybrid corridor (program) level.
Asset level: Transportation systems in general are made up of a network of spatially-distributed system of physical assets such as bridges, pavements, and other assets in the right of way ( 16 ). Assets are usually managed in representative units. For example, assets can only be grouped together if they were built at the same time, with the same material, same maintenance schedule, and same usage. This is vital to capture each individual asset’s deterioration and risk dynamics. Risk monitoring at the asset level is very important since the assets are the dynamic pieces for which agencies are always trying to maximize the lifespan, usefulness, and efficiency. As a result, asset level aggregation is ideal for estimating condition-related risk events and information and decision-related risk event.
Corridor level: The purpose of corridors is to create representative segmentation for aggregating assets and tracking the variables identified for the risk measure. Ideally, a corridor should have similar risk exposure such as similar land use, traffic volume, and environmental dynamics. Corridor level is suited for calculating external risks.
Hybrid corridor level: This is a corridor delineation that is not based on representative samples but purely for tracking program level funding. This corridor is not for tracking risk or performance but for tracking funding levels.
Figure 5 captures in graphical form the levels of aggregation and risk calculation. Risk is calculated at the individual asset (project) level and then aggregated to the corridor levels where the corridor assumes the risks of the individual asset in addition to the corridor level asset (external events risks). If an agency has a hybrid corridor that is not cognizant of the similar risk exposure, then that hybrid corridors assumes the risk of the individual assets and corridors that make it up. Care should be taken that each corridor is self-contained, that is, assets should not overlap corridors and corridors should not overlap hybrid corridors.

Levels of aggregation.
Example
After organizing the risk workshop, a SHA identified flooding as the most prominent risk event. Along with that they identified flooding likelihood as the risk measure and watershed data, socio-economic data, traffic volume, weather data, and so forth as data sources for the purpose of tracking/quantifying the risk. These data are then integrated for every asset. A flood risk estimate is calculated for each corridor based on the data sources identified. Accurate flooding predictions depend on land use, geology, and hydrology of an area, combined with weather forecasts. Flooding consequences will be a function of economic activity in the area, traffic volume, asset replacement values, and so forth. Using the risk calculation, the SHA can determine the associated risk, in dollars, to assign to each corridor. This risk, among other things, will be a function of the threat ranking, asset value, and unmitigated vulnerabilities ( 35 ) such as a failing bridge on the corridor or roads in poor condition. Table 4 is an example of the tabulation of the risk calculation output. The output from the risk calculation stage can be used to create a flood risk map for visualization and further analysis for driving decision making, as shown in Figures 6 and 7. Based on the output, the agency can decide on risk tolerance and triggers for mitigation.
Risk Calculation Output Example


Application of the data integration framework.

Complete risk management database framework.
Decision Making
The intent of the database integration framework is to produce a dynamic risk management database that will take the place of the static risk registers document. This database becomes a dynamic repository of knowledge and business intelligence by providing a platform for risk analysis, tracking, and updates, as shown in Figure 7. In addition, Figure 7 captures the utility of the data integration framework that provides feedback for future risk workshops to launch from.
Database Contents
Patterson and Neailey ( 36 ) carried out an extensive literature review of what information should be contained in a risk register. Based on that review and the uploaded TAMP documents on the AASHTO TAM portal, it was proposed that the risk management database at a minimum contain the following information for each corridor and risk event:
Risk identification number that ties all corridors with the same risk as well as tracking risk dependencies
Brief explanation of the risk
Asset inventory: number and type of assets on the corridor
Condition of assets based on agreed performance measures
Environmental level data: physical attributes, proximity to watershed, geographic properties, soil type, and so forth
Socio-economic indicators: population, land use, traffic volume
Probability value: probability or likelihood of the risk occurring, estimated during the risk calculation stage of the data integration framework
Risk measures: based on the elicitation stage and determined during the risk calculation stage
Impact measure: impact of the risk in monetary terms value determined during the risk calculation stage
Area of impact: estimated as a function of the geographic area as well as the socio-economic markers near the corridor
Severity of the risk event: function of the area of impact
Ranking of each individual risk within the corridor. Ranked risks are those with a high severity and high consequence within the corridor
Total risk on the corridor: weighted sum of all the risks in the corridor
Risk monitor: indicates if the risk has increased, remained the same, or decreased in severity since last available data collection
Risk owner: which agency is responsible for the risk
Risk mitigation plans: based on risk management and data elicitation workshop
Risk status: indicates whether the risk is active or whether it has been mitigated
Risk potential: indicates whether the risk can lead to other risk and the potential for a cascade effect
This information is designed to create a framework for the risk management database to be able to carry out risk identification as well as provide insight into how the risk can be quantified based on available data. While compiling this list of fields may seem burdensome, not all fields are required at the outset. Most of these fields can be added on as the agencies grow in confidence and formalize the framework required for successful risk management. The minimum proposed fields for starting a risk management database are:
Asset inventory: number and type of assets on the corridor
Condition of assets based on agreed performance measures
Environmental level data: physical attributes, proximity to watershed, geographic properties, soil type, and so forth
Socio-economic indicators: population, land use, traffic volume
Risk measures: based on the elicitation stage and determined during the risk calculation stage for each asset and for each corridor depending on the risk event
This subset of fields provides a way for SHAs to integrate risk to ensure that their investment strategies are able to drive their asset management objectives as they expand their risk management programs.
Levels of Decision Making
Similar to the levels of data aggregation, this comprehensive database of all the risk variables that the agency has identified for capturing its risk snapshot provides decision makers with information for addressing risk mitigation at the level that best accomplishes it. Capturing risks at the asset level allows decision makers to be mindful of high risk assets and put in place trackers and mitigation protocols to minimize the network’s exposure. This can be accomplished by simple mapping of asset risks across the network.
Corridor level tracking of risks allows for cross-asset decision making. By tracking the individual asset’s risk in addition to the corridor risk exposure provides decision makers with the data needed to understand what is driving risk at each corridor. Using data analytics tools, this comprehensive database will provide decision makers with the opportunity to perform cross-asset optimization and explore the implications of various investment scenarios as well as various risk dynamics or failure mechanisms. Most importantly, this will provide the agencies with an objective and consistent way of maintaining and evaluating its risk-based TAMP.
Closing the Loop (How It All Fits Together)
There is no doubt that risk management requirements of MAP-21 and FAST Act legislation are a game changer for many SHAs. One of the biggest implications of this is the need to radically improve the SHA’s data capabilities and architecture associated with risk management, thus enabling all stakeholders to get a clear and comprehensive view of the agency’s risk exposure. These requirements are not only a new set of obligations for the SHA but are also a tremendous opportunity to strengthen existing initiatives to address data shortcomings associated with risk management. These implementations may differ from one agency to another, but the goal should be the same: to establish a single source of data for risk management that can be accessible and useable for driving investment and programming decisions.
The framework proposed in this study does not require a complete overhaul of the agency’s data management process but instead streamlines the process to enable the data to be relevant across divisions and minimizes costs arising from duplication of efforts. It also provides a way for the agency to quickly identify what missing data are needed to complete their risk management process as well as improve quality assurance of their current data collection process.
Based on the risk and data elicitation process, the available data are then integrated with risk event information and aggregated to the corridor segmentation using an API that will transform all the data into a risk measurement database. In cases where the risks cannot be quantified, expert knowledge estimation will suffice. As new data are imported, APIs will aggregate it with existing data and update the database, providing a means of tracking performance of the mitigation plans ( 37 ).
The contributions of this study include a database integration framework, modifications to the risk workshops as a tool for data elicitation, the use of APIs for extracting data for risk calculations, and APIs to display a suite of dashboard applications for visualization, data mining to support funding, investment strategies as well as operational decision making.
Conclusion
The scope of this study was to propose a framework for designing and developing a risk management database by integrating all the relevant data that drives an agency’s risk management process. It identified the challenges facing data integration implementation and recommended best practices for overcoming those challenges by proposing modifications to the risk identification process that is currently in place at all SHAs. The proposed modifications capture the qualitative, quantitative, and collaborative nature of risk management.
The proposed risk register workshop taps into the synergy demanded of effective risk management by putting the asset managers, risk managers, and data managers in the same room and on the same page. This will improve not just the data integration efforts but it will vastly enhance the value of insights that can be synthesized from the data collection endeavor.
The value of the proposed workshop to the data elicitation and integration process will be enhanced if there is a data governance and stewardship process already in place at the SHA. This study recommends that SHAs should keep their data governance documentation up to date and in line with the objectives of their risk management efforts. The data governance documents should be revised and updated along with the risk registers and risk metrics to keep all the pieces moving in the same direction. This approach leads to a risk-based investigation focusing on data collection, identification of risk events and quantifiable measures, identification of critical assets to narrow focus, and adoption of similar data collection specifications to enhance seamless data sharing and minimize duplication of efforts. This will invariably improve the accuracy of the risk calculations and the utility of the risk management database.
Footnotes
Author Contributions
The authors confirm contribution to the paper as follows: study conception and design: I. Nlenanya, O. Smadi; data collection: I. Nlenanya; analysis and interpretation of results: I. Nlenanya; draft manuscript preparation: I. Nlenanya, O. Smadi. All authors reviewed the results and approved the final version of the manuscript.
Declaration of Conflicting Interests
The author(s) declared no potential conflicts of interest with respect to the research, authorship, and/or publication of this article.
Funding
The author(s) received no financial support for the research, authorship, and/or publication of this article.
