



Abstract
The hydraulic design of bridges is a discipline that requires a strong measure of engineering judgment. Developing good engineering judgment can take years of experience, and generally increases one project at a time. A supplemental tool that can promote the development of engineering knowledge and judgment is to compile, analyze, and graphically present hydraulic data associated with stream and bridge-design characteristics from previously analyzed bridges. If the data set is sufficiently large, graphs developed from such an effort can provide the engineer with an enhanced picture of stream and bridge-design characteristics, helping them further develop their engineering knowledge and judgment. Furthermore, such graphs can function as project scoping tools and hydraulic-design review tools. Using selected data from approximately 300 bridge-scour studies in South Carolina, previously conducted by the U.S. Geological Survey, and limited hydraulic bridge-design data for approximately 200 bridges in South Carolina, trends in stream and bridge-hydraulic characteristics were evaluated including channel width, floodplain width, flood flow depths, stream slopes, bridge backwater, bridge flow velocity, and bridge lengths. Selected relationships are presented in this paper and should serve as a valuable tool for better understanding stream and bridge-hydraulic characteristics in South Carolina.
It is typical to see design engineers grow in engineering knowledge and judgment with increasing years of experience. In the case of bridge-hydraulic engineers, design experience develops their knowledge of regional stream characteristics, such as stream slopes, channel and floodplain widths, and soil types. This experience also serves to inform them of regional stream features that may influence their hydraulic design. In addition, design experience develops the engineer’s knowledge of the typical range of bridge-design characteristics, such as bridge length, bridge flow velocities, and bridge backwater (increased water elevation caused by the bridge), informing them of the range of acceptable design values for a given bridge project. In general, this knowledge and judgment is acquired one bridge at a time, and developing a strong measure of expertise is a lengthy process. A supplemental tool that can promote the development of engineering knowledge and judgment is to compile, analyze, and graphically present data associated with stream and bridge-design characteristics determined from previous bridge-hydraulic studies. If the data set is sufficiently large, graphs developed from such an effort can provide engineers with a more comprehensive picture of the range and trend of selected stream and bridge-design characteristics, providing tools to assist in developing engineering knowledge and judgment. Furthermore, these graphs can provide simple but useful tools for scoping and reviewing new design projects. With respect to scoping new bridge projects, the graphs can provide understanding of the typical range of hydraulic-design variables at previously designed bridges, giving insight into probable values at the site of interest, before undertaking a detailed hydraulic study. With respect to reviewing detailed bridge designs, the graphs can help the engineer to evaluate whether the hydraulic-design variables for a proposed bridge fall within the range of previously designed bridges, helping the engineer to discern whether the proposed bridge design is reasonable. Although such graphs cannot serve as primary design tools, they can promote engineering knowledge and judgment, and provide an added measure of insight and quality control to the bridge-hydraulic design process.
There are several sources of stream and bridge-hydraulic data for South Carolina bridge sites that can be used to develop these supplemental tools, including the U.S. Geological Survey (USGS) South Carolina bridge-scour investigations and the South Carolina Department of Transportation (SCDOT) bridge-design database. The USGS bridge-scour investigations consist of a series of seven studies ( 1 – 7 ) conducted from 1990 to 2016, that were done in cooperation with SCDOT. The primary objective of these investigations was the advancement of the state-of-the-knowledge of bridge scour in the field setting, which led to the development of the South Carolina bridge-scour envelope curves ( 7 ). The USGS bridge-scour investigations have companion databases that include stream and bridge-hydraulic data for approximately 300 bridges. Selected data from the databases associated with reports by Benedict and Caldwell ( 3 , 4 ), and Benedict et al. ( 7 ) were used in the analysis presented in this paper, and the databases can be downloaded at the internet address included in the cited references. In addition to the USGS data, the SCDOT bridge-design database (unpublished) contains limited hydraulic bridge-design data for approximately 200 bridges previously designed to SCDOT standards. The USGS and SCDOT data provide a valuable resource for understanding general trends of stream characteristics and hydraulic bridge-design variables in South Carolina.
This paper presents the results of a limited effort to compile, analyze, and graphically present data associated with stream and bridge-design characteristics in South Carolina, with the objective of creating tools that can help develop engineering knowledge and judgment, and assist in the review of hydraulic design of bridges in South Carolina. Though the tools presented in this paper are specific to South Carolina, they demonstrate how other states could use hydraulic data from previously designed bridges within their state to develop similar tools.
Description of Study Area
South Carolina has a land area of about 31,100 mi2 and is divided into three physiographic regions including the Blue Ridge, Piedmont, and Coastal Plain regions. The data used in this investigation primarily represent sites located in the Piedmont and Coastal Plain regions and exclude tidally influenced streams near the coast. A brief description of these regions follows. The Piedmont physiographic region is located in the northwestern part of South Carolina and covers approximately one-third of the state. The characteristics of Piedmont streams generally consist of moderately deep river valleys, moderate stream slopes, well-defined channels, and densely vegetated floodplains. The soil characteristics of stream channels in the Piedmont generally consist of varying thicknesses of sand underlain by rock, and the floodplains consist of alluvium deposits of clay, silt, and sand, with varying degrees of cohesiveness. The Coastal Plain physiographic region is located in the lower part of South Carolina and covers approximately 60% of the state. In contrast to the Piedmont, Coastal Plain streams generally have shallower river valleys and flatter stream slopes. The larger Coastal Plain rivers have well-defined channels, whereas the smaller streams often have shallow, swampy channels. Floodplains in the Coastal Plain are typically swampy and densely vegetated and tend to be wider than those of the Piedmont. The soil characteristics of stream channels in the Coastal Plain generally consist of varying thicknesses of sand, underlain by sedimentary rock, and the floodplains consist of sandy alluvium deposits. (This information was summarized from Benedict et al. [ 7 ] in which a map and additional information about the physiographic regions can be found.)
Stream Characteristics in South Carolina
The USGS in cooperation with SCDOT conducted field investigations of scour at over 300 bridges in South Carolina ( 3 , 4 , 7 ). Data from these investigations were compiled into digital databases that included limited stream characteristics such as drainage area, stream slope, bank-to-bank channel width, floodplain width (left edge to right edge of water), sediment size, and flood flow depths and velocities for the 1% annual exceedance probability (AEP) flow, also called the 100-year flow. Although these data have limitations, they offer a valuable resource to gain understanding of the range and trend of stream characteristics in South Carolina and can be used to evaluate whether a given stream has characteristics within the typical data range or may have unique characteristics. Table 1 provides a summary of the range and median values for selected stream characteristics based on the USGS data. Selected plots of these data and descriptions of the data trends follow. Logarithmic scales are used in some of the following plots to provide a better visual display of the data trends. Because of the scatter in the data, the trend lines and associated equations shown on the plots should not be viewed as strong predictive equations. (Note: Some sites in the USGS database had missing data and therefore, the amount of data for a given stream characteristic may vary from the actual number of sites shown in Table 1.)

Note: mi2 = square mile; ft/ft = feet per foot; ft = feet; mm = millimeter.
Stream Size and Channel Width
When conducting a hydraulic design for a bridge, Hydraulic Engineering Circular 20 (HEC-20) ( 8 ) requires that a qualitative assessment of stream stability be made. As a general rule, HEC-20 notes that the potential for channel scour depth and lateral bank erosion increases as channel size increases. To help assess the potential for stream instability, HEC-20 defines three stream-size categories based on channel width (bank-to-bank), as noted in the following:
Small Stream: channel width <100 ft;
Medium Stream: channel width between 100 and 500 ft; and
Wide Stream: channel width >500 ft.
Small streams will have a relatively low potential for stream instability, with increasing potential as stream size increases to medium and wide. Figure 1 shows a plot of channel width with respect to drainage area for the USGS data listed in Table 1. Though there is scatter in the data, the trend lines clearly display an increase in channel width as drainage area increases, with the Piedmont streams tending to have wider channels than those of the Coastal Plain for comparable drainage areas. These smaller channel widths in the Coastal Plain can probably be attributed to the wider floodplains, which carry a larger portion of the flow than the streams of the Piedmont. It is notable that about 78% of the sites in Figure 1 are classified as small streams, 20% are medium, and only 2% (six sites) are wide, indicating that a high percentage of bridges in South Carolina will cross small, relatively stable streams with channel widths less than or equal to 100 ft.
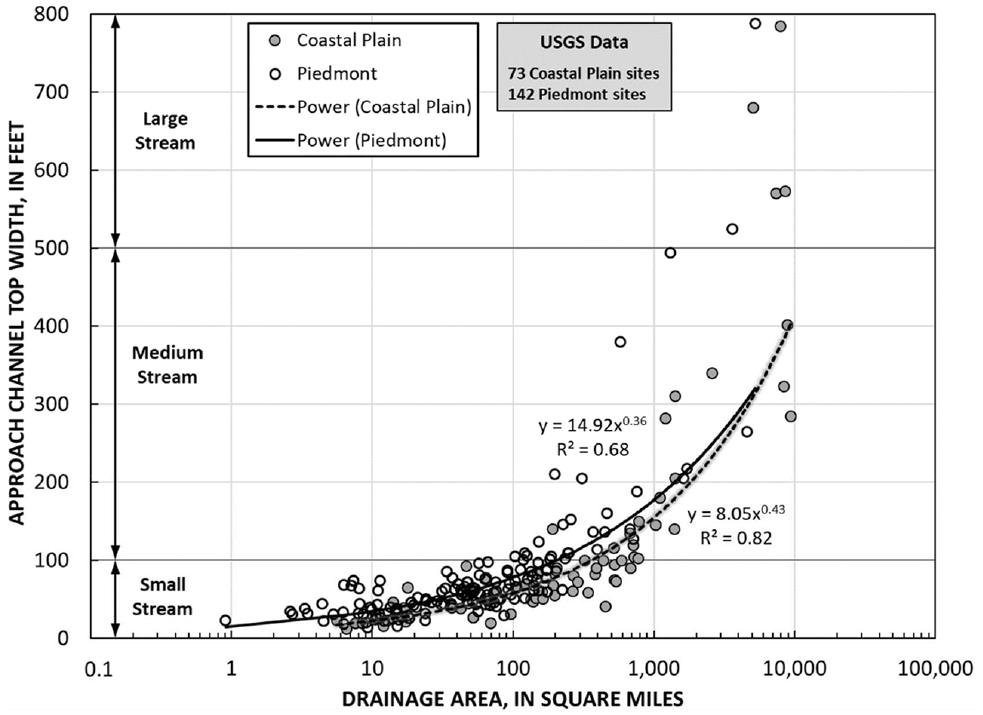
Relation of bank-to-bank channel width with respect to drainage area, for selected data in the Piedmont and Coastal Plain regions of South Carolina.
Another notable relationship in Figure 1 is that drainage area is correlated with stream-size category. For example, the data indicate that streams with drainage areas less than or equal to 100 mi2 all have channel widths less than 100 ft and can be classified as small streams. For drainage areas between 100 and 1,000 mi2, nearly 70% of the channel widths are less than or equal to 100 ft, indicating that most streams in this drainage area range can also be classified as small streams. Only as drainage areas begin to exceed 1,000 mi2 is there a predominance of channel widths greater than 100 ft indicating the presence of medium and large channel widths that have a higher potential for stream instability. Although drainage area does not correspond strictly with the stream-size categories presented in HEC-20 ( 8 ), it does provide additional guidance in evaluating stream size and potential for stream instability with increasing drainage area. Though there will be some regional differences, the data trends in Figure 1 are likely to approximate trends for the Piedmont and Coastal Plain regions in the Southeastern United States.
Floodplain Width
Figure 2 shows a plot of the approach floodplain width based on the 1% AEP flow with respect to the drainage area for the USGS data listed in Table 1. As with the channel data in Figure 1, there is scatter in the floodplain data, but a clear trend of increasing width as drainage area increases. In contrast to the channel data in Figure 1, the Piedmont streams tend to have a greater number of narrow floodplains, with the Coastal Plain having significantly wider floodplains (see range and median values in Table 1). HEC-20 ( 8 ) defines three floodplain-width categories using the ratio of floodplain width (FP) to channel width (CH) as follows:
Little or no floodplain: ratio FP/CH <2;
Narrow floodplain: ratio FP/CH between 2 and 10; and
Wide floodplain: ratio FP/CH >10.

Relation of the approach floodplain width for the 1% annual exceedance probability (AEP) (100-year) flow with respect to drainage area for selected data in the Piedmont and Coastal Plain regions of South Carolina.
Based on these categories, 79% of the Coastal Plain data in Figure 2 are classified as wide floodplains and 19% as narrow, in contrast to 38% and 53%, respectively, in the Piedmont. The trends in Figure 2, in conjunction with the floodplain-width category data, indicate that bridges crossing the wider floodplains of the Coastal Plain are likely to create larger contractions of flow than comparably sized bridges crossing the narrower floodplains of the Piedmont, creating a larger potential for scour at Coastal Plain bridges.
The floodplain width of a stream provides some perspective on the bridge length that may be required to assure that the designed bridge does not constrict flows too severely. In general, as floodplain widths increase, longer bridges will be required. To provide some perspective on the upper limits of bridge lengths associated with selected floodplain widths, Figure 2 includes the upper bound of bridge lengths in the USGS data, rounded to the nearest 100 ft, for floodplain widths of 100, 1,000, and 10,000 ft, and shows how bridge lengths increase with increasing floodplain width.
Channel and Floodplain Flow Depth
Figure 3 depicts a plot of the main channel and floodplain average flow depth based on the modeled 1% AEP flow, with respect to drainage area. There is scatter in the data, but there is a clear trend of increasing flow depth as drainage area increases, with the Piedmont streams generally having deeper flows than those of the Coastal Plain. The deeper flow depths in the Piedmont can probably be attributed to the narrower river valleys (Figure 2), which constrict flows and thus increase flow depths, and to the larger volumes of runoff associated with the clayey soils in the Piedmont. Whereas the scatter in the data is significant, the plots can give perspective of channel and floodplain flow depths during a large flow such as the 1% AEP flood.

Relation of the 1% annual exceedance probability (AEP) (100-year) average flow depth with respect to drainage area for (a) the main channel, and (b) the floodplain, for selected data in the Piedmont and Coastal Plain regions of South Carolina.
Stream Slope
Figure 4 depicts a plot of the stream slope determined from USGS topographic maps, with respect to drainage area. There is scatter in the data, but there is a clear trend of decreasing stream slope as drainage area increases, with the Piedmont streams generally having steeper slopes than those of the Coastal Plain (see range and median values in Table 1). A review of the data indicated that 80% of the Coastal Plain streams have slopes less than or equal to 0.001 ft/ft. In contrast, 73% of the Piedmont streams have slopes greater than or equal to 0.001, highlighting the differences between the upland streams of the Piedmont to those of the flatter streams of the Coastal Plain.

Relation of stream slope with respect to drainage area, for selected data in the Piedmont and Coastal Plain regions of South Carolina.
Observed Trends in the Data for Stream Characteristics in South Carolina
A review of Figures 1 to 4 indicated that the basic stream characteristics of channel width, floodplain width, slope, and flow depth are strongly related to drainage area, and as drainage area increases all of these properties increase, with the exception of stream slope. The data patterns highlighted that small drainage basins are typically associated with small streams in the upper reaches of a stream system, which tend to have smaller channel widths and floodplains, and steeper slopes. As drainage area increases, channels and river valleys widen, and slopes become flatter, which are data patterns that reflect the general concepts of stream geomorphology as presented in HEC-20 ( 8 ). But beyond confirming these geomorphic concepts, the relatively large data set provides a tangible picture of these concepts that moves the practitioner from the theoretical to the real world. Furthermore, for the practitioner in South Carolina (and potentially other Southeastern states), these plots provide tools that reflect the range and trend of streams in the Piedmont and Coastal Plain regions of South Carolina and could be used for scoping new projects, reviewing ongoing projects, and developing professional knowledge and judgment in relation to the regional characteristics of streams in South Carolina.
Hydraulic Characteristics of Bridges in South Carolina
Bridge-hydraulic variables such as bridge backwater, geometric-contraction ratio, bridge flow velocity, and bridge length are variables that must be given consideration in the hydraulic design of bridges. Understanding the general trends of these variables can help the design engineer develop judgment with regard to the reasonable range for these design variables and provide insight into field conditions that may adversely influence hydraulic performance. The selected data from the USGS scour investigations ( 3 , 4 , 7 ), as summarized in Table 1, provide hydraulic data at approximately 300 bridges that could be used to evaluate trends in these variables. The USGS data represent older bridges with many of them probably not representing current SCDOT design standards. To supplement the USGS data, limited hydraulic data for approximately 200 bridges, designed to SCDOT hydraulic standards, were selected from the SCDOT bridge-design database to further evaluate variable trends. All of these data were determined from one-dimensional flow models and, therefore, should be viewed as approximate values. However, the large amount of data should capture the general trends providing useful information on bridge hydraulics. Table 2 provides a summary of the range and median values for the bridge-hydraulic data. Plots of selected data and descriptions of the data trends follow. (Note: Some sites in the USGS and SCDOT databases had missing data and therefore, the amount of data for a given hydraulic characteristic may vary from the actual number of sites shown in Table 2.)
Range of Hydraulic Characteristics for Selected Bridges in South Carolina

Note: SCDOT = South Carolina Department of Transportation; USGS = U.S. Geological Survey; mi2 = square mile; ft = feet.
Bridge Backwater
Bridge backwater is the increase of the water-surface elevation upstream of a bridge resulting from the contraction of flood flows created by the bridge (Figure 5a). A common hydraulic-design standard is to limit the bridge backwater for the 1% AEP flow to 1 ft or less. As a general rule, bridge backwater increases as the severity of the flow contraction created by the bridge increases. The severity of the flow contraction can be approximated by the geometric-contraction ratio (Benedict et al. [ 7 ] and Shearman et al. [ 10 ]; Figure 5b), which is represented by the following equation:
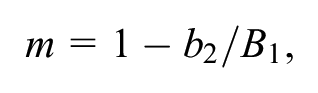
where
m = geometric-contraction ratio;
b2 = flow top width in the bridge opening for a given flood, in ft; and
B1 = flow top width at the upstream unconstructed approach floodplain cross section for a given flood, in ft.

When the geometric-contraction ratio has a value of 0, the bridge spans the entire floodplain and causes no contraction of flow, and therefore, no backwater. As the bridge decreases in length, in comparison to B1, the severity of the contraction and the backwater created by the bridge increases, and m approaches a value of 1. Figure 6 shows a plot of the bridge backwater, with respect to the geometric-contraction ratio, for the 1% AEP flow using the USGS hydraulic data from Table 2. The data in Figure 6 show significant scatter, but the trend lines indicate that bridge backwater increases as m increases. It is notable that the data in Figure 6 indicate that the approximate upper bound of bridge backwater begins to exceed the design standard of 1.0 ft as m nears a value of 0.75, and beyond this value, the slope of the upper-bound curve for bridge backwater becomes steep. Whereas the data show a majority of bridges having backwater less than 1.0 ft for an m of 0.75 or greater, the data pattern indicates the need for caution, with regard to excessive backwater, as m nears or exceeds a value of 0.75. The SCDOT design data did not include m values, so a comparable plot for the SCDOT design data could not be generated.

Relation of the bridge backwater with respect to the geometric-contraction ratio for the 1% annual exceedance probability (AEP) (100-year) flow, for selected data in the Piedmont and Coastal Plain regions of South Carolina.
Bridge Flow Velocity
The FHWA’s HDS-7 ( 9 ) manual for bridge design notes that an appropriate hydraulic design should prevent excessive flow velocities within a bridge opening so as to minimize potential scour damage to the bridge and adjacent properties. However, there is no specified value defining an appropriate design velocity through the bridge, and therefore, the engineer must rely on judgement to accomplish this task. Some practical steps for evaluating a reasonable design velocity might include (1) evaluating the scour resistance of the soils at the site, (2) for replacement bridges, evaluating the history of scour problems, in conjunction with the hydraulics at the existing bridge, to gain insight for sizing the new bridge, and (3) compare stream velocities for natural conditions with the velocities in the designed bridge opening to evaluate whether the increase in velocity at the designed bridge is acceptable. Table 2 provides a summary of the average bridge flow velocities for bridges designed to SCDOT hydraulic-design standards. The SCDOT data include bridge velocities for the 25- and 50-year flows, which are the design flows for secondary and primary roads, respectively. Figure 7 shows the relation of the 25- and 50-year average bridge velocities with respect to drainage area for the SCDOT data (Table 2) grouped by the Coastal Plain and Piedmont regions. There is significant scatter in the data with no strong relationship. However, the plots, in conjunction with the data in Table 2, promote understanding of the range and median values of velocities for previously designed bridges in South Carolina, which can help guide the engineer concerning the acceptable ranges of bridge velocities for current bridge designs. It is notable that approximately 90% of the SCDOT design bridges have velocities of 6 ft/s or less, with the Piedmont data exceeding 6 ft/s more frequently than the Coastal Plain data. Because velocities greater than or equal to 6 ft/s occur infrequently, it may be prudent to examine thoroughly the hydraulic design when velocities closely approach or exceed 6 ft/s, with possible refinement of the hydraulic design if deemed appropriate. (Note: Lines indicating the value of 6 ft/s are shown on Figure 7.)

Relation of the average flow velocity at the bridge with respect to drainage area, for selected designed bridges in the Piedmont and Coastal Plain regions of South Carolina for (a) the 25-year and (b) the 50-year flows.
Bridge Length
Figure 8 shows plots of the bridge length with respect to drainage area for the USGS and SCDOT data in Table 2. (Note: Relief bridges at multiple-bridge crossings were excluded from Figure 8.) There is scatter in the data, but there is a clear trend of increasing bridge length as drainage area increases. For drainage areas less than about 400 mi2, the trendlines for the SCDOT design data in both the Piedmont and Coastal Plain are slightly higher than the trend lines for the USGS data. This can probably be attributed to the USGS data representing older bridges, many of which were not designed to current hydraulic standards, and therefore are shorter in length than the designed SCDOT bridges. The USGS and SCDOT data in Figure 8 create a large data set consisting of 477 bridges, and the scatter and trend lines within these two data sets are very similar, indicating that the patterns in Figure 8 are reasonable. It is notable that 50% of the bridges in Figure 8 are 180 ft or less and 75% are 300 ft or less, indicating that most bridges in South Carolina will be relatively small. Although the relationships in Figure 8 are insufficient to use for design, they provide a good scoping and review tool for understanding the general trend of increasing bridge length with increasing drainage area for bridges in South Carolina.

Relation of bridge length with respect to drainage area for selected bridges in the Piedmont and Coastal Plain regions of South Carolina for (a) U.S. Geological Survey (USGS) data and (b) South Carolina Department of Transportation (SCDOT) designed bridges.
Conclusions
The current investigation used a relatively large set of data (Tables 1 and 2) to assess the range and trend of selected stream and hydraulic bridge-design characteristics in South Carolina. The analysis indicated that several stream characteristics are strongly related to drainage area, and as drainage area increases, channel widths, floodplain widths, and flow depths increase, and stream slopes become flatter. These data patterns are consistent with the general concepts of stream geomorphology as found in HEC-20 ( 8 ). Based on the stream-size categories presented in HEC-20 ( 8 ), 78% of the South Carolina data could be classified as small, relatively stable streams, having channel widths less than 100 ft, indicating that small streams will be the most prominent type of stream for bridge-design projects in South Carolina.
In relation to bridge-design data, the analysis indicated that bridge backwater is strongly related to the severity of the bridge contraction as represented by the geometric-contraction ratio (m), with the upper bound of backwater increasing as m increases. This rate of increase becomes significantly larger as m exceeds 0.75, indicating that it may be prudent to review the hydraulic design with added caution as m closely approaches or exceeds this value. With regard to bridge flow velocity, approximately 90% of the SCDOT bridge-design data have velocities of 6 ft/s or less, indicating that design velocities in this range are likely to be reasonable as long as all other design criteria are met. Because design velocities infrequently exceed 6 ft/s, it may be prudent to review the hydraulic design with added caution as velocities approach or exceed this value. Concerning bridge length, the USGS and SCDOT data showed very similar patterns, with bridge length increasing as drainage area increases. Approximately 75% of the 477 data used in the bridge-length analysis were 300 ft or less, indicating that most bridges in South Carolina will be relatively small.
Though the analysis and graphical tools presented in this paper could be expanded and improved, the analysis demonstrated how stream and bridge-hydraulic data compiled from bridge-hydraulic studies could be used to develop graphical tools that show the range and trend of selected hydraulic variables associated with bridge-hydraulic design. The graphical tools could be used to promote the development of engineering knowledge and judgment in relation to regional characteristics of streams and bridge hydraulics, and they could provide tools for scoping the hydraulics at new bridge projects and reviewing bridge hydraulic designs. Moreover, such tools could be invaluable for promoting in-house expertise in hydraulic bridge-design. Although the tools presented in this paper are specific to South Carolina, they illustrate how other states could develop similar tools specific to their states.
So, what is hiding in your bridge-hydraulic data?
Footnotes
Author Contributions
The authors confirm contribution to the paper as follows: study conception and design: S.T. Benedict; data collection: S.T. Benedict, T.P. Knight; analysis and interpretation of results: S.T. Benedict, T.P. Knight; draft manuscript preparation: S.T. Benedict, T.P. Knight. All authors reviewed the results and approved the final version of the manuscript.
Declaration of Conflicting Interests
The authors declared no potential conflicts of interest with respect to the research, authorship, and/or publication of this article.
Funding
The authors received no financial support for the research, authorship, and/or publication of this article.
Data Accessibility
The USGS databases used in the analysis are associated with Benedict and Caldwell ( 3 , 4 ), and Benedict et al. ( 7 ), and the databases can be downloaded at the internet address included in the cited references. The SCDOT bridge-design database is not published but is maintained by the SCDOT Hydraulics Office.
