



Abstract
The Mechanistic–Empirical Pavement Design Guide (MEPDG) considers a hierarchical approach to determine the input values necessary for most design parameters. Level 1 requires site-specific measurement of the material properties from laboratory testing, whereas other levels make use of equations developed from regression models to estimate the material properties. Resilient modulus is a mechanical property that characterizes the unbound and subgrade materials under loading that is essential for the mechanistic design of pavements. The MEPDG resilient modulus model makes use of a three-parameter constitutive model to characterize the nonlinear behavior of the geomaterials. As the resilient modulus tests are complex, expensive, and require lengthy preparation time, most state highway agencies are unlikely to implement them as routine daily applications. Therefore, it is imperative to make use of models to calculate these nonlinear parameters. Existing models to determine these parameters are frequently based on linear regression. With the development of machine learning techniques, it is feasible to develop simpler equations that can be used to estimate the nonlinear parameters more accurately. This study makes use of the Long-Term Pavement Performance database and machine learning techniques to improve the equations utilized to determine the nonlinear parameters crucial to estimate the resilient modulus of unbound base and subgrade materials.
The Mechanistic–Empirical Pavement Design Guide (MEPDG) has the objective to provide pavement engineers with reliable design and assessment methods of newly constructed and rehabilitated pavement structures. The MEPDG contains ranked hierarchical levels to determine the input values imperative in the design of pavements. Level 1 is the most accurate, but it requires a higher testing and monetary investment to establish the input values. Laboratory testing is the preferred source of data, but because tests such as the resilient modulus test often require sophisticated testing and lengthy preparation time, most state highway agencies consider them impractical for routine daily applications. The resilient modulus (MR) can be calculated from regressions and correlation equations in Level 2, even though this parameter may not be specific to the project site. Likewise, input Level 3 is based on default values recommended under NCHRP Project 1-37. In this case, resilient modulus for the optimum moisture content is selected based on the material classification. In summary, Level 1 requires site-specific measurement of the material properties from laboratory testing, and the other levels employ equations generated from regression models to predict the material properties ( 1 , 2 ).
The primary concern in the design and effective life performance of pavement structures is the accurate evaluation of the moduli of different layers ( 3 ). The procedures for conducting resilient modulus tests have been under continuous modification over the last years, for example, T 292-91, T 294-92, TP 46-94, T 307-03 and NCHRP 1-28A, the latter recommended as a part of the MEPDG ( 4 , 5 ). The consensus of the material model in the MEPDG is given by

where MR is the resilient modulus, θ is the bulk stress, τoct is the octahedral shear stress, Pa is the normalizing stress (atmospheric pressure), k1, k2, and k3 are model parameters determined from fitting the laboratory data to the model ( 6 ). The bulk normal stress and the octahedral shear stress are defined as


where σi is one of the principal stresses. Generally, the nonlinear k values are determined by using a best-fit regression analysis of the applied stresses and the measured strains in the laboratory. Parameter k1 in the MEPDG relationship is associated with the stiffness of the material. Parameter k2 is associated with the granularity of the material and is associated with the hardening of the material when traffic loads are imposed on the material. Parameter k3 is the term associated with the softening of the material as a result of the presence of clay. A proper set of constraints should be considered for the coefficients and exponents of the model so that the hardening term and the softening term are physically meaningful ( 4 ). A schematic of the test setup and equipment, along with representative test results of resilient modulus testing of a subgrade material, is shown in Figure 1.

(a) Resilient test setup, (b) its components, and (c) representative resilient modulus test results of a subgrade specimen ( 7 ).
Several correlations have been developed by various groups in the literature to predict the modulus from the soil index parameters. However, most models exhibit poor predictive power when they are tested on soils not used to develop the relationships ( 8 ). Using regression optimization techniques, Yau and Von Quintus ( 9 ) developed different models using physical properties to predict the k-coefficients for crushed and uncrushed gravel using data collected according to the Long-Term Pavement Performance (LTPP) Protocol P46.
Malla and Joshi used a model consisting of bulk stress and octahedral shear stress to calculate the MR of subgrade soils by developing equations for the regression coefficients in the constitutive model that relates them to various soil properties ( 10 ). Prediction models were developed by conducting multiple linear regression analyses using computer software SAS. Abdallah et al. developed a set of equations for estimating the three-parameter and the MR values for common Texas bases using MEPDG from several index parameters such as moisture content, gradation, and density ( 11 ). Dai and Zollars used a series of samples of subgrade soil from the Minnesota Road Research project (MnROAD) to determine the MR through confined triaxial tests ( 12 ). They applied the universal model and the deviator stress model to describe MR and during the process, several empirical relationships were developed to estimate the k-parameters. Nazzal and Mohammad examined the effectiveness of correlation equations developed by the LTPP and proposed an improved model to predict the resilient modulus coefficients of different subgrade soils in Louisiana ( 13 ). Thus, after conducting multiple regression analyses, they developed prediction models to determine the k-coefficients. Most of the models aforementioned were developed using linear regression methods to fit the parameters of the given models.
With the advance of regression methods, newer approaches have been pursued to estimate the k-coefficients and MR. Sadrossadat et al. used computational intelligence techniques, namely, linear genetic programming, to make an indirect estimation of the MR of pavements subgrade, where k-coefficients were determined by nonlinear regression and related to different properties of soils ( 14 ). Zaman et al. developed four different artificial neural network models to correlate resilient modulus with properties of subgrade soils and state of stress for pavement design application using materials from different counties in Oklahoma ( 15 ).
Objectives and Scope of Work
The objective of this study is to develop newer prediction models to calculate the regression coefficients utilized by the MEPDG for the resilient modulus model. The advantage of providing the nonlinear k-parameters is that these parameters are utilized toward the prediction of pavement responses using a modeling tool that incorporates the MEPDG nonlinear constitutive model, as is the case of finite element analysis algorithms or multi-layered equivalent-linear programs that allow the calculation of the modulus based on the state of stress applied. With the LTPP database’s index properties and using machine learning techniques, it was possible to predict outcomes based on multiple predictor variables. Newer and simpler equations were developed to estimate the nonlinear parameters more efficiently to determine the resilient modulus of unbound base and subgrade materials.
This paper includes a description of the methods utilized and material characteristics of the subgrade and unbound aggregate materials comprising the database. A section is provided to discuss the analysis of the results and document the models utilized to predict the k-parameters. The last section provides conclusions and recommendations drawn from this study.
Description of Regression Methods
Several researchers have successfully used artificial intelligence (AI) algorithms for modeling complex problems in pavement and geotechnical fields ( 14 , 15 ). AI can be utilized to predict the nonlinear relationship between variables in a model effectively, without considering any prior assumptions about the problem. Among the different available machine learning methods, symbolic regression (SR) is one the most popular applications of genetic programming (GP) and an attractive alternative to standard regression approaches because of its flexibility in generating freeform mathematical models from observed data without any domain knowledge ( 16 ). GP-based regression methods of performing SR have some limitations in relation to equality of dimensions. This method aims to formulate a function in the space dimensionally equal to the number of inputs, performing a global search of the expression for such function as symbolic relationships among the features (inputs), while the units of each feature do not play a central role ( 17 ). The genetic programming-based symbolic regression (GP-SR) approach performs a feature selection when it finds sufficiently accurate data models. Features that do not appear on the evolved expression can be considered redundant. User-friendly GP-SR tools have started to gain more attention from the scientific community over the last couple of years. This study makes use of Eureqa, a GP-SR tool ( 18 , 19 ), to propose equations that are capable of predicting the nonlinear k-parameters of the MEPDG model. The program provides a feature association matrix to identify highly associated variables to avoid multicollinearity, occurring when one predictor variable in a multiple regression model can be linearly predicted from the others with a high degree of accuracy. A schematic representation of this approach is shown in Figure 2. This tool proposed initial expressions formed by randomly combining mathematical building blocks such as algebraic operators (+, –, ÷, ×), analytical functions (e.g., ex, xn, log, sin, cos, etc.), constants, and state variables. New equations are formed by recombining previous equations and probabilistically varying their subexpressions. The algorithm retains equations that model the experimental data better than others and abandons unpromising solutions. After equations reach a desired level of accuracy, the algorithm terminates, returning a set of equations that are most likely to correspond to the intrinsic mechanisms underlying the observed system ( 18 ).

Schematic representation of symbolic regression using genetic programming.
A dataset was extracted from FHWA’s LTPP InfoPave pavement database to develop the models. Resilient modulus test information was available for about 5300 pavement materials, including unbound granular base, subbase, and subgrade materials. This information was available under Unbound Layer Resilient Modulus Worksheet tables. The data stored in those tables consisted of the loading conditions stress states, that is, confining pressure, the nominal maximum applied axial stress, resilient modulus, among other laboratory-obtained parameters (e.g., cycle number, resilient strain, cyclic stress, etc.). Before joining the aforementioned tables to other tables containing material properties (i.e., gradation, Atterberg limits, sample and optimum moisture content, sample and maximum dry density, clay percentage, and silt percentage), the nonlinear k-parameters were obtained from the loading sequences at each unique stress state. For this purpose, a nonlinear least-squares curve fitting method using a Trust-Region algorithm available in MATLAB® was used to fit Equation 1 ( 20 ). Using relational parameters, all tables were joined to generate a unique dataset with information consisting of resilient modulus, gradation, Atterberg limits, moisture contents, dry densities information, percentage of silt and clay content comprising a total set of 779 unbound pavement materials.
This reduced dataset containing all the necessary parameters was incorporated into Eureqa. To define the search for the models, it is necessary to determine the target expression, that is, the mathematical expressions that will be used to find the model that best fits the given dataset, both in relation to accuracy and simplicity. About 70% of the data was allocated as a training dataset, 15% was allocated to a validation set and 15% as a test set. The training data set is used to generate and optimize solutions whereas the validation set is used for model selection, that is, for identifying models for the final Pareto front of solutions. During the models’ searching process, the program constructs a set of different models whose progress and performance over time can be assessed in a Pareto front ( 21 ), as shown in Figure 3, allowing the evaluation of the fitness score of the validation set and the complexity of the model. Eureqa applies a penalty proportional to the formula’s complexity to avoid overfitting. The developed models’ precision potential is limited to the quality and quantity of the information utilized. Besides, by employing a feature impact analysis the program identifies which features (inputs) in a dataset have the most significant effect on a machine learning model’s outcomes ( 22 ).

Pareto front figure showing: (a) progress and (b) performance of model to predict k2.
Using the goodness-of-fit measures, such as the coefficient of determination (R 2 ), the absolute mean error (MAE) and the maximum error, the most appropriate function was chosen for validation. Figure 4 shows a list of multivariate polynomial SR models to predict the nonlinear parameter k2 and the cross-validation results of the selected model.

Regression equations proposed from genetic programming-based symbolic regression (GP-SR) algorithms to predict nonlinear parameter k2 and cross-validation of selected equation.
Material Characteristics
A reduced dataset with unbound aggregate materials for subgrade, subbase, and base materials was utilized for developing the regression equations using the GP-SR approach. Information used includes the percentage passing different sieve sizes (representing the gradation of the materials), their Atterberg limits, their percentage of silt and clay content, and the samples’ moisture contents and dry densities. Average grain size distribution values for all unbound aggregate base and subgrade materials are shown in Figure 5, along with the maximum and minimum observed percent passing values for each sieve size. Table 1 summarizes all parameters extracted from the LTPP database used to generate the mathematical prediction equations of the k-coefficients. The minimum and maximum values of the different parameters are also reported in Table 1.

Average gradations for base materials and subgrade materials.
Summary of Properties Utilized as Predictors Independent Variables

Discussion of Results
Using the GP-SR approach, three models were identified to predict the nonlinear k-parameters for the unbound base and subgrade materials along with the regression coefficients for these models. To arrive at the optimal predictive functions using this AI technique, the parameters listed in Table 1 were considered as inputs to obtain the following relationships. The best predictive model for k1 with R2 = 0.48 and MAE = 163.5 in the form of:
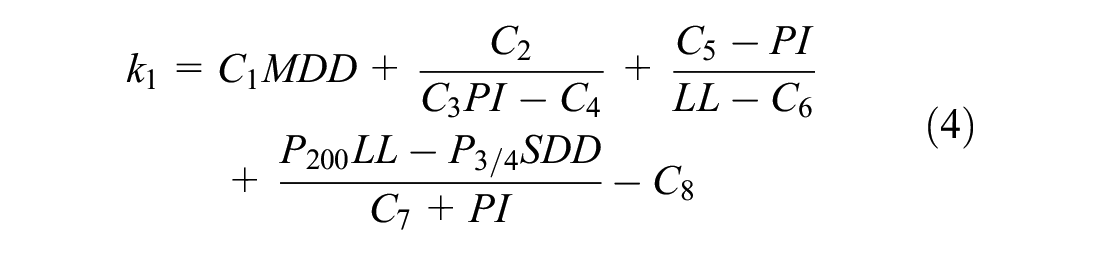
where C1 = 20.4, C2 = 147.7, C3 = 2.0, C4 = 19.0, C5 = 10.2, C6 = 49.0, C7 = 13.3, and C8 = 1.17×10³.
The following equation provided the best predictive k2 with R2 = 0.63 and MAE = 0.10:

where C1 = 2.98×10⁻³, C2 = 44.2, C3 = 173.1, C4 = 44.2, C5 = 61.3, and C6 = 0.16.
Likewise, the best predictive model for k3 with R2 = 0.53 and MAE = 0.40 was in the following form:

where C1 = 2.70×10⁻², C2 = 3.86×10⁻⁴, C3 = 9.74×10⁻⁶, C4 = 25.9, C5 = 0.86, C6 = 1.98, C7 = 25.5, C8 = 0.79, C9 = 4.64×10⁻³, and C10 = 6.92×10⁻³.
The cross-validation of the k-parameters obtained from the mathematical prediction models is shown in Figure 6. The models were able to predict most of the k-parameters within a 20% margin of error. The equations proposed and evaluated were obtained after execution times of about 62 h. However, other functions with more complexity and improved accuracy can be obtained if a longer time duration of the search is allowed. The database used to develop the prediction models is composed of 779 cases representative of 44 states. Table 2 summarizes the newer and existing models’ comparisons, showing that the newer models predicted the nonlinear parameters with a lower error compared with existing models. Moreover, the relationships may be improved if developed for specific sets of materials, similar to the approach followed by Yau and Von Quintus ( 9 ).

Validation of: (a) k1, (b) k2, and (c) k3 parameters from prediction models.
Comparison of Proposed Models and Existing Equations

Figure 6b, showing the cross-validation of parameter k2, exhibits two clusters of data points at k2 < 0.25 and k2 > 0.5, which were found to be linked to the fine-grained and coarse-grained materials. Considering that Yau and Von Quintus ( 9 ) and the MEPDG recommended two separate sets of regression parameters for the coarse-grained and fine-grained geomaterials, regression equations were also evaluated based on a percent passing of No. 200 sieve above 50% for coarser and below 50% for finer geomaterials. Unfortunately, equations with poorer accuracy were obtained and further evaluation is necessary.
Key Findings and Conclusions
The objective of this paper was to develop newer mathematical prediction models to determine the three-parameter constitutive model of subgrade and base materials that characterizes the nonlinear behavior of the pavement structure utilized by the MEPDG. GP-SR techniques, one of the AI techniques available, were used to develop these newer equations. Seventeen input variables were considered for the development of the newer equations for each of the k-coefficients. These variables consisted of the gradation percent passing, Atterberg limits, optimum moisture content, sample moisture content, maximum dry density, sample dry density, clay percentage, and silt percentage. To assemble such a database, different datasets obtained from the LTPP database were linked by sites sharing the information necessary for this study. To develop the equations, all identified parameters were incorporated into a tool using GP-SR techniques to predict each of the k-coefficients obtained in the laboratory. Three equations were identified capable of predicting the nonlinear k-parameters of the MEPDG model for subgrade and base materials with reasonable accuracy. The predictive capability of the derived models is limited to the quality and range of the data used for the development of the models and may affect the predictive power of the proposed equations. To address this limitation, further evaluation of the quality of the data, particularly that obtained from resilient modulus testing and the protocols followed, is necessary. Moreover, the proposed equations can be improved to make more precise predictions if a broader range of information was used.
Footnotes
Acknowledgements
The author is grateful to Karen Febey for the opportunity given to write this paper as part of the TRB Minority Student Fellowship. The author would like to especially thank Dr. Cesar Tirado who mentored this paper. Thank you is also extended to Dr. Imad Abdallah, CTIS Executive Director, and Dr. Soheil Nazarian, CTIS Director, and the graduate and undergraduate CTIS students for their support and mentorship during the development of this paper.
Author Contributions
The authors confirm contribution to the paper as follows: data collection: L. Camarena; analysis and interpretation of results: L. Camarena; draft manuscript preparation: L. Camarena. All authors reviewed the results and approved the final version of the manuscript.
Declaration of Conflicting Interests
The author declared no potential conflicts of interest with respect to the research, authorship, and/or publication of this article.
Funding
The author received no financial support for the research, authorship, and/or publication of this article.
