



Abstract
Safe vehicle speed estimation is essential for road traffic management and traffic safety. Improper truck speed on downgrades may lead to brake fade and/or failure, resulting in severe truck accidents such as runaway or out-of-control. This paper presents a model for predicting the safe speed of trucks from the perspective of preventing brake failure. The proposed model can be used to control the speed limit or as a reference for the revision of highway geometric design standards. In addition, by considering the downgrade design speeds recommended by AASHTO, the study offers an approach to deciding the downgrades that need escape ramps, those that need different speed limits, and those that may need exclusions for trucks over a certain weight. First, we simplify the downgrade driving status of a heavy truck into three types: speed control, emergency braking, and speed recovery according to the speed change status. The prediction model of the brake drum temperature with speed variables has been established in our previous study based on Newton’s energy conservation law. Finally, the boundary conditions for brake fade and failure temperature are determined. Results of parameter analysis show that the gross truck weight is the most significant variable. Other significant variables are grade, grade length, and emergency braking time. Compared with previous research results, the advantage of this method is that the permitted speed can be derived using the brake temperature prediction model supported by theory, without the need for extensive field tests.
Severe truck accidents often occur on consecutive mountain downgrade routes on highways because the brake drum temperature rises as a result of fade/failure temperature caused by improper speed. Therefore, a prediction model for a truck safe speed on such consecutive downgrade routes is crucial for improving truck driving safety down a graded descent of current conventional highways as well as the future intelligent transportation system. Although truck safety problems have received widespread attention from researchers around the world since the 1960s, the safety situation of trucks remains severe. In respect of the number of truck accidents, the latest available data indicate that there were 4119 people died in large truck crashes in 2019 ( 1 ). Another study also reported that trucks have the highest collision accident rate on continuous downhill sections of highways ( 2 ). In respect of the severity of truck accidents, a side impact of a truck is likely to cause serious injuries to passengers because the weight of a truck is usually 20 to 30 times the weight of an ordinary passenger car ( 3 ). In 2016, 4,317 deaths in the US were caused by truck accidents, the highest since 2007 ( 4 ). The latest data from the US Department of Transportation show that fatalities decreased from 2016 to 2017 in almost all segments of the population, except crashes involving large trucks (fatalities caused by collisions involving large trucks increased by 9% in 2017 compared with 2016). For the period between 2005 and 2009, one out of nine of all traffic fatalities in the US involved large trucks, which accounts for only 3% of registered vehicles and 7% of vehicle miles traveled ( 5 ). Similarly, trucks and buses were involved in 18% of fatal and severe injury crashes, although they only accounted for 3% of the total number of vehicles, and represent only 8% of the total vehicle kilometers traveled ( 6 ).
Relevant international researchers have paid significant attention to the mechanism and discipline of truck accidents on continuous downhill sections of highways, and have made some progress and achievements. A study by Michigan’s Fatal Accident Complaint Team (FACT) shows that brake failure caused by excessive brake drum temperature is the main cause of truck accidents, accounting for 32.7% of such accidents ( 7 ). Some researchers have examined the causes of truck collision accidents on continuous downhill sections. The causes are complex, but some of the major ones include brake failure resulting from high temperatures ( 8 , 9 ); lack of downhill driving experience, brake drum problems, and incomplete traffic signs ( 10 , 11 ); driving above the recommended speed limit ( 12 , 13 ); horizontal alignment ( 14 , 15 ); curve length, curve curvature, longitudinal gradient, and average daily traffic volume ( 16 ); length of the longitudinal slope, annual average daily traffic volume, gradient of the longitudinal slope, number of lanes, and width of the right shoulder ( 17 ); failing to downshift, improper gear or very high speed (82%), driver lacking driving experience or being unfamiliar with road conditions (43%), incomplete traffic signs (14%), poor braking or inappropriate braking operation (36%), and drunk driving or fatigue driving (21%) ( 18 ). These research findings provide a foundation to formulate and improve truck accident prevention strategies on continuous downhill sections of highways.
Based on the above research mechanism and discipline of truck accidents on continuous downhill sections of highways, scholars have also conducted research on the application of the truck safe speed and warning systems for continuous downhill sections of highways. One of the most representative results is the grade severity rating system (GSRS) in the United States. This system was established to reduce the truck accident rate or severity on continuous downhill sections of roads. The final result of the system is the placement of roadside traffic signs at the tops of continuous downhill sections to indicate the recommended maximum speed for trucks with different vehicle weight ranges. The maximum safe truck speed of each version of the GSRS is determined based on the brake drum temperature model, with the brake drum safety limit temperature as the critical condition; however, there are differences in the method for establishing the brake drum temperature model. The first GSRS was established based on the slope strategy of the Bureau of Public Roads (BPR). This system established a brake drum temperature model based on experimental data on brake drum temperatures, divided the grade severity into three grades according to the brake drum temperature, and forecasted the grade severity to road users so that they could determine the appropriate gear and speed based on experience and training ( 19 ). The second version of the GSRS was established by revising the Hykes brake drum failure model based on experimental data and kinetic energy relationships. This system determined the slope length based on the brake drum failure position, and determined the remaining braking capacity of the brake drum based on the braking distance ( 18 ). In 1989, the US Department of Transportation and the Federal Highway Administration issued a user manual for the GSRS that established a prediction model for brake drum temperature rise during the speed control phase and emergency braking at the bottom of a slope based on experimental data and the law of conservation of energy, respectively ( 20 ). The Federal Highway Administration (FHWA) used the Bowman’s model to develop a computer program to calculate the safe speed of trucks at different slopes, slope lengths, and vehicle weights to avoid brake failure. The weight-specific speed (WSS) was shown to a truck driver moving down a graded descent. Highway safety and operating guidelines indicate that the safe speed recommendation feature of the WSS can effectively reduce the downhill speed of trucks ( 21 ). At the same time, other studies were carried out to verify and improve the FHWA GSRS model through simulations, test data, and other methods ( 17 , 22 – 23 ). Another study was also carried out on an MS-DOS computer program that used the FHWA model to calculate the maximum safe vehicle speed on downhill sections. In a study on the safety condition of trucks on the Wyoming Mountain Road ( 24 ), the existing FHWA GSRS system model was updated based on changes in the truck design and braking system. Teoh et al. ( 25 ) investigated the factors affecting truck collision risk and found that safety technology has a positive effect on reducing collision risk. These studies and practical applications of the speed forecasting system have played a significant role in improving the operational safety of trucks on continuous downhill sections of highways. They also provide a reference for the present study; however, the safety problem during truck operation on continuous downhill sections of highways has not been thoroughly addressed owing to technical limitations. An important conclusion can also be drawn from the traffic accident data in recent years ( 1 , 4 ), and the above mentioned model, which is based on experimental data, which in turn limits the accuracy, the scientific nature of the model, and the scope of application of the results.
Existing studies considered that for continuous downhill sections of roads, frequent braking caused by unreasonable speed control is one of the main reasons for truck accidents during the downhill process. Most existing studies considered the most unfavorable conditions, believing that if the truck brake drum has the capability for emergency braking at the bottom of the slope, it can be applied at any point on the slope. Therefore, the operation process is divided into two phases: speed-controlled driving on the slope and emergency braking at the bottom of the slope. A prediction model for the brake drum temperature of large trucks on consecutive mountain downgrade routes was developed using field test data, and the maximum safe truck speed was calculated using the brake drum fade/failure temperature as a critical condition. However, the causes of brake failure are complex under actual conditions, including vehicle load, speed, ambient temperature, and driving behavior. Existing safe speed prediction models were not developed based on real-time traffic data such as vehicle speed, road geometry, vehicle characteristics (vehicle weight, brake type, etc.), and environmental conditions. Therefore, the predicted safe speed is a fixed value, and not advance or real time.
In previous research, a prediction model was developed for the brake drum temperature of large trucks on consecutive mountain downgrade routes based on the energy conservation law considering the main causes of truck accidents down a graded descent (brake fade/failure), real-time truck status, road, and environmental conditions. The prediction model for the brake drum temperature of large trucks on consecutive mountain downgrade routes proposed in our previous study ( 26 ) demonstrates that the brake drum temperature in the speed control phase is negatively correlated with the truck speed, whereas it is positively correlated in the emergency braking phase. Trucks on downhill roads may need to brake at any time owing to traffic restrictions. It is important to ensure that the truck can perform emergency braking at a suitable distance, which should be confirmed during operation. In addition, the use of modern technologies such as information technology, data communication transmission technology, electronic sensing technology, control technology, and computer technology in the construction of intelligent transport enables the proposed model to constantly refresh calculations according to real-time status obtained by intelligent connected vehicles. Therefore, a speed calculation model for autonomous truck driving or driving assistance for trucks running on a traditional downgrade route is proposed. The model compensates for the shortcomings of the existing speed forecasting system and effectively decreases the rate of traffic accidents caused by an unreasonable truck speed. Furthermore, it can significantly improve the safety and efficiency of road transportation.
Methods
The direct cause of a truck accident on the continuous downhill section of a highway is an unreasonable speed selection, whereas the root cause is brake fade and/or failure caused by excessive brake drum temperature. This study attempts to determine a safe truck speed from the braking system perspective. In theory, the drum brake should be able to provide sufficient braking force to slow down or stop a truck. However, in practical applications, damage or performance loss resulting from overheating or wear makes it impossible for the brake drum to guarantee continuous use on consecutive mountain downgrade routes of highways.
The basic working principle of the truck brake system is that the brake operation causes friction between the two main parts of the brake system, namely, the brake drum and the friction plate, as a result of relative motion. On the one hand, friction can prevent the tire from rolling, that is, slow down or stop the truck. On the other, the friction is converted into heat by rolling, and part of the heat is absorbed by the brake drum, causing the brake drum temperature to rise, which is the main reason for truck brake failure. Currently, the main brake system of a truck is the drum brake, that is, the service friction brake (brake disc on the wheel axle). Studies have shown that if the brake drum temperature continues to rise, the phenomena of decline and failure occur successively. The corresponding brake drum temperatures are the fade and failure temperatures, respectively. Therefore, the existing prediction model for the brake drum temperature combined with the critical condition (brake fade/failure temperature) can be used to predict the safe speed for heavy trucks on consecutive mountain downgrade routes.
To facilitate the analysis, the operational processes of the truck on the consecutive mountain downgrade routes of a highway is divided into three stages according to the operation status. During the driving operation of a truck down a graded descent, the truck speed will continue to increase even if the driver does not accelerate owing to gravity in the driving direction. When the vehicle speed exceeds the driver’s desired speed, the driver will continue to perform a braking operation to control the speed; this is known as the “speed control” phase. Meanwhile, the truck driver is affected by many factors such as the environment, road, vehicles, and traffic flow during the driving process. In case of an emergency, the driver needs to perform emergency braking to slow down or stop; this is known as the “emergency braking” phase. After the emergency has been dealt with, the truck needs to accelerate again; this is known as the “speed recovery” phase. In the above three phases, only the “speed control” phase is inevitable. In general, the “emergency braking” and “speed recovery” phases also exist. However, the side effect of the “speed control” and “emergency braking” phases is an increase in the brake drum temperature.
The following assumptions were made for the proposed safe speed prediction model:
The analyzed truck is equipped with an anti-lock braking system, but not a brake assistance system.
The effects of truck size and shape are considered during the process of force analysis.
The analyzed truck is regarded as a mass point during the process of speed analysis.
The truck tires are considered to be rigid bodies, ignoring the effect of hysteresis loss.
The brake drum assumes a uniform temperature distribution ( 27 ) and absorbs most of the heat ( 28 ).
Under the most unfavorable condition, the truck braking capacity would completely stop the truck in the “emergency braking” phase.
The brake drum temperature is considered the main factor that limits safe driving. The safe speed of the proposed model is established under the assumption that the horizontal alignment, lane width, and sight distance are in good condition without restricting safe driving. We are conducting a study on the safe speed of the road combined sections for road sections where both the horizontal and vertical alignments have safety restrictions. For special road sections where the safe speed is affected by sight distance, the “speed profile” can be used to compare multiple safe speeds and the minimum value selected.
The safe speed prediction model is established under the assumption of good weather conditions, without limiting tire–pavement friction. The safe speed prediction model under good weather conditions can provide a basis for safe speed correction on wet or icy roads (or other recommended improvements).
It seems that truck gear selection and braking method should affect the brake drum temperature, but not. The method of predicting the safe speed for heavy trucks on consecutive mountain downgrade routes used in this study is based on energy conservation law. The advantage of this method is that only the energy difference between the initial and final states is needed to determine the speed difference, without knowledge of the intermediate process. The energy involved in the gear selection indicated in the study question is the fuel consumption energy. Fuel consumption is mainly affected by throttle opening and engine speed. The engine speed was determined using the gear option. However, during the braking process, the accelerator pedal is completely released, the throttle is closed, and the vehicle engine is idle. At this time, only minimum fuel consumption for normal engine operation is provided, and there is almost no output energy. Therefore, different gearing options did not significantly affect the results. The energy involved in the braking method indicated in the study question is the brake drum thermal energy. The thermal energy of the brake drum is determined based on energy conservation law through the energy difference of gravitational potential energy, tire rolling resistance, and aerodynamic resistance, and knowledge of the specific braking method is not required.
Speed Control Stage
The interval between two emergency brakes is the speed control stage. According to previous research, the energy conversion process of trucks in the speed control phase down a graded descent is mainly the conversion of gravitational potential energy into the tire rolling resistance, aerodynamic resistance, and brake friction resistance. In addition, the brake friction resistance causes the brake drum temperature to rise so that heat exchange occurs between the brake drum and the surrounding environment. Because this heat exchange is in turn related to the changing brake drum temperature, the Riemann integral is used to approximate the heat dissipation of the brake drum. Therefore, the prediction model of the temperature rise of the brake drum during the j th speed control stage is as follows ( 26 ):
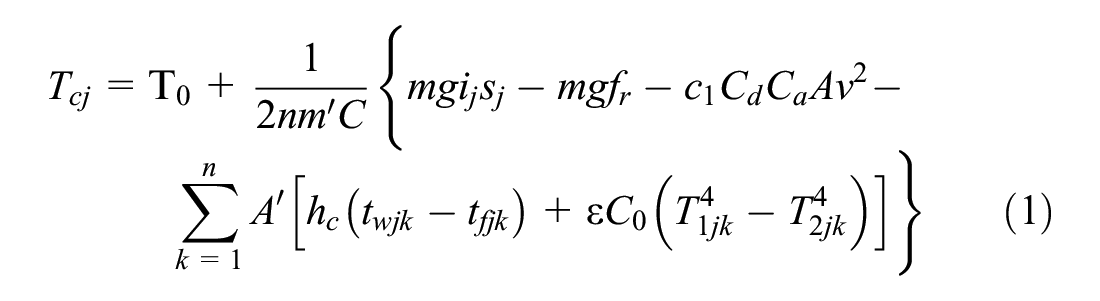
where:
j = sequence of the speed control stage
n = number of truck axles;
C = heat capacity of the brakes (J/[kg·°C]);
m = gross truck weight (kg);
g = gravitational acceleration (m/s2);
v = real-time truck speed (km/h);
A = windward area (m2);
k = calculation interval for the Riemann integral
Equation 1 indicates that the brake drum temperature in the speed control stage
Emergency Braking Stage
According to previous research, the travel time and distance of the truck emergency braking phase on continuous downhill sections of a road are very short. Consider the following example: the time and distance required to reduce the truck speed from 60 km/h to 0 km/h with a deceleration of 5 m/s2 are approximately 3.3 s and 82.2 m, respectively. Thus, the rolling resistance, air resistance work, and brake drum heat dissipation can be ignored assuming that all the kinetic energy is converted into brake drum thermal energy such that:

where
Equation 2 shows that the brake drum temperature rise in an emergency stage

The truck operation on the continuous downhill section of a highway is divided into several “processes” based on the emergency braking interval, and the safe speed calculation is performed successively. However, in actual engineering applications, it is not necessary to perform calculation based on a fixed emergency braking interval. The infrastructure for intelligent transport, such as electronic sensing technology, can be used to sense emergency braking. After each emergency braking, the safe truck speed of the remaining slope can be modified to make it closer to the actual operating conditions, thereby improving traffic safety or efficiency.
Speed Recovery Stage
After the aforementioned speed control and emergency braking phases, the brake drum temperature will have increased to a certain extent. The actual brake drum temperature at this time is compared with the brake drum fade and failure temperature to determine the available temperature capability surplus. Then, the temperature capability surplus is used as a critical condition to determine the maximum safe recovery speed in the speed recovery phase corresponding to the recommended speed and warning speed, respectively. That is, the truck safe speed on a downgraded route can be calculated as follows by making the predicted temperature less than or equal to the brake fade/failure temperature:


where:
The recommended speed and warning speed are defined as given below. The recommended speed is the speed to avoid thermal decay of the vehicle brake drum. In practical applications, it is recommended that drivers or autonomous vehicles drive at this speed to ensure safety. The warning speed is the speed to avoid brake failure. In practical applications, when the vehicle continues to drive at or above this speed, the driver or autonomous vehicle will be warned to slow down to avoid brake failure.
Equation 6 shows that the brake drum temperature after each emergency braking is equal to the accumulated temperature during the speed control and emergency braking phases. The existing brake drum temperature prediction model assumed that there is no temperature gradient inside the brake drum; therefore, in each Riemann integral approximation interval, the outer surface temperature of the brake drum,
Validation of the Prediction Model
Comparison of Predicted and Experimental Values
The main factor hindering safe driving on continuous downhill roads is the brake drum temperature (brake drum degradation/failure), considering other factors to be in good condition. Therefore, the approach of deriving the safe speed from the brake drum temperature is reasonable. Representative results such as GSRS have validated this in practice. Consequently, to ensure the effectiveness of the safe speed, it is only necessary to ensure the effectiveness of the brake drum temperature prediction model.
The new theoretical model was validated against the measured brake drum temperature values to verify that it can correctly estimate the brake drum temperature of a truck moving on a downhill grade.
The test measurements reported by Gu ( 33 ) provide suitable data for this purpose. The experimental data T in Figure 1 were obtained from a downhill brake experiment using a 20 t DFAC EQ5208 truck covering a 3.2 km downgrade section of the Jincheng-Jiaozuo Highway (downgrade is between 3% and 6%). The test measurements were conducted on a dry road surface at a speed of 60 km/h.

Comparison of experimental data ( 32 ) and model-predicted values of the brake drum temperature.
The calculated values of T at a driving speed of 60 km/h were plotted against the experimental values as shown in Figure 1. It can be observed that the calculated results correctly matched the experimental data in the values of T. For this case, the relative error of the predicted and actual results is in the range of 0.3% to 10.4%. This error value is within the acceptable limits. Therefore, the validation confirms that the proposed model can provide a sufficiently accurate prediction of the safe speed of heavy trucks on consecutive mountain downgrade routes.
The difference between the existing guidelines and the proposed energy method is that the maximum safe truck speed for each version of the GSRS is determined based on the brake drum temperature model, with the brake drum safety limit temperature as the critical condition. However, there are significant differences between the GSRS guideline and the proposed model in the method for establishing the brake drum temperature model. The model in this study is based on the law of energy conservation; the GSRS guideline is different. At the bottom of the slope, the GSRS establishes a brake drum temperature prediction model for emergency braking based on the energy law; however, on the slope section, it is established based on experimental data. Therefore, the proposed model clearly reflects the effects of the main variables compared with the existing empirical fitting model based on specific test data, and it does not need to be tested in individual places.
Comparison of Predicted and GSRS-Based Safe Speed Values
To further verify the model, we compared the recommended speeds generated using the proposed method with those generated from the GSRS, which are already in use as equivalent grades, grade lengths, and truck weights. This section presents an analysis of the GSRS-based WSS sign for the northbound Buzzard Beak decline, which has experienced a relatively high number of downgrade truck accidents; however, it has not been cost-effective to install a truck escape ramp. This decline is a relatively consistent downgrade of approximately 11 km, with an average grade of 5.3%. The output of the GSRS computer program indicates that there are four categories of weight with safe speeds equal to or less than 104 km/h.
Table 1 presents the percentage differences between the GSRS-based and model-predicted values of the safe speeds. All the errors for the safe speed values are less than 9.7%, and the corresponding magnitude of the error is 7 km/h. In addition, it can be observed that the model prediction values are slightly larger than the GSRS-based values, which may be as a result of improvements in automobile technology or the absence of different values of some parameters using GSRS.
Comparison of GSRS-Based and Model-Predicted Values of Safe Speed

Note: GSRS = grade severity rating system.
Conservative Analysis
This section considers the downgrade design speeds recommended by AASHTO ( 33 ) to demonstrate the application of the brake drum temperature prediction model for calculating the maximum safe truck speed on consecutive mountain downgrade routes. The AASHTO design speeds are conservative in most cases, but can be inadequate for some specific cases, such as where the downgrades are steep and long, or if trucks are heavy or old. In this study, we found that the calculated safe speed is conservative for steep, long grades and heavy trucks by calculating the safe speed for heavy trucks on consecutive mountain downgrade routes.
Table 2 presents the computed maximum safe vehicle speeds for different rates and lengths of downgrades and truck weights. The computed maximum safe vehicle speeds and the corresponding AASHTO design speeds for each grade are listed. The shaded cells in the table identify the sections where the AASHTO design speed exceeds the maximum safe vehicle speed. They represent the truck operating conditions at which brake failure occurs when a truck travels at the indicated design speed. This example shows that the maximum safe truck speed determination procedure presented in this study can be applied to identify the high-brake-failure risk operating conditions for road sections with steep and long downgrades.
Comparison of AASHTO Design Speeds and Calculated Maximum Safe Vehicle Speeds for the Study Example

Note: Shaded cells indicate sections where the AASHTO design speed exceeds the maximum safe vehicle speed.
Potential Application of the Proposed Procedure
This section describes a case study to demonstrate how the proposed program can be employed to select the appropriate maximum safe speeds for a single-grade site based on intelligent road infrastructure systems. The following procedure can be adopted for the application:
Step 1: Identify sites that are prone to brake failure accidents; determine the site location using the GPS; extract the rate and length of the grade and the altitude of the site from the road’s geometric parameter database; obtain environmental conditions (such as temperature and wind speed) from the roadside unit (RSU).
Step 2: Collect vehicle-related parameters such as gross truck weight, vehicle speed, initial brake drum temperature, brake drum type, vehicle type, and tire type using the vehicle onboard unit (OBU).
Step 3: Calculate the recommended speed and warning speed based on the proposed model. At the top of the downgrade, the safe speed is predicted based on the assumption that the entire downgrade section does not require emergency braking. Subsequently, a safe speed correction is made based on the actual measurement after each emergency braking, assuming that the entire slope section does not require emergency braking for safe speed prediction. Finally, the safe speed of the remaining distance is corrected after each emergency braking based on the braking and actual measured vehicle speed in the previous section.
Step 4: Forecast the safe speed of drivers or autonomous vehicles through information release systems.
Analysis of the Main Parameters
To analyze the effect of the main characteristics of the proposed model according to the actual working conditions, the following parameter values combined with a PC-based Visual Basic computer program were used to separately predict the recommended and warning speed. The truck weight, length, and percentage of the slope, which proved to have a significant effect on the brake drum temperature in the previous study, and the emergency braking interval/times were selected as independent variables. The recommended speed and warning speed were selected as dependent variables for the calculation examples. For the values of the length and percentage of the slope, refer to the regulations of the China Geometric Design of Highways and Streets (34) on the average slope and continuous slope length of the continuous and steep downgrade. The values of other environment, road, and vehicle parameters that are constant or have less significant effects on the brake drum temperature are listed in Table 3.
Parameter Values

Note: The symbol “\” means that the parameter has no unit.
It should be noted that in practical applications, the recommended speed should be equal to the speed limit if the theoretical recommended speed exceeds the speed limit, which was set to 120 km/h by referring to the Chinese traffic regulations. Besides, the safe speed is not constant along with the downgrade in the environment of intelligent connected vehicles, but is corrected in real time according to the actual truck speed.
The amount of emergency braking on downhill sections varies according to factors such as vehicles, roads, drivers, and traffic conditions, and these factors cannot be generalized. Fortunately, advancement in intelligent traffic systems has made it possible to solve this problem. In practical applications, the model or system can use sensors to automatically recognize the completed emergency braking operation and calculate the remaining braking capacity of the brake drum based on intelligent traffic systems, thereby determining the safe speed of the remaining road sections.
In this study, gear selection hardly affects the energy balance. Fuel consumption is mainly affected by the throttle opening and engine speed. The engine speed is determined using the gear option. However, during the braking process, the accelerator pedal is completely released, the throttle is closed, and the vehicle engine is idle. At this time, only minimum fuel consumption for normal engine operation is provided, and there is minimal output energy. Therefore, different gearing options hardly affect the results. When the accelerator pedal is fully released, gear selection hardly affects the energy balance. In this study, we assumed that the driver has significant professional driving experience and the vehicle is in a low gear, that is, the first or second gear.
Figure 2a shows that the recommended speed and warning speed decrease steadily with the increase in the gross truck weight in the combination of 6% slope and 3.3 km slope length; in contrast, both increase steadily with the increase in the emergency braking interval. Further, the recommended speed increases or decreases slightly faster than the warning speed with the increase in the emergency braking interval and gross truck weight, which also gradually increases the difference between the recommended speed and warning speed as the emergency braking interval and gross truck weight increase. For instance, for the combination of 6% downgrade percentage, 3.3 km slope length, and 500 m emergency braking interval, the recommended speed and warning speed decrease from 76 km/h to 34 km/h and 110 km/h to 73 km/h, respectively, as the gross truck weight increases from 30 t to 45 t. At the same time, the difference between the recommended speed and warning speed increases from 34 km/h to 39 km/h. For the combination of 6% downgrade percentage, 3.3 km slope length, and 35 t gross truck weight, the recommended speed and warning speed increase from 61 km/h to 152 km/h and 96 km/h to 236 km/h, respectively, as the emergency braking interval increases from 500 m to 2,000 m. Meanwhile, the difference between the recommended speed and warning speed increases from 35 km/h to 84 km/h. The results indicate that for the limit combination of 6% average downgrade percentage and 3.3 km slope length specified by the China Geometric Design of Highways and Streets, most normal heavy trucks weighing less than 45 t emergency braking fewer than six times can travel safely, even if the safe speed is slightly low.

Recommended and warning speed of trucks with different weights and emergency braking interval under the combination of certain percentage and length of slope.
Figure 2b shows that the recommended speed and warning speed decrease steadily with the increase in the gross truck weight for the combination of 5.5% slope and 3.8 km slope length; in contrast, both increase with the increase in emergency braking interval. In addition, the recommended speed increases or decreases slightly faster than the warning speed with the increase in the emergency braking interval and gross truck weight, which also gradually increases the difference between the recommended speed and warning speed as the emergency braking interval and gross truck weight increase. For instance, the recommended speed and warning speed decrease from 104 km/h to 38 km/h and 153 km/h to 98 km/h, respectively, as the gross truck weight increases from 30 t to 45 t for the combination of 5.5% downgrade percentage, 3.8 km slope length, and 1 km emergency braking interval. The difference between the recommended speed and warning speed also increases from 49 km/h to 60 km/h. For the combination of 5.5% downgrade percentage, 3.8 km slope length, and 35 t gross truck weight, the recommended speed and warning speed increase from 55 km/h to 142 km/h and 87 km/h to 229 km/h, respectively, as the emergency braking interval increases from 500 m to 2,000 m. Meanwhile, the difference between the recommended and warning speed increases from 32 km/h to 87 km/h. The results indicate that for the limit combination of 5.5% average downgrade percentage and 3.8 km slope length specified by the China Geometric Design of Highways and Streets, most normal heavy trucks weighing less than 45 t emergency braking fewer than seven times can travel safely, even when the safe speed is slightly low.
Figure 2c shows that the recommended speed and warning speed decrease steadily with the increase in the gross truck weight for the combination of 5% slope and 4.4 km slope length; in contrast, both increase with an increase in the emergency braking interval. Furthermore, the recommended speed increases or decreases slightly faster than the warning speed with the increase in the emergency braking interval and gross truck weight, which also gradually increases the difference between the recommended speed and warning speed as the emergency braking interval and gross truck weight increase. For instance, the recommended speed and warning speed decrease from 121 km/h to 28 km/h and 185 km/h to 115 km/h, respectively, as the gross truck weight increases from 30 t to 45 t for the combination of 5% downgrade percentage, 4.4 km slope length, and 2 km emergency braking interval. The difference between the recommended speed and warning speed also increases from 64 km/h to 87 km/h. For the combination of 5% downgrade percentage, 4.4 km slope length, and 35 t gross truck weight, the recommended speed and warning speed increase from 47 km/h to 132 km/h and 79 km/h to 223 km/h, respectively, as the emergency braking interval increases from 500 m to 3,000 m. Meanwhile, the gap between the recommended speed and warning speed increases from 32 km/h to 97 km/h. The results also show that for the limit combination of 5% average downgrade percentage and 4.4 km slope length specified by the China Geometric Design of Highways and Streets, most normal heavy trucks weighing less than 45 t emergency braking fewer than eight times can travel safely even when the safe speed is slightly low.
Figure 2d shows that the recommended speed and warning speed decrease sharply and steadily, respectively, with the increase in the gross truck weight for the combination of 4.5% slope and 5.4 km slope length; in contrast, both increase steadily with the increase in the emergency braking interval. In addition, the recommended speed increases or decreases slightly faster than the warning speed with the increase in the emergency braking interval and gross truck weight, which gradually increases the difference between the recommended speed and warning speed as the emergency braking interval and gross truck weight increase. For instance, the recommended speed and warning speed decrease from 108 km/h to 38 km/h and 176 km/h to 124 km/h, respectively, as the gross truck weight increases from 30 t to 40 t for the combination of 4.5% downgrade percentage, 5.4 km slope length, and 2 km emergency braking interval. The difference between the recommended speed and warning speed increases from 68 km/h to 86 km/h. The recommended speed and warning speed increase from 49 km/h to 155 km/h and 79 km/h to 248 km/h, respectively, as the emergency braking interval increases from 500 m to 3,000 m for the combination of 4.5% downgrade percentage, 5.4 km slope length, and 30 t gross truck weight. Meanwhile, the difference between the recommended speed and warning speed increases from 30 km/h to 93 km/h. The results indicate that for the limit combination of 4.5% average downgrade percentage and 5.4 km slope length specified by the China Geometric Design of Highways and Streets, most normal heavy trucks weighing less than 40 t an emergency braking fewer than 10 times can travel safely, even when the safe speed is slightly low.
Figure 2e shows that the recommended speed and warning speed decrease sharply and steadily, respectively, with the increase in the gross truck weight for the combination of 4% slope and 6.8 km slope length; in contrast, both increase steadily with the increase in the emergency braking interval. Moreover, the recommended speed increases or decreases slightly faster than the warning speed with the increase in the emergency braking interval and gross truck weight, which also gradually increases the difference between the recommended speed and warning speed as the emergency braking interval and gross truck weight increase. For instance, the recommended speed and warning speed decrease from 91 km/h to 47 km/h and 165 km/h to 135 km/h, respectively as the gross truck weight increases from 30 t to 35 t for the combination of 4% downgrade percentage, 6.8 km slope length, and 3 km emergency braking interval. The difference between the recommended speed and warning speed also increases from 74 km/h to 88 km/h. The recommended speed and warning speed increase from 37 km/h to 128 km/h and 65 km/h to 233 km/h, respectively, as the emergency braking interval increases from 500 m to 4,000 m for the combination of 4% downgrade percentage, 6.8 km slope length, and 30 t gross truck weight. Meanwhile, the gap between the recommended speed and warning speed increases from 28 km/h to 105 km/h. The results also indicate that for the limit combination of 4% average downgrade percentage and 6.8 km slope length specified by the China Geometric Design of Highways and Streets, most normal heavy trucks weighing less than 35 t emergency braking fewer than 13 times can travel safely, even when the safe speed is slightly low.
Figure 2f shows that the recommended speed and warning speed decrease significantly with the increase in the gross truck weight for the combination of 3.5% slope and 9.3 km slope length; in contrast, both increase steadily with the increase in the emergency braking interval. Furthermore, the recommended speed increases or decreases slightly faster than the warning speed with the increase in the emergency braking interval and gross truck weight, which also gradually increases the difference between the recommended speed and warning speed as the emergency braking interval and gross truck weight increase. For instance, the recommended speed and warning speed decrease from 58 km/h to 5 km/h and 202 km/h to 153 km/h, respectively, as the gross truck weight increases from 30 t to 35 t for the combination of 3.5% downgrade percentage, 9.3 km slope length, and 5 km emergency braking interval. The difference between the recommended speed and warning speed also increases from 144 km/h to 148 km/h. The recommended and warning speed increase from 32 km/h to 58 km/h and 102 km/h to 202 km/h, respectively, as the emergency braking interval increases from 2,000 m to 5,000 m for the combination of 3.5% downgrade percentage, 9.3 km slope length, and 30 t gross truck weight. Meanwhile, the gap between the recommended speed and warning speed increases from 70 km/h to 144 km/h. The results indicate that for the limit combination of 3.5% average downgrade percentage and 9.3 km slope length specified by the China Geometric Design of Highways and Streets, most normal heavy trucks weighing less than 30 t emergency braking fewer than four times can travel safely, even when the safe speed is slightly low. In addition, the theoretical recommended speed values for 40 t and 45 t vehicles are zero, which coincide with the abscissa axis. In other words, for these special road conditions in Figure 2f, the risk of brake drum decay for heavy vehicles, which cannot be completely avoided through speed control, is very high. Other measures such as truck escape ramps and cooling tanks should be adopted.
For the limit combination of 3% average downgrade percentage and 14.8 km slope length, and 2.5% average downgrade percentage and 20 km slope length specified by the China Geometric Design of Highways and Streets, the brake still has a risk of failure, even if the truck is light and does not perform emergency braking, owing to the cumulative effect of the slope length. A recent study ( 26 ) reported that the brake drum temperature model can be used to predict the brake drum failure position and issue a parking restriction to a driver or a truck based on the truck’s characteristics and speed parameters obtained using intelligent connected vehicles. Alternatively, the proposed model can be used to directly improve route design standards.
Discussion and Conclusions
In this paper, a prediction model was proposed for the safe speed of large trucks along downgrade highway sections to further improve the safety of conventional or autonomous trucks on continuous downhill sections of highways. The truck operating status was divided into three types considering the actual operation process of trucks on continuous downhill sections of a highway, namely, speed control, emergency braking, and speed recovery. The force and energy conversion in each operating status were analyzed separately based on energy conservation law, and a prediction model for the brake drum temperature was established, which is different from conventional methods that are based on test data. Subsequently, the brake fade and failure temperatures were introduced as the critical condition to determine the status of the brake drum (normal, fade, or failure). Finally, the brake drum temperature prediction model combined with the critical condition were used to predict the safe truck speed. An approximate calculation of the proposed model was performed using a PC-based Visual Basic computer program based on the Riemann integral. The effect of the main road, vehicle, and driving parameters was evaluated through an analysis.
This paper proposed a procedure to determine the maximum safe truck speed on consecutive mountain downgrade routes based on energy law. A theoretical model was developed to predict the available brake capacity of the truck while driving on steep downgrades in good weather. The proposed model provides speed guidance for trucks on downgrades to reduce the risk of runaway or out-of-control events. It offers a potentially useful tool for road designers to determine the rate and length of the designed downgrade or for policy makers to revise the regulations on the maximum rate and length of grades in the highway geometric design standard. In addition, it can be used as an accident analysis tool to determine the optimal escape ramp placement.
It can be inferred from the results that the truck safe speed is closely related to the gross truck weight, emergency braking interval, percentage, and length of the downgrade. The proposed model is highly useful for determining the maximum safe truck speed based on real-time traffic data obtained from connected and autonomous vehicles.
The limitations of the study are identified as follows:
The division of the driving state is ideal; there may be slight fluctuations in the speed during the speed control stage. These fluctuations may slightly influence the result, but the study did not consider how this difference affects the truck permitted speed.
Improvements can be made in future studies using traffic data from connected and autonomous vehicles to include real-time data to the model or by adding other features such as context information (brake operation, traffic, weather, etc.).
Finally, a larger and more realistic dataset (for more subjects, such as a wider range of truck weight) recorded in real on-road conditions (e.g., different grades and grade lengths) would be required to validate the proposed model.
Footnotes
Author Contributions
The authors confirm contribution to the paper as follows: study conception and design: M. Yan, J. Xu; data collection: S. Han; analysis and interpretation of results: F. Ma; draft manuscript preparation: M. Yan. All authors reviewed the results and approved the final version of the manuscript.
Declaration of Conflicting Interests
The author(s) declared no potential conflicts of interest with respect to the research, authorship, and/or publication of this article.
Funding
The author(s) disclosed receipt of the following financial support for the research, authorship, and/or publication of this article: This research was partly supported by the Scientific Research Project of Zhejiang Department of Transportation (No. 2020025).
