



Abstract
Conducting hazardous materials (HAZMAT) commodity flow studies (CFS) is crucial for emergency management agencies. Identifying the types and amounts of hazardous materials being transported through a specified geographic area will ensure timely response if a HAZMAT incident takes place. CFS are usually conducted using manual data collection methods, which may expose the personnel to some risks by them being subjected to road traffic and different weather conditions for several hours. On other hand, the quality and accuracy of the collected HAZMAT data are affected by the skill and alertness of the data collectors. This study introduces a framework to collect HAZMAT transportation data exploiting advanced image processing and machine learning techniques on video feed. A promising convolutional neural network (CNN), named AlexNet was used to develop and test the automatic HAZMAT placard recognition framework. A solar-powered mobile video recording system was developed using high-resolution infra-red (IR) cameras, connected to a network video recorder (NVR) mounted on a mobile trailer. The developed system was used as the continuous data collection system. Manual data collection was also conducted at the same locations to calibrate and validate the newly developed system. The results showed that the proposed framework could achieve an accuracy of 95% in identifying HAZMAT placard information. The developed system showed significant benefits in reducing the cost of conducting HAZMAT CFS, as well as eliminating the associated risks that data collection personnel could face.
A yearly average of 15,000 hazardous materials (HAZMAT) incidents take place on the US highways, of which nearly 2% are traffic crashes ( 1 ). HAZMAT incidents and crashes could give rise to catastrophic effects on human health, public safety, the environment, and property, according to the type of HAZMAT shipment. In Wyoming, was the total cost of the associated damage resulting from in-transit HAZMAT incidents between 2015 and 2018 was $3.1 million ( 2 ). Almost 71% of the total cost was apportioned to incidents occurring on the three Interstate rural roads of Wyoming. A tragic pileup crash occurred on Interstate 80 (I-80) in Wyoming in winter 2015, which was a result of a jackknifed HAZMAT large truck ( 3 ). This incident involved more than 60 vehicles causing two fatalities and multiple injuries. The two fatalities and the multiple injuries were a result of the multiple secondary crashes occurring at the crash scene. It is worth mentioning that the shipment of the HAZMAT truck included 20,000 gallons of hydrochloric acid, hydrofluoric acid, and other flammable materials that set off a massive fire. The emergency responders were hampered in performing investigations and highway clean up by the fire that broke out and by billowing smoke, cold, fog, and debris at the crash location. This specific crash resulted in a 100-mi road closure for more than 32 h.
Several studies have focused on quantifying the risk associated with HAZMAT transportation by conducting a transportation risk assessment (4– 11 ). Other studies focused on factors causing crashes that could increase the crash severity and/or frequency for HAZMAT trucks (12– 15 ). These studies would provide potential support for decisions on countermeasures to reduce crash severity and help in allocating resources for emergency management.
Responding to the HAZMAT incidents should be timely and appropriate to contain the dangerous effect of such events, as well as reducing the resulting risk. Every HAZMAT type requires different equipment and safety precautions for it to be contained if an incident takes place. Prior knowledge of the nature of the HAZMAT being transported, on each route within the jurisdiction, is crucial for emergency management. To identify the transportation patterns of HAZMAT using road networks, sound commodity flow studies (CFS) should be frequently conducted. According to the Pipeline and Hazardous Materials Safety Administration (PHMSA), a HAZMAT CFS is a transportation analysis study identifying the types and amounts of hazardous materials being transported through a specified geographic area ( 16 , 17 ). Manual surveys utilizing personnel to collect HAZMAT data formed the main procedure introduced in CFS manuals. Gaweesh and Ahmed ( 18 ) conducted a comparative study to investigate alternative methods to collect field data for HAZMAT CFS. Manual data collection sheets, still images, and video recordings were the three methods compared in the study. The results showed that video recordings could be a potential method to collect HAZMAT data. However, this method included only camcorders to collect video data, and camcorders suffer from limited storage capacity and short battery life, visibility issues at night-time, and increased data processing time.
Conducting several HAZMAT CFS in Wyoming throughout the past 5 years raised the need for a cost-effective data collection method. The main goals were to reduce the risks to personnel associated with the data collection collect reliable data, to increase the data collection period, to continuously identify HAZMAT traffic, and to reduce data processing and analysis time. Development of an automatic system could be a potential solution to overcome these limitations. This research introduces a novel mobile system that automatically recognizes HAZMAT placards by leveraging a promising machine learning technique, named convolutional neural network (CNN). This system could be used continuously to identify HAZMAT shipments passing through any given route. Given the multiple benefits of the developed system, it could considered as a step forward toward conducting a cost-effective and a safer HAZMAT CFS.
Literature Review
Transportation researchers had extensively used machine learning and computer vision techniques in recent years, especially with the presence of new emerging technologies such as connected and automated vehicles. The main use of these techniques is to enable vehicles to identify the surrounding features to safely and efficiently operate with the support of advanced driver assistance systems (ADAS).
The rapid advancement in machine vision technologies, computer processing power, and high-speed connectivity has opened new vistas of opportunities in the field of transportation engineering to improve traffic safety and operation. The potential of machine learning techniques in identifying unexpected events on the roadways as well as real-time weather and surface conditions has been thoroughly explored in the literature. A recent study developed an affordable fog detection system capable of providing trajectory-level weather information in real-time using the video data from the SHRP2 Naturalistic Driving Study (NDS). This study applied several deep learning approaches, including recurrent neural network (RNN), long short-term memory (LSTM), and CNN, and it achieved unprecedented overall weather detection accuracy of more than 97% ( 19 ). A study by Khan et. al. developed a novel CNN-based algorithm, named “RoadweatherNet,” capable of detecting seven levels of trajectory-level adverse weather conditions in real-time ( 20 ). Another study also used SHRP2 NDS video data to develop a real-time snow detection system by utilizing texture-based image features combined with several machine learning algorithms, such as support vector machine (SVM), k-nearest neighbor (K-NN), and random forest (RF); this achieved an overall snow detection accuracy of 96% ( 21 ). The study by Ali et al. ( 22 ) linked NDS video data with external sensors and CAN-bus data to develop a robust and easily implementable moving weather detection system by applying various non-parametric machine learning algorithms. Several studies focused on identifying surrounding road signs, which would help vehicles to take appropriate actions that correspond to the road control devices. Recognizing small elements located within a complex background is considered the main challenge for detection of traffic signs. This limitation mainly affects the speed and precision of traffic sign detection. Multiple detection algorithms have been tested to detect traffic signs. A study applied integral channel features (ICF) and aggregate channel features (ACF) detection methods to identify US traffic signs ( 23 ). The study showed that color normalization was the main factor for good detection performance. Capturing, pre-processing, feature extraction, and detection were the main steps followed in the image processing algorithms. The study grouped traffic signs by shape type, in which “diamond-shaped signs” was one of the categories. The results showed that diamond signs had a high detection accuracy. Another study proposed a new method of traffic sign detection using adaptive color threshold segmentation and shape symmetry testing ( 24 ). Color segmentation process was utilized to isolate the image’s invalid background from the foreground blocks, which include traffic signs. Approximate maximum–minimum normalization with an adaptive threshold was applied to enhance the traffic sign locations within the processed image. Afterward, real-time symmetry detection algorithms were applied to detect signs. The developed algorithm succeeded in detecting 94% of traffic signs. Several object detection systems—faster region-based CNN (R-CNN), region-based fully convolutional network (R-FCN), single shot detector (SSD), and You Only Look Once (YOLO) V2—have been compared using the mean average precision (mAP) measure to determine traffic signs ( 25 ). Several feature extractors were used with the investigated object detection systems. The study found that faster R-CNN with Inception ResNet V2 feature extraction obtained the best mAP of 95.77%, while R-FCN with ResNet 101 feature extraction had the best balance between accuracy and execution time with a precision of 95.15%. The dataset used in the study was obtained from publicly available traffic sign datasets in Germany. The dataset was composed of 900 full images that were split by 67% for training and 33% for testing. The images contained 1,206 traffic signs. Yang et al. ( 26 ) proposed a two-stage deep network to identify traffic signs. The first stage applied attention network (AN) to faster R-CNN to determine regions of interest (RoIs). The second stage adopted the fine region proposal network (FRPN) to produce the final regions. A performance comparison was conducted for faster R-CNN with and without the AN. Detection speed showed an enhancement of two frames per second for the proposed modification with an increased mAP range of 7.88% to 9.69%.
Pattern recognition algorithms were also applied to read license plates of vehicles for the purposes of traffic surveillance ( 27 , 28 ), trip routing estimation ( 29 , 30 ), and parking management systems ( 31 ). Any license plate recognition system deals with three main subtasks: license plate detection (LPD), license plate segmentation (LPS), and character recognition (CR) (32–34). The three subtasks could be conducted using sophisticated artificial intelligence (AI) techniques. Several studies focused on only one or two of these subtasks as the main objective of their study (35–38). Several studies utilized the darknet-YOLO deep learning framework to recognize license plates (39–43). A study applied the YOLO approach to recognize license plates in Taiwan ( 44 ). The YOLO architecture consists of 27 CNNs. The dataset used in the study consisted of 2,049 images, of which 681 were collected from access control (AC), 757 were collected from traffic law enforcement stationary cameras, and 611 from road patrol cameras. The results showed an accuracy of 98.22% for LPD and 78% for license plate recognition.
Although machine learning has been extensively used in many fields of transportation engineering for pattern recognition and objection detection, studies exploring the potential of machine learning in detecting HAZMAT placards are relatively limited. Moreover, previous studies have not considered the inconsistent location of the object, adverse weather, and its impact on the clearness of the placard, and the data collection challenges on high-speed facilities. To fill these research gaps, this study developed a robust HAZMAT placards detection framework utilizing a cutting-edge machine learning algorithm, called CNN, which is a variation of deep learning developed specifically for image classification ( 19 ). Previous studies have revealed that CNN can provide groundbreaking performance in detection accuracy, especially for complex image classification problems with numerous output categories (45–47). Therefore, CNN is emerging as a state-of-the-art solution for image classification and pattern recognition in various fields of engineering. The CNN-based framework proposed in this study can detect HAZMAT placards as well as being able to provide vehicle counts and classes with an impressive accuracy using only a single video camera; therefore, it is readily implementable.
Data Collection and Description
Because of the lack of recent HAZMAT studies in Wyoming, the Wyoming Office of Homeland Security (WOHS) in collaboration with the University of Wyoming (UW) initiated several HAZMAT CFS to identify transportation patterns on Interstate roads and highways within the state of Wyoming. Starting from 2015, nine CFS have been conducted in multiple counties. It is worth mentioning that before the recent wave of HAZMAT CFS, there was only one study conducted back in 1986 in Albany County ( 48 ). The results of the recently conducted CFS showed that the dominant HAZMAT class being transported in Wyoming using its road network is class 3 HAZMAT (flammable liquids), followed by class 2 HAZMAT (gases). These results are in line with the oil and gas activities within Wyoming as it is considered one of the top states in energy production. Figure 1 shows the proportions of classes transported in each county as well as the percentage of HAZMAT trucks from the annual average daily truck traffic (AADTT) and the annual average daily traffic.

Percentages of HAZMAT trucks and HAZMAT classes transported in Wyoming counties.
Manual data collection is the approach introduced in the Guidebook for Conducting Local Hazardous Materials Commodity Flow Studies ( 16 ). Three days (one weekend and two weekdays) of continuous 12 h (7 am–7 pm) HAZMAT data collection was carried out for each location in Wyoming. For each county, data was collected from at least four locations on Interstate roads or highways. Students from the UW volunteered to undertake the manual data collection of HAZMAT. A minimum of eight students were required to conduct the data collection for a complete week, in which appropriate accommodation was provided. Several rented vehicles were utilized for transportation purposes. An average cost to collect data per location was $3,000. This makes the total cost of data collection per county $12,000. It should be mentioned that data collection could only last for short periods of time, as it was based on manual data collection procedures. Additionally, there were other factors that could affect the data collection plans, such as adverse weather and personal safety concerns. Several HAZMAT data collection studies were delayed or cancelled because of the COVID-19 pandemic. Still cameras and video recording were used to collect synchronous data from each location to develop a more cost-effective and safer automated data collection system to perform HAZMAT CFS.
Data collection sheets including information about placard number, placard class, type of cargo, type of container, travel direction, and timestamps were used. Data collection surveyors received training to collect data at so many locations within the short time in which a HAZMAT truck passes by the surveyors at speeds ranging between 65 mph (miles per hour) and 85 mph. The collected data was digitized into spreadsheets for further analyses.
Because of the several highlighted limitations associated with manual data collection, an alternative automated approach was examined to conduct HAZMAT CFS. A total of 2,490 min of video data from the manually collected HAZMAT information would serve as a ground truth to validate the developed automatic placard recognition system. The system required only two persons to transport, install, and operate it. Additionally, it could collect data for extended periods of time compared with the manual approach. Although there was an initial cost to develop the automatic monitoring system, it would reduce the total cost of data collection per county by more than half compared with the manual data collection approach. The developed system would not only reduce the data collection cost, but it would be a much safer system and more useful during a pandemic such as COVID-19 with multiple travel restrictions. A benefit–cost (B/C) analysis can show a B/C ratio of 10 if 1 serious injury is prevented ( 49 ).
Methodology
The methodology included three phases: (1) development of a continuous recording system to conduct the HAZMAT CFS, (2) determining the position of the system and the most appropriate camera direction to collect clear video footage, and (3) developing and applying the machine vision algorithm to classify the transported HAZMAT.
Development of the Data Collection Mobile System
A standalone solar-powered mobile system, equipped with IR cameras, was used in the HAZMAT data collection. The developed system was hosted on a mobile trailer. Two monochrome IR cameras were connected to an NVR passing through a data switch. The system was powered using two power banks comprising six deep cycle batteries in each bank. To ensure continuous running power, the power banks were connected to four solar panels through a charge/load controller. Four 12-V regulators were used to stabilize the voltage that operates the cameras. The cable sizing used to connect the system was calculated based on the current capacity consumed by the system terminals. Additionally, a Wavetronix traffic sensor was utilized to collect traffic data, as well as a GPS modem to log the trailer location. Figure 2 shows the cable routing for data and power to operate the developed system.

A schematic diagram for the automatic HAZMAT placard recognition system.
The cameras used were GV-LPR1200 with a 1 MP black and white network camera, which was mainly used to capture reflective license plates on vehicles traveling at speed of 120 mph or less. The cameras were equipped with LEDs and IR, for successful utilization under low-light conditions. An important characteristic that favored this camera was the low working temperature (−40°F) and weatherproofness rating (IP67), as Wyoming is notorious for its harsh weather conditions and a low atmospheric temperature that frequently goes below −30°F in winter. Figure 3 shows the system mounted on the trailer while collecting field data.
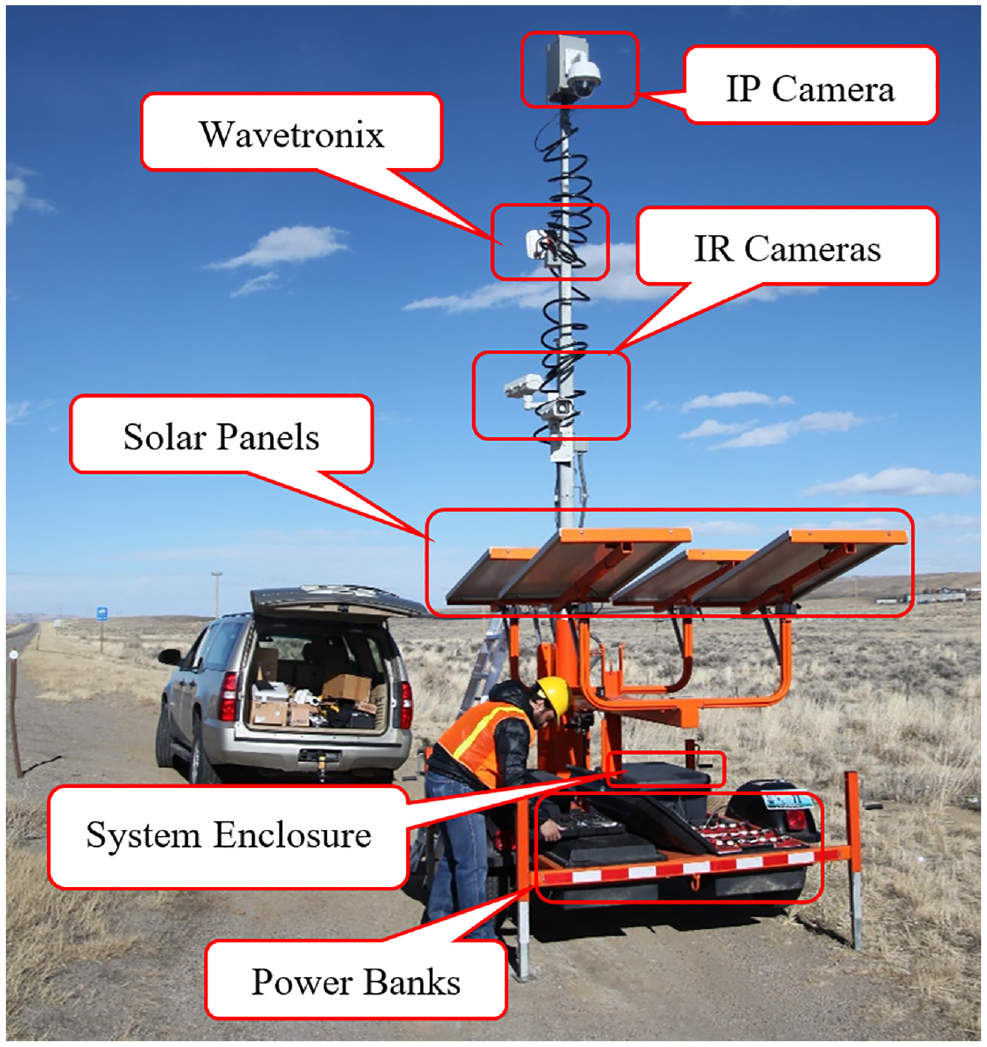
Trailer used for HAZMAT data collection.
Trailer and IR Cameras Positioning
Several challenges were encountered in getting appropriate video recordings for HAZMAT trucks. High operating speed, location of the trailer, positioning of the cameras, sun glare, and visibility were among the challenges faced in capturing quality footage of HAZMAT placards. It was observed that the best location for the trailer on an Interstate road was at the median. This position allows the cameras to be as close as possible to the truck locations, without interfering with the carriageway, as the inner shoulder is narrower compared with the outer shoulder. For two-lane highways, the trailer was placed at the side of the road where no passing lane is located. For the safety of passing vehicles and to increase the exposure time to HAZMAT placards, the trailer was positioned at visible locations with flat grades. To deal with the oblique imagery issues, it was decided to target HAZMAT placards mounted on the back of the trucks. The cameras were mounted at a height of nearly 12 ft, which is higher than the position of all mounted placards. This height would allow tilting of the cameras slightly downwards to avoid as much sun glare as possible. The possibility of mounting the cameras above this height was tested; however, the trailer telescope was shuddering because of the strong wind in Wyoming. The camera focal length was zoomed to 4X to capture the moving trucks at a distance of nearly 120 ft away from the trailer. A perpendicular camera orientation was also tested with relatively lower speed roadways (highways with 50–65 mph speed limit) with the same camera height and with a focal zoom of 2X.
Machine Vision Algorithm
The architecture of CNN is composed of three layers: an input layer, feature learning and classification, and an output layer. The input layer takes the images as input and passes that input to the subsequent layers. The primary computation of CNN mainly occurs in hidden layers, which can be broadly categorized into two types of layers: feature detection layers and classification layers. The primary task of the feature detection layer is to perform three types of operations, named convolution, rectified linear unit (ReLU), and pooling. While convolution is responsible for activating particular features from the input images by applying several image filters, the purpose of ReLU is to perform a threshold operation on each element of the inputs to ensure fast and consistent training. In addition, the pooling operation reduces the number of parameters of the network by utilizing nonlinear down-sampling. The outputs of the feature detection layers are then passed to the classification layer, which consists of a fully connected layer and a softmax layer. The fully connected layer produces an output vector with dimensions equal to the number of output classes, which is then passed to the softmax layer to assign decimal probabilities to each of the output classes ( 19 ).
Because of several advantages of the AlexNet-CNN, it was selected over other approaches to conduct this study. AlexNet has a simple structure, as it consists of eight layers: five convolutional layers and three fully connected layers (50–52). It utilizes a ReLU function which can provide faster training time than other CNN functions, which could be helpful when applying the developed algorithm in real-time. Additionally, it allows multiple graphical processing unit (GPU) training that can process training for large models in less time. Furthermore, AlexNet-CNN adopts an overlapping pooling approach, in which a reduction in errors and higher accuracy can be achieved.
CNN can be trained either from scratch or using a technique called transfer learning. Building a CNN from scratch is computationally expensive and requires abundant training data to get satisfactory accuracy; in contrast, transfer learning uses the knowledge gained from any of the previously trained CNN models and therefore can provide excellent performance for image classification with relatively small amounts of training data. Transfer learning with pre-trained AlexNet was utilized in this study considering the limited number of training HAZMAT images. The limitation of the number of HAZMAT images stems from Wyoming having 33,000 mi of low-volume roadways and HAZMAT traffic being infrequent compared with other traffic types. Previous studies experimented with transfer learning using several pre-trained CNN models, such as AlexNet, VGGNet, GoogLeNet, Inception, and ResNet ( 45 , 53–56). AlexNet was selected over other models as it has simple structure, fast training time, capability of attaining high accuracy, and relatively less requirement for processing power. AlexNet was trained using a subset of ImageNet dataset to be capable of identifying 1,000 possible classes. It is worth mentioning that ImageNet is a massive image dataset with around 15 million annotated images and containing more than 20,000 categories ( 45 ). In this study, the architecture of AlexNet was used in its original form; however, the final layer was fine-tuned to meet the placard detection purposes. The overall framework for HAZMAT placard recognition is shown in Figure 4 and detailed descriptions are provided in the subsequent sections.
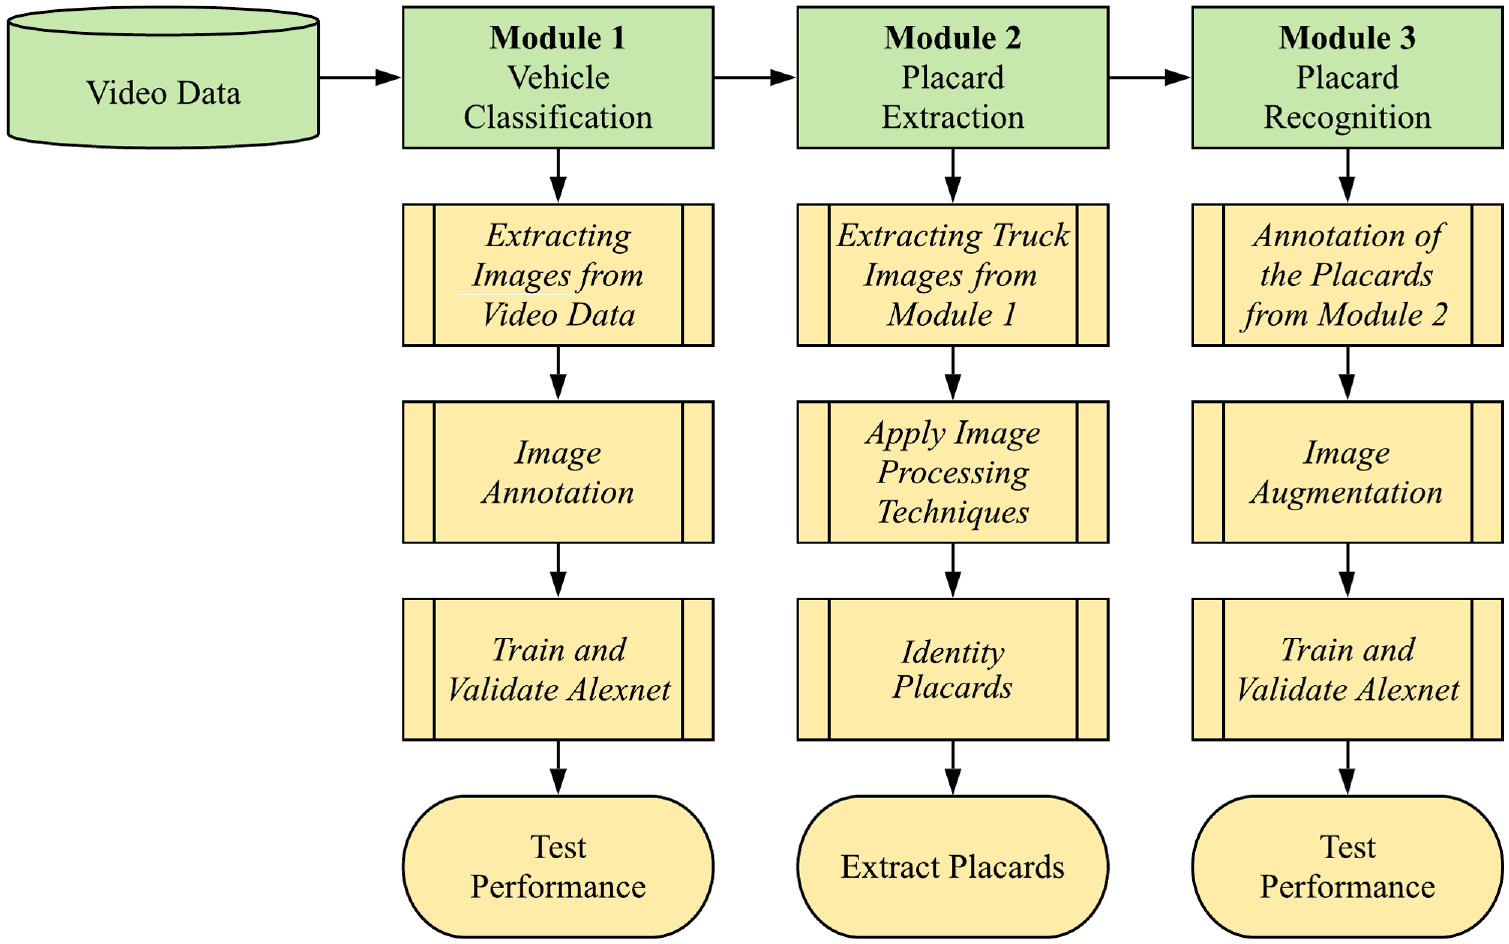
Overall framework for HAZMAT placard recognition results.
Framework for Identifying HAZMAT Placards
The proposed HAZMAT placard recognition framework, as illustrated in Figure 4, consists of three modules, each having its own methodology based on advanced image processing and machine vision techniques. The first step of the framework was to collect video footage from the developed recording system. Totals of 1,221 and 1,269 min of video data from Johnson and Sweetwater Counties, respectively, were extracted and thoroughly analyzed to develop and test the performance of the framework. It is worth mentioning that before passing the videos to the first module, all of them were verified manually to eliminate the ones captured at night-time with poor lighting conditions.
The vehicle classification module (module 1) carried the video data from the previous step and converted it into images at four frames per second sampling rate. The sampling rate was defined based on the field of view of the IR cameras used and the speeds of the vehicles to ensure that each vehicle was present in at least one of the images. Subsequently, all the images were cropped, normalized, and then annotated manually to create an image dataset, consisting of three categories, including car, truck, and no-vehicle, with 1,800 images in each category; afterward, this dataset was used to train the vehicle classification model based on AlexNet architecture. Finally, the performance of the vehicle classification model was evaluated using a test image dataset. Sample images of each category at different lighting conditions and viewpoints are shown in Figure 5.
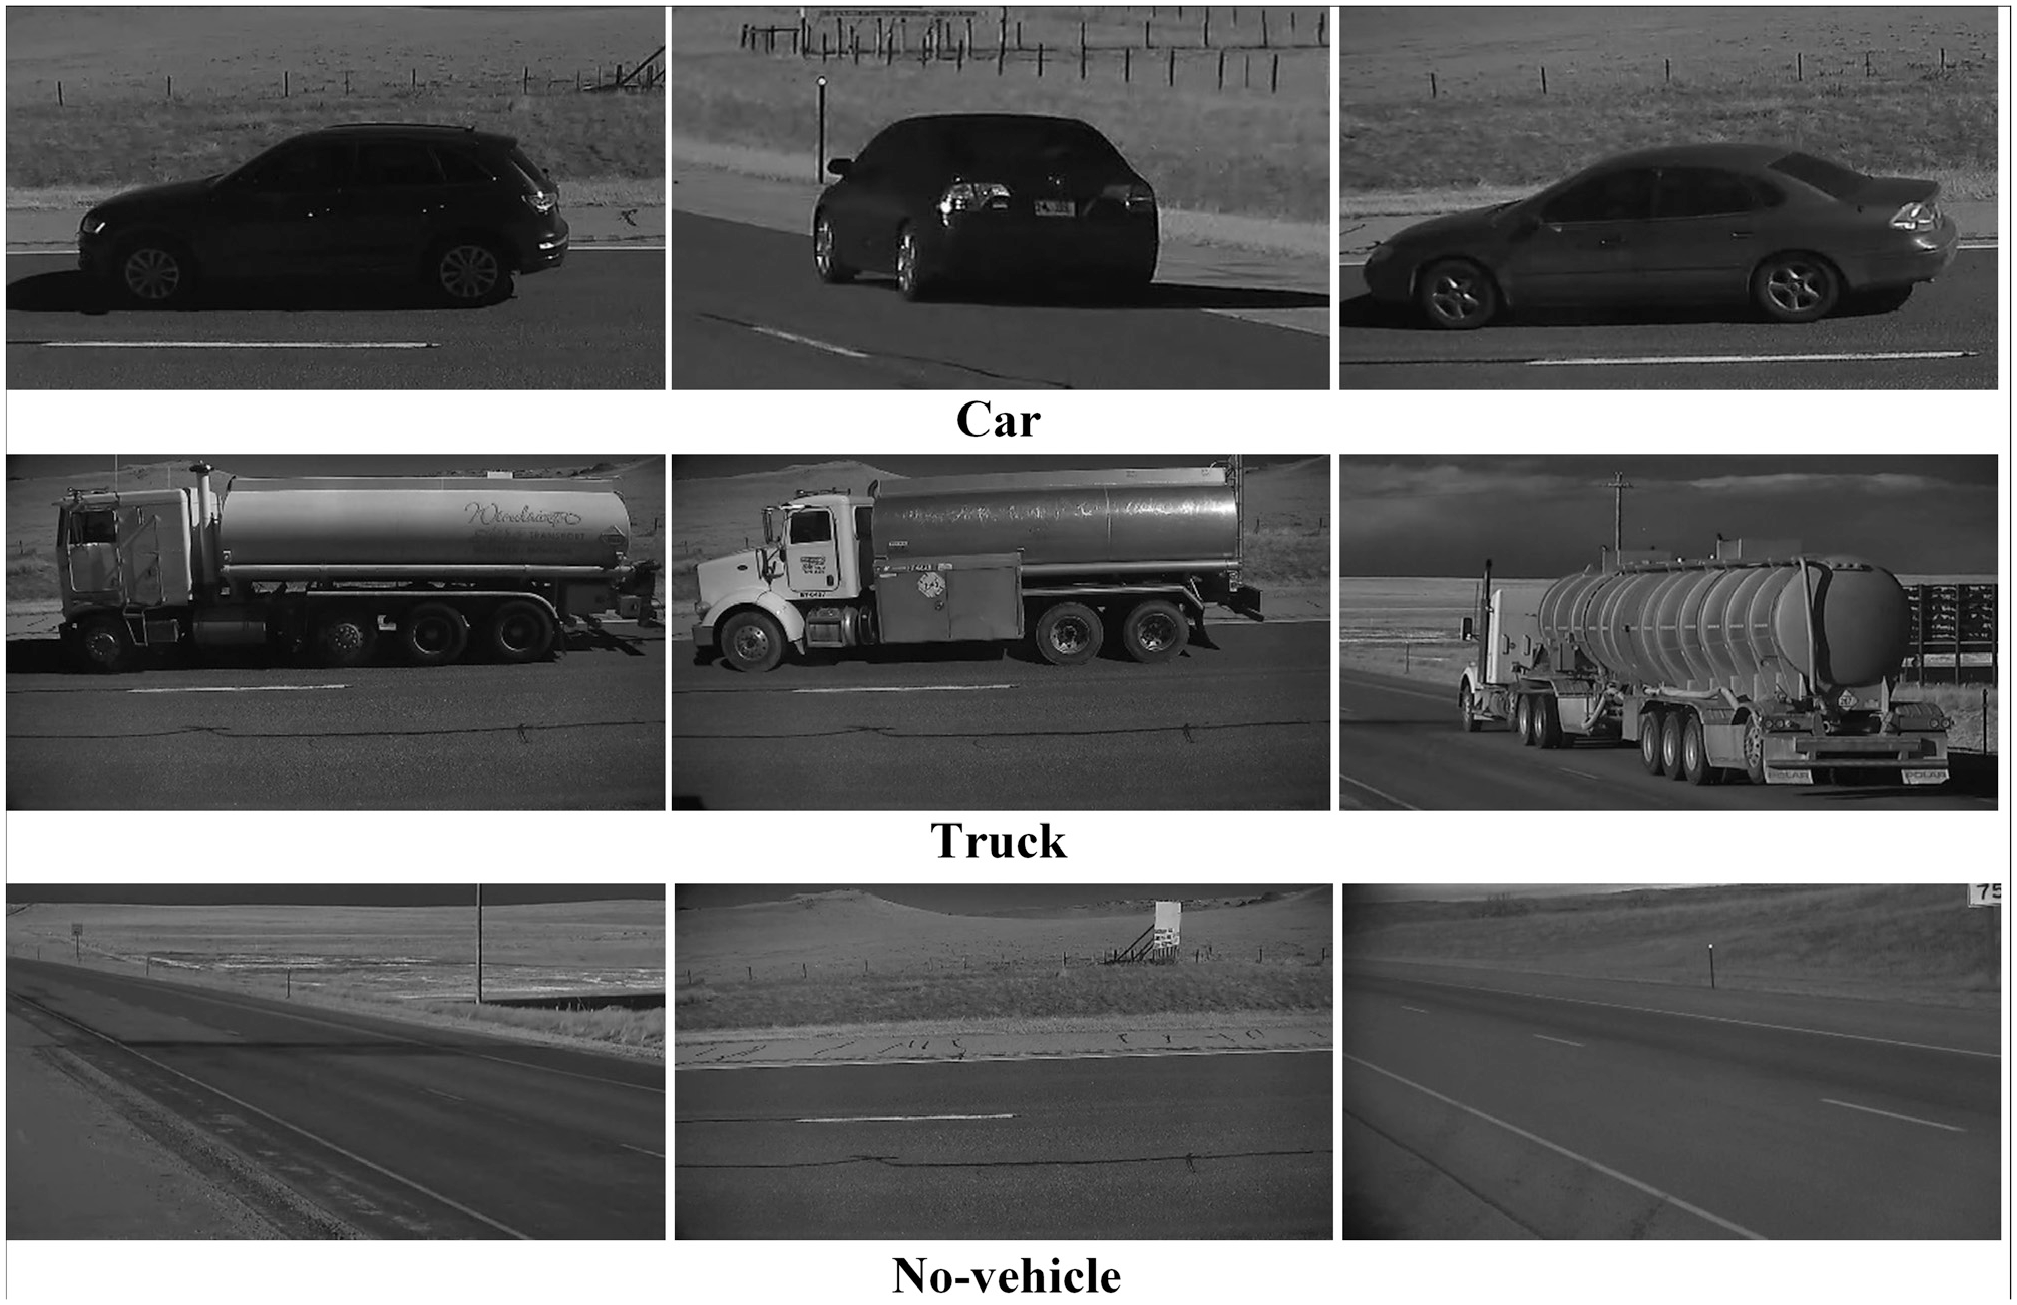
Sample images of vehicle categories at different lighting condition and viewpoints.
The next module is the placard extraction module (module 2), which took only the truck images detected in module 1 and applied several image processing techniques to extract the HAZMAT placards. Extracting placards from the vehicles was a challenging task because of the variation in camera angles, lighting conditions, and placement of the placards. To overcome these challenges, a powerful image processing library, named Open Source Computer Vision Library (OpenCV), on the Python programming platform was effectively utilized ( 57 ). The overall procedure for extracting HAZMAT placards from truck images is illustrated in Figure 6, using a sample image, which consists of seven steps as listed below:
(a) Input image—normalizes, resizes, and converts the image into black and white.
(b) Noise reduction—removes the noise of the image using a bilateral filter ( 58 ).
(c) Canny edge detection—detects the edges of the objects by locating changes in sharpness intensity ( 59 ).
(d) Draw contours—creates close boundaries around objects.
(e) Contour reduction—noisy contours, such as small and open contours, are identified and eliminated.
(f) Identify HAZMAT contour—only the contours closely resembling the properties of a rhombus, the shape of a HAZMAT placard, are identified.
(g) Crop the HAZMAT placard—extract HAZMAT placards.

Extraction procedure of HAZMAT placards.
The cropped HAZMAT placards were manually verified and passed to the final module.
The next module, the placard recognition module (module 3), was to recognize the characters within the detected HAZMAT placard using optical character recognition (OCR). Although this study analyzed a substantial amount of video data, only around 400 HAZMAT placards were extracted because HAZMAT trucks are relatively less frequent on the roadways compared with other vehicles. Building an accurate and reliable OCR requires a large amount of character data under all possible lighting conditions, background, character structure and density, viewing angles, and fonts. Because of the small number of detected placards, it was not feasible to build an accurate and reliable OCR library from Wyoming data. Therefore, several open-source OCRs were experimented with, including Tesseract OCR, developed by Google ( 60 ). However, all the OCRs only provided precise character recognition for placard images with uniform background captured at a perpendicular viewing angle under good lighting conditions, which is very unlikely to occur in real-world scenarios. To overcome these limitations, instead of considering the final module as an OCR task, this study devised it as a classification task. The extracted placards from module 2 were grouped into six categories (i.e., 1075, 1203, 1267, 1993, empty, and other). The identified placards were selected as they have the highest presence frequency on Wyoming’s roadways, based on the conducted CFS. The top four most frequent placards were placed into separate categories and the rest were grouped and placed into the “other” category. Training of a reliable machine learning model requires many images in each category, which provided an additional challenge to this study as the image sample size in each placard category was small. To overcome this limitation, the image augmentation technique was used to increase the image sample size. Image augmentation is a method that creates synthetic images from the base image to mimic real-world scenarios ( 61 , 62 ). In this study, 15 synthetic placard images were created from each image by altering the horizontal and vertical share, noise level, sharpness, brightness, contrast, and saturation of the original image, as illustrated in Figure 7.
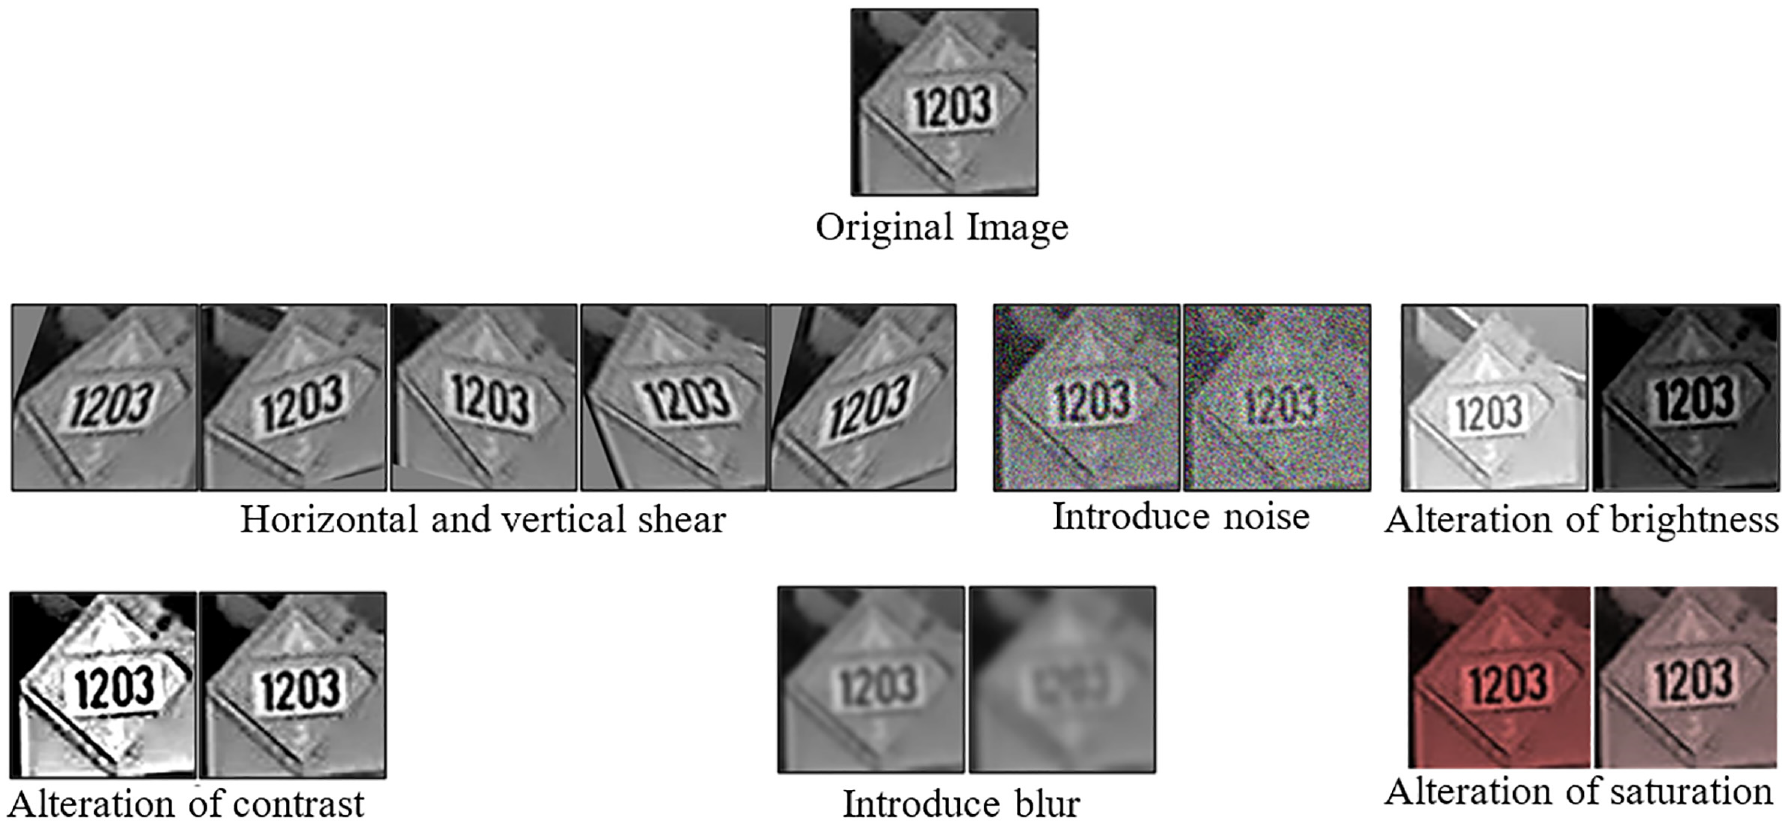
Types of image augmentation.
Using the image augmentation technique, the number of images increased to 6,000 with 1,000 images in each category. These augmented images were used to develop the placard recognition model by leveraging AlexNet.
Algorithm Results
As mentioned in the previous section, the vehicle classification model in module 1 was trained using a pre-trained AlexNet model. To use the pre-trained network, transfer learning techniques were applied, where the last layer of the pre-trained network was updated and tuned to achieve the vehicle classification task. The initial hyperparameters of the model were updated by carefully observing the training progress and validation results for different parameters. It is worth mentioning that 80% of the images were used for training and validation and 20% of the images were used for testing the accuracy of the vehicle detection model. Figure 8a shows the training progress and validation results along with loss using the best set of hyperparameters for the vehicle classification model. The overall validation accuracy was about 65% at the first step, but it gradually improved and reached around 95% at the final iteration. Similarly, the loss was also decreased until it reached a final value of around 0.1. Similar to the vehicle classification model, the placard recognition model leveraged transfer learning by properly updating the final layer of the AlexNet. In addition, instead of using the default values, the hyperparameters were also tuned using a validation dataset in an attempt to achieve the best performing placard recognition model. Figure 8b illustrates the increase in accuracy and decrease in loss over the training iteration during validation, which shows that the overall validation accuracy of placard recognition was around 21% at the initial step and that it improved over the training iteration until it reached a final overall validation accuracy of 96%.

Accuracy and loss during training/validation: (a) vehicle classification model and (b) placard recognition model.
After training the vehicle classification model using transfer learning, the performance was evaluated using the test dataset, which revealed that the proposed model is capable of classifying vehicles with a high degree of accuracy. The overall classification accuracy across the three categories was 96%, which is marginally higher than the overall accuracy found during validation. Figure 9a presents the confusion matrix of the final vehicle classification model along with recall/true positive rate (TPR), false negative rate (FNR), precision/positive predictive value (PPV), and false discovery rate (FDR). Recall measures the ability of a model to correctly find all the images of an image category in the testing dataset, whereas FNR is the opposite of recall and indicates the degree of misclassification of the model. Precision indicates the ability of the model to classify images correctly, with no false prediction, and similarly, FDR is the opposite of precision. In general, a high degree of recall and precision of a model indicates superior performance in correct classification ( 63 ). The highest recall as well as precision was found for the no-vehicle image group, where all the test images were correctly classified. In contrast, the car image group had the lowest recall (90.8%) and precision (96.2%), where out of 360 test images, 32 images were misclassified as truck and one image was misclassified as no-vehicle. Similarly, considering the truck image group, around 96% of the images were accurately classified.

Confusion matrix: (a) vehicle classification model and (b) placard recognition model.
The performance of the placard recognition model was also evaluated using the test dataset, which consisted of 20% of the original images. The overall detection accuracy was around 95%, which shows the capability of the proposed model to detect HAZMAT placards. Figure 9b presents the confusion matrix along with recall/TPR, FNR, precision, and FDR. The highest recall and precision were found for the empty placards with 100% detection accuracy. In contrast, the lowest recall (91%) and the lowest precision (92.5%) were found for the placard “1203,” where out of 320 test images, six, eight, three, one, and four images were incorrectly classified as “1075,”“1267,”“1993,” empty, and other, respectively. The rest of the placards also provided excellent recall and precision values ranging from 92% to 95%. From a safety perspective, a high FNR of HAZMAT placards is very dangerous, especially, when a HAZMAT placard is misclassified as an empty placard. The number of such misclassifications by the proposed model was negligible. Both the HAZMAT placards “1203” and “1267” had only one such misclassification. The rest of the HAZMAT placards (e.g., “1075” and “1993”) did not have such hazardous misclassification, as can be seen in Figure 9b.
Discussion and Practical Benefits
One of the major benefits of a fully functional automatic placard recognition system is the reduction in personnel requirements for HAZMAT data collection. On average, six volunteers are needed for more than 100 h of manual data collection while conducting each of the nine CFS in Wyoming. With the introduction of an automatic system, the number of volunteers required for each study will be significantly reduced. Furthermore, there will be significant reduction in costs associated with loss of productivity, lodging, transportation, and other miscellaneous expenses to conduct the CFS.
Collecting data manually using volunteers poses a risk to their personal safety. Often, volunteers need to position themselves quite close to the moving traffic to collect HAZMAT placard data. This may easily result in a crash with severe outcomes. In remote areas, it becomes difficult to find a safe distance away from the moving traffic to properly collect HAZMAT placard information, especially with high operating speeds. Adverse weather conditions such as rain, snow, freezing temperature, and wind also pose a challenge in collecting data manually. The associated risks of manual data collection and the safety challenges can be overcome with the introduction of an automatic system.
Other benefits of the automatic placard recognition system include data collection for longer periods of time, and time saving in manual data reduction. Because of resource limitations, manual data collection is only carried out during the daylight hours and for three representative days of the week, one weekend day, and two weekdays. An automatic system with night vision capabilities can increase the data collection hours and days. Furthermore, with the incorporation of OCR technology, the system can detect and record placard information, thereby saving hours of manual data reduction.
Additionally, the developed system could be used as a real-time monitoring system for HAZMAT transportation patterns. Additional layers could be added to the developed AI algorithm to identify the truck type (straight truck, semi-trailer, and tractor-trailer). This could help in estimating the amount of HAZMAT being transported at a designated location.
Although vehicle classification is not the primary objective of this research, the proposed model has many real-life practical applications. Since the proposed model is based on a single video camera, it can, therefore, be easily integrated into the existing roadside webcams with proper calibration. The system has the potential to become a low-cost source of collecting roadway data, such as vehicle counts and classes. The proposed model can also be extended to continuously measure and monitor other fundamental traffic parameters, including speed and traffic volumes. Extending the developed algorithm would be very beneficial to researchers, transportation practitioners, EMAs, and policymakers to effectively identify incident locations and to implement appropriate countermeasures.
Conclusions and Limitations
Presence of high energy activities within the state of Wyoming as well as the increased truck crashes associated with HAZMAT raised the need to conduct CFS to identify the type and quantities of HAZMAT being transported using the road network. Several recent CFS have been conducted in several counties in Wyoming. These studies concluded that the most transported HAZMATs belong to the classes for flammable liquids (class 3) and gases (class 2), which are related to oil and gas activities. An automatic placard recognition system was developed to facilitate HAZMAT CFS. A mobile system was built using IR cameras and an NVR to collect video data for HAZMAT placards. AI algorithms were applied to recognize the placard type to identify the HAZMAT shipment being transported. A CNN, named AlexNet, was used to recognize the placard type. The collected data was divided into an 80% and 20% split to train and test the developed algorithm. The overall accuracy of the proposed framework was 95% in identifying HAZMAT placard information. The recognition of HAZMAT placards was dealt with as a classification problem rather than OCR because of dataset limitations. The four most observed placards being transported on the road network were identified separately. Other placards were grouped into one category, which represents a range of 8% to 21% of the transported HAZMATs on Wyoming roads.
Several limitations were encountered when conducting this study. The functionality of the current system is highly dependent on the position, orientation, and distance of the cameras in relation to the roadway or the moving vehicles. Ideally, the trailer with the cameras mounted should be placed as close as possible to the roadway. This will hinder collecting data for both roadway directions when there are wide medians, mainly where HAZMAT data needs to be collected from Interstate roads.
Mounting the camera on the post at the optimum height requires multiple trials. The higher the camera is, the less the observed sun glare that occurs but the higher the encountered footage shuddering. To obtain clear video images, reduced sun glare and stable footage should be obtained. Fixing the camera system on a sturdy roadside element might provide a potential solution to overcome this limitation. This could be achieved by integrating the developed system and recognition algorithms within electronic tolling systems and other existing intelligent transportation systems.
HAZMAT trucks represent only about 0.4% to 3.2% of the total traffic. Additionally, the system was only tested during daytime, which resulted in a relatively small sample size of HAZMAT placards. To surmount this limitation, the image augmentation technique was used.
The developed system was useful in recognizing HAZMAT being transported on high-speed straight sections of rural roadways. It is anticipated that the developed AI algorithm will be tested at intersections to identify HAZMAT placards and transportation directions. Furthermore, the developed system could be upgraded to provide a real-time monitoring system for HAZMAT transportation patterns.
Footnotes
Acknowledgements
The authors would like to thank the Wyoming Department of Transportation, the Wyoming Homeland Security, and the US Department of Transportation for funding and supporting this study. The authors would like to thank students from the University of Wyoming for helping with field data collection and reduction.
Author Contributions
The authors confirm contribution to the paper as follows: study conception and design: M. Ahmed and S. Gaweesh; data preparation and reduction: M. N. Khan; analysis and interpretation of results: M. N. Khan; draft manuscript preparation: S. Gaweesh, M. N. Khan, and M. Ahmed. All authors reviewed the results and approved the final version of the manuscript.
Declaration of Conflicting Interests
The author(s) declared no potential conflicts of interest with respect to the research, authorship, and/or publication of this article.
Funding
The author(s) disclosed receipt of the following financial support for the research, authorship, and/or publication of this article: This work has been supported by the Pipeline and Hazardous Materials Safety Administration, grant number 20DOT-UWY-HM-HMP20.
