



Abstract
In cases where budgets and space are limited, the realization of new bicycle infrastructure is often hard, as an evaluation of the existing network or the benefits of new investments is rarely possible. Travel demand models can offer a tool to support decision makers, but because of limited data availability for cycling, the validity of the demand estimation and trip assignment are often questionable. This paper presents a quantitative method to evaluate a bicycle network and plan strategic improvements, despite limited data sources for cycling. The proposed method is based on a multimodal aggregate travel demand model. Instead of evaluating the effects of network improvements on the modal split as well as link and flow volumes, this method works the other way around. A desired modal share for cycling is set, and the resulting link and flow volumes are the basis for a hypothetical bicycle network that is able to satisfy this demand. The current bicycle network is compared with the hypothetical network, resulting in preferable actions and a ranking based on the importance and potentials to improve the modal share for cycling. Necessary accompanying measures for other transport modes can also be derived using this method. For example, our test case, a city in Austria with 300,000 inhabitants, showed that a shift of short trips in the inner city toward cycling would, without countermeasures, provide capacity for new longer car trips. The proposed method can be applied to existing travel models that already contain a mode choice model.
Keywords
The estimation of bicycle demand already looks back at a rich history as summarized by Turner et al. ( 1 ) as well as Kuzmyak et al. ( 2 ). Especially the demand modeling of cycling requires a higher level of detail and is more complex compared with other transport modes, as concluded by RSG and The RAND Corporation ( 3 ). Therefore, the full implementation of this mode in regional travel models is still quite rare. This leads to an unlevel playing field in relation to the available data for decision makers. The call for sustainable mobility and, in particular, bicycle transportation, cannot be ignored in times of rapid urbanization and large negative consequences of our existing ways of mobility. As a result, new investments in cycling infrastructure are decided or being planned in urban areas all around the world, thus increasing the demand for planning tools that include cycling.
In 2014 the National Cooperative Highway Research Program released a guidebook on estimating bicycling and walking for planning ( 2 ). This work shows us a wide range of options from regression analysis to agent-based modeling to estimate the cycling demand, each with pros and cons. The most commonly used methods include tour or activity-based models, trip-based models and direct demand models, for example as described by Munira and Sener ( 4 ). In 2019 the standing committee on planning of the American Association of State Highway and Transportation Officials (AASHTO) published an evaluation of walk and bicycle demand modeling practice. This report concluded, among other things, that there is a need for greater spatial and network detail in demand models for cycling and walking as well as a need for the application of route choice for these modes ( 3 ). Lu et al. highlight the importance of temporal information in transport demand models for active modes ( 5 ). These adaptations should lead to an improvement of the bicycle demand estimation quality of the models.
The ongoing research on bicycle modeling, for example by Ziehmke et al. ( 6 ), emphasizes that agent-based models offer a framework with the corresponding level of detail necessary to model bicycle demand appropriately. On the other hand, Aziz et al. state, after building and applying an agent-based model for New York City, that “validation is a challenging task for agent-based models” ( 7 ). Furthermore, “the approach requires data with significant details which we do not have at this point.”
This leads us to the question as to what a transferable method for bicycle network evaluation and planning with only limited data sources for cycling could look like and how travel demand models can be used for quantitative analyses.
Method for Quantitative Bicycle Network Evaluation and Planning
As shown in the introduction, there is still room for improvement in the demand modeling for bicycle transportation. We also saw that the possibilities of agent-based modeling are limited because the available data for cycling are often insufficient. In our research we aimed to improve the performance of tour and activity-based aggregate bicycle demand models by adopting the improvement of the spatial and network detail as well as implementation of route choice in the demand model as recommended by the AASHTO publication ( 3 ). This demand model will be used in our method to quantitatively evaluate and plan a bicycle network.
The objectives of our methodological approach include:
The implementation of “microzoning” through the use of census block boundaries and data, thus generating spatial detail.
Utilization of detailed dense graphs representing all links for cyclists and pedestrians in the network.
A multiple-graph approach for our existing simplified multimodal tour-based demand model: tour generation, trip distribution, and mode choice (car, transit, bicycle, or walking) on a thin graph with low details; route choice and trip assignment on a dense graph with high details.
Transferability of the method to other regions with limited data sources for cycling.
Overview of Proposed Method
The proposed method is based on a simplified travel demand model that identifies the hypothetical demand for cycling. To build the model, bicycle-specific challenges in relation to complexity and level of detail were addressed according to the objectives. The trip generation in our model was tour-based. For the generated trips, the destination and transport mode are estimated with consideration of bicycle-specific mode choice parameters. An assignment algorithm for cycling was defined and tested.
As can be seen in Figure 1, the model is not used in the conventional way, for example, estimating the effects on the number of bicycle trips caused by changes in the available infrastructure. Instead, we use the model to estimate where bicycle trips would occur, given a predefined number of bicycle trips or a predefined modal share for the bicycle. The hypothetical bicycle demand is then assigned to the network. Here we neglect the quality of the infrastructure or personal preferences by assigning the demand based on distance. This enables us to visualize potential suppressed bicycle demand resulting from deficiencies in the bicycle infrastructure.

Overview of the proposed quantitative methodological approach for bicycle network planning. Trip demand for cycling, transit and car transportation was estimated for six scenarios. The scenarios cover population and land use as well as infrastructure and transit timetable and a desired modal share for cycling. Trip demand was estimated using a multimodal microzone aggregated tour-based demand model. The resulting origin–destination matrices were stochastically assigned based on distance, and the resulting link volume and flow bundle analysis were used to redesign the main cycling network. By comparison between the present bicycle network and the data-driven redesign of the cycling network, deficits and suppressed cycling demand in the present bicycle network were identified.
In the next step, the resulting hypothetical bicycle link volume and flow resulting from the assignment are translated into a redesign of the bicycle network which would be able to service this hypothetical bicycle demand. After that, we compare the links of the redesigned cycling network and their proposed level of service based on the estimated link and flow volumes from the model, with the corresponding links in the present bicycle network.
After comparison it is possible to identify the deficits in the current bicycle network. The deficits can be ranked according to potential contribution to the model shift by calculating the difference in current and hypothetical link volumes.
Structural Data, Graphs, and Tour Generation
The model used is a macroscopic multimodal aggregated travel demand model that includes motorized transportation (car, car passenger, and trucks), transit (train, streetcar, and bus), cycling, and walking. It estimates the travel demand and network assignment for a typical workday (24 h). The demand model contains 910 traffic analysis zones (TAZs) which, for our test case, the city of Graz in Austria, represent the census blocks. For the surrounding municipalities of Graz, the TAZs are defined by the administrative boundaries of the wards. This means that the size in area and number of persons is quite small compared with most other aggregated demand models. The structural properties (population demography, workplaces, and indicators for leisure and shopping as well as education) for each TAZ were used from the national and state statistics.
The model is built on two graphs, each with a different level of detail. The trip distribution and mode choice graph is the official Austrian infrastructure graph (GIP) ( 8 ), which contains all drivable roads in the network accessible for cyclists and pedestrians. The GIP-graph has a lower graph density compared with the assignment graph we used. The assignment graph is derived from OpenStreetMap ( 9 ) and contains additional bicycle links. The official Austrian infrastructure graph is publicly available as Open Government Data; the OpenStreetMap graph therefore, is likely to contain all assets included in the official Austrian infrastructure graph. Additionally, OpenStreetMap has a very active user community in the Graz metropolitan area, thus offering a higher density graph with additional bicycle-relevant attributes which might improve a detailed route choice model for cyclists. Some key statistics for both the distribution and mode choice graph as well as the assignment graph are displayed in Table 1.
Key Statistics for the Demand and Assignment Model Used

Note: TAZ = traffic analysis zone; min. = minimum; max. = maximum.
The tour and trip generation estimation in our model is based on the activity chain model “VISEM” ( 10 ). The input data for the 171 activity chains and corresponding mobility rates for the 13 user groups implemented in the model were derived from the national mobility survey of Austria, “Österreich Unterwegs 2013/2014” ( 11 ) for the Graz metropolitan area. The user groups differentiate the population according to age, employment, retirement, and education as well as motor vehicle ownership. The demand for trucks is estimated separately, only plays a minor role in our methodology, and is therefore neglected in this paper.
Trip Distribution and Mode Choice
For the combined trip distribution and mode choice, a multinomial logit model as described by Ben-Akiva and Lerman ( 12 ) was used. The utility functions in our model describe the impedance for a specific trip between an origin activity and destination activity using a specific transport mode. The impedance is used to calculate the probability of a trip for each origin–destination (OD) pair per transport mode. The previously generated tours are then distributed over the OD pairs accordingly, considering the accessibility per transport mode.
The trip distribution in our model (Equation 1) is estimated based on the quality of the available transport modes (logsum for the mode choice utility). The trip distance is also used as a variable in the trip distribution to prevent longer-than-necessary trips. As we simplified our model, we did not differentiate between the different user groups and trip purposes, either in our trip distribution or mode choice.

The variables of the utility functions of the mode choice are mode-specific to reflect mode-relevant properties. Whereas walk trips consider only distance (Equation 2), the utility of bike trips depends on distance and elevation (Equation 3). The elevation does not differentiate between ascent and descent, to prevent one-directional bicycle trips. Elevation itself must be considered, as bicycle trips from the mountainous residential areas in our test case are unlikely. The car and car passenger utility functions (Equations 4 and 5) consist of the actual travel time as well as the access and egress time, which incorporates park search time und walk times to or from the car to the actual origin or destination. Through separate utility functions for car and car passenger it is possible to differentiate between shorter car trips with a low occupancy rate and longer car trips usually with higher occupancy rates. For transit (Equation 6) we use a combination of transit service frequency, which improves the utility slightly, and the perceived journey time, which considers access and egress time as well as waiting times and transfer impedances in addition to the journey time. The parameters used for the combined trip distribution and mode choice model are shown in Table 2.





Parameters of the Trip Distribution and Mode Choice Model

We calibrated the tour-based distribution and mode choice model for the base case to the modal split and trip length distribution per transport mode. As reference we used data from the national mobility survey of Austria “Österreich Unterwegs 2013/2014” ( 11 ) for the Graz metropolitan area.
As previously stated, the proposed method works through setting a certain modal share for cycling and analysis of the changes in bicycle link volumes. To achieve the desired number of bicycle trips and thus the desired modal share for cycling, we adapted the general resistance for the bicycle (
As we lacked the data for an advanced estimation of cycling modal choice, as for example described by Pinjari et al. ( 13 ), Maldonado-Hinarejos et al. ( 14 ) or Halldorsdottir ( 15 ), we decided to focus on indicators that could properly estimate the distribution of bicycle trips in our model based on the limited available data. Therefore, we considered bicycle route choice models and revealed preference research by Broach et al. ( 16 ) and Zimmermann et al. ( 17 ) and searched for parameters with a significant influence on the route choice. We presumed that the most significant parameters for route choice would ultimately also influence the decision to use a bicycle for a certain trip or not. Ultimately we found that in our case a combination of distance and elevation provided the best performance.
Trip Distribution and Mode Choice Validation
For the validation of the bicycle trip distribution, the Graz metropolitan area was divided into 10 zones. For each OD pair the number of bicycle trips estimated, based on household mobility survey empirical data from Sammer et al. ( 18 ), was compared with the number of bicycle trips estimated by the model. This validation was necessary to make sure our model not only made proper estimations on average in regard to mode choice and trip length for cycling, but also made proper estimations at an OD pair level. The calculated number of bicycle trips in the model correlated with the empirical data (R = 0.99, p < 2.2e−16). When interpreting these statistics, we must consider that the number of OD pairs for which we had sufficient reference data was limited (34 out of 100 possible OD pairs). Better and more detailed reference data would certainly improve the calibration possibilities and validation quality of the trip distribution and mode choice model.
Trip Assignment
The OD matrix for bike resulting from the demand model was assigned to the dense, detailed assignment graph derived from OpenStreetMap ( 9 ). This graph covers all links where cyclists could ride. It was also enhanced with z-coordinates, to potentially take differences in elevation into account. In this graph all nodes with at least three edges were provided with a connector for that particular TAZ, using fixed proportions. By this means we tried to assign as many of the shorter bicycle trips on the graph as possible. Only the zone domestic trips were not assigned to the graph. Although the model used is capable of assigning the walking and transit trips, from this stage onward these modes as well as the car passenger mode were neglected, because they are not relevant for our further application.
Car and truck trips were assigned to the network using an equilibrium assignment based on the actual travel time. The actual travel time was calculated using a volume delay function and was used as the link impedance. For the turn impedance, a global time penalty value per node depending on left, right, or straight, was used.
Initially for the bike, an advanced calculation for the link impedance was used. This calculation considered: distance, slope, sidewalk (yes/no), separated bikeway (yes/no), as well as volume of cars and trucks in mixed traffic. The considered variables were derived from Broach et al. ( 16 ). For the bike, a stochastic assignment was chosen to better represent the bigger deviations of individual preferences concerning route choice for this transport mode in the assignment.
Trip Assignment Calibration and Validation
Because of the lack of link volume reference data for cycling, it was not possible to calibrate or validate the detailed assignment impedance function. It was possible to estimate the parameters for the impedance functions and recreate a typical route choice for cyclists at a more general level. A plausibility check using the limited available data was performed. As reference data, five fixed bicycle counting stations, various manual bicycle counts from different years and differing in quality, as well as the integration of expert opinions were used for this simplified calibration. A plausibility check was also performed for the assignment of the motorized modes (car and truck). A comparison between the model output and bicycle count data can be made to provide a general idea of the model performance. But we have to consider that deviations can originate both from errors in the model and from errors or individual cases contained in the bicycle count data.
Simplified Bicycle Trip Assignment
As a solution to the problems that occur with a trip assignment that is neither calibrated nor validated, we propose for our method to simplify the bicycle trip assignment. As stated in Broach et al. ( 16 ) and Zimmermann et al. ( 17 ), distance is the most relevant parameter for bicycle route choice. A stochastic bicycle trip assignment based on distance enables us to visualize where cyclists would ride if their corresponding shortest path provides suitable bicycle quality. By this means we are also able to visualize suppressed bicycle demand resulting from insufficient bicycle quality. In the next section we will discuss how we can use the insights from our proposed quantitative method in the evaluation and strategic planning of bicycle networks.
Application of the Method in the Graz Metropolitan Area
The quantitative method as described previously was applied to the Graz metropolitan area. The Graz metropolitan area is located east and south of the Alps and is characterized by a large basin with some smaller hills. The metropolitan area is 1,350.35 square miles and has 637,532 inhabitants. The main city is the city of Graz with 294,630 inhabitants on 49.26 square miles. Population density in the whole metropolitan area is 472 inhabitants per square mile, for Graz the population density is 5,981 inhabitants per square mile. Our application focused on Graz as the main city. Besides the main city, municipalities in the metropolitan area at cycling distances of up to 10 mi from Graz and with suitable geographic profile were considered as well.
The city of Graz can be divided into two parts. The western side of the river was mainly redeveloped after the second world war and, as was typical for that time period, was built more around cars. The eastern side of the river is mainly untouched and, till today, contains structures dating back to the “Gründerzeit” with its typical medium-density occupancy and only limited public space available. Parts of the city are an UNESCO World Heritage site.
Graz was one of the first Austrian cities to adopt a bicycle network after the motorization period between the 1960s and 1990s. Although open to new ideas, the infrastructure planning policy in Graz remained characterized by the paradigm that only public space not necessarily needed for motorized transportation or parking might be allocated for walking and cycling. The result was a bicycle network that contains good main routes as well as good links, but several main routes consist of interrupted short links of cycling infrastructure of variable quality. As presented in Figure 2, the main cycling network spans 61 mi and is a radial network with a ring in the center. There are only a few connections between the radials at a main network level. The main cycle network does not always follow the shortest route because of higher prioritized conflicting uses of the public space, resulting in significant detours on certain connections. Strobl et al. performed a qualitative evaluation of the main cycling network quality, revealing that in many cases the limited added value of using the main bicycling network does not outweigh the burdens of the detour ( 19 ). This led to our neglecting the legacy network and instead planning a new network based on quantitative analyses, which might perhaps overlap with the existing network. This new strategic bicycle network was designed according to a bicycle translation of the network design principles derived from the Austrian national highway system.
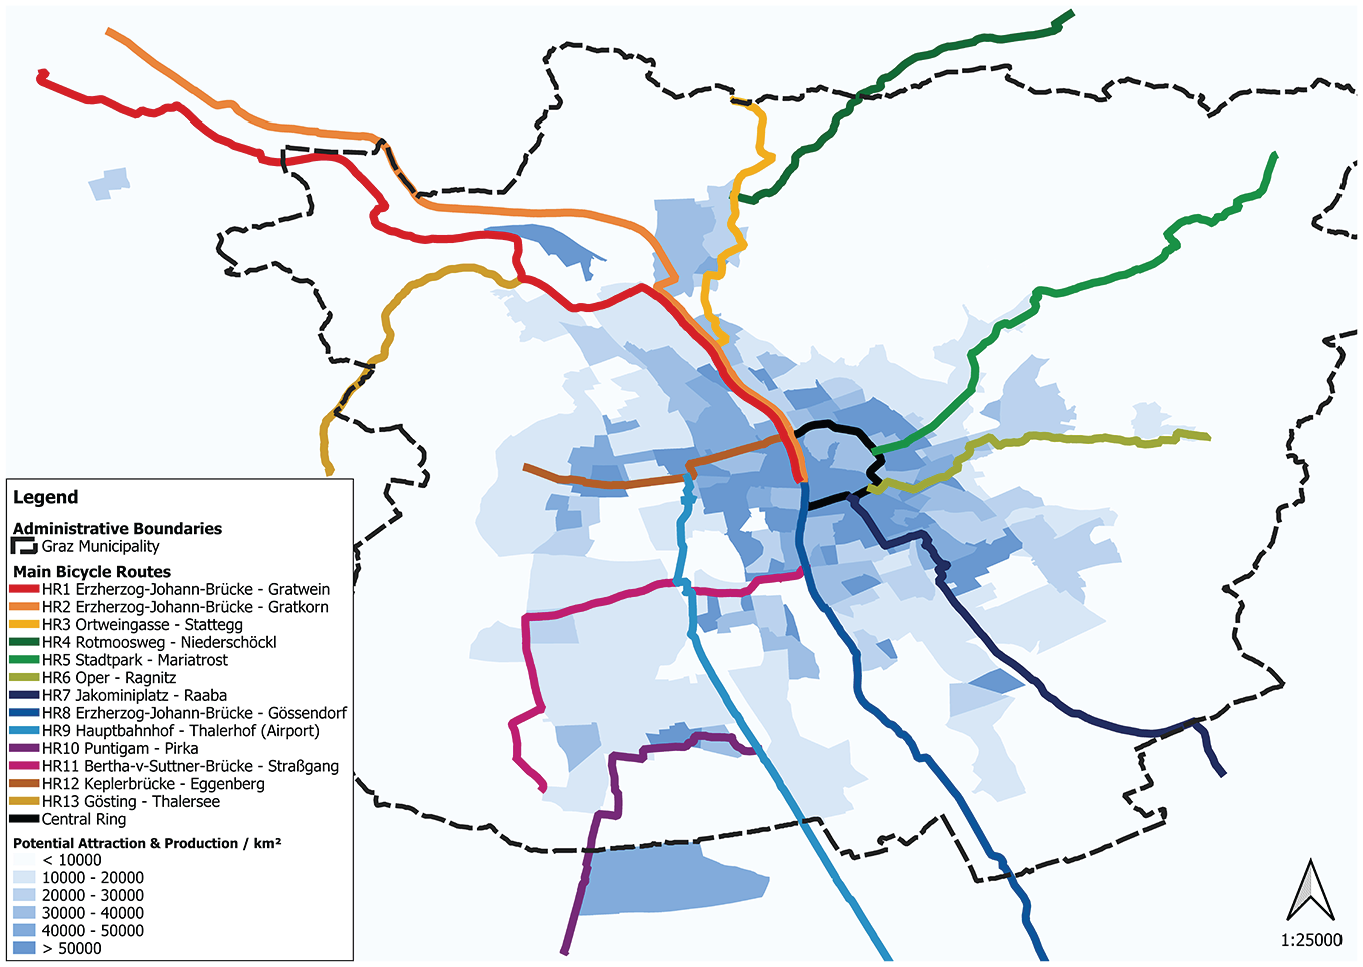
Present main bicycle network for Graz ( 20 ). The 14 main bicycle routes of Graz are projected on a background where the potential attraction and production per km2 is displayed for each traffic analysis zone.
To plan this new network, we developed four scenarios (2017–25% modal share bike, 2017–40% modal share bike, 2030–25% modal share bike, and 2030–40% modal share bike) in addition to two base cases (2017 and 2030) using the multimodal travel demand model implementing the method described in the previous section. The 25% modal share for bicycle was considered a short-term realistic goal for Graz. The 40% modal share for bicycle was based on the vision of having a modal share comparable with cities like Amsterdam and Copenhagen. For each scenario we would adjust the general resistance for cycling (

Changes in origin–destination demand per transport mode; “2017 base case” versus “2017, 25% bike” and “2030, 25% bike.” For cycling, transit, and car, the changes in demand when Graz attains a 25% modal share for cycling compared with the base case are displayed. In the “2017, 25% cycling” case, demand for cycling mainly increases in the city center from transit trips shifting toward cycling. The number of longer car trips slightly increases, as road capacity of short car trips shifted to cycling and public transport becomes available in the congested city center. In the “2030, 25% cycling” case, the number of trips in the western city-side increases for all modes as a result of new residential and commercial developments. The transit network improvements in the eastern city-side reduce demand for cycling and car transportation.
For all scenarios, we assumed that all the infrastructure for cycling would have a homogenous quality, so our model would identify the best truly supply-based routes. Only distance and elevation played a role in the impedance calculated for each route alternative. A river through the Graz metropolitan area forms a natural barrier. For the year 2030 scenarios we assumed three additional river crossings for cyclists at significant locations. A restructuring and expansion of the Graz transit network will be finished by 2030. The expansions include mainly tramway extensions to new neighborhoods and redundancy or reliability fixes on the existing lines. As we will see in the results, this has a significant impact on the scenarios in 2030 compared with the 2017 base case, for those particular OD pairs where the transit network will be improved. For Graz domestic trips, transit and bike are less complementary and more competitive.
As described earlier, our utility function for the cycling mode choice consists of three components: distance, elevation, and a general resistance factor for cycling. To achieve the desired modal share, we adjusted only the general resistance factor for cycling (
The impact analysis on modal choice shows that the scenarios 2017–25% and 2030–25% lead to an increase in cycling especially in the city center as well as the six surrounding districts. On the other hand, the use of transit and motorized trips decreases. But the model predicts that, at the same time, the car transport mileage increases by about 5%. After further analysis in the model we found that by reducing the resistance for cycling without accompanying measures for other modes of transportation, shorter trips in the city center would shift to cycling. This would relieve some of the road capacity for induced longer trips by car. Some longer trips by transit also shifted to the car. In the scenarios 2017–40% and 2030–40% this effect did not occur, as cycling in these scenarios will be the main mode of transportation for longer trips as well. We also found that the 2030–25% and 2030–40% scenarios, when compared with the 2017–25% and 2017–40% scenarios, react very plausibly to the changes in structural data as well as the changes and expansion of the Graz transit network.
The resulting OD pair volumes as well as link volume and flow charts from the model were used to redesign the bicycle network (Figure 4). In our case we had a functional road classification for our bicycle network with three connection types. In parallel with other transport modes, the types were defined as: arterial (class A), collector (class B), and local (class C). The existing bicycle infrastructure, including roads with mixed traffic and a maximum speed of 30 km/h (≈20 mph) were planned as at least part of the local bicycle network. In the next step the routes of the arterial connection type were planned as a connection between territories with a substantial demand as well as a connection between the main city and the satellite towns, with longer distances separating them. In the latter case the arterial connection type was presumed to provide additional value through offering the possibility of a fast connection on routes where the strength of e-bikes would offer competition to car and transit. The collector connection type was planned on links with a substantial bicycle volume that were not already arterial connections. The arterial and collector connection types would form a grid with a mesh size roughly between 500 and 1,000 yd.

Comparison of the present bicycle network and estimated demand. Identification of links with high demand (red) but not part of the bicycle network (no dots).
As visible in Figure 5, of the proposed 79 mi of class A network and 117 mi of class B network, around 28 mi already exist in some form in the present main bicycle network. This means 45% of the existing main bicycle network will be transformed into class A and B links. The other 55% of the existing main bicycle network will be left as class C, mainly connecting origins and destinations to the class A and B network. It is not known whether the links in the existing main bicycle network will keep up with the respective standards for class A and B where applicable. This evaluation is outside the scope of this research.

Bicycle network redesign. Solid links are existing links in the current main bicycle network. Dotted links are to be added to the network.
Discussion and Outlook
This paper discussed a quantitative methodological approach for regional bicycle network evaluation and planning despite limited data sources. This methodology is built on a simplified multimodal aggregate travel demand model. Instead of evaluating the effects of proposed measures, this method works the other way around. A desired modal share for cycling is set, and the necessary measures at a network level to achieve this modal share are the result.
Given the results, we can conclude that an aggregated tour or activity-based demand model for bicycle transportation can support a quantitative method to evaluate and plan a bicycle network. The improvement of spatial and network detail, as recommended by an AASHTO publication concerned with the “Evaluation of Walk and Bicycle Demand Modeling Practice” ( 3 ), as implemented in the model, provides a higher level of detail in the estimation of bicycle travel demand, while not demanding high efforts to implement. These improvements, even when implemented in a simplified way, enable better demand estimation for cycling. This could serve the support of other policy decision-making processes, for example the planning of bike-sharing schemes.
Good reference data is a key factor in building any model. If we are not aware of the real situation we can never evaluate whether the model delivers an acceptable performance or not. Although we were not able to validate our bicycle assignment, we were still able to use the valid parts of the tour generation as well as trip distribution and mode choice for our analyses. In demand modeling, a lot of value is already created in the estimation of the OD matrices themselves, especially if the model adopts “microzoning.”
What we did not look into, but might be an additional advantage of “microzoning,” is a detailed analysis of the zone domestic trips. This analysis might provide information as to whether there are a lot of pedestrian and short cycling domestic trips in the zone or not. Based on this information, sidewalks and bicycle infrastructure in this area can be dimensioned accordingly without the direct need to know which links exactly are affected.
The possibilities of agent-based models are impressive but, in many metropolitan planning regions the necessary data for such models, especially for walking and cycling, are not available. Until travel data availability improves in these planning regions, aggregated tour and activity-based models can offer quantitative data and analysis possibilities for cycling, despite the limited data sources.
Footnotes
Author Contributions
The authors confirm contributions to the paper as follows: study conception and design: Alex van Dulmen, Martin Fellendorf; data collection: Alex van Dulmen; analysis and interpretation of results: Alex van Dulmen, Martin Fellendorf; draft manuscript preparation: Alex van Dulmen, Martin Fellendorf. All authors reviewed the results and approved the final version of the manuscript.
Declaration of Conflicting Interests
The author(s) declared no potential conflicts of interest with respect to the research, authorship, and/or publication of this article.
Funding
The author(s) disclosed receipt of the following financial support for the research, authorship, and/or publication of this article: This research was partly supported by the Austrian Ministry of Climate Action within the Mobility of the Future research program (FFG Grant-No.: 885034). Further support by the Styrian Department of Transport and Construction as well as the Urban Mobility Lab Graz is gratefully acknowledged.
