



Abstract
Single-point diamond interchanges and tight diamond interchanges are two alternative interchange types that are considered in urban areas where right-of-way is usually limited. The Highway Safety Manual First Edition predictive methods for freeways and interchanges are capable of estimating the safety performance of freeway mainline, freeway-ramp terminal, and ramp proper segments associated with these interchange types. However, limited research has been conducted to predict and compare the safety performance of the crossroad ramp terminals for these two alternative interchange designs, as would be necessary for a performance-based approach to interchange alternatives analysis. Planners, designers, and safety managers would benefit from having tools to compare the safety performance of these crossroad ramp terminals to make more informed decisions about their use and application in the urban environment. Research was undertaken with the objective of developing new intersection crash prediction models for crossroad ramp terminals at single-point diamond interchanges and crossroad ramp terminals at tight diamond interchanges. In general, it was found that the crash prediction models for crossroad ramp terminals at single-point diamond interchanges predicted more crashes than the models for crossroad ramp terminals at tight diamond interchanges in higher volume conditions. The differences were primarily driven by the property-damage-only crash predictions. Comparisons of the crash prediction models suggested that the two sets of models appear compatible and provide reasonable results over the range of applicable traffic volume conditions.
Single-point diamond interchanges and tight diamond interchanges, shown in Figure 1, are two alternative interchange types that are considered in urban areas where right-of-way is usually limited. The Highway Safety Manual (HSM) predictive methods for freeways and interchanges are capable of estimating the safety performance of freeway mainline, freeway-ramp terminal, and ramp proper segments associated with these interchange types ( 1 ). However, limited research has been conducted to compare the safety performance of the crossroad ramp terminals for these two alternative interchange designs, as would be necessary for a performance-based approach to interchange alternatives analysis. Bared et al. evaluated the safety performance of these two interchange designs by comparing intersection-related crashes on the crossroad only ( 2 ). Using data to build negative binomial regression models to predict total crashes and fatal-and-injury (FI) crashes based on the off-ramp flow, crossroad flow, and separation distance between left and right ramp terminals, the safety comparison did not reveal a significant difference between the two types of interchanges for total crashes (i.e., all types and severities). However, single-point diamond interchanges were found to predict fewer crashes than tight diamond interchanges when comparing FI crashes.

Single-point and tight diamond interchange configurations ( 3 ).
The authors are unaware of any other safety performance evaluations of these ramp terminal types; single-point diamond interchanges have appeared on the “Most Wanted List” of Federal Highway Administration’s (FHWA’s) Crash Modification Factor Clearinghouse. Planners, designers, and safety managers would benefit from having tools to compare the safety performance of single-point and tight diamond crossroad ramp terminals to make more informed decisions about their use and application in the urban environment.
The National Cooperative Highway Research Program (NCHRP) sponsored research to expand the crash prediction methods for intersections in the HSM ( 1 ). As part of this effort, research was undertaken with the objective of developing new intersection crash predictive models for the following site types:
Crossroad ramp terminals at single-point diamond interchanges; and
Crossroad ramp terminals at tight diamond interchanges.
This paper presents details about the development of these two sets of crash prediction models. The paper also compares the predicted safety performance of crossroad ramp terminals at single-point and tight diamond interchanges based on the models. This research will support performance-based approaches to interchange alternatives analysis as well as network screening to identify sites with potential for safety improvement. For additional details from this research, refer to Torbic et al. ( 4 ).
Characteristics of Single-Point and Tight Diamond Interchanges
The single-point diamond interchange was developed in 1970 to improve traffic capacity and operations while requiring less right-of-way than a conventional diamond interchange ( 3 ). At single-point diamond interchanges, the turning movements of the major road ramps and all the movements of the minor road are executed in one central area on the overpass or underpass. Key design characteristics that need to be considered include the skew angle; the number of through, left-, and right-turn lanes; median width; and islands. The bridge of a single-point diamond interchange typically spans from 160 to 280 ft depending on the geometrics of the crossing. The crossroad ramp terminals at a single-point diamond interchange operate as a single signalized intersection, and typically the signal control can operate with three or four phases. Single-point diamond interchanges can increase capacity and accommodate more vehicles compared with a conventional or compressed diamond interchange owing to challenges associated with signal coordination on the latter options.
At tight diamond interchanges, crossroad ramp terminals are characterized by two at-grade signalized intersections spaced between 200 and 400 ft apart, through which all at-grade traffic movements are made ( 3 , 5 , 6 ). An additional characteristic of the tight diamond interchange is exclusive left-turn lanes in advance of the upstream ramp terminal, for movements from the crossroad to the freeway ( 5 ). Generally, the bridge design of a tight diamond interchange spans between 140 and 180 ft depending on the geometrics of the crossing ( 3 ). The key operational aspect of a tight diamond interchange is signal coordination to realize efficient progression of traffic and minimum storage of vehicles between the terminals. Typically, a tight diamond interchange requires a four-phase signal with overlapping phasing for both intersections. Other traffic flow parameters like saturation flow rate, clearance times, and turning speeds at a tight diamond interchange are the same as a conventional at-grade intersection.
Development of Crash Prediction Models for Single-Point and Tight Diamond Interchanges
This section describes the development of crash prediction models for crossroad ramp terminals at single-point and tight diamond interchanges. For each interchange type, the descriptions include the site selection and data collection processes for developing the crash prediction models for the crossroad ramp terminals, descriptive statistics of the databases used for model development, and the statistical analysis and resulting safety performance functions (SPFs) for the crossroad ramp terminals.
Single-Point Diamond Interchange
Site Selection and Data Collection
A list of potential single-point diamond interchanges was developed by searching databases and satellite imagery in five states: Arizona, Missouri, Nevada, Tennessee, and Utah. These states were selected based on their use of single-point diamond interchanges and prior knowledge of data. Data collection activities for these sites included gathering geometric attributes of the interchanges as well as traffic and crash data. Geometric attributes were collected from aerial imagery in Google Earth®, as well as Google Street View®. Table 1 lists the geometric attributes collected at each single-point diamond interchange. Traffic data collection activities primarily involved accessing publicly available traffic volumes and statistics, and crash data were obtained directly from the state departments of transportation (DOTs).
Site Characteristic Variables Collected for Crossroad Ramp Terminals at Single-Point Diamond Interchanges (4)

Identifying crashes associated with the ramp terminal required a clear definition of a ramp terminal-related crash based on geographic location and crash attributes. Crashes were assigned to the ramp terminal using the following criteria:
Crashes occurring on the crossroad within the ramp terminal boundary, defined as a point 100 ft from the gore or curb return of the outermost ramp connection, and having one of the following attributes: - at intersection, - intersection-related, - at driveway, - driveway-related, or - involving a pedestrian or bicyclist.
Crashes occurring on a ramp with at least one of the following attributes: - at intersection, - intersection-related, - involving a pedestrian or bicyclist, or - located on an exit ramp and manner of collision is rear-end.
This definition departs slightly from the ramp terminal definition used in the HSM with regard to a different distance reference to define the crossroad ramp terminal boundary. The HSM uses 250 ft from the crossroad ramp terminal to define crossroad ramp terminal crashes, measured from the center of the crossroad ramp terminal. The definition implemented for crossroad ramp terminals of single-point diamond interchanges is based on the American National Standards Institute (ANSI) D16.1-2007 (Manual on Classification of Motor Vehicle Traffic Accidents) definition of an interchange crash ( 7 ). According to the ANSI definition, an interchange crash is a crash in which the first harmful event occurs within a boundary defined by a point 100 ft from the gore or curb return of the outermost ramp connection. Figure 2 illustrates the boundaries for defining ramp terminal crashes at a single-point diamond interchange.

Single-point diamond interchange ramp terminal boundaries for defining ramp terminal crashes ( 4 ).
This definition of ramp terminal boundary was necessary owing to the size of a typical crossroad ramp terminal at a single-point diamond interchange and its main characteristic of operating as one intersection. Figure 3 shows an example of a single-point diamond interchange with a crossroad terminal of size and length approximately equal to the average of terminal sizes and lengths of sites where data were collected for this research. At this location, the maximum distance between the center of the interchange and the outermost ramp connection is approximately 330 ft, more than the 250 ft used in the HSM definition. Therefore, using the 250 ft boundary would result in missing crashes associated with right-turn movements at the entrance and exit ramps. It would also result in missing part of the longer left-turn lanes on the cross street that are common to crossroad ramp terminals at single-point diamond interchanges. The ramp terminal boundary that is based on the ANSI definition and implemented in this research extends 100 ft beyond the outermost ramp connections, capturing crashes associated with the right-turn movements and the left-turn lanes.

Example of a single-point diamond interchange with the implemented ramp terminal boundary identified along the crossroad.
All of the collected data (i.e., site characteristics, crashes, and traffic volumes) were assembled into one database for the purposes of model development. After initial database development and further quality control assessments including a review of crash data accuracy, 49 interchanges in Arizona and Utah were selected for model development, 7 of which included frontage roads.
Descriptive Statistics of Database
The following bullets provide descriptive statistics for key variables of interest for model development from Table 1:
Terminal length (measured along crossroad) - Min. = 605 ft, Max. = 1,236 ft, Mean = 829 ft
Number of through lanes on crossroad approaches - Min. = 1, Max. = 4, Mean = 2.53
Number of left-turn lanes - Exit (from freeway) and entrance (to freeway) movements: Min. = 1, Max. = 3, Mean = 1.94
Number of right-turn lanes - Entrance (to freeway) movements: Min. = 1, Max. = 2, Mean = 1.05 - Exit (from freeway) movements: Min. = 1, Max. = 2, Mean = 1.43 - All movements: Min. = 1, Max. = 2, Mean = 1.24
Traffic control type for right turns - To entrance ramp: • Both signalized (frontage roads): 7 sites • Both no control: 42 sites - From exit ramp • Both signalized: 19 sites • Both yield control: 19 sites • Both no control (free-flow right): 2 sites • 1 signalized, 1 stop control: 3 sites • 1 signalized, 1 yield control: 1 site • 1 stop control, 1 yield control: 1 site • 1 signalized, 1 no control: 1 site • 1 stop control, 1 no control: 1 site • 1 yield control, 1 no control: 1 site
Traffic volumes and crash data from years 2011 through 2015 were used for analysis. Traffic volumes ranged from 13,445 to 70,790 vehicles per day (vpd) on the crossroad and the sum of traffic volumes for all four ramps ranged from 14,069 to 80,030 vpd. Table 2 summarizes the crash data for all, single-vehicle, multiple-vehicle, pedestrian, and bicycle crashes by crash severity and by state for the study period.
All Crashes Combined, Single- and Multiple-Vehicle, and Pedestrian and Bicycle Crash Counts by Crash Severity—Single-Point Diamond Interchange Crossroad Ramp Terminals ( 4 )

Note: FI = fatal-and-injury crashes; PDO = property-damage-only crashes; AZ = Arizona; UT = Utah.
Model Development
SPFs for the crossroad ramp terminal of a single-point diamond interchange took the general form of Equation 1:

where
Nspfint = predicted average crash frequency of a crossroad ramp terminal at a single-point diamond interchange (crashes/year);
AADTxrd = annual average daily traffic (AADT) on the crossroad (vpd);
AADTramp = sum of ramp AADTs (vpd);
exit_free_right = number of exit ramps with free-flow right turns (0, 1, or 2); and
a, b, c, and d = estimated regression coefficients.
All SPFs were developed using negative binomial regression with sites from both states combined into one dataset following individual state-by-state testing. Based on a review of the number of states, sites, site-years, and crashes for the database assembled, data for all sites were used for model development to maximize the sample size rather than using a portion of the data for model development and a portion for model validation. STATA 12.1 was used for modeling. The data were modeled with all years for a site combined as one observation, with the number of years used as an offset variable in the regression model. The researchers tried various combinations of ramp traffic volume; however, the aggregated ramp volume showed the strongest statistical correlation with crash frequency. The final SPFs based on Equation 1 for crossroad ramp terminals at single-point diamond interchanges are shown in Table 3. The SPFs in Table 3 predict the average crash frequency at the crossroad ramp terminal for all crash types combined (i.e., multiple-vehicle, single-vehicle, pedestrian, and bicyclist) for total, FI, and property-damage-only (PDO) severity levels.
SPF Coefficients for Crossroad Ramp Terminals at Single-Point Diamond Interchanges (Based on Equation 1) ( 4 )

Note: Base Conditions: 0, 1, and 2 are valid values for the number of exit ramps with free-flow right turns to the crossroad. There are no additional base conditions. AADTxrd = annual average daily traffic (AADT) on the crossroad; AADTramp = sum of ramp AADTs; exit_free_right = number of exit ramps with free-flow right turns; PR > F is the p-value associated with the F statistic; na = not applicable.
Multiple models were tested considering the effects of different geometric attributes, including the interchange length, number of turn lanes (right and left), number of through lanes, and number of approaches with a particular right-turn control type. Only the right-turn control type was found to have a statistically significant effect. Rather than presenting the free-flow right-turn effects as crash modification factors, separate SPFs were developed in the form of Equation 2 based on the number of exit ramps with free-flow right turns to the crossroad—0, 1, or 2. The final adjusted values for the estimated parameters are presented in Table 4. There are no additional base conditions for the SPFs.

SPF Coefficients for Crossroad Ramp Terminals at Single-Point Diamond Interchanges (Based on Equation 2) ( 4 )

Note: There are no additional base conditions.
Tight Diamond Interchanges
Site Selection and Data Collection
A list of potential tight diamond interchanges was developed by searching databases and satellite imagery in six states: Arizona, California, Florida, Minnesota, Ohio, and Utah. As with the single-point data collection, these states were also selected based on their use of tight diamond interchanges and prior knowledge of data. Data collection activities included gathering geometric attributes of the interchanges as well as traffic and crash data. Geometric attributes were collected from aerial imagery in Google Earth®, as well as Google Street View®. Table 5 lists the geometric attributes collected for each tight diamond interchange. Traffic data collection activities primarily involved accessing publicly available traffic volumes and statistics, and crash data were obtained directly from the state DOTs.
Site Characteristic Variables Collected for Crossroad Ramp Terminals at Tight Diamond Interchanges ( 4 )

Identifying crashes associated with the ramp terminal required a clear definition of a ramp terminal-related crash based on geographic location and crash attributes. To maintain consistency, crashes were assigned to the ramp terminal at tight diamond interchanges using the same criteria as for single-point diamond interchanges as follows:
Crashes occurring on the crossroad within the ramp terminal boundary, defined as a point 100 ft from the gore or curb return of the outermost ramp connection, and having one of the following attributes: - at intersection, - intersection-related, - at driveway, - driveway-related, or - involving a pedestrian or bicyclist.
Crashes occurring on a ramp with at least one of the following attributes: - at intersection, - intersection-related, - involving a pedestrian or bicyclist, or - located on an exit ramp and manner of collision is rear-end.
Again, this definition departs slightly from the ramp terminal definition used in the HSM, using a different distance to define the crossroad ramp terminal boundary, and is based on the ANSI D16.1-2007 (Manual on Classification of Motor Vehicle Traffic Accidents) definition of an interchange crash. Figure 4 shows an example of a tight diamond interchange with the boundaries for identifying interchange-related crashes. Crossroad crashes were identified using the short-dashed boundary, whereas ramp crashes were identified using the long-dashed boundaries.
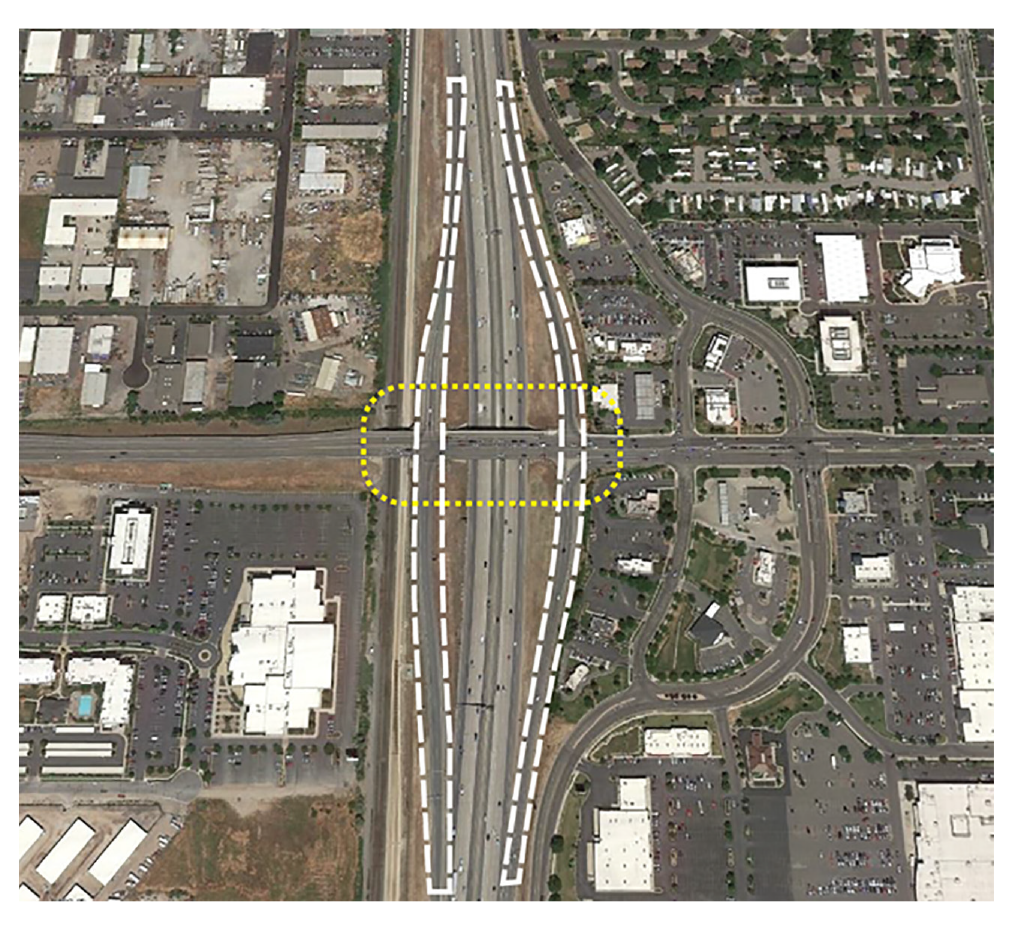
Sample of a tight diamond interchange with the ramp boundaries definition.
All of the collected data (i.e., site characteristics, crashes, and traffic volumes) were assembled into one database for the purposes of model development. After initial database development and further quality control assessments including a review of crash data accuracy, 51 interchanges in Arizona and Utah were selected for model development, 19 of which included frontage roads.
Descriptive Statistics of Database
The following bullet points provide descriptive statistics for key variables of interest for model development from Table 5:
Distance between terminals - Min. = 174.5 ft, Max. = 387 ft, Mean = 307.9 ft
Number of through lanes on crossroad approaches - Min. = 1, Max. = 4, Mean = 2.20
Number of left-turn lanes - Exit (from freeway) and entrance (to freeway) movements: Min. = 0, Max. = 2, Mean = 1.30
Number of right-turn lanes - Entrance (to freeway) movements: Min. = 0, Max. = 2, Mean = 0.82 - Exit (from freeway) movements: Min. = 0, Max. = 2, Mean = 1.05 - All movements: Min. = 0, Max. = 2, Mean = 0.94
Traffic control type for right turns - To entrance ramp: • Both signalized: 47 sites • Both yield control: 1 site • 1 signalized, 1 no control (free-flow right): 2 sites • 1 yield, 1 no control: 1 site - From exit ramp • Both signalized: 44 sites • Both yield control: 3 sites • 1 signalized, 1 no control: 3 sites • 1 yield control, 1 no control: 1 site
Traffic volumes and crash data from years 2011 through 2015 were used for analysis. Traffic volumes ranged from 8,921 to 51,438 vpd on the crossroad and the sum of traffic volumes for all four ramps ranged from 9,955 to 74,656 vpd. Table 6 summarizes the crash data for all, single-vehicle, multiple-vehicle, pedestrian, and bicycle crashes by crash severity and by state for the study period.
All Crashes Combined, Single- and Multiple-Vehicle, and Pedestrian and Bicycle Crash Counts by Crash Severity—Tight Diamond Interchange Crossroad Ramp Terminals ( 4 )

Note: FI = fatal-and-injury crashes; PDO = property-damage-only crashes; AZ = Arizona; UT = Utah.
Model Development
SPFs for the crossroad ramp terminal of a tight diamond interchange took the form of Equation 2. The SPFs were developed using negative binomial regression with sites from both states combined into one dataset following individual state-by-state testing. Data for all sites were used for model development to maximize the sample size rather than using a portion of the data for model development and a portion for model validation. STATA 14 was used for modeling. The data were modeled with all years for a site combined as one observation, with the number of years used as an offset variable in the regression model. The final SPFs for crossroad ramp terminals at tight diamond interchanges are shown in Table 7. The SPFs in Table 7 predict the average crash frequency at the crossroad ramp terminal for all crash types combined (i.e., multiple-vehicle, single-vehicle, pedestrian, and bicyclist) for total, FI, and PDO severity levels.
SPF Coefficients for Tight Diamond Interchange Crossroad Ramp Terminals ( 4 )

Note: No base conditions. AADTxrd = annual average daily traffic (AADT) on the crossroad; AADTramp = sum of ramp AADTs; PR > F is the p-value associated with the F statistic; na = not applicable.
Before finalizing the models in Table 7, multiple models were developed testing other variables, including geometric attributes, individual ramp volumes, and traffic volume ratios. However, none of the parameters associated with the tested variables were statistically significant in the models. The only statistically significant variables, which were included in the final models, were the crossroad and ramp AADTs.
Comparison of Results
Following the development of the crash prediction models for crossroad ramp terminals at single-point and tight diamond interchanges, compatibility testing of the new models was conducted to confirm that the new models provided reasonable results over a broad range of input conditions and that the new models integrated with existing intersection crash prediction models in the first edition of the HSM. Graphical representations of the crash prediction models (available in Torbic et al. [ 4 ]) were reviewed to gain a sense of the reasonableness of the new models. Nothing from this review suggested that the models provided unreasonable results. In addition, Figures 5 to 7 were created to compare the crash prediction models for crossroad ramp terminals at single-point and tight diamond interchanges. This comparison is valid given both sets of models were developed using data from the same states. For the comparison, it was assumed that there were no free-flow right turns from the exit ramps to the crossroads at the single-point diamond interchanges. In these figures, “TD Ramp AADT” refers to the AADT on tight diamond interchange ramps, and “SP Ramp AADT” refers to the AADT on the single-point interchange ramps.
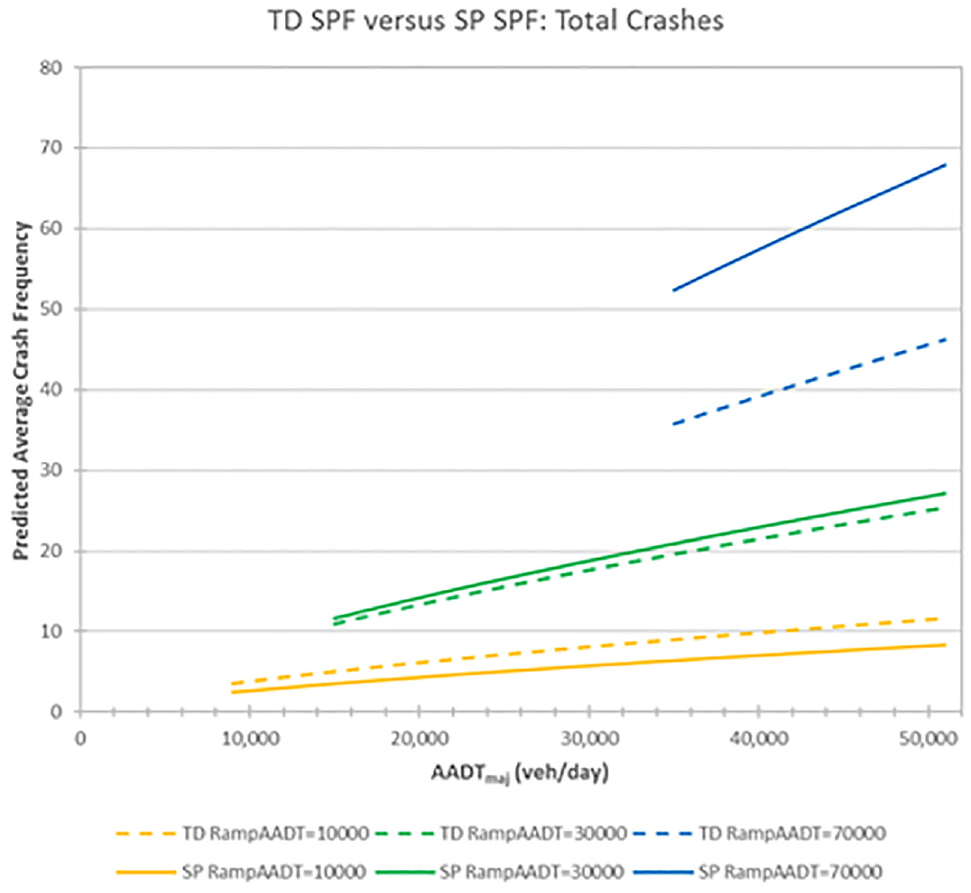
Comparison of crash prediction models for total crashes at crossroad ramp terminals at tight diamond interchanges and single-point diamond interchanges ( 4 ).
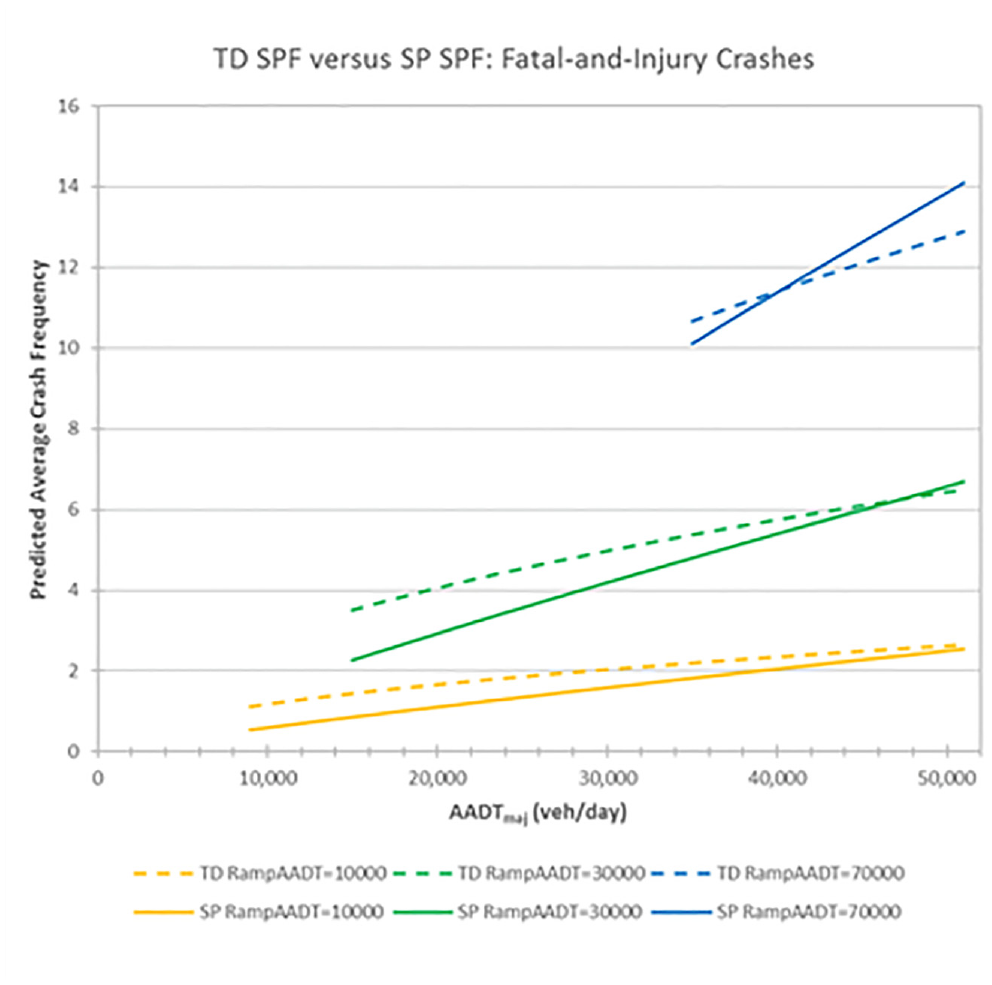
Comparison of crash prediction models for fatal-and-injury crashes at crossroad ramp terminals at tight diamond interchanges and single-point diamond interchanges ( 4 ).
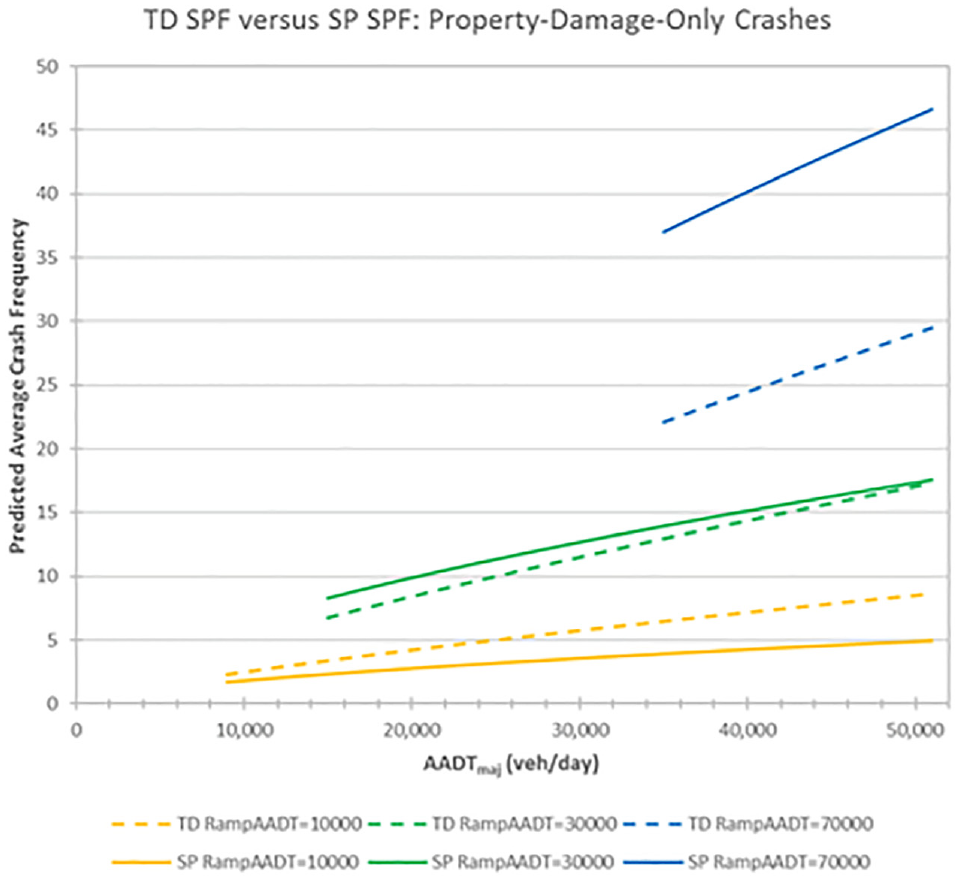
Comparison of crash prediction models for property-damage-only crashes at crossroad ramp terminals at tight diamond interchanges and single-point diamond interchanges ( 4 ).
In general, it was found that the SPFs for crossroad ramp terminals at single-point diamond interchanges predicted more crashes than the SPFs for crossroad ramp terminals at tight diamond interchanges in higher ramp volume conditions, and the differences were primarily driven by the PDO model predictions. The comparisons showed that the two sets of models appeared compatible and provided reasonable results over the range of applicable traffic volume conditions. The figures do not display the general ranges of prediction error; therefore readers should not put too much emphasis on the relative positions of predicted average crash frequencies when predictions are close.
Severity and Crash Type Distributions
Development of severity distribution functions (SDFs) was also explored for both single-point and tight diamond interchanges. The database used to explore SDFs consisted of the same crashes and crossroad ramp terminals as the database used to estimate the SPFs but was restructured so that the basic observation unit (i.e., database row) was a crash instead of a ramp terminal. Both binary and multinomial logistic regression modeling were used for model development. No traffic or geometric variables showed consistent, interpretable, and statistically significant effects in the SDFs for crossroad ramp terminals at either single-point or tight diamond interchanges. The predictive methods therefore utilize distributions for crash severity and crash type for both the single-point and tight diamond interchange crossroad ramp terminals, as shown in Tables 8 to 11.
Distributions for Crash Severity Level at Crossroad Ramp Terminals at Single-Point Diamond Interchanges ( 4 )

Note: FI = fatal-and-injury crashes; na = not applicable.
Distributions for Collision Type and Manner of Collision at Crossroad Ramp Terminals at Single-Point Diamond Interchanges ( 4 )

Note: FI = fatal-and-injury crashes; PDO = property-damage-only crashes.
Distributions for Crash Severity Level at Tight Diamond Interchange Crossroad Ramp Terminals ( 4 )

Note: FI = fatal-and-injury crashes; na = not applicable.
Distributions for Collision Type and Manner of Collision at Tight Diamond Interchange Crossroad Ramp Terminals ( 4 )

Note: FI = fatal-and-injury crashes; PDO = property-damage-only crashes.
Conclusions
Crash prediction models were developed for single-point diamond interchange crossroad ramp terminals and tight diamond interchange crossroad ramp terminals to expand the intersection models in the second edition of the HSM and inform performance-based approaches to interchange alternatives analysis and safety management. SPFs were developed to be generally consistent with the other intersection methodologies in the HSM, but there was a need to define the crossroad ramp terminal boundaries differently than other crossroad ramp terminals in the HSM to capture the operational characteristics and features of single-point and tight diamond interchanges.
SPFs for single-point diamond interchange, crossroad ramp terminals contain crossroad and ramp AADT. Different single-point SPFs were provided for different numbers of free-flow right turns from the exit ramp to the crossroad. According to the SPFs developed, increases in crossroad and ramp AADT were associated with increases in the total number of ramp terminal crashes, with ramp AADT typically having a larger effect than crossroad AADT. In addition, the inclusion of free-flow right turns was associated with fewer crashes at single-point diamond interchanges.
The SPFs for tight diamond interchange crossroad ramp terminals also included variables for crossroad and ramp AADT. No geometric attributes were statistically significant in the tight diamond interchange crossroad ramp terminal models. As ramp and crossroad AADT increased, crash frequency increased. Generally, ramp AADT increased crashes at a larger magnitude than crossroad AADT, except for PDO crashes, for which the relative effect is reversed. Seven of the single-point and 19 of the tight diamond crossroad ramp terminal sites had frontage roads. Although terminals with frontage roads have different physical and operational characteristics, testing of indicator variables to represent frontage road presence did not show any statistically significant differences in crossroad ramp terminal crashes with or without frontage roads. The authors do not consider this finding conclusive without additional research that is able to consider the volumes of specific movements, a key detail that most intersection methods to not yet address.
These SPFs will allow planners and engineers to quantify safety performance for these two alternative crossroad ramp terminal types. Comparisons showed that the two sets of models appeared compatible and provided reasonable results over the range of applicable traffic volume conditions. When comparing crash prediction of single-point diamond and tight diamond interchange crossroad ramp terminals, one crossroad ramp terminal type did not conclusively outperform the other from a safety performance perspective. The relative safety performance of the crossroad ramp terminals was dependent on AADT and severity type, as shown in Figures 5 to 7. These plots showed that, under most conditions, the difference in predicted crash frequency was rarely more than a few crashes. However, under high-volume conditions, the single-point diamond interchange crossroad ramp terminal models predicted a higher PDO crash frequency than the respective tight diamond interchange models. A complete set of comparisons would also incorporate the freeway-ramp terminal and ramp proper models from the freeway and interchange methods of the HSM.
Development of SDFs for these two ramp terminal types was explored for potential use in combination with the SPFs to estimate crash severity as a function of geometric design elements and traffic control features. Owing to challenges and inconsistencies in developing and interpreting the SDFs, it was recommended for the second edition of the HSM that crash severity for the new crossroad ramp terminal configurations be addressed in a manner consistent with existing methods in Chapters 10, 11, and 12 of the first edition of the HSM, without the use of SDFs. Future research should continue to explore the most promising approaches for addressing crash severity in the HSM predictive methods.
Agencies seeking to apply the models in this paper should calibrate the models using the calibration procedures outlined in the HSM. This includes SPF calibration, and agency-specific development of crash type and severity distributions.
Footnotes
Acknowledgements
The research reported here was performed under NCHRP Project 17-68, “Intersection Crash Prediction Methods for the Highway Safety Manual.” Mark Bush was the NCHRP senior program officer for this project. The authors wish to thank the state departments of transportation of Arizona and Utah for their assistance in providing data for the development of the crash prediction models for crossroad ramp terminals at single-point and tight diamond interchanges. The authors would also like to thank Juan Medina and Jeffrey Taylor of the University of Utah for their key roles in collecting data and developing the single-point diamond interchange models. For additional details from this research, refer to Torbic et al. ( 4 ).
Author Contributions
The authors confirm contribution to the paper as follows: study conception and design: R. Porter, D. Torbic, D. Cook; data collection: R. Porter, J. Gooch, K. Kersavage; analysis and interpretation of results: R. Porter, J. Gooch, K. Kersavage; draft manuscript preparation: D. Torbic, R. Porter. All authors reviewed the results and approved the final version of the manuscript.
Declaration of Conflicting Interests
The author(s) declared no potential conflicts of interest with respect to the research, authorship, and/or publication of this article.
Funding
The author(s) received no financial support for the research, authorship, and/or publication of this article.
