
Abstract
The United States experienced a 53% increase in pedestrian fatalities between 2009 and 2018, with 2018 having a 3.4% increase from 2017. Of the 2018 pedestrian fatalities with known lighting conditions, 76% occurred in dark/nighttime conditions, with 50% occurring between 6:00 and 11:59 p.m. Despite past research exploring several contributing characteristics for nighttime pedestrian crashes, there is limited research that investigates the spatial aspects of land use attributes and sociodemographic factors. Have these nighttime pedestrian collisions been concentrated in certain land uses? Could an establishment with the capacity to serve alcohol invoke a greater risk of pedestrian crashes? Does sociodemographic status correlate with clustering for fatal crashes, severe crashes, or both? To better understand the spatial characteristics of the recent increase in pedestrian collisions, we analyzed crash data from Albuquerque, New Mexico for pedestrian fatalities and severe injuries from 2013 to 2018 relative to lighting condition, land use (with a focus on alcohol establishments), and race/ethnicity on the block group level. We used confidence intervals and Getis-Ord Gi* statistics to verify the statistical integrity of the trends. Findings suggested that pedestrian fatality and severe injury rates were higher within a quarter mile of bars at night and in areas with elevated concentrations of minority populations. Pedestrian fatality and severe injury hot spots appeared to have higher percentages of non-white residents, coupled with lower sidewalk coverage and more arterials or collectors.
According to Fatality Analysis Reporting System (FARS) data, 6,283 pedestrians were killed in traffic collisions in the United States in 2018, averaging one death every 84 min. This marks the highest number of U.S. pedestrian deaths since 1990. Pedestrian fatalities experienced an especially marked increase between 2009 and 2018, with a 56% increase in pedestrian fatalities during this time and a 3.4% increase between 2017 and 2018 alone. Although there has been a significant increase in pedestrian fatalities, the increase is unevenly distributed by lighting condition. Of the additional 2,143 pedestrians killed with known lighting conditions in 2018 versus 2009, 1,900 (88.7%) occurred at night (Figure 1). There was relatively little change in daylight or dawn/dusk fatalities over this time. For the sake of this study, “dark” and “night” are used interchangeably and are taken to mean at night either with or without street lighting.
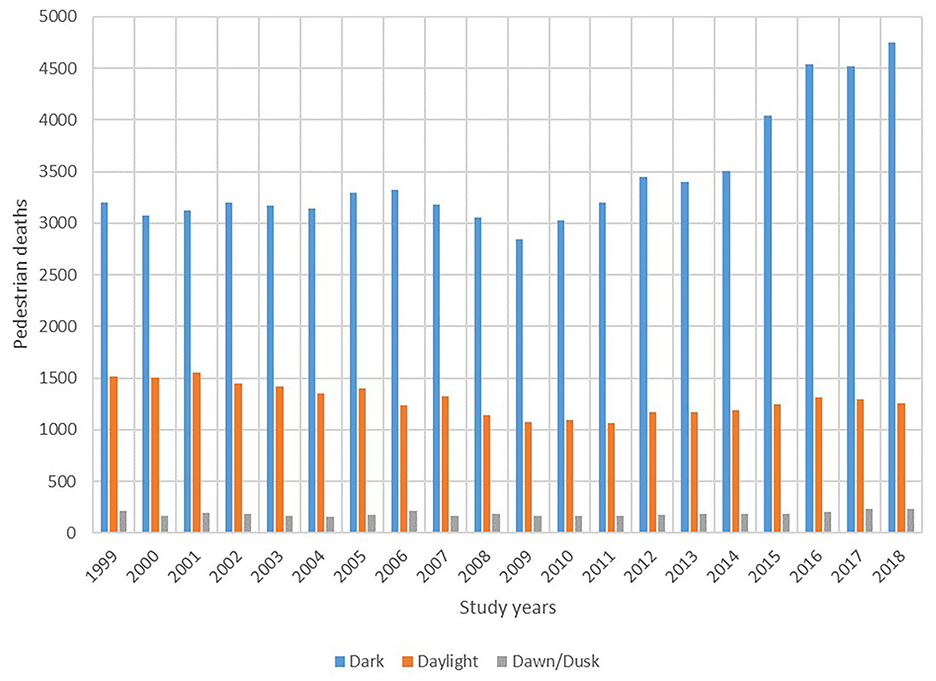
Pedestrian fatalities in the United States by lighting condition. (Source: Fatality Analysis Reporting System.)
Although this increase in nighttime pedestrian fatalities is alarming, more research is needed to further illuminate the relationship between dark lighting conditions and pedestrian safety. Prior research has identified statistical correlations between pedestrian injury and lighting conditions but has provided little analysis of spatial relationships. Geostatistical analysis based on land use and sociodemographic factors would render a better understanding of pedestrian collisions. Have these trends been concentrated in commercial or residential areas? Could an establishment with the capacity to serve alcohol invoke a greater risk of pedestrian crashes? Does sociodemographic status correlate with clustering for fatal crashes, severe crashes, or both?
To address the above research questions, we examined pedestrian fatalities and severe injuries that occurred in Albuquerque (also referred to as ABQ), New Mexico (NM) between 2013 and 2018. We focused on pedestrian fatalities and severe injuries – as opposed to minor injuries – because they are the costliest severities and are frequently the focus of traffic safety research and initiatives such as Vision Zero ( 1 ). New Mexico Department of Transportation (NMDOT) has a comprehensive statewide uniform crash report database divided into three levels of data (crash, vehicle, and person) allowing for a comprehensive analysis. We conducted spatial analyses in ArcGIS to identify the association between lighting condition, land use, sociodemographic status, and fatal and severe pedestrian crashes. For land use, we focused on residential, commercial, and alcohol service establishments. We used population as a proxy for exposure and derived fatal and severe injury rates within 0.25-mi analysis zones of the land uses. We also performed clustering analyses to understand the relationship between pedestrian crashes and factors associated with our spatial analyses. With recent attention on nighttime pedestrian safety, a better understanding of the spatial characteristics of pedestrian fatal and severe injuries will further illuminate this troubling trend.
Background
Past research has explored pedestrian safety according to contributing factors, countermeasures, and participant characteristics. Relatively little research has focused on the spatial characteristics or sociodemographic factors of these safety outcomes, especially for nighttime pedestrian crashes. Prior studies show that lighting condition is significantly correlated with pedestrian safety outcomes (2–6). Jensen used pedestrian casualty data from police-reported incidents to identify that in dense urban areas, a pedestrian injury is 2.7 times more likely to occur at night compared with daylight ( 7 ). Jensen’s study was reaffirmed by a study conducted in Florida in which the results noted that the odds of a fatal injury in daylight were 75% lower at midblock locations and 83% lower at intersections than the odds in darkness with no road lighting ( 3 ). A summary of injury odds relative to lighting condition found that the risk of pedestrian injuries and fatalities increased more in darkness than the odds for other types of motor vehicle collisions ( 8 ). Several other studies have also shown that dark conditions are more likely to lead to severe or fatal injury compared with daylight ( 4 , 6 , 9 ). Although these studies identify lighting condition as an important factor, the analyses do not explain where risk is highest spatially in relation to land use and sociodemographic characteristics. Several of the above studies also utilized data from before the recent increase in pedestrian fatalities, meaning that they may not reflect the trend from 2009 to 2018.
Whereas research continues to explore the potential reasons for nighttime crashes, there remains little explanation as to why the trend continues to increase. Past research has found connections between nighttime crashes and the users and vehicles involved ( 10 ). For instance, research shows that younger drivers pose a higher risk of nighttime crashes because they drive more at night ( 11 ). This is further supported by a significant body of research that focused primarily on the inexperience of younger drivers (12–17). Although these studies provide insight into nighttime crashes, there is a substantial knowledge gap as to where these collisions are occurring and the connection to geospatial features. Overlaying an understanding of the spatial characteristics of nighttime crashes may further enhance our ability to improve problem areas.
In addition to the relationship with younger drivers, alcohol involvement remains a key trait to consider when exploring pedestrian collisions. According to the National Highway Traffic Safety Administration (NHTSA), 47.4% of pedestrian fatalities involved either a driver, pedestrian, or both driver and pedestrian under the influence of alcohol in 2017: only the pedestrian was under the influence for 27.2% of pedestrian fatalities, only the driver for 11.1%, and both the pedestrian and driver for 9.1% ( 18 ). In case-control studies, it was established that intoxication among pedestrians increased the likelihood that the pedestrian would be injured in a collision ( 9 ). Although the previous study suggests that consuming alcohol increases the odds of being injured, recent trends show that the percentage of fatally injured pedestrians with a high blood alcohol concentration (BAC) declined from 45% to 35% between 1982 and 2014. This suggests that although there is still an issue with intoxicated pedestrians, we may be making progress in reducing the prevalence or severity ( 19 ). In a study with a similar intention to this report, an analysis of the relationship between neighborhood characteristics and alcohol use showed elevated risk of alcohol-involved pedestrian crashes in areas with greater bar densities and where local populations reported drinking more alcohol per drinking occasion ( 20 , 21 ).
Previous studies have identified that certain factors related to sociodemographic characteristics and the physical environment of neighborhoods increase the risk of pedestrian crashes ( 22 , 23 ). Neighborhoods in Seattle that had higher proportions of Hispanic, non-Hispanic Black, and non-Hispanic Asian populations were found to have higher pedestrian collision rates ( 24 ). Similarly, research sponsored by NHTSA found that Black adults aged 25 and older, Hispanic adult males aged 15 and older, and Native American adults aged 15 and older were at a higher risk of being killed as an alcohol-intoxicated pedestrian than the population as a whole ( 25 ). Interestingly, Leaf and Preusser found the issue to be most acute in NM, with rates nearly twice as high as the state with the second highest rates ( 25 ). Spatial negative-binomial regression analysis of pedestrian casualties showed that lower-income areas have more pedestrian casualties and lower-income individuals are at greater risk ( 26 ). Furthermore, several physical attributes of low-income areas can be linked to higher probabilities of pedestrian crashes, such as a lack of playgrounds, close proximity to high-traffic areas, and hazardous walking connections to schools and other facilities (27–29). With these findings, a reasonable understanding can be formulated for overall pedestrian crashes. However, would these relationships still hold for nighttime crashes? Identifying the link between nighttime pedestrian crashes and sociodemographic characteristics would supply essential information for comprehending the trend of increasing pedestrian fatalities.
Although sociodemographic factors have been shown to correlate with injury severity for pedestrians, a thorough investigation into land use would further illuminate the recent deterioration in pedestrian safety. One study indicated that commercial and retail areas had higher levels of pedestrian fatalities than any other area within their respective cities ( 30 ). Higher population density has been linked with increased likelihood of pedestrian collisions, whereas the opposite is true for lower densities. ( 28 , 31 ). NHTSA reports that most alcohol-impaired pedestrians that are injured in motor vehicle collisions are taking short trips near the pedestrian’s home at the time of collision, suggesting that residential areas may be of interest ( 32 ). Other research has found a lower risk of pedestrian injury in mixed-use neighborhoods ( 33 ). Past research on land use and overall pedestrian safety provides several key factors that we consider in this study. However, it is still unclear where the recent nighttime pedestrian injuries have occurred. We therefore used the knowledge gained from the literature review to help guide our study and our approach to geospatial analysis.
Data
To understand the spatial characteristics of nighttime pedestrian safety, we examined fatal and severe pedestrian crashes that occurred in Albuquerque, NM between 2013 and 2018. Albuquerque is New Mexico’s largest city with approximately 540,000 residents and 916,000 residents in the metropolitan area. According to NMDOT data, 45.2% of New Mexico’s 2018 pedestrian fatalities occurred in Albuquerque, along with 25.1% of the state’s total fatal crashes and 43.1% of the state’s total injury crashes. Albuquerque and New Mexico consistently rank with some of the least safe cities and states for pedestrians in the country, and Albuquerque is a Federal Highway Administration (FHWA) Pedestrian Safety Focus City ( 34 ). Along with high crash rates, Albuquerque also has a wide range of sociodemographic characteristics and land uses, making it an ideal choice to analyze the growing trend of nighttime pedestrian crashes.
To investigate the relationship between nighttime pedestrian crashes and spatial factors, we utilized crash data managed by the University of New Mexico and NMDOT. We used data from between 2013 and 2018, the latest data available. Data were provided in GIS point shapefile format and were reported using a uniform crash report form with coded tracking numbers to ensure consistent data collection. The uniform crash report is designed to help officers systematically report on the elements of crashes. The system is designed to unify information extraction and comply with the standards set forth in the Model Minimum Uniform Crash Criteria (MMUCC) ( 35 ).
The database accounts for any crashes on a public roadway involving one or more motor vehicles that resulted in death, personal injury, or at least $500 in property damage. No accounts were kept on unreported crashes, crashes reported on private property, or near misses. The data were then categorized according to three subdivisions: crash-, vehicle-, and occupant-level.
We solely examined data for nighttime pedestrian crashes that resulted in either fatal or severe injuries. NMDOT defined a fatality as “crash-related if it occurs at the time of the crash or if the person(s) involved in the crash dies within 30 days” ( 35 ). NMDOT defines a severe injury as, “any injury other than fatal that results in severe laceration exposing tissue/muscle/organs, broken extremity, crush injuries, significant burns, unconsciousness when taken from crash scene, skull/chest/abdominal injury, or paralysis” ( 35 ). Both of these injury severity definitions are derived from NHTSA’s uniform federal definitions from the MMUCC ( 36 ). NMDOT also defines a pedestrian as “a person on foot, walking, running, jogging, hiking, sitting, or lying down who is involved in a motor vehicle traffic crash” ( 35 ).
Albuquerque’s boundary is based on the 2010 U.S. Census’ Urbanized Areas definition. Land use data were provided by the City of Albuquerque in polygon shapefile format. We used the city’s definition of residential (low-density and multifamily residential) and commercial (commercial retail) land uses for our analysis. Commercial land uses specifically included general retail, commercial retail, home improvement stores, grocery stores, bakeries, restaurants, breweries, bars, and gas stations, among several others. We also used the city’s land use shapefile to select several groups of alcohol facilities within the city limits. Owing to establishments frequently starting up and going out of business or changing locations, we spot-checked the city’s data using Google Maps. The data were allocated according to land use attributes and labeled according to business function. We labeled restaurants that had a bar as “Restaurant.” Locations where alcohol was the only product provided were labeled as a “Bar” and included bars, breweries, lounges, and nightclubs. We kept restaurants as a separate category because they were particularly prevalent and differed from the other establishments where the primary purpose was the consumption of alcohol. We therefore had two distinct alcohol categories in our analysis: “Restaurant” and “Bar.” We selected facilities where alcohol would be consumed on the premise but not facilities where alcohol was packaged for consumption off premises, such as a gas station or liquor store.
Sociodemographic data from the 2017 American Community Survey (ACS) on the block group level were used for analysis. The population-based exposure proxy was also derived from the 2017 ACS on the block group level. We placed one random point within a block group for every 10 residents of that block group. We made sure these points were in residential areas. Therefore, the population-based exposure proxy represents the number of residents living in any given study area. This methodology assumes that if someone is walking, they will be doing so within walking distance of and going to or from a home, an assumption that is supported by past research ( 32 ). Such population-based exposure metrics have proven useful for geographically broad work for which pedestrian exposure is not available ( 29 , 37 , 38 ). Pedestrian activity has also been found to increase in high-population density areas when compared with lower-density areas ( 39 ). Pedestrian exposure within the boundaries of the study was not fully explored owing to a lack of recorded data as citywide pedestrian activity data are not fully retained or recorded. Future research may explore exposure for specific locations and during nighttime conditions. To account for the limitations of citywide exposure, population levels served as an exposure proxy accounting for pedestrian activity.
For the equity portion of our analysis, we divided Albuquerque according to majority and minority race and ethnicities. The 2017 ACS provided race and ethnicity data on the block group level. We designated the 50% of block groups with the highest proportions of white non-Hispanic population as “white” and the other half as “non-white.” We used these areas to further parse our aforementioned land use analysis.
Methods
The objective of this research was to understand the relationship between pedestrian fatalities and severe injuries, lighting condition, land use, and sociodemographic factors through spatial analysis. By concentrating on activities and locations that past research has associated with safety outcomes, we were able to visualize the trends of where pedestrian fatalities and severe injuries are most common. Sequentially, better insight is gained as to where improvements are needed to minimize pedestrian casualties.
We first divided the pedestrian crashes according to four categories: fatal injury during daylight, fatal injury during nighttime, severe injury during daylight, and severe injury during nighttime. Each category of “nighttime” lighting condition incorporated both lighted and unlit intersections and corridors. Literature review findings suggested that street lighting had minor effects on crash rates resulting from the many interacting variables associated with nighttime crashes ( 40 , 41 ). Next, we used the “Buffer” tool in ArcGIS to designate 0.25-mi analysis zones around all alcohol facilities and commercial areas. These buffers were formed using Euclidian distance as opposed to network distance. We then used the “Dissolve” tool to merge the separate buffered zones into one single analysis zone for each land use. We also examined residential areas but did not include a quarter-mile buffer because doing so would have nearly encompassed the entire city boundary. We then used a spatial join in GIS to count the number of pedestrian crashes from the four crash categories and the population for each land use buffer and each study year.
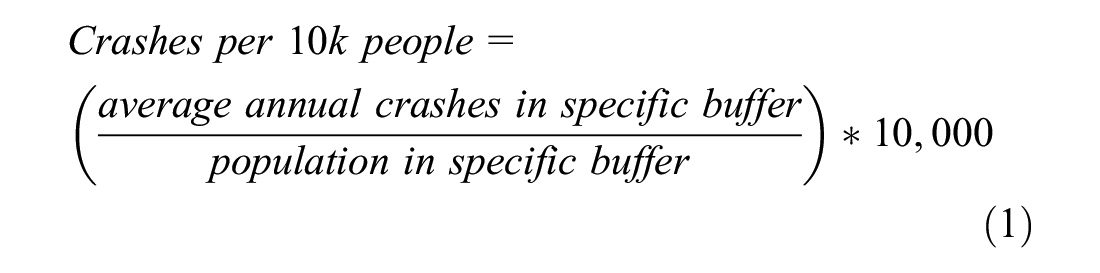
Using the recorded population that occurred in each buffer (from the number of residents per ACS data), we converted the number of crashes into a prevalence per 10,000 people (Equation 1). This formula divided the total number of crashes that occurred in a buffer by the population in the buffer, all multiplied by 10,000,
We verified the results by calculating 95% confidence intervals for each of the crash rates. Crash rates were separated according to light and dark conditions, fatal and severe injury severities, and land use categories. To further illustrate trends in relation to equity, the analysis was divided again according to white versus non-white areas of Albuquerque and confidence intervals were again calculated. We then compared the relationship between confidence intervals for any overlap. An overlap in confidence intervals would indicate that there was not a statistically significant difference between the categories under consideration. If the confidence intervals remained independent from each other, the results were statistically significant for any comparison being studied.
We finally performed a spatial clustering analysis to determine where crashes were densest in our land use and sociodemographic areas. We used the “Hot Spot Analysis” tool in ArcGIS to identify the location of cold and hot spots for fatalities and severe injuries in both the dark and daylight. This tool uses the Getis-Ord Gi* statistic, which derives a z-score capturing the value of a feature and the sum of all its neighbors and statistically compares the score to the sum of all study features (Equation 2).
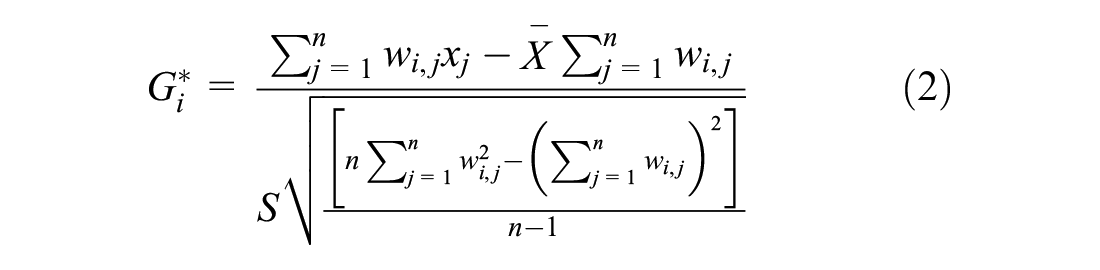
where
Gi* = Getis-Ord statistic,
wi, j = spatial weight between feature i and j,
xj = attribute value for feature j, and
n = total number of features.
We used a layer containing all pedestrian crashes that occurred in ABQ over the study period and used a combined injury severity/lighting field for the analysis. For every individual motor vehicle–pedestrian collision, the score therefore measured the number and proximity of neighboring collisions that resulted in a pedestrian injury or fatality. That score was then compared with the expected score based on the average of all other pedestrian collisions for the rest of the city. Using nighttime fatalities as an example, the results therefore identify the locations where a nearby pedestrian collision has a statistically significant (at 95% confidence) greater chance of resulting in a nighttime pedestrian fatality relative to other pedestrian collisions in the city.
Results
There were 100,741 reported motor vehicle crashes in Albuquerque over the 6 years that were studied. Pedestrians were involved in 1,603 (1.6%) of these crashes, with 144 pedestrians killed and 293 severely injured. Some 108 pedestrians (75%) were killed in the dark, 28 (19.4%) in daylight, 5 (3.5%) at dawn or dusk, and 3 (2.1%) under unknown lighting conditions. 147 pedestrians (50.2%) were severely injured in the dark, 131 (44.7%) in daylight, 9 (3.1%) at dawn or dusk, and 6 (2%) under unknown lighting conditions.
Albuquerque has an area of 189.5 mi2. There were 52.1 mi2 of residential land use and 5.0 mi2 of commercial land use. There were 272 alcohol establishments that – with the quarter-mile buffer – accounted for 27.6 mi2. We assumed that the other sizable land uses (including vacant at 41.1 mi2, parks and open space at 26.1 mi2, industrial at 4.6 mi2, and drainage at 4.5 mi2) were irrelevant to the study as they would not have high nighttime pedestrian activity. According to ACS data, only 39.4% of Albuquerque residents identify as non-Hispanic white, providing the opportunity for a thorough equity analysis.
Since we used population as a proxy for exposure, the “Residents” variable in Table 1 represents our population-based exposure metric, or the number of residents living within these zones based on ACS population data on the block group level. The land use categories are defined as follows:
The “Bar” category consists of a quarter mile around every bar, brewery, lounge, and nightclub in the city. The establishments in this category are distinct from those in the “Restaurant” category (see the Data section for more details).
The “Restaurant” category consists of a quarter mile around every restaurant that contains a bar in the city.
The “ABQ” category includes the entire city of Albuquerque.
The “ABQ w/o bar or rest.” category consists of the entire city minus “Bar” and “Restaurant” areas.
The “Commercial” category consists of a quarter mile around every commercial establishment in the city.
The “Comm. w/o bar or rest.” category consists of the “Commercial” area minus “Bar” and “Restaurant” areas.
Residents and Pedestrian Crash Counts over the Study Period
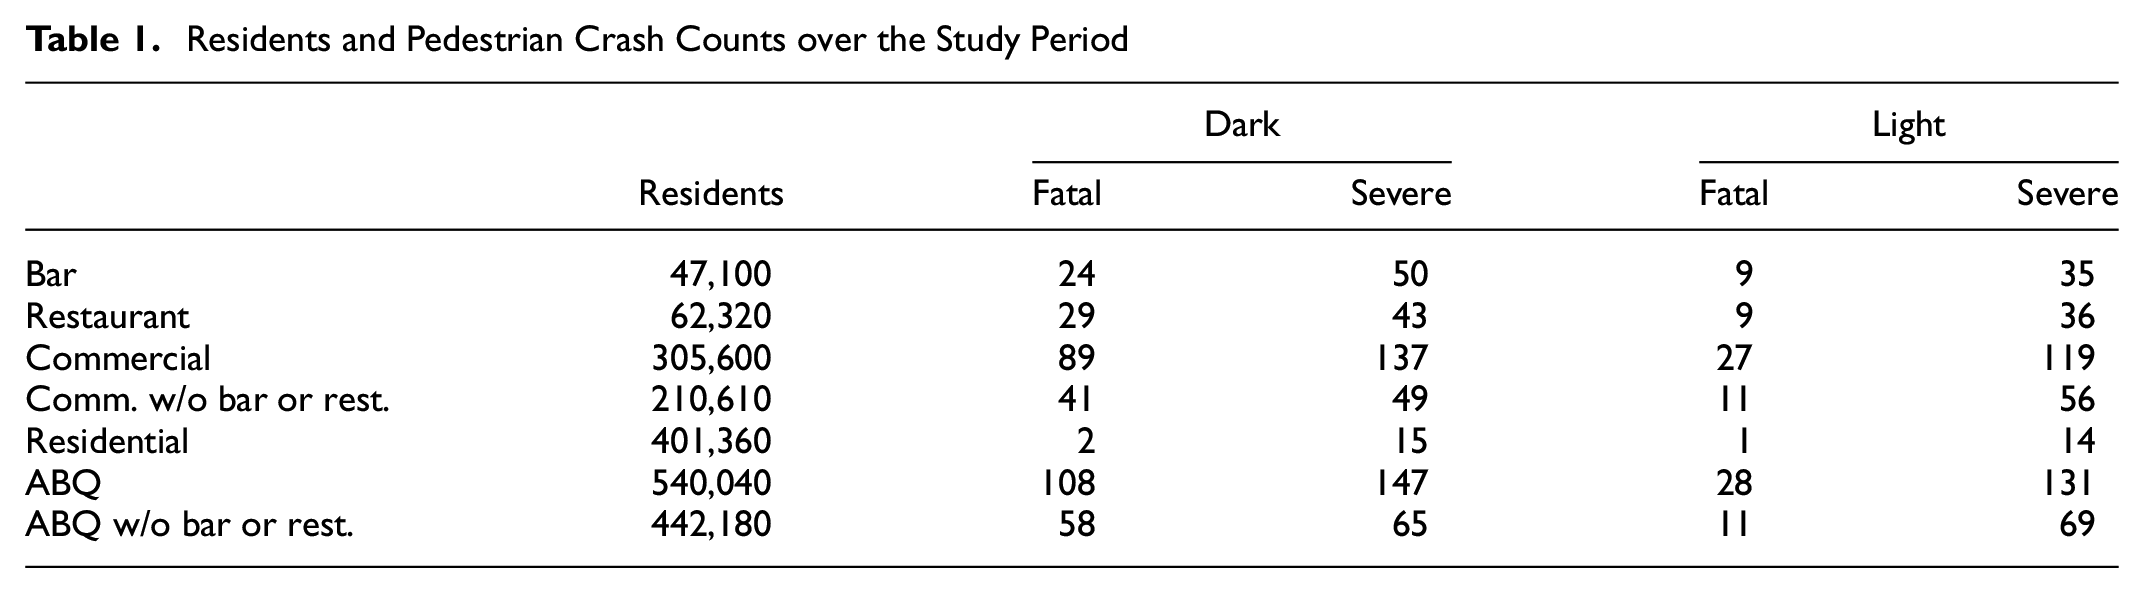
Because there was overlap between the “Bar” and “Restaurant” buffers, the sum of residents in “ABQ w/o bar or rest.,”“Bar,” and “Restaurant” was 11,560 residents higher than the “ABQ” count. Because there was overlap between the “Bar” and “Restaurant” areas, the sum of residents in “Comm. w/o bar or rest.,”“Bar,” and “Restaurant” was 14,430 residents higher than the “Commercial” count. The “Residential” category consisted of just residential areas without any buffers.
As with Albuquerque as a whole, each land use category saw a disproportionate number of pedestrian fatalities at night (Table 1). Severe injuries were more evenly distributed between the lighting conditions than fatalities. There were few fatalities or serious injuries in residential areas. These low residential counts were consistent across the night and day. As expected, fatalities and injuries were high in commercial areas. However, 57.8% of those pedestrian injuries and fatalities that happened in commercial areas occurred within a quarter mile of an alcohol establishment, despite only 31.1% of the population that live in commercial areas living within a quarter mile of an alcohol establishment. The same can be said for Albuquerque as a whole. Although consisting of only 14.6% of Albuquerque’s land area, the area around alcohol establishments accounted for more than half the severe injuries and nearly half the fatalities.
We then derived our per capita rates and confidence intervals. The findings suggested that alcohol establishments were host to a disproportionate number of pedestrian fatalities and severe injuries, especially in the dark (Table 2). First examining land uses, areas around bars had the highest rates, followed by restaurants (that also serve alcohol), commercial areas without alcohol, and finally residential. This order held for all combinations of severity and lighting condition. Although commercial areas had approximately the same rates as Albuquerque as a whole, areas around alcohol establishments had substantially higher rates. In relation to statistical significance, residential areas had rates that were statistically lower than all other categories for all combinations of severity and lighting condition. Alcohol establishments had statistically significant higher rates than the city as a whole for all categories except for fatalities in the dark. Furthermore, severe injury rates were statistically higher around alcohol establishments than other commercial areas. This relationship did not reach statistical significance for fatalities, most likely because of the smaller sample sizes.
Pedestrian Crash Rates and Confidence Intervals

N
With regard to lighting condition, we hypothesized that in the dark, alcohol rates would be high and commercial rates would be low, whereas in the light, alcohol rates would decrease and commercial rates would increase (the differences would tighten). This hypothesis evidenced itself with severe injuries. Bar and restaurant severe injury rates were significantly higher at night but decreased by 29.9% and 16.5% (respectively) during the day (Table 2). Conversely, severe injuries in commercial areas without alcohol increased 12.8% during the day. Bar and restaurant fatality rates actually decreased even more sharply during the day (62.3% and 69.2%, respectively). Rates were always higher at night than during the day, with the sole exception being severe injuries in commercial areas without alcohol, as might be expected if these areas see more daytime use and nighttime conditions are not a concern.
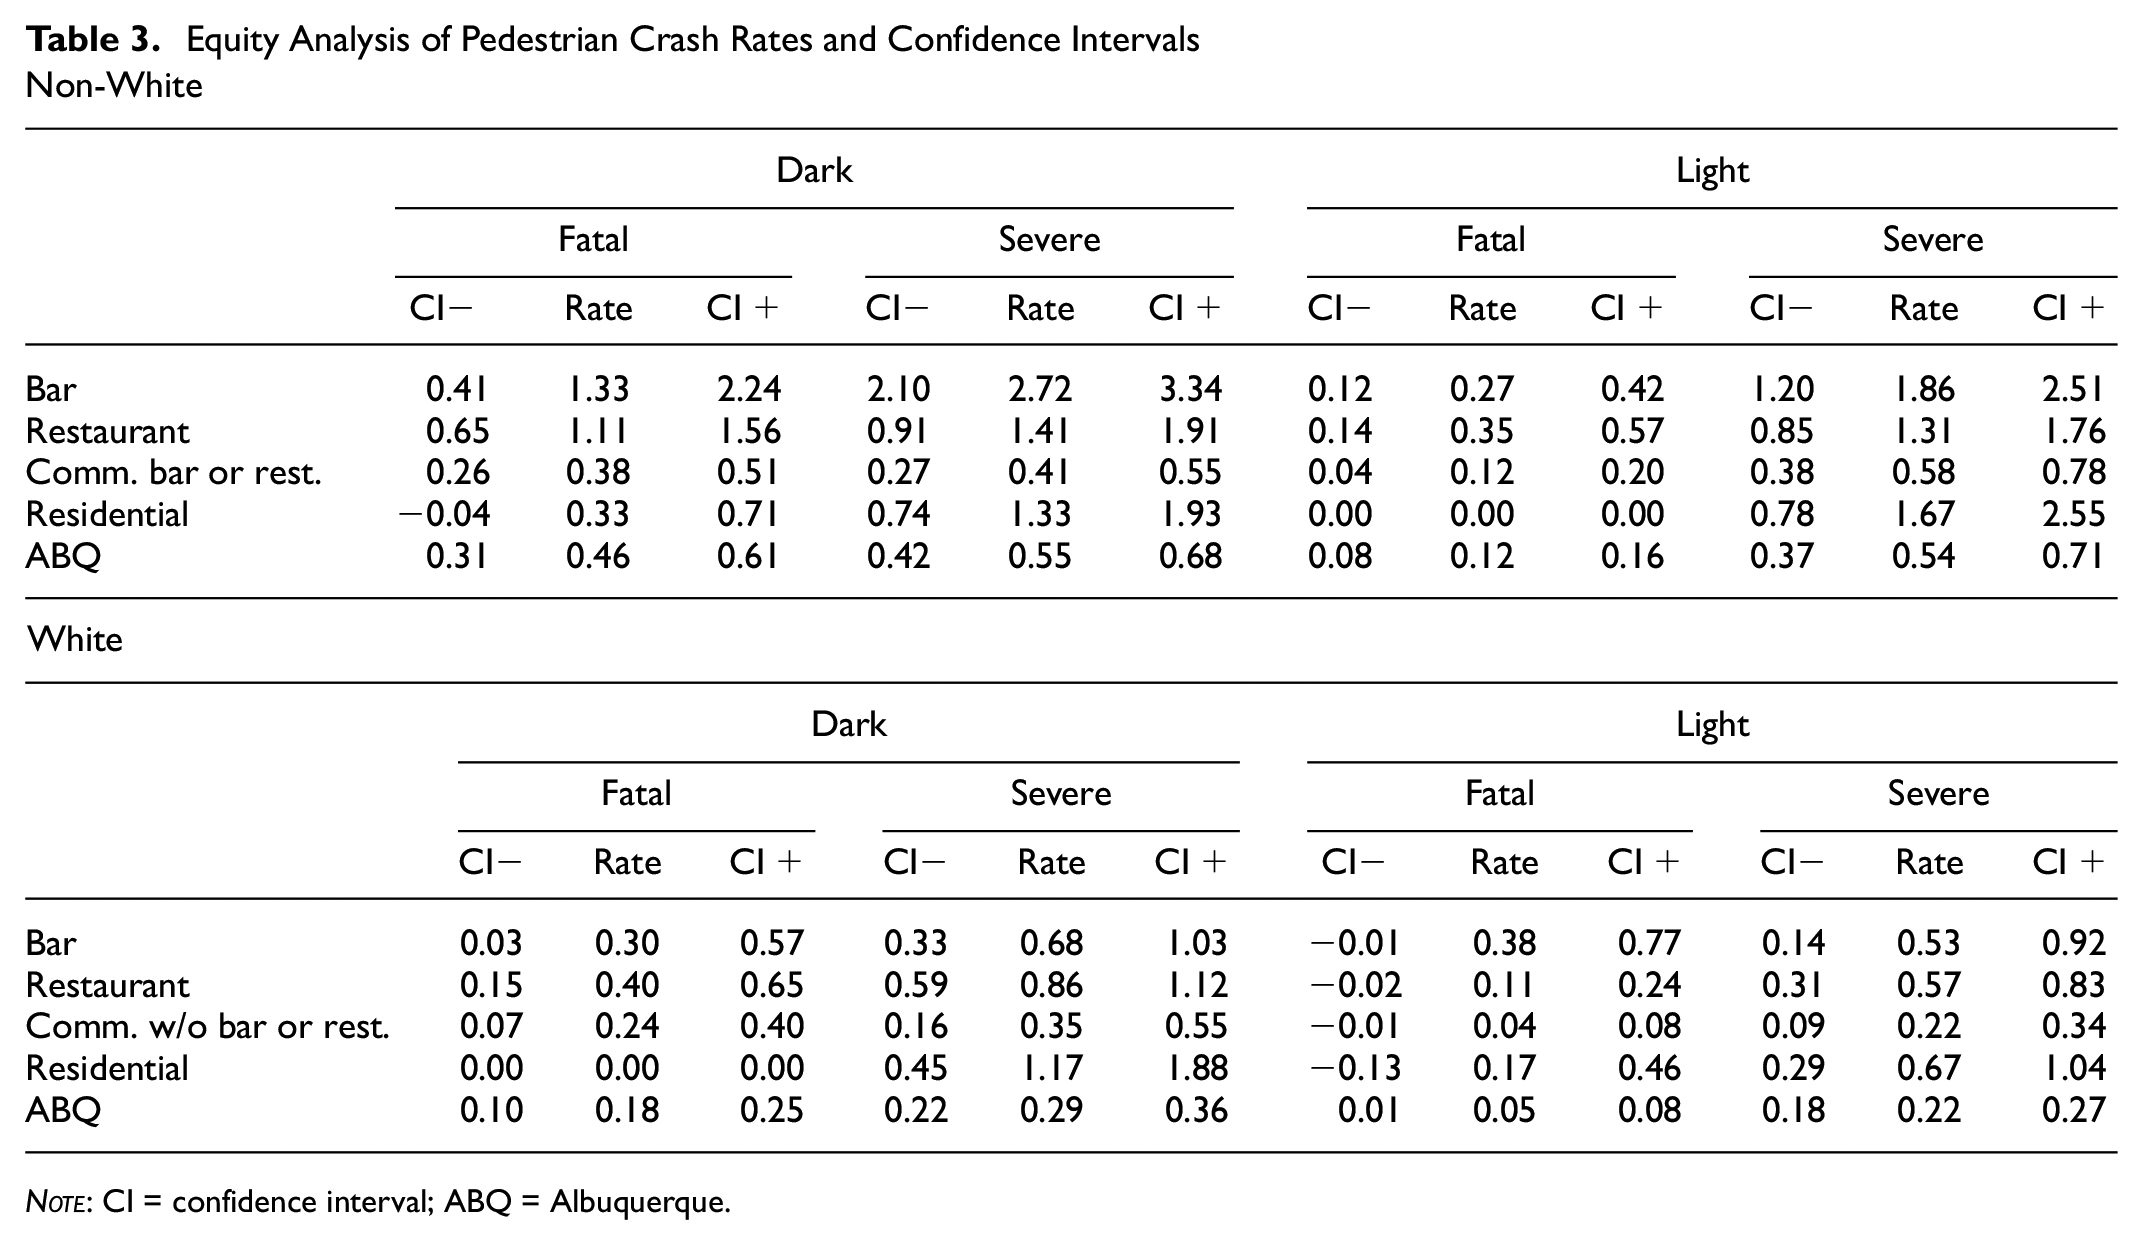
The findings suggested that the recent deterioration in pedestrian safety contained entrenched equity issues. Of the 20 rates examined, 18 were higher in non-white than white areas (Table 3). Again, for the sake of readability, we use the term “white” to denote white non-Hispanic. The two exceptions were daylight fatality rates within a quarter mile of alcohol establishments and daylight fatality rates in residential areas, neither of which were statistically significant. Half of the inequitable relationships were statistically significant, including all the comprehensive citywide rates.
Equity Analysis of Pedestrian Crash Rates and Confidence Intervals
N
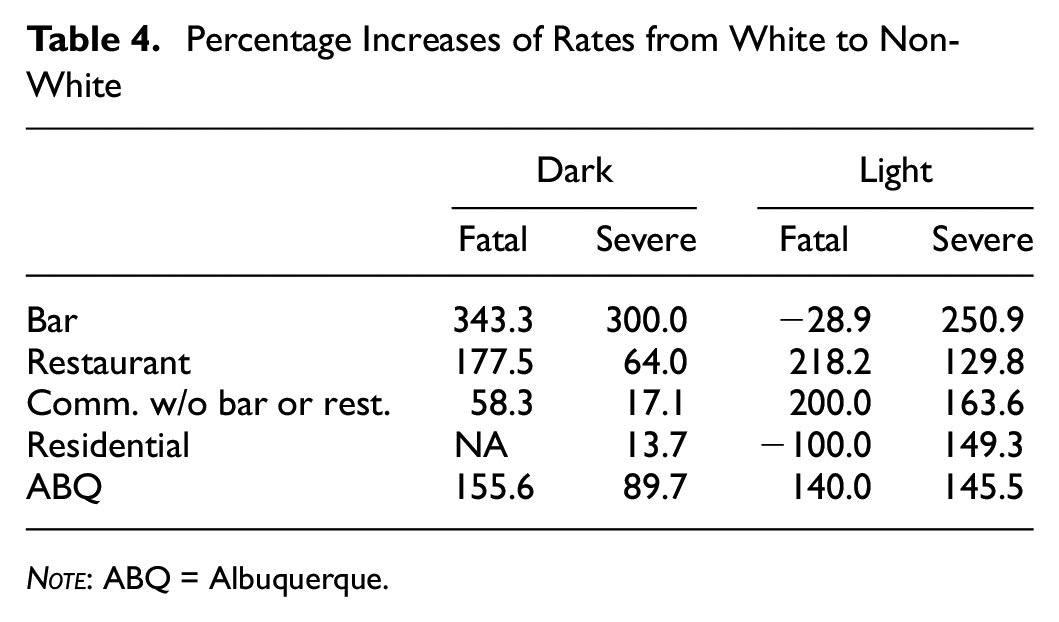
Alcohol establishments in non-white neighborhoods had considerably higher rates of nighttime pedestrian fatalities and severe injuries than alcohol establishments in white neighborhoods. To derive the percentage increases in fatal and severe rates seen in Table 4, we calculated the white to non-white increase in each of the 20 severity/land use/lighting rates and then divided that increase by the corresponding white rate from Table 3. Nighttime fatalities and severe injuries within a quarter mile of alcohol establishments were 343.3% and 300% higher in non-white than white neighborhoods, while in commercial areas without alcohol they were only 58.3% and 17.1% higher, respectively (Table 4). In the light, white to non-white increases were more even, typically around 100% to 240% higher for all land uses. This displays the same pattern we saw before, where differences between alcohol establishments were wider at night but tighten during the day.
Percentage Increases of Rates from White to Non-White
N
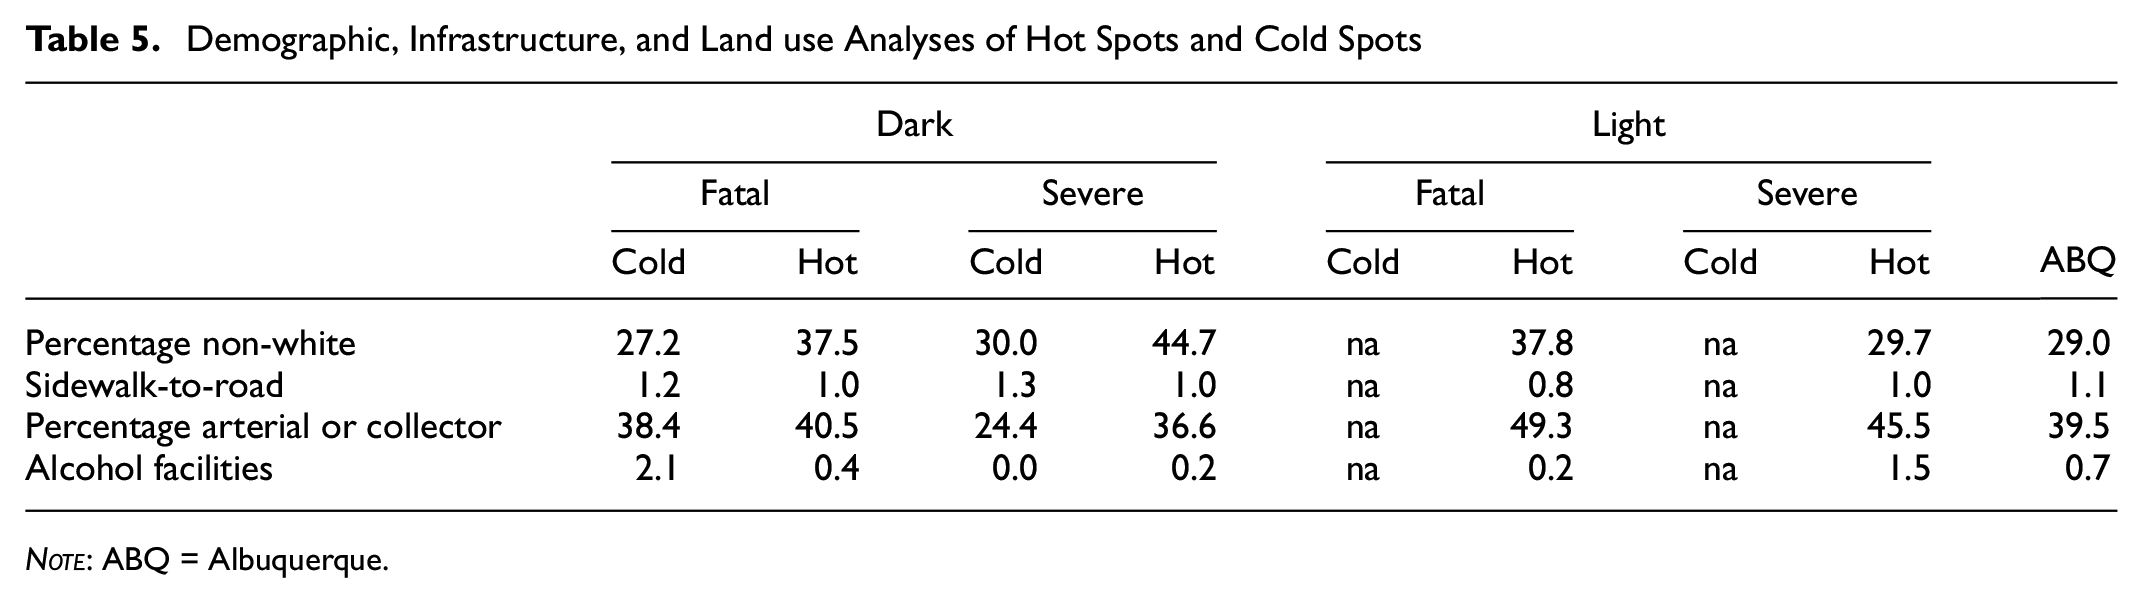
We then identified fatality and severe injury hot spots and cold spots and completed demographic, infrastructure, and land use analyses of the identified areas by examining percentages of non-white residents, percentages of roads that were collectors or arterials, the number of alcohol facilities, and sidewalk-to-roadway ratios within intersecting block groups. For each injury severity/lighting category, we identified all the block groups that contained either a hot or cold spot and calculated the average values of all the block groups. The sidewalk-to-roadway ratio was derived by dividing the linear feet of sidewalk by the linear feet of roadways and therefore a higher ratio represented more sidewalk coverage.
With regard to demographics, nighttime hot spots had significantly higher percentages of non-white residents than their corresponding cold spots, once again indicating equity issues (Table 5). There were no daytime cold spots identified. The percentage of non-white residents in hot spots were above the city average of 29%. All the hot spots had lower sidewalk coverage than the citywide average of 1.07, whereas cold spots had significantly higher coverage. Fatal daytime hot spots had particularly low sidewalk coverage. Nighttime hot spots had higher proportions of arterials or collectors than their corresponding cold spots. Daytime hot spots saw significantly higher proportions or arterials or collectors than the city average or nighttime hot spots. In summary, hot spots appeared to have higher percentages of non-white residents coupled with lower sidewalk coverage and more arterials or collectors.
Demographic, Infrastructure, and Land use Analyses of Hot Spots and Cold Spots
N
Interestingly, the demographic and infrastructure relationships appeared to be stronger than the land use relationship for the hot and cold spots. Hot spots generally had few alcohol facilities, well below the citywide average (Table 5). The exception was daytime hot spots of severe injuries because two of these hot spots were located near sizable commercial areas. The nighttime fatality cold spot actually had a large number of alcohol facilities because it was located near downtown. The nighttime severe injury cold spot had a small sample size and did not have any alcohol facilities. This supports the theory that, in addition to land use, demographics and infrastructure have important relationships with pedestrian safety and should be explored with future work. Our pedestrian safety issue was not just an alcohol facilities issue, but specifically alcohol facilities in certain parts of the city (non-white with poor infrastructure) and the issue was amplified at night.
Discussion
We often hear about systemic equity issues. This led us to wonder: how systemic are the equity issues that we have uncovered? Are all non-white parts of the city equally unsafe, or are the safety issues concentrated in just a few trouble spots? The results suggested that the safety issues were systemic, with numerous unique hot spots primarily located in non-white areas throughout the city (Figure 2). Interestingly, each severity/lighting category had distinctive locational hot spots. Nighttime fatalities appeared to be most widespread, with much of the west side of the city experiencing hot spots, as well as more localized areas on the south and east side of the city ((a) in Figure 2). Pedestrian collisions that occurred in these areas were statistically more likely to result in a nighttime fatality than other pedestrian collisions in other parts of the city. Nighttime severe injury hot spots were also evident on the west side ((d) in Figure 2). One reason for this may be that the west side of Albuquerque was generally built more recently that the east side and has large roadways. In particular, Coors Boulevard and Central Boulevard both have visible hot spots on the west side. These roadways are typically 90 ft between the edges of the pavement, whereas arterials on the east side are usually 80 ft. Not only are posted speeds typically 5 to 10 mph higher on the west side, but the differences between operating speeds are probably even greater.

Pedestrian fatality and severe injury clusters (hot spots represented with red circles; cold spots with blue circles; non-white areas underscored in blue) (Source: NMDOT.)
For daytime severe injuries, the most substantial hot spot (in the northwest part of the city) was located at a major shopping district ((c) in Figure 2). It intuitively makes sense that more pedestrian collisions would occur there during the day, and that pedestrians would have a high probability of being injured because of the large, fast roadways in this location as well. There were several other less prominent daytime hot spots, most located in non-white areas ((b) and (c) in Figure 2).
Interestingly, there were no hot spots around downtown. Actually, there were even downtown cold spots for nighttime fatalities ((a) in Figure 2). This is most likely because, although pedestrian collisions were relatively common, they more frequently resulted in minor injuries. This coincides with the roadway design relationship mentioned above, as roads through downtown are typically smaller and slower. For instance, Central Boulevard is reduced to 32 ft of travel way and signed at 20 mph through downtown.
Conclusions
Albuquerque’s recent increase in nighttime pedestrian fatalities and severe injuries was concentrated in areas around alcohol establishments. Nighttime rates within a quarter mile of alcohol establishments were higher than other commercial areas and the city at large. This relationship weakened in the light but was still present. Rates were higher in non-white neighborhoods and seemed to be well-distributed across the city. Hot spots appeared to concentrate in areas with low sidewalk coverage and high proportions of arterials and collectors.
The findings suggested that to improve pedestrian safety, we should focus countermeasures on commercial areas – especially those with alcohol – and in non-white parts of the city. Such countermeasures might be selected so to lower the severity of nighttime collisions. We must also ensure that countermeasures are applied equitably. The populations that may most need safe and comfortable pedestrian accommodations appeared to have the worst outcomes. Albuquerque’s Vision Zero plan has a deliberate focus on equity, which is promising and may help to solve the identified safety issues.
Countermeasure recommendations might follow the three E’s of traffic safety: engineering, education, and enforcement. With regard to engineering, findings suggest that we should continue to reexamine street design in more depth, as issues appear to concentrate on larger and faster roadways with lower sidewalk coverage ( 42 , 43 ). This aligns with a recent push for speed management and appropriate pedestrian facilities by several organizations involved in transportation (44–46). Specific focus should be placed on areas that we know will have high levels of walking. Lowering vehicle speeds may be effective at improving safety for both intoxicated driving and walking.
Although education and enforcement may be difficult to scale up, our findings provide guidance on focus areas where we might expect to accrue the greatest benefits. Specific education recommendations include supportive media promotion programs, which have been found to be effective at reducing levels of drinking and driving when used in combination with other approaches ( 47 ). However, education programs such as passive server training, school drug and alcohol education, and health warnings have not been found to be effective ( 47 ). Note that these educational programs were studied in relation to drinking and driving. We were not able to find research examining the relationship between education and intoxicated walking. In addition to educational efforts aimed at intoxicated pedestrians, drivers, or both pedestrians and drivers, we might also focus educational campaigns on others that will have contact with them such as alcohol sellers and servers, relatives, and friends ( 32 ).
Enforcement in the form of increased police patrol programs has been shown to be generally beneficial at reducing driving under the influence (DUI) collisions and the severity of those collisions, although findings of a systematic review on the topic were not completely consistent ( 48 ). Although these studies were focused on drinking and driving, it is not yet clear whether such enforcement efforts would be effective for intoxicated pedestrians. Having police prioritize intoxicated pedestrians is a recommendation that may be explored with future work.
In addition to the three E’s, we might harness new technologies to alter travel behaviors. Although there is still debate on the topic, research is beginning to emerge suggesting that ride hailing programs may be an attractive alternative to drinking and driving and can help to reduce DUI behavior ( 49 , 50 ). Again, although we were not able to find research exploring the feasibility of ride hailing as an alternative to drinking and walking, this recommendation may be explored with future research.
Future Research
This work leads to several interesting opportunities for future work. Now that we have identified overall trends and hot and cold spots, we hope to further analyze the land use and infrastructure characteristics within the identified spots. Some of our earlier research found there was lower risk of pedestrian injury in mixed-use neighborhoods ( 33 ). Therefore, instead of analyzing traffic safety outcomes for individual land uses, we could analyze how the mixing of land uses and urban design affect safety outcomes. In addition, although we identified lower sidewalk coverage and a higher percentage of arterials in our hot spots on the block group level, future work could perform more detailed analysis on the corridor level that examines characteristics such as number of lanes, posted speed limits, and availability of pedestrian crossings.
Whereas alcohol establishments seem to play an important role, it is unclear whether the alcohol is being consumed by the pedestrians or whether there is more drinking and driving (or a combination of both). Although the percentage of fatally injured pedestrians with high BACs in the United States declined from 45% to 35% between 1982 and 2014, the percentage of fatally injured drivers with high BACs declined from 51% to 32% during that same time ( 19 ). That drinking and driving had a steeper decline suggests that it is possible that some of those drunk drivers may be walking drunk instead. If so, high rates of pedestrians being struck around alcohol establishments at night may actually be somewhat of a benefit in disguise as it may be a signal of fewer people drinking and driving, a decrease in the intrinsically more dangerous activity. An NHTSA-sponsored study backs up this hypothesis, finding that 42.8% of fatally injured pedestrians with a BAC ≥ 0.08 had prior alcohol-related offenses, whereas only 19% of fatally injured pedestrians with a BAC < 0.08 had prior alcohol-related offenses ( 51 ). More research is needed to understand the relationship between walking versus driving while drunk. Another interesting and related land use topic for future research is why alcohol establishments also have higher pedestrian fatality and severe injury rates during the day than the city at large and even other commercial areas (although the differences were significantly smaller than at night).
Although equity issues have been broadly identified, what is the cause of and solution to these issues? In other words, are the poor outcomes seen in non-white neighborhoods a result of substandard pedestrian facilities, larger and faster roadways, different vehicle compositions, or varying driver and pedestrian behavior? Although we hypothesize that roadway design and development patterns will play an important role, based on our hot spot analyses, more research is needed to better understand the characteristics of these equity issues. Furthermore, conspicuity and vehicle speed are other possible causal factors that could account for the patterns we observed and further exploring their role would be worthy of future research.
A primary limitation of this work was a lack of comprehensive pedestrian exposure data. A consistent exposure metric for the entire city was necessary, which led to a population-based exposure metric. We considered conducting a survey to measure exposure, but survey data have been found to significantly underrepresent pedestrian exposure, and low response rates may introduce self-selection issues ( 52 , 53 ). We also considered observational data, but observational data fail to properly consider potential endogeneity issues between perceived risk and exposure for pedestrians. In other words, a road perceived to be dangerous could be the cause of low pedestrian exposure, resulting in few crashes and a seemingly good safety record. For pedestrians, therefore, risk affects exposure and exposure affects risk. Past research has found that higher pedestrian crash risk increases perceived crash risk, whereas higher perceived crash risk is negatively associated with actual crash rates ( 31 ). Using observational pedestrian exposure data would therefore be problematic.
Pedestrian crashes may cluster near bars at night because people drink at bars at night, thereby increasing exposure in their vicinity. Our current exposure proxy would not be able to account for such behavior. Another limitation is the indirect bias that is present because pedestrian exposure is likely to be higher in minority communities. Future work might concentrate on specific commercial or alcohol areas or corridors so that we can obtain better night and daytime exposure data, possibly through new technologies such as data from crowdsourced mobile devices or advanced video image processing to better understand such behaviors.
Another drawback of the current work is that restaurants and bars start up and go out of business frequently. Although we confirmed that all businesses were still operating at the beginning of the study, frequent changes could have led to inaccuracies in the analysis.
The recent degradation in pedestrian safety must be addressed. The findings suggested that efforts should be centered on commercial areas with a focus on alcohol establishments, particular attention should be directed toward mitigating nighttime severity in these areas, infrastructure will play a critical role, and systemic equity issues need to be confronted.
Footnotes
Author Contributions
The authors confirm contribution to the paper as follows: study conception and design: B. Long, N. Ferenchak; data collection: B. Long, N. Ferenchak; analysis and interpretation of results: B. Long, N. Ferenchak; draft manuscript preparation: B. Long, N. Ferenchak. All authors reviewed the results and approved the final version of the manuscript.
Declaration of Conflicting Interests
The authors declared no potential conflicts of interest with respect to the research, authorship, and/or publication of this article.
Funding
The authors received no financial support for the research, authorship, and/or publication of this article.
Data Accessibility Statement
All data used in this research are publicly available from the American Community Survey (population and sociodemographic characteristics), City of Albuquerque (land use, roadway, and sidewalk data), NMDOT (collision data), and U.S. Census Bureau (geographic boundaries).