



Abstract
The operation of a bus rapid transit (BRT) station platform is a key factor that affects BRT system performance. As waiting passengers occupy more platform space than circulating passengers, evaluation of their distribution across the platform is important. Public transport systems have been affected by the global pandemic Coronavirus disease 2019 (COVID-19). This may have affected the waiting passenger distribution on BRT platform space. Therefore, this study aimed to identify the impact of COVID-19 on waiting passenger distribution on a platform during the peak period at an important station on the BRT system in Brisbane, Australia. Manual data collection was carried out before COVID-19 and during COVID-19. Waiting passenger counts in each case were evaluated separately to identify variation across the platform. The total waiting passenger count on the platform at a given time reduced significantly during COVID-19. To compare the two cases, data sets were normalized, and statistical analysis performed. The test results indicated that the distribution of waiting passengers during COVID-19 has significantly changed, bringing more waiting passengers into the platform center than the two ends, whereas before COVID-19, more waiting passengers were observed at the upstream half of the platform. There was also greater temporal variation across the whole platform during COVID-19. These findings were used to postulate the reasons behind the changes resulting from COVID-19, which affected platform operation.
The station platform plays an important role in bus rapid transit (BRT) system performance as it is the place where passengers start or end their interaction with the system. Several passenger activities take place on the platform space. Passenger waiting is a major activity that affects platform operation, as an increase in waiting passenger counts can significantly increase platform congestion. Each passenger enters the station and chooses a preferred location to wait until their desired bus service arrives at the station. Therefore, some areas of the platform may experience more passenger crowding than other areas ( 1 ). This results in an uneven distribution of passengers waiting on the platform.
In selecting waiting locations on transit station platforms, passengers consider several factors including distance from the entrance to the waiting location, crowd level at the waiting locations, and availability of platform amenities ( 2 – 4 ). These factors may concentrate the waiting passengers toward specific locations on the platform. In addition to these factors, the Coronavirus disease 2019 (COVID-19) pandemic may have led to changes in the selection of waiting locations by passengers and therefore affected platform operating performance. The effects of COVID-19 on public transport has very recently become a major focus in research. Owing to this pandemic, the appeal of public transport has reduced, in turn reducing passenger volumes on station platforms ( 5 ). In addition, social distancing and measures introduced by transit authorities may have affected waiting passenger behavior on public transport stations.
This study aimed to identify the waiting passenger distribution on a BRT station platform during COVID-19, through a case study of an important station on the South East Busway (SEB), which is the primary spine of the BRT system in Brisbane, Australia. The case study station has a wide platform space with several buses typically servicing at the same time during the busy PM peak period. This enables each passenger to select a preferred waiting location along the platform space. Before COVID-19, the platform was congested during peak periods ( 6 ). But during COVID-19, this may have changed. Therefore, identifying the change in waiting passenger distribution across the platform during COVID-19 is important to identify measures to improve platform operation and passenger health and safety by reducing platform congestion, while maintaining a high quality of service.
To identify changes, we reviewed the current literature to understand the waiting passenger behavior before COVID-19 and the impact of the pandemic on public transport. With the use of those findings and data collected at the case study station, the analysis was carried out in stages. We discuss the results and provide conclusions and suggested directions for further research.
Literature Review
The very recent onset of COVID-19 has had an impact on public transport. At the time of writing, the outbreak of COVID-19, which was first recognized in December 2019, has spread globally across 210 countries ( 5 , 7 , 8 ). With the spread of COVID-19, countries have taken measures to mitigate its threat to society. As the operation of public transport involves close passenger interaction, initiating safety measures at public transport facilities is imperative.
According to Rubiano and Darido, public transport usage globally has reduced because of COVID-19, bringing the passenger numbers in cities down by 70% to 90% ( 9 ). People’s behavior and attitudes toward public transport have changed and there has been a significant move toward private transport modes rather than public transport owing to safety concerns ( 5 ). In Australia, public transport usage has dropped sharply and steadily following the increase in the number of COVID-19 cases and the introduction of travel restrictions by state and territory governments. Short et al. show that public transport usage around Australia has reduced by around 80% during the pandemic ( 5 ). This has resulted from changes in passenger behaviors and decision making around public transport usage. Dia indicated how transit trip making reduced in every major city in Australia, and highlighted the need to reduce crowding on platforms and in transit vehicles by managing passenger flow while decreasing waiting times ( 10 ). Therefore, it is important to pay attention to these changes and consider data-driven approaches to introduce safety measures while considering them in policy making and planning ( 5 ).
In public transport systems, platform operation is vital. Numerous studies have analyzed different passenger activities that take place as part of transit platform operation. When considering the activity of waiting, several factors have been identified that contribute to the selection of preferred waiting locations by passengers, and hence, the distribution of passengers across the waiting area is not uniform. According to Bosina et al., the distribution of passengers changes with an increase in passengers on the platform ( 11 ). When some areas of the platform are congested, passengers might select places that have less crowding. Another major factor that affects selection of waiting location is the distance to the waiting location from platform access points including stairs, escalators, and elevators ( 2 – 4 ). Passengers select waiting locations near the platform access points so that their walking distance is minimized ( 12 ). But if the station has one entrance/exit, passengers may concentrate in one location and that increase in crowding may obstruct movement as well as the line of sight of passengers ( 13 ). Wiggenraad found that the access points at the end of the platform lead to higher concentrations than at the one-third, middle, or two-thirds locations along the platform ( 4 ). Some researchers have identified the location of platform amenities such as signage, seating, and ticket machines, as other key factors affecting waiting location selection ( 2 , 14 ). The reasons for this may be the desire of passengers to utilize the amenities, and the tendency of passengers to avoid unnecessary contact with circulating passengers.
The TransLink Division of the Queensland Department of Transport and Main Roads introduced “The COVID-Safe Public Transport Plan” across all transit modes in its service area of the state of Queensland. This has had a strong impact on BRT system operation during COVID-19 ( 15 , 16 ), including on the SEB in Brisbane. The plan indicates safety measures including social distancing at stations and inside vehicles, cashless payments, rear-door boarding on buses, provision of reliable service even during the pandemic, and introduction of additional services during peak shoulders to support social distancing. In addition, TransLink and its contracted operators have installed onboard floor decals and posters at stations to heighten passenger awareness of COVID-19, informing them about the safety measures to follow while using public transport.
In considering the effect of the current pandemic on the public transport network, it is important to understand the changes in transit network operation. Short et al. highlighted the importance of operational considerations at transit stations ( 5 ). Therefore, this study focused on BRT station platform operation and analyzed how waiting passenger distribution changed before and during COVID-19 at the case study station. To continue this study, further research will develop a methodology that incorporates the factors affecting waiting location selection by passengers on BRT station platforms ( 17 ).
Case Study Station and Data Collection
Platform operation during the peak period is critical as the highest number of passengers can be observed on the platform during this period. Therefore, this study focused on the waiting passenger distribution across the BRT station platform during the 90-min evening peak period. Factors affecting passenger activities and behaviors on a BRT platform, and their interrelationship were studied with the aid of the Transit Capacity and Quality of Service Manual (1). Next, qualitative observation of platform operation was carried out at selected BRT stations before COVID-19. Considering the restricted geometry, the high number of timetabled services (152 bus/h equivalent), and the platform crowd observed during peak periods (approximately 55 passengers waiting at any given time), the outbound platform of Mater Hill busway station was selected as the case study, one of the most important stations on the SEB in Brisbane, Australia. Platform crowds and the number of timetabled services at this station were higher than those of the two adjacent busway stations. The maximum load segment of SEB is from Mater Hill busway station outbound.
As this research focuses on the waiting passenger distribution on the platform before COVID-19 (Bef-COVID) and during COVID-19 (Dur-COVID), platform operation during each of these two cases was examined. Bef-COVID, 59% of the population of the city of Brisbane (which constitutes approximately one-third of TransLink’s South East Queensland service subarea) used public transport ( 18 ). In April 2019, 7.6 million bus trips were made in Brisbane whereas in April 2020 (Dur-COVID), this reduced to 1.3 million bus trips, which is an 82% reduction ( 19 ). At the time of this study, under the Dur-COVID case, personal movement was strictly limited by the State of Queensland including restrictions to nonessential travel. Strict physical distancing measures were imposed. Working from home was strongly encouraged ( 5 , 20 ). The state and international borders were closed. These conditions most certainly affected public transport use in the city of Brisbane and on the SEB.
The general operation of the SEB system Bef-COVID included the boarding of passengers only through the front door, but passengers could alight using any door. This has changed Dur-COVID, because TransLink has introduced boarding and alighting only through the rear door (unless assisted boarding/alighting through the front door is required, or where a regional bus only has a front door), as a safety measure for the drivers as well as for passengers. However, all bus services have operated as scheduled Dur-COVID without any interruptions ( 16 ).
The study platform has three offline loading areas (LAs) and three platform entrances/exits as shown in Figures 1 and 2. Entrances 1 and 2 (as numbered in Figures 1 and 2) are the primary accesses, whereas Entrance 3 is a modestly used access. Fare collection was predominantly on board using smart card touch-on and touch-off Bef-COVID and completely Dur-COVID.
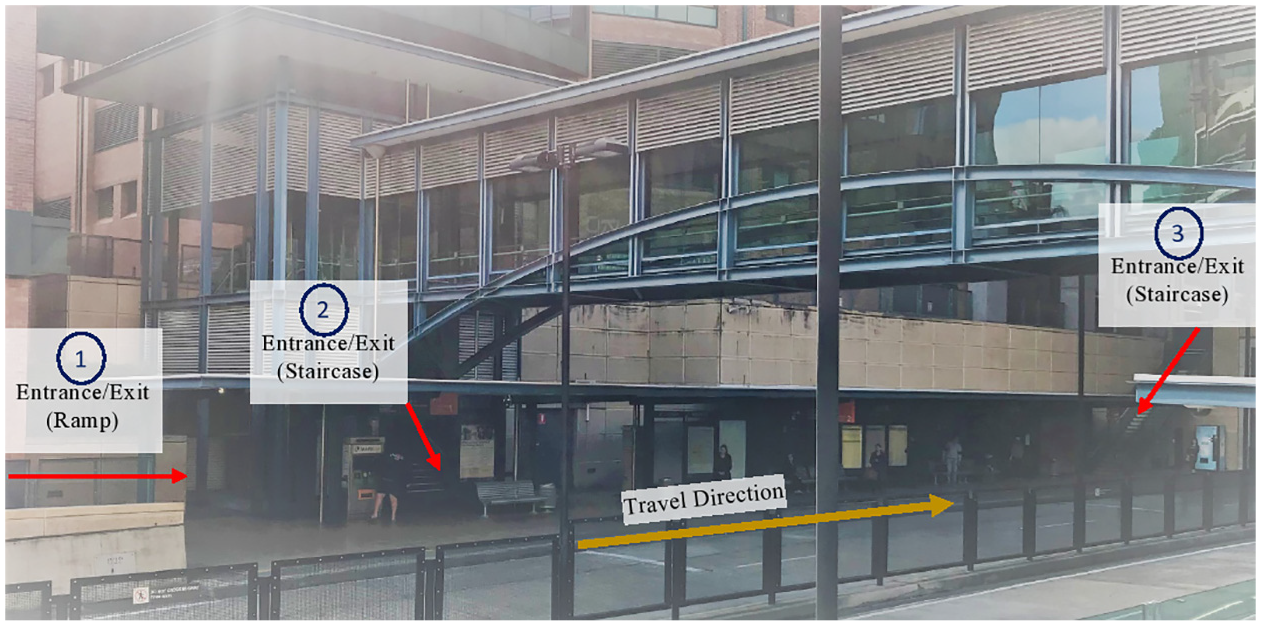
Mater Hill BRT station, outbound platform.
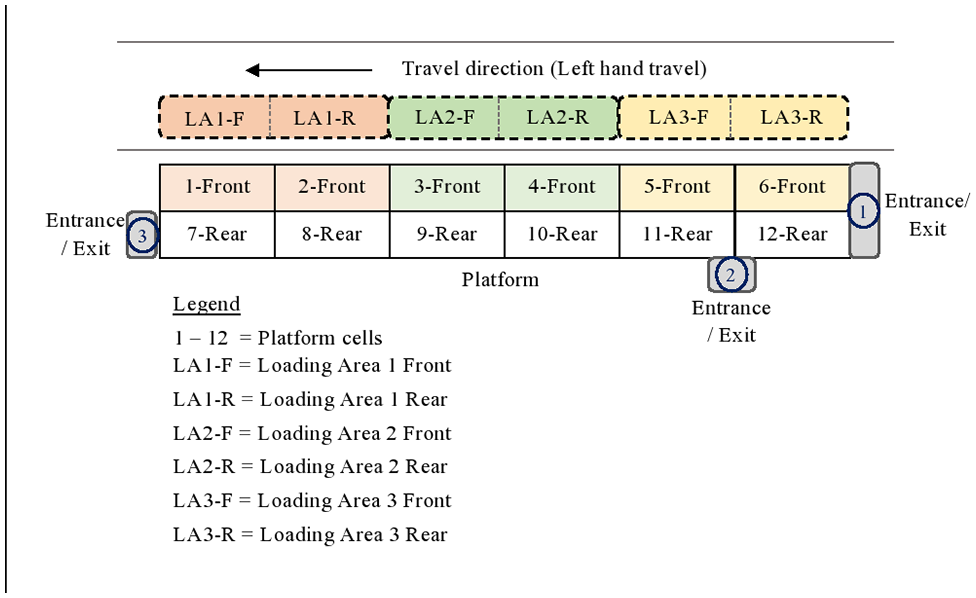
Study BRT platform configuration ( 6 ).
In this research, we divided the platform into 12 cells of equal dimension, as shown in Figure 2. The reasons behind this platform division were buses typically having two doors, which results in six door positions along the platform front length (considering all three LAs); use of the front strip mainly for boarding and alighting, whereas the rear strip is used for accessing platform amenities (seating, information); and for easy identification of the passenger waiting locations across the large platform space ( 17 ).
To identify the spread of waiting passengers across these platform cells, manual data collection was carried out at the case study station platform. Ethical considerations concerning the possibility of reidentification of passengers led to the selection of this data collection method. Data collection was carried Bef-COVID and Dur-COVID. For each case, data were collected during the evening peak period of two mid-weekdays. Data related to the case study station characteristics and evaluation period are presented in Table 1.
Case Study Station Platform Characteristics and Evaluation Period Data

On site, the platform was divided into 12 cells using the platform floor and roof pattern. The number of waiting passengers in each cell was counted in 5-min intervals over the 90-min data collection period for each day. The next section describes the analysis of the collected data.
Data Analysis
Methodology
Data analysis was carried out in stages. The flow chart shown in Figure 3 illustrates the procedure followed in analyzing the data collected Bef-COVID and Dur-COVID. The procedure was followed for each case separately. The following sections describe the data analysis methodology indicated in Figure 3.

Data analysis methodology.
Waiting Passenger Distribution
To identify the waiting passenger distribution across the platform, data collected for each cell in 5-min intervals were averaged over the 90-min data collection period of each day. Average waiting passenger counts in the 12 platform cells were charted for each day and each case (Bef-COVID and Dur-COVID) separately. Figures 4 and 5 indicate the variation in waiting passenger counts during the evening peak period of Bef-COVID and Dur-COVID cases respectively. The waiting passenger count is the expected value at an instant in time, representing the average from 18 intervals, each of 5-min duration during the peak period. These plots illustrate how the waiting passenger count varies across the platform cells, which were used to postulate the patterns of variation. In addition, they were used to identify the similarities and differences between the waiting passenger distribution on the study BRT station platform during the Bef-COVID and Dur-COVID cases.
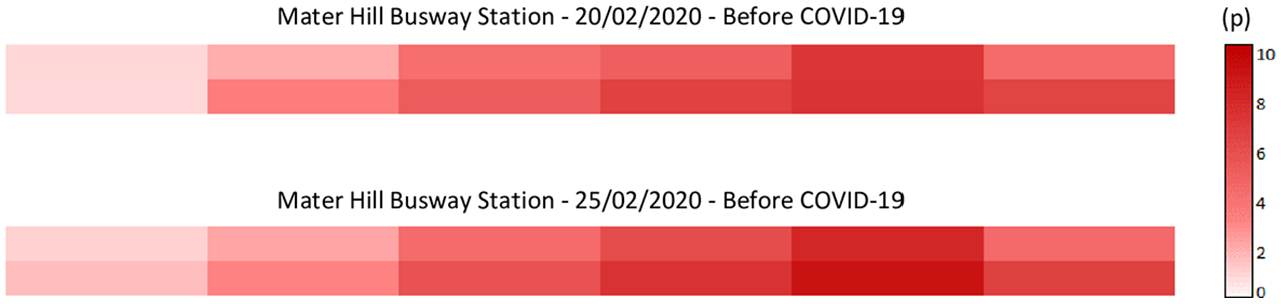
Waiting passenger distribution (p) (average of 18 intervals of 5-min duration) during the evening peak period on the study BRT station platform before COVID-19.
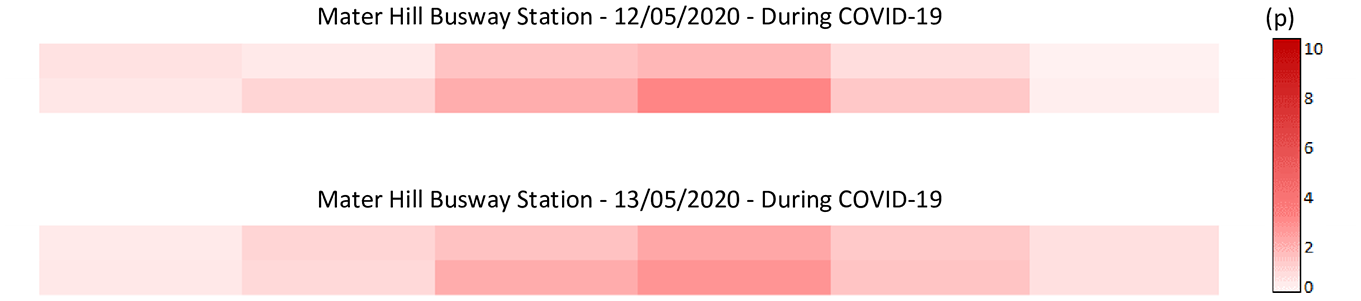
Waiting passenger distribution (p) (average of 18 intervals of 5-min duration) during the evening peak period on the study BRT station platform during COVID-19.
For each period, data were collected during 2 days to verify the waiting passenger distribution across the platform. According to Figure 4, which describes the waiting passenger distribution for Bef-COVID, the number of waiting passengers in the cells increased from the downstream end of the platform (left-hand side) toward the upstream end of the platform (right-hand side) until Cells 5-Front and 11-Rear. The reason for this variation was postulated to be the location of the two primary entrances of the station at the upstream end and passengers selecting waiting locations close to the platform entrances to reduce circulation distance ( 3 , 12 ). The number of waiting passengers being highest around Cell 11-Rear was postulated to be the result of its closeness to LA3, which is the most efficient LA ( 1 , 21 ). This LA always has capacity if buses are available, whereas LA1 and LA2 may be blocked with the buses stopped at LA3, LA2, or both. There was a significant reduction in the waiting passenger counts in Cells 6-Front and 12-Rear, which are the upstream-most cells. This was postulated to be because of the obstruction of passengers’ view of the approaching buses by the guideway curvature just before the station and by the wall that separates the guideway from the footpath that provides access to platform through Entrance 1, as shown in Figure 1. When comparing the passenger counts in each front- and rear strip cell pair, the number of waiting passengers in most of the rear strip cells was higher than the number of waiting passengers in the respective front strip cells. It was postulated that the availability of platform amenities (seating, displayed bus timetable, smart card vending machines) at the rear side of the platform and less obstruction from boarding/alighting processes were the reasons for this. The average number of waiting passengers observed was approximately 52 on 20 February 2020 and 58 on 25 February 2020.
According to Figure 5, the number of waiting passengers on the platform Dur-COVID increased slightly from the downstream end toward the center of the platform and then decreased again toward the upstream end. This slight variation was postulated to be because of the low number of waiting passengers on the platform (when compared with Bef-COVID) and the social distancing measures being followed by passengers, which led passengers to spread across the platform space. A comparatively high waiting passenger count was observed at the platform center owing to passengers moving away from the platform accesses, most likely so that the interactions with entering/exiting passengers could be minimized. It was postulated that the shifting of the highest waiting passenger count from Cell 11-Rear in Bef-COVID to Cell 10-Rear in Dur-COVID was because most buses were able to stop at downstream LAs. Although buses have been operating without any interruptions to the schedule, dwell time at BRT stations has decreased with the low passenger count Dur-COVID, which we observed to result in increased efficiency of downstream LAs. Waiting passenger counts varied between front- and rear strip cells in a similar way to the Bef-COVID situation. The average number of waiting passengers observed was approximately 11 on 12 May 2020 and 13 on 13 May 2020.
When comparing the total number of waiting passengers on the platform at one time, the count was significantly higher Bef-COVID than Dur-COVID. That highlights the striking reduction in use of the case study platform and, by extension, the BRT system in Brisbane by passengers Dur-COVID. Owing to this difference in total waiting passenger counts, it was not feasible to directly compare the two distributions charted above. Therefore, statistical tests and comparison of normalized data sets were carried out as described in the next sections.
Statistical Analysis
We applied nonparametric statistical tests to identify whether the differences in the waiting passenger distributions in cells between Bef-COVID and Dur-COVID cases were significant. The Mann–Whitney U (MW) test was chosen to test for differences in the location of the two distributions of normalized waiting passenger counts, by comparing the mean ranks of the two data sets ( 22 ). The independent samples Kolmogorov–Smirnov (KS) test was chosen to test for differences in the scale and shape of the two distributions of normalized waiting passenger counts, by comparing the absolute difference between the cumulative distribution of the two data sets ( 22 ). To run each test, Statistical Package for the Social Sciences (SPSS) was used.
Data collected during 2 days were considered together for each case (Bef-COVID and Dur-COVID) when performing MW and KS tests. Cell-wise, waiting passenger counts were taken in 36, 5-min intervals over the 180-min data collection period of 2 days combined. This resulted in two data sets; one each for Bef-COVID and Dur-COVID. Because the total waiting passenger count on the platform Bef-COVID and Dur-COVID were different, the two data sets were normalized by taking the ratios of waiting passenger counts in each cell to the average waiting passenger counts across all 12 cells (considering the platform overall), for each 5-min interval. The resulting set of ratios in each cell, for each 5-min interval (in both cases), were then used to perform MW and KS tests using SPSS.
For the MW test, the null hypothesis states there is no significant difference in the mean ranks between the two distributions of normalized waiting passengers Bef-COVID and Dur-COVID. This test was performed with a 95% confidence interval (0.05 significance level). Table 2 indicates the MW test results.
Mann–Whitney U Test Results: Waiting Passenger Distribution Bef-COVID versus Dur-COVID

From the MW test results, the null hypothesis was retained in platform cells at the downstream half of the platform except in Cell 7-Rear, whereas the null hypothesis was rejected in all other cells in the upstream half of the platform. The null hypothesis was retained owing to the observation of higher waiting passenger ratios in downstream cells in only a few instances Dur-COVID, which caused the mean rank to increase. However, for the same cells Bef-COVID, the waiting passenger ratios during the total data collection period were spread more evenly over a lesser range than Dur-COVID. In other cells at the upstream half of the platform, the spread of waiting passenger ratios Bef-COVID and Dur-COVID varied significantly, resulting in the rejection of the null hypothesis. As this test compared the location of the two data sets only, the KS test was subsequently performed to identify whether the shape and scale of the distributions were the same.
For the KS test, the null hypothesis states there is no significant difference between the two distributions of waiting passengers Bef-COVID and Dur-COVID. The test was also performed with a 95% confidence interval (0.05 significance level). Table 3 presents the KS test results.
Kolmogorov–Smirnov Test Results: Waiting Passenger Distribution Bef-COVID versus Dur-COVID
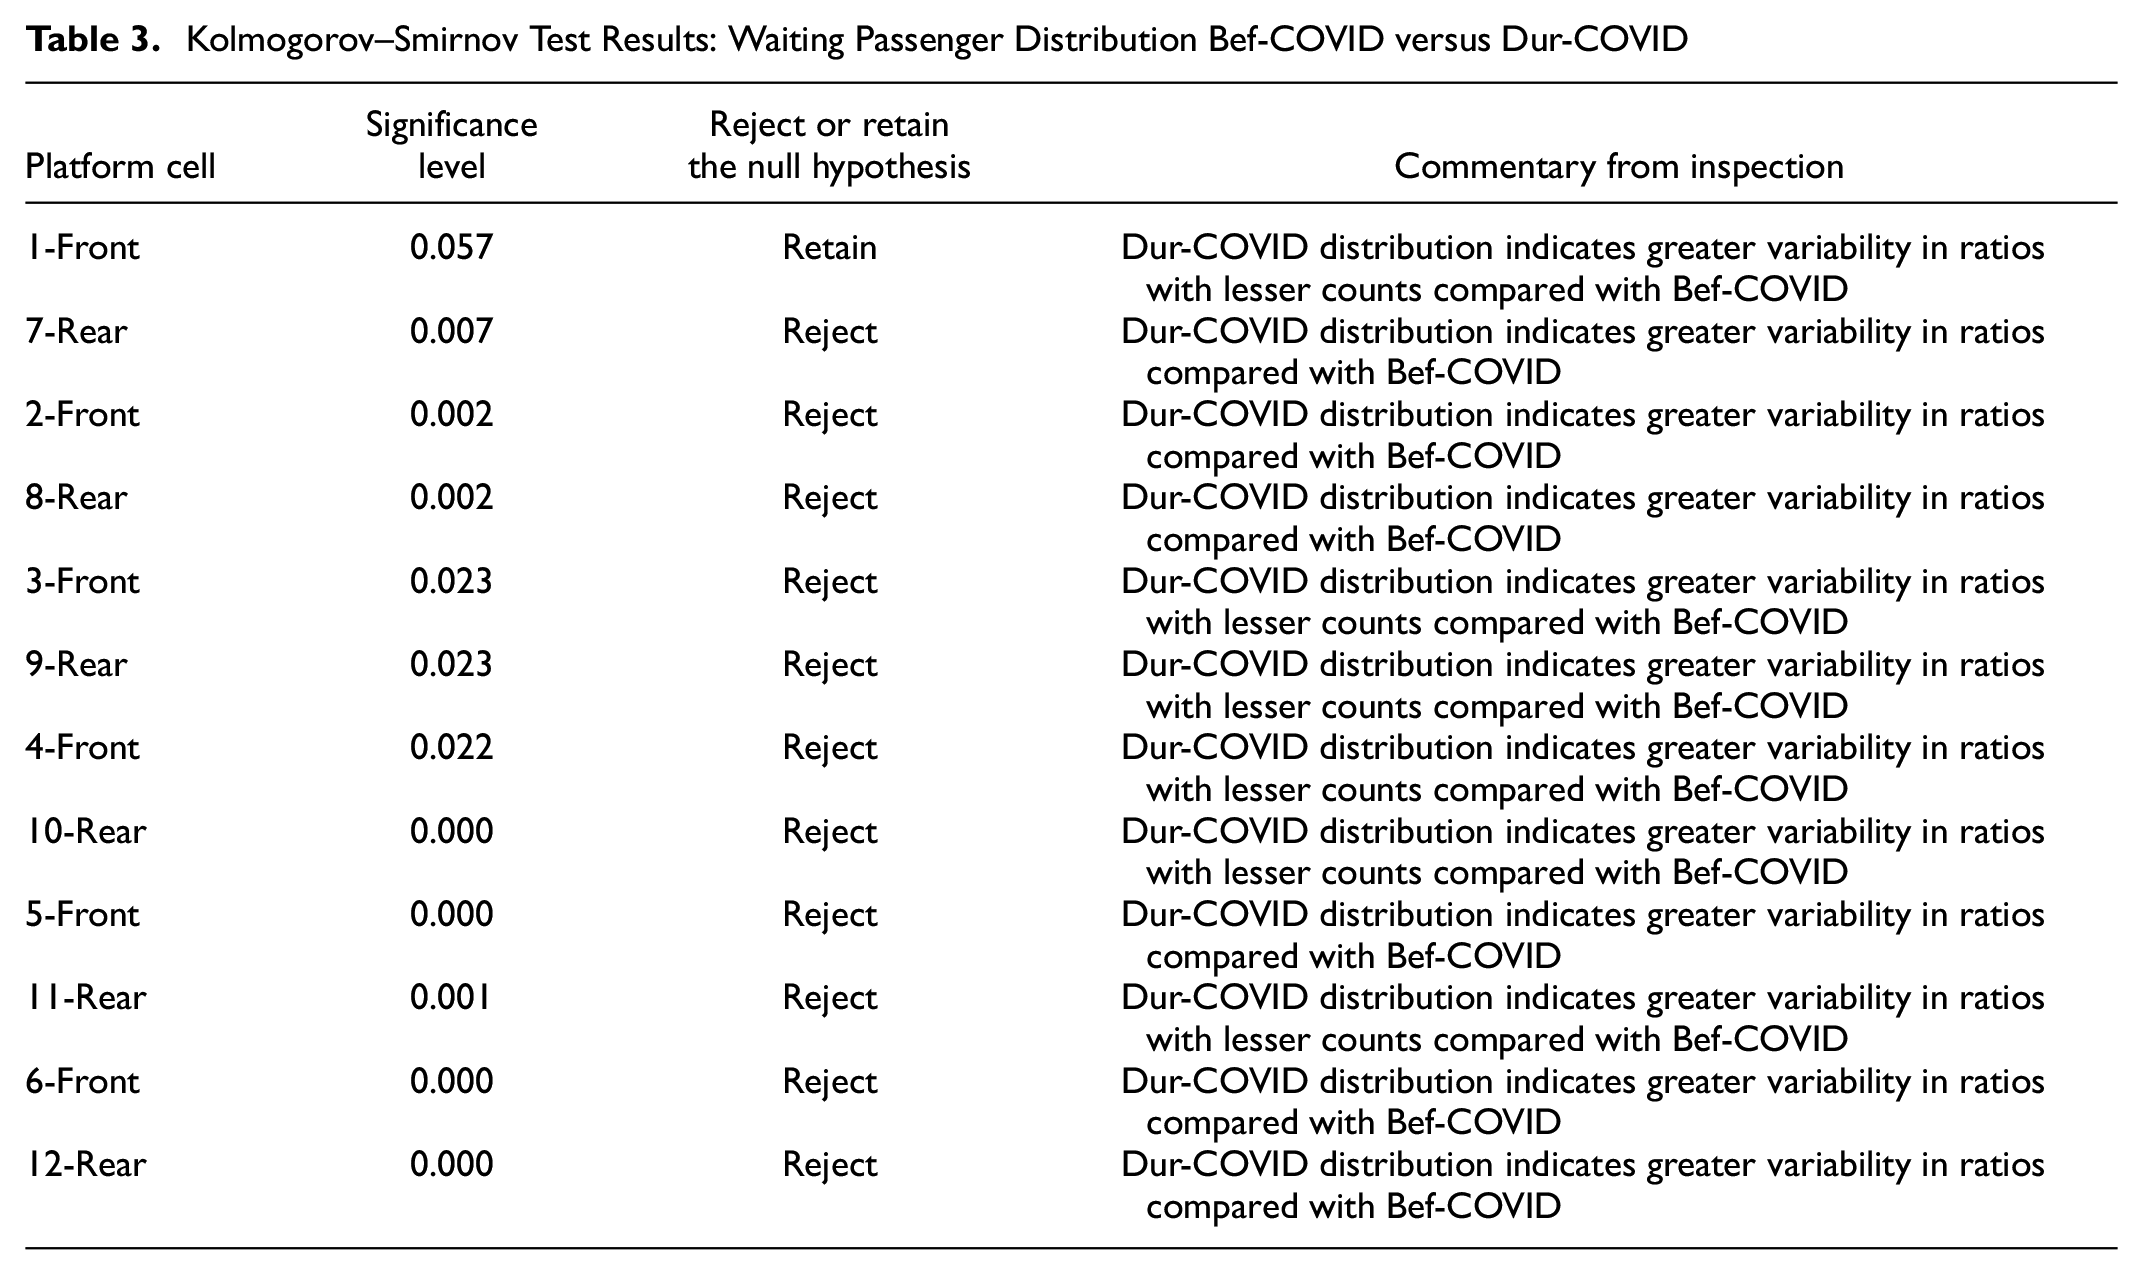
From the KS test results, the null hypothesis was rejected in all cells except in Cell 1-Front, although the test statistic of Cell 1-Front was also very close to the significance level. As the KS test result rejected the the null hypothesis, we concluded that the two distributions of waiting passengers Bef-COVID and Dur-COVID were significantly different across all other cells. This indicated that the shape and scale of the waiting passenger distribution across the platform varied between the two cases. As a result of these findings, we inspected the two distributions for each cell. The final column in Table 3 provides commentary, which indicates that across all cells there was greater temporal variability Dur-COVID than Bef-COVID.
For both the Bef-COVID and Dur-COVID cases separately, the waiting passenger ratios for each cell every 5-min were then averaged across the total data collection period of 2 days together. This yielded average waiting passenger ratios in each cell as indicated in Matrices 1 and 2 below for Bef-COVID and Dur-COVID cases respectively. These ratios are presented as 2 × 6 matrices, where each matrix position reflects the corresponding physical cell position on the platform.


where
As the ratios in the above two matrices indicated a normalized condition, values in the respective cells could be compared directly. For ease of comparison, values in the two matrices were plotted as shown in Figure 6.
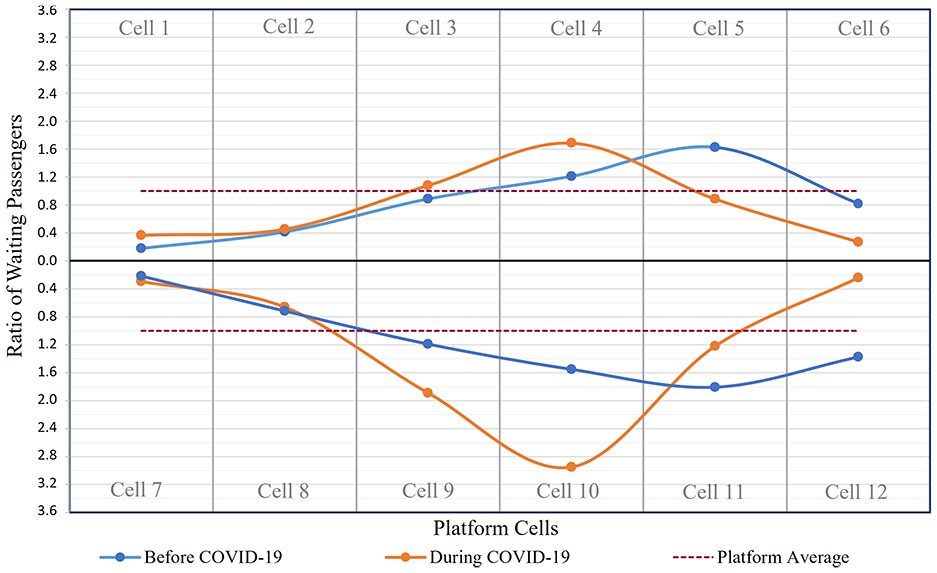
Ratio of waiting passengers in cells to whole platform Bef-COVID versus Dur-COVID, at the study BRT station platform during the evening peak period.
From Figure 6, it is clear that in the Bef-COVID case, more waiting passengers were toward the upstream end of the platform (close to Cells 5-Front and 11-Rear), with a slight reduction in the counts at Cells 6-Front and 12-Rear. Dur-COVID, the waiting passenger distribution changed, with more passengers waiting close to the platform center.
When we compare the two curves in Figure 6 with waiting passenger ratios in cells for the whole platform, the cells close to the downstream end show similar ratios in both cases. When considering the average ratios in the cells close to the platform center, the Dur-COVID case has relatively higher ratios than Bef-COVID. However, the ratios of both cases are greater than or very close to their average. Although the Dur-COVID case indicated high ratios at the center, the number of waiting passengers was very low compared with Bef-COVID. The low platform average Dur-COVID resulted in a small increase in waiting passenger counts in cells which yielded high ratios. As a consequence, the highest Dur-COVID ratio across the platform was 2.9, whereas the Bef-COVID case was 1.8. When considering the waiting passenger ratios, Dur-COVID at the upstream cells decreased compared with Bef-COVID. It was postulated that this decrease was the result of those cells being close to the two primary platform entrances.
Bef-COVID, the waiting passenger ratios across the platform were greater than average between the center of the platform and the upstream end. However, Dur-COVID waiting passenger ratios were greater than average at the center only. This highlighted the difference in waiting passenger distributions across the platform between the two cases.
If we compare the results of the MW test with the ratios charted in Figure 6, the variation identified between Bef-COVID and Dur-COVID in each cell was similar, except for two cells (7-Rear and 9-Rear). For the platform cells at the downstream half of the platform, the MW tests confirmed the null hypothesis stated above, leading us to conclude that the two distributions were similar. This similarity can also be observed in Figure 6. Whereas, platform cells at the upstream end of the platform resulted in a significant difference between Bef-COVID and Dur-COVID according to the MW test statistics.
When considering the tests performed in this analysis, the KS test was more powerful as it compared the shape and scale of the two distributions, whereas the MW test evaluated the location by assuming the two distributions followed the same shape.
Discussion
From the initial analysis of waiting passenger counts Bef-COVID and Dur-COVID, waiting passenger variation across the platform was identified for the two cases separately. Bef-COVID, more passengers selected platform cells close to the two primary entrances at the upstream end of the platform. However, Dur-COVID, passengers selected the central platform cells as their preferred waiting location. It was postulated that this difference was because Dur-COVID, passengers tried to avoid waiting locations that were close to the platform entrances so that they could minimize any interaction with other passengers entering/exiting the platform. It was surmised that the increased efficiency of the downstream LAs Dur-COVID also contributed to this shift in the waiting passenger count from the upstream end to the center of the platform. We attributed this increase in downstream LA efficiency to a substantial decrease in dwell times at the station owing to the reduction in number of passengers boarding and alighting.
In addition to the physical distancing measures, Dur-COVID, the bus boarding door also changed, from the front to the rear door. However, it was not feasible to separately identify the effects of physical distancing and changes in the boarding door on waiting passenger distribution. Nonetheless, it was evident that the low waiting passenger count close to the platform entrances/exits Dur-COVID occurred as a direct result of physical distancing measures, as there was no association between boarding locations and platform entrance/exit locations.
When Bef-COVID and Dur-COVID cases were normalized to compare average waiting passenger variation across the platform, the Bef-COVID case resulted in cell-wise waiting passengers being greater than the platform average mainly in the cells in the upstream half of the platform. However, Dur-COVID, cell-wise waiting passengers were greater than average in cells at the platform center. When comparing the average waiting passenger ratios for all platform cells in both cases, the highest ratio resulted Dur-COVID. This was postulated to be because of the low average number of waiting passengers across the platform, resulting in higher ratios even from small variations in waiting passenger counts in the cells.
Statistical analysis was performed using MW and KS tests, and ratios of waiting passenger counts in each cell to the average waiting passenger counts across all 12 cells, at 5-min intervals over the 180 min data collection period of 2 days. The MW test revealed that the waiting passenger distribution between Bef-COVID and Dur-COVID was similar downstream and significantly different at the upstream half of the platform. A similar variation (except at two cell locations) was observed by averaging the waiting passenger ratios in each cell across the total data collection period. The MW test considered the mean ranks of the two distributions and evaluated the locations of the ratios between the two cases, assuming they had the same shape. To evaluate the shape and scale of the two distributions, the KS test was performed.
The KS test revealed that the waiting passenger distribution across the platform differed significantly between Bef-COVID and Dur-COVID cases and indicated that across all cells there was greater temporal variability Dur-COVID. However, when considering the average of the ratios in each cell over the total data collection period (as plotted in Figure 6) and the MW test results, their results indicated that the cells close to the downstream end of the platform had similar distributions under Bef-COVID and Dur-COVID conditions. This result was attributed to the fluctuation in waiting passenger counts in these cells between successive 5-min intervals.
These results also supported the variations observed and discussed previously. It was evident that the waiting passenger distribution changed from the Bef-COVID to the Dur-COVID conditions. These findings could be used by transit authorities to introduce platform treatments including signage (one-way flow, floor decals), guidance, and public address to direct passengers to appropriate locations. These treatments could be used to guide waiting passengers away from platform locations with a high probability of passenger crowding (close to entrances/exits, boarding/alighting locations, etc.) and attract passengers to less crowded locations. Reducing congestion at specific locations of the platform would improve quality of service. Dia indicated how the risk of spreading the infection could increase if platform crowding Dur-COVID did not change from the Bef-COVID condition ( 10 ). Therefore, this study could be useful in identifying passenger distribution across platforms and implementing measures to reduce platform crowding. Whereas this study was carried during the evening peak period, a similar waiting passenger count could potentially be observed during the morning peak, and a lower waiting passenger count during off-peak periods. Although the scale would differ between periods, we postulate that the pattern of waiting passenger distribution across the platform Dur-COVID would be similar throughout the day, therefore, introducing the abovementioned platform treatments would be appropriate.
Conclusions and Further Research
Evaluation of waiting passenger distribution on BRT station platforms is crucial. Several factors have been identified in literature that affect waiting location selection by passengers. These factors are mostly related to platform configuration and operation; the effect of a pandemic on waiting passenger distribution has not been well-addressed.
With COVID-19, use of public transport has reduced across the world ( 9 ). With that, passenger behavior and decisions about public transport usage have changed. This research was therefore conducted to identify differences in waiting passenger distributions on a BRT station platform before and after COVID.
For the analysis, real data were collected Bef-COVID and Dur-COVID at the selected BRT station platform. The total number of waiting passengers across the platform at any given time significantly reduced by around 78% Dur-COVID. Restrictions imposed by the State of Queensland and passenger awareness of the pandemic most certainly instigated this reduction.
The waiting passenger distribution across the platform Dur-COVID was different from Bef-COVID. It was postulated that this difference was from the social distancing measures and guidelines imposed by the transit authority. As passengers attempted to maintain social distancing from each other, an even distribution of waiting passengers along the platform space was anticipated Dur-COVID. However, when the ratios of waiting passengers in each cell were considered in relation to the platform average, an increase in waiting passenger counts was evident in the center rather than the two platform ends. It was suggested that the floor decals and posters displayed at the busway station by the transit authority may have increased passenger awareness of COVID-19 resulting in passengers waiting at locations away from the entrance/exits, which were at both ends of the platform. Although numerous buses stopped at the downstream LAs, passengers were not concentrated around those locations. With the low level of passenger crowding on the platform, passengers could walk easily across the platform, which may have resulted in the spreading of passengers throughout the platform space. Furthermore, with the introduction of boarding and alighting only through the rear door (Dur-COVID), dwell time may have increased, resulting in bus queuing at the station, had the number of boarding and alighting passengers not changed from Bef-COVID levels. However, owing to the reduction in the number of passengers boarding and alighting Dur-COVID, and with the policy of accepting only prepaid tickets, dwell time reduced, which resulted in less bus queuing. From the statistical testing, greater temporal variability Dur-COVID was found across all cells.
This study has highlighted how the waiting passenger distribution on the BRT station platform changed Dur-COVID. Ongoing monitoring of variations along with the changes in platform operation are essential to maintain both service quality and public health. Although this case study was carried out at one specific station, we postulate that similar variations in waiting passenger distribution (i.e., low passenger count and waiting away from entrance/exit locations) would be observable at BRT stations with different layouts.
The forthcoming stages of this research will develop a modeling methodology to identify the factors affecting waiting location selection by passengers before and during COVID-19, which will then evaluate the passenger-specific area on BRT station platforms ( 17 ).
Footnotes
Acknowledgements
The authors acknowledge the TransLink division of the Department of Transport and Main Roads, Queensland, Australia for granting permission to access busway stations for manual data collection and observation of platform operation. The assistance given by Ashish Bhaskar and Marc Miska of Queensland University of Technology is kindly appreciated.
Author Contributions
The authors confirm contribution to the paper as follows: study conception and design: S. Jayatilake, J. M. Bunker; data collection: S. Jayatilake, J. M. Bunker; analysis and interpretation of results: S. Jayatilake, J. M. Bunker; draft manuscript preparation: S. Jayatilake, J. M. Bunker. All authors reviewed the results and approved the final version of the manuscript.
Declaration of Conflicting Interests
The authors declared no potential conflicts of interest with respect to the research, authorship, and/or publication of this article.
Funding
The authors disclosed receipt of the following financial support for the research, authorship, and/or publication of this article: Sewmini Jayatilake has a Postgraduate Research Award scholarship from the Queensland University of Technology, Australia.
Compliance with Ethical Standards
Ethics approval for the research has been granted by the Human Research Ethics Committee of the Queensland University of Technology, Australia. During this stage of the study, data were collected through manual observation of operation of the study platform, therefore, informed consent was not required.
Availability of Data and Material
The authors declare that data can be made available on request.
