



Abstract
With the mass introduction of shared, dockless electric scooter (e-scooter) programs, many cities are struggling to understand injury implications. This article systematically documents what is known about e-scooter injuries using emergency department (ED) studies; it also provides recommendations to better understand the health and safety risks of this emerging mode. A systematic review was performed for all e-scooter articles through November 2019, retaining injury-related articles. In the case where surveillance data and exposure data were available, injury rates were explored. A total of 18 articles were identified, including: five that used surveillance data methods; seven examining all e-scooter injuries from one to three hospitals; and six examining a medically specific subset of those injured. Variations in the reporting structure of data make pooling difficult, but some trends are emerging. Three surveillance studies report an injury rate of 20–25 ED visits per 100,000 trips. Those injured rarely wear helmets, resulting in a high proportion of head injuries. Extremity injuries, including fractures, are also widespread. The profile of the injured appears to be a 30-year-old male. However, once normalized by exposure data, female, young, and older riders may be at higher risk of injury. Comparisons with other modes remain unclear; this is as much a challenge of the exposure data for the other modes as information on e-scooters. Assumptions about comparisons with bicyclists should be more thoroughly examined. Data harmonization and collaboration between vendors, municipalities, and public health departments would improve the quality of data and resulting knowledge about e-scooter safety risk.
In an era of ever-changing transportation landscapes, shared electric scooter (e-scooter) programs fill a gap in micro-mobility—short-distance, affordable transportation options. Since their introduction in the U.S. in September 2017, third-party vendors have been marketing e-scooters as a fun, convenient way to travel shorter distances. This resulted in nearly 39 million scooter trips in 2018 in the U.S.—a figure that quickly surpassed station-based bike-share trips and continues to grow ( 1 ). Policymakers often see e-scooters as a lower-carbon alternative to short-distance vehicle travel that could decrease congestion; as a concerning competitor to active travel modes (non-motorized biking or walking); and as a competitor or complement to publicly funded transit. The introduction of e-scooters will sometimes trigger community concerns about safety, augmented by local media and early emergency room physicians’ reports that serious e-scooter injuries appear with the seemingly overnight introduction of e-scooters (2–5). Public discourse stresses illicit e-scooter use on sidewalks, lack of helmet use, unsafe misuse of equipment, and nuisance (and unsafe for disabled) parking in the pedestrian right-of-way.
Because of the compressed timeline of the introduction of e-scooters, evidence of potential risks associated with the mode is difficult to find; municipalities and healthcare systems are left guessing what safety impacts will be. This article looks at studies using retrospective emergency department (ED) analyses to better understand injury trends when e-scooters are quickly introduced at a municipal level. The purpose of this article is to systematically document what is known about e-scooter injuries and to provide data and research recommendations to better understand the health and safety risks of this emerging mode.
Methods
As an emerging technology and as a non-dominant transportation mode, tracking e-scooter crashes and injuries is difficult. ED data is often the most complete set of injury data for non-vehicular crashes in most countries; that was expected to be the case for e-scooters as well. A crash that does not include a vehicle or very serious injury is less likely to result in a police report; this has been documented repeatedly by comparing police reports with records of users seeking medical help via an ED (6, 7). Non-motorized injuries that are less serious never make it into either policy or hospital databases. For example, a cyclist-motorist crash with no damage to the vehicle and no need to seek immediate care, but then care is sought several days later from a primary care physician, is unlikely to appear in any data source.
The emerging nature of e-scooters also creates some unique challenges in analyzing ED data because an International Statistical Classification of Disease (ICD) diagnostic/billing code for e-scooters is under development but not expected to be finalized before late 2020. At this time, analysis of the text of ED electronic medical records—usually of the intake and discharge fields—is the primary way of tracking e-scooter injuries. While retrospective “natural language” analysis of ED records is less than ideal, it may be the best option to provide some sense of moderate-to-serious e-scooter injuries during a quick rollout of a shared e-scooter program within a city.
On November 18, 2019, the authors systematically searched PubMed, TRID, Web of Science, and ScienceDirect for English language using general topic key words of (escooter OR e-scooter OR “electronic scooter”). This identified 328 entries, 74 of which were duplicates, with 317 indexed between January 1, 2000 and November 18, 2019. Using Rayyan, both authors screened all abstracts for those reporting on injuries associated with e-scooters and retained 17 articles for inclusion ( 8 ). During initial screening, exclusions occurred primarily because the article had no injury focus, instead reporting on battery technology, or—in a smaller number of cases—policy or road design. After reading the full text, two commentaries were removed: one was replaced with a referenced report, and three public health department reports known to the authors were added.
In the end, 18 articles were analyzed for study design, relation to e-scooter introduction, demographics of injured, description of injuries and/or severity, and description of the crash context (2–5, 9–22). The authors chose not to pool data because of large inconsistencies in variable definitions and descriptions amongst the articles. Some major, over-riding sources of bias should be considered when reviewing results. For example, no restrictions were made to the publication time period—nor was it restricted only to ED visit data—at the outset; yet all 18 articles were published in 2019 and universally drew on retrospective review of ED records. Except for two from Singapore, articles describe injuries during shorter (3–12 months) e-scooter municipality-led “pilot periods”—natural experiments where municipalities regulate how e-scooters will be introduced by third-party vendors—occurring in 2017 to 2019 (12, 15). Relying on these short, municipality-managed pilot periods when e-scooters are new and regulations are fluid introduces potential bias. While the focus of this paper is on existing published studies, exploring the role of both vendor and rider requirements is also a valuable area of future research. Some limitations and opportunities are explored in the Conclusions and Future Directions section.
Results
Studies are separated into two categories: 1) regional surveillance studies—which provide a sense of the universe of injuries for a given pilot study and regions; and 2) sampled hospital studies, usually regional trauma centers. The latter includes studies that (a) examine all injuries seen at an ED and (b) medical specialty-specific studies such as radiology referrals within an ED setting.
Regional Surveillance Studies
Four cities have published summaries of surveillance data (Table 1) representing 624 injuries resulting in an ED visit over a collective 23 months of pilot periods: Alexandria, Virginia (U.S.); Auckland (New Zealand); Austin, Texas (U.S.); and Portland, Oregon (U.S.) (9–11, 21). Surveillance studies uniquely capture all injuries within the region regardless of the hospital where treatment occurred. Since exposure—the number, miles, or duration of rides—is primarily tracked at the regional level via e-scooter vendors, surveillance studies also offer the ability to calculate injury rates. Three cities calculated an injury rate using vendor-provided exposure data: 20–25 ED injuries per 100,000 trips (9–11). Portland also reported a per mile rate (22/100,000).
Regional Surveillance Studies of Emergency Departments (EDs) during E-Scooter Pilot 1

Note: CI = Confidence Interval; ED = emergency department; US-SSS = U.S. Syndromic Surveillance System.
Singapore used a surveillance approach but was focused on the comparison between motorized and non-motorized personal mobility devices and was representative of a more mature emerging mobility system ( 12 ).
The reported injury rate is calculated from the adjusted number of injuries, assuming approximately one injury per week is on a personally owned vehicle.
In the surveillance studies, those injured are more likely to be male (55%–60%) with an average or median age of around 30 (9–11, 21). The form of description of injuries (site and/or region of the body, general severity) varies widely in these and the other studies discussed here, making comparisons difficult. However, injuries to the head and face are common (30%–48%), often taking the form of concussion or traumatic brain injury (5%–15%) with some facial fractures (3%). Injuries to the extremities are also widespread, including fractures and dislocations (30%–32%).
Non-surveillance ED Studies
A total of 14 studies were identified that reported on ED presentations from a subset of one to three hospitals within a region. These studies are not surveillance because they do not represent all ED cases within a region. Many of these hospitals included in these studies are designated as regional “trauma centers;” thus the cases from these studies might be more severe than seen overall in the region even as they understate the full burden. Importantly, calculating the rate of injury per trip or mile is not possible since exposure is typically tracked at the regional level, and it is unclear what proportion of the region the studies are capturing.
Non-Surveillance ED Studies that Report All ED Injuries
Eight studies reported characteristics of any e-scooter injury (Table 2), describing 892 injured individuals seeking care at an ED in eight cities after an e-scooter crash (3–5, 13–16, 22). Those injured are more likely to be male with a median or mean age of early 30s. It is not uncommon for 40%–60% of those seeking care at a trauma ED to have a head or face injury with alarming rates of concussions (11%), facial and skull fractures (3%–26%), and intracranial hemorrhage (2%–7%) (4, 5, 14). Some of these ranges vary considerably; it was unclear to the authors if this is a result of variation in definitions, smaller study samples, or actual variation. Injuries to the extremities are also common, with a fracture and dislocation rate of 24%–39% (14, 16). One death was reported ( 22 ).
Summary of All E-Scooter Injuries in Emergency Departments (EDs) at Regional Trauma Centers

Note: ED = emergency department; ICH = intracranial hemorrhage; NA = Not Applicable.
Emphasis of paper is craniofacial cases, but summary statistics for all ED cases are included.
More in-depth subset of Bekhit et al.; use caution to not double count cases ( 9 ).
Subset of Tan et al.; use caution to not double count cases ( 12 ).
Non-surveillance ED Studies that Report on Subsets of ED Injuries
Six studies provide an in-depth discussion of subsets of patients based on medical need. Trivedi et al. describe craniofacial cases in Dallas ( 4 ). San Francisco’s study describes ten trauma protocol activation cases ( 17 ). Campbell et al. analyze orthopaedic cases in Auckland ( 18 ). Mayhew et al. examine radiology referrals in Auckland during the same time period covered by the surveillance study (2, 9). Schlaff et al. report on potential neurosurgical cases in Washington, DC ( 19 ). Sikka et al. carried out an in-depth case study of a 60-year-old female pedestrian with an acute lumbar compression—a reminder that e-scooter collisions with pedestrians can severely affect non-riders ( 20 ).
Injury Severity and Costs
Combining all studies, a fuller picture of the burden of e-scooter injuries emerges in terms of care, utilization, and severity measures. Between 13% and 44% arrive by ambulance (3, 11). Trauma protocols were activated in 6% of cases in Salt Lake City and 8% of LA cases (13, 16). In the U.S., hospital admission rates ranged from 6% in LA to 26% in Waco (16, 22). Imaging is needed for upward of 80% of cases (14, 16). Surgery, particularly for repairing fractures, is common: 11% in Dallas to 33% in San Diego (4, 5).
Several studies, typically outside the U.S., provide monetary burden associated with the injuries. In Brisbane, Australia, patient costs were estimated at AU$542 (US$373) per visit, ranging from AU$285 to AU$1345, not including inpatient or operations costs ( 3 ). In Auckland, New Zealand, one study estimates an average of NZ$791 (US$522) per presentation, including combined costs of community, private, and hospital publicly provided care ( 9 ). During an overlapping period, Campbell estimated costs for those requiring orthopaedic surgical repair at NZ$19,282 per person (US$12,740)—including hospital, staffing, implants, follow-up appointments, and opportunity costs for lost income ( 18 ). To the best of the authors’ knowledge, the only U.S.-based cost estimate is from Waco, Texas, which reports approximately US$15K per ED visit ( 22 ). It is important to note that the out-of-pocket and hospital costs of health care expenses—and the underlying structure and tracking of costs associated with each unique healthcare system—vary widely across countries, even while adjusting to USD. This limited information was summarized to provide some initial idea for those interested in estimating the economic costs of these injuries on individuals and/or the health care systems. Caution should be used in applying these estimates in other contexts, particularly outside the country from which the cost was estimated.
Crash Context and Injury Risk Factors
Description of the context of the crashes should be approached with caution from these studies because medical intake and subsequent records are not set up—much less standardized—for this type of information. The Austin study is the most reliable, as the U.S. Center for Disease Control and Prevention augmented the record reviews with subject interviews and thus could ask clarifying questions about the context ( 10 ). After removing the Singapore studies because of drastically different contexts, Table 3 reports on the range of percentage of injuries reporting specific contexts or risk factors in the studies not restricted to trauma protocol cases and using Austin as a benchmark (12, 15, 17).
Summary of Studied Crash Context Factors

Note: NA = Not applicable.
Singapore is excluded from the range because of different contexts; San Francisco is excluded from the range as its study only included injuries resulting from those requiring trauma protocol (15, 17). Both are listed as studies.
Brisbane, Australia, has been excluded because it is the only place that legally requires helmets (3).
In Austin, 73% of injuries occurred with a single e-scooter rider and no other person or mode—a relatively low figure compared with 83% in Portland and 92% in Auckland (10, 11, 14). This variation reflects ED intake norms; Austin’s follow-up interview data collection supported more nuanced categorization. Collisions with vehicles range from 3% to 14%; Austin reported 10% car collision rates with another 6% reporting they crashed while swerving to avoid a vehicle ( 10 ). San Francisco’s focus on trauma-activated patients documented 44% e-scooter–car crashes, confirming collisions with the greater mass and greater speed differential of a vehicle are correlated with more severe injuries ( 17 ). Running into a stationary object such as a curb or pole occurs 11% to 17% of the time (10, 15, 16, 17). Auckland is an exception, reporting less than 2% involving a stationary object ( 14 ). Conflicts between e-scooters and pedestrians resulting in a pedestrian seeking ED treatment are relatively rare: less than 2% in Austin, New Zealand, and Brisbane; 6% in Portland; and 8% in LA (9–11, 14, 16).
Collection of risk factors contributing to the crash is far more variable across the existing studies. For example, only Austin (33%) and Salt Lake City (44%) reported on sidewalk riding rates contributing to the crash (10, 13). Three studies explicitly discussed e-scooter malfunctioning, with the highest rate in Austin (19%) ( 10 ). Austin reported half of all those injured felt poor surface conditions contributed to the crash ( 10 ).
Only Austin was able to ask respondents about speed contributing to the crash: 37% said it did ( 10 ). A Singapore study that compares motorized versus non-motorized bicycles and scooters provides additional insight: motorization statistically increases odds of severe (Injury Severity Score, or ISS ≥ 9) injury (Odds Ratio, or = 5.08) and hospitalization (OR = 2.16) ( 12 ). While ED intake is attuned to helmet use from bicycle and motorcycle crashes, many authors commented on a lack of consistent recording of helmet status. Helmet use is uniformly quite low—less than 6% of those injured wear one (2, 4, 5, 10, 11, 13, 15, 16, 21, 22). Brisbane, Australia, is the notable exception with a 44% compliance rate and a statistically significant difference in head injuries for those who wear a helmet ( 3 ). ED intake is also on alert for intoxication but does not uniformly or consistently screen all patients. Documented intoxication levels ranged from 9%in Portland (5) to 48% in San Diego ( 11 ). Intoxication may be highly correlated with night riding or weekend riding, but variation in time categorization made additional comparisons difficult.
Discussion
General Injury Risks
Surveillance studies provide the best sense of injury rates: by combining with e-scooter providers’ trip information as exposure, a rate per trip can be calculated. There is remarkable consistency in the rate of ED visits from surveillance studies: 20–25 ED visits per 100,000 trips. If a trip length of 1 mi and a typical travel time of 10 min is assumed, this represents 20–25 ED visits per 100,000 mi and 20–25 ED visits per 1 million minutes of travel time (10, 23). Rates of injuries for other pseudo-active transportation modes in the U.S. are highly uncertain because of incomplete exposure data and a fractured emergency and health care reporting system ( 24 ).
Typical Profile of Injured
A partial picture is emerging of injuries requiring an ED visit. More males need ED care, but it is unclear if this is because they are more likely to ride an e-scooter and thus at higher exposure, or are riskier riders—a discussion for cyclists as well (25–27). The age of the rider varies, sometimes including individuals under 18 despite regulations, with an average somewhere in the early 30s. The vast majority of injuries leading to a trip to ED are to the head/face and extremities, including limb and face fractures, concussions, and intracranial hemorrhage. Studies do not consistently describe body region, specific site, or type of injury; nor are studies uniformly clarifying the “nesting” relationship of injury types. Injury severity is not always described, nor are consistent measurements used. The two most common, albeit blunt, indicators for severity are hospital admissions and surgical case rates. Length of stay and ambulance arrival are also popular metrics. Less than one quarter reported injury severity scores, and differences in metrics make comparisons difficult.
Typical Context of Crash Resulting in Injury
The context of crashes resulting in injury is even less clear: Austin provides the most robust description where 73% are e-scooter-only events—likely falling off scooters—and an additional 17% are hitting objects ( 10 ). A higher rate of 83% falling off was documented in Portland ( 11 ). Crashes as a result of conflicts with vehicles and pedestrians—likely resulting in more severe injuries with a higher likelihood of ED visits—are less frequently observed in these reports. Collisions with cars resulting in injuries are at most 14% ( 11 ). At most, 6% of ED cases are affected pedestrians (10, 11). (Assuming an e-scooter injury rate of 20 in 100,000 trips, this is estimated to be 2.8 vehicle encounters and 1.2 pedestrian encounters per 100,000 trips.)
There is not enough data to understand the impact of sidewalk riding on injuries for e-scooter riders or pedestrians, with only Austin and Salt Lake City reporting (10, 13). Austin suggests experience matters, with 33% of incidents occurred on the users’ first ride and another 30% in the next nine rides ( 10 ). Speed was also mentioned in 37% of cases in Austin ( 10 ). Tan et al.’s analysis of motorized versus non-motorized scooters and bikes in Singapore also suggests this is the case ( 12 ). The time of day and week is reported in highly variable formats and needs further study.
Documented helmet use of the injured is never more than 6% with the exception of Brisbane, reflective of a business model designed for convenience (2, 15). At least in the U.S., it also reflects the adoption of norms from a legal system that does not require adults to wear bicycle helmets for cycling. For example, Oregon requires helmets on e-scooters (ORS 814.534), but does not require helmet use for adult bicycle riders; only 3.4% of those injured in Portland were wearing helmets ( 11 ). Brisbane, Australia—where helmet wearing is required of riders of both bicycles and e-scooters regardless of age—demonstrates an alternative; those wearing a helmet (46%) have a statistically significant decreased risk of head injury (OR = 0.18) ( 3 ). Alcohol intoxication rates are variable across the studies (9%–48%) and could use more consistent definitions and screening (3, 11). Analysis of correlation between intoxication and time of day and week might also yield information about high-risk behaviors.
Calculating Risk by Incorporating Exposure
Evaluation of the safety of shared e-scooter programs presents a unique opportunity not generally afforded for other pseudo-active transportation modes. In a review of agency regulations for e-scooter programs, Griffee et al. estimate that approximately 60% of agencies require some minimum level of data sharing from e-scooter companies ( 28 ). This public data provides exposure estimates in terms of trips, durations, and distances. Coupled with regional injury surveillance programs generally controlled by the public health department in the U.S., shared data requirements may inform differential risks.
As an illustration, the Austin injury study was examined, which reported the proportion of studied injuries by the time of day, with trip data from their public trip-based Application Programming Interface, or API (10, 29). Because it is unclear if Austin reports the time of crash or time of ED admission/discharge, it is necessary to be cautious in the interpretation of results ( 10 ). Still, the proportion of trips taken for each time period was calculated, and more detailed injury rates by time of day were calculated for the study period (Figure 1). The nighttime injury rate is substantially higher than the overall reported injury rate of 20.3 trips per 100,000 trips (95% Confidence Interval, or CI 17.4, 23.2).
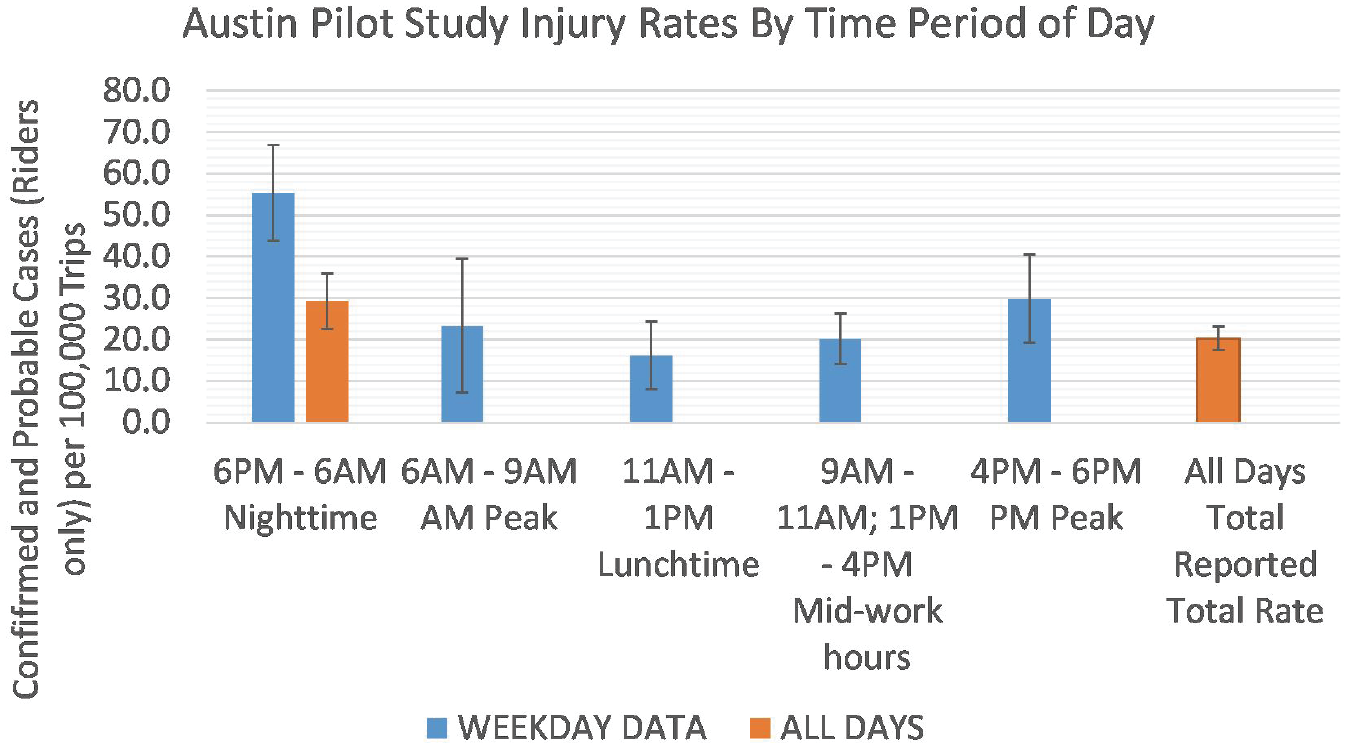
Estimated injury rates by time period (95% Confidence Interval). Source: post-processed injury rates from City of Austin ( 10 ).
Because the agency-vender data sharing agreements de-couple travel information from high-level user demographics, understanding differential risk might require informed assumptions. For example, Portland has a user survey with information about the user’s age, gender, and reported frequency of e-scooter use ( 30 ). The authors requested and were provided the de-identified data to re-analyze to examine the frequency of e-scooter use reported by gender. How frequently the “typical” male and female would have ridden e-scooters during the entire 119 days was estimated as follows: 1 trip for “I’ve only ridden once”; 8.5 trips for “Occasionally, but less than once per week”; 2 trips per week or 34 trips total for “1 to 3 per week”; 85 trips for “3 to 6 per week”; 119 trips for “Daily”; and twice per day or 238 trips total for “More than 1 per day.” Weighted average estimates suggest a “typical” male would have used e-scooters just under 30 times during the 4-month pilot program, compared with about 19 times for women. It was then estimated that women are responsible for approximately a quarter of the total trips taken during the pilot. If these approximated differential exposure rates are applied, the female injury rate is nearly double that of males—38.2 versus 20.5 per 100,000 trips. Thus, while similar proportions of the users (61.74%) and those injured and reporting to an ED (60%) were male, normalizing by exposures suggests females are more vulnerable (11, 23). Similar post-processing was carried out across the age categories in Portland. Although approximately 75% of injuries occurred with users aged 20–50, the highest injury rates might track to those younger than 19 and older than 60 years of age (Figure 2).

This approach of combining multiple data sets (injuries, exposure information, user survey data) to approximate injury rates has many limitations (11, 23, 31, 32). However, it demonstrates the benefits of minimal high-level demographic information via agency-vender data agreements and coordination of municipalities and public health agencies with surveillance data. It hints at underlying injury risk hypotheses, which could inform educational campaigns. For example, in Austin, 63% of the injured had ridden less than 10 rides ( 10 ). In Portland, approximately 70% of women ride less than “Occasionally, but less than once a week,” estimated at less than nine times over the pilot ( 32 ). Women may be disproportionately less experienced and thus more likely to experience an injury (10, 32). Cities and vendors could market differential educational programs—for example, a campaign targeting males might link riskier behaviors to injuries, while a separate campaign targeting females might encourage practicing riding in non-mixed traffic at low speeds.
Conclusions and Future Directions
This paper conducts a systematic review of injury-related e-scooter articles through November, 2019. In summary, it is found that three surveillance studies report an injury rate of 20–25 ED visits per 100,000 trips. Those injured rarely wear helmets, resulting in a high proportion of head injuries. Extremity injuries, including fractures, are also widespread. The profile of the injured appears to be a 30-year-old male. However, once normalized by exposure data, females, young, and older riders may be at higher risk of injury.
ED records highlight the types of injuries associated with the introduction of e-scooters. However, ED records ignore less severe injuries treated within a doctor’s office. Bekhit et al. in Auckland, New Zealand, provides a clue: for every crash that results in an ED visit, two more crashes result in a visit to a physician in an office setting ( 9 ). Medical record studies will never capture minor injuries and near misses that contribute to perceptions of safety or the lack thereof, which is also challenging for cyclist and pedestrian safety studies. Both qualitative and quantitative interviewing can help explore the experiences of e-scooter—as well as active—travelers in a way that may supplement both ED records and passively collected data.
These studies rely on front-line ED health professionals to record context during intake using electronic medical record “notes” fields. The level of accuracy should improve as new designated codes account for e-scooters in the 2021 ICD edition. As with active modes, medical records are not designed for built environment risk factors. Improving the consistency in documentation of helmet and intoxication status would be helpful. Risk factors such as speed, level of experience, involvement of other modes, and transportation facility being used at the time of crash, will likely require going beyond ED study designs. Furthermore, as cities continue to evolve their legal requirements and permitting guidelines, documenting these changes to public policy will be instrumental in understanding how different public policies have influenced crashes and severities of injuries within and across cities. The limitations noted in this paper exploring the role of policies and rules to injuries and crashes also point to a need for partnerships between public health agencies, private vendors, and the public departments that permit e-scooters.
In general, by developing a systematic approach for collecting information that contextualizes e-scooter crashes and injuries, it is possible to better understand the influences of interventions or public policies in preventing crashes and injuries. For example, data harmonization and collaboration between vendors, municipalities, and public health departments would improve the quality of data and resulting knowledge about e-scooter safety risk. With e-scooters, there exists a unique opportunity to better understand the exposure of individual users (e.g., miles or minutes traveled) to a greater extent than currently accessible for active travelers. However, public/private partnerships with venders are necessary to better link exposure to crashes, injuries, or even close calls. Since many agencies are updating and changing their e-scooter rider and/or vendor guidelines quite frequently, updated studies that focus on the influence of policies, strategies, and interventions on injury severity and crash rates will be key.
While the intention of this paper was to focus entirely on e-scooter safety data, comparisons with other modes remain both unclear and a relevant area of research. While this review focused explicitly on e-scooters, comparison with cycling and e-bikes are commonly made by vendors and academics (33, 34). Modal comparisons are challenged as much by lack of exposure data for the other modes (e.g., miles cycled, minutes walked) as information on e-scooters. While some agencies have placed e-scooter regulations alongside bike share guidelines, it is recommended to be cautious and to examine assumptions made when comparing e-scooters with bicyclists ( 28 ).
The findings of this paper punctuate the need for more robust, and possibly qualitative, comparison studies across and between active and pseudo-active modes, both human-powered and motor-assisted. For example, if the higher rate of single-person crashes on e-scooters far outweighs those on bikes, injury-reduction methods for e-scooter users may be better spent on training inexperienced riders even as injury-reduction efforts for cyclists focus on traffic separation. In these studies, high-value areas of research may explore strategies that focus on modal similarities (and differences) related to risk factors, interventions, or policy solutions. The authors call on researchers to verify assumptions and examine the context of crashes for all modes. Doing so will help establish a fuller understanding and support the design of appropriate policies and facilities to reduce the risk of injury for e-scooter riders.
Footnotes
Author Contributions
The authors confirm contribution to the paper as follows: study conception and design: N. Iroz-Elardo, K. Currans; data collection: N. Iroz-Elardo, K. Currans; analysis and interpretation of results: N. Iroz-Elardo, K. Currans; draft manuscript preparation: N. Iroz-Elardo, K. Currans. All authors reviewed the results and approved the final version of the manuscript.
Declaration of Conflicting Interests
The author(s) declared no potential conflicts of interest with respect to the research, authorship, and/or publication of this article.
Funding
The author(s) disclosed receipt of the following financial support for the research, authorship, and/or publication of this article: This study was funded in part by the National Institute on Transportation and Communities (NITC, grant number no. 1358), a U.S. DOT University Transportation Center.
